Vinculin recruitment to α-catenin halts the differentiation and maturation of enterocyte progenitors to maintain homeostasis of the Drosophila intestine
- Department of Physiology, Development and Neuroscience, Downing St, University of Cambridge, United Kingdom
Figures
Figure 1 with 1 supplement
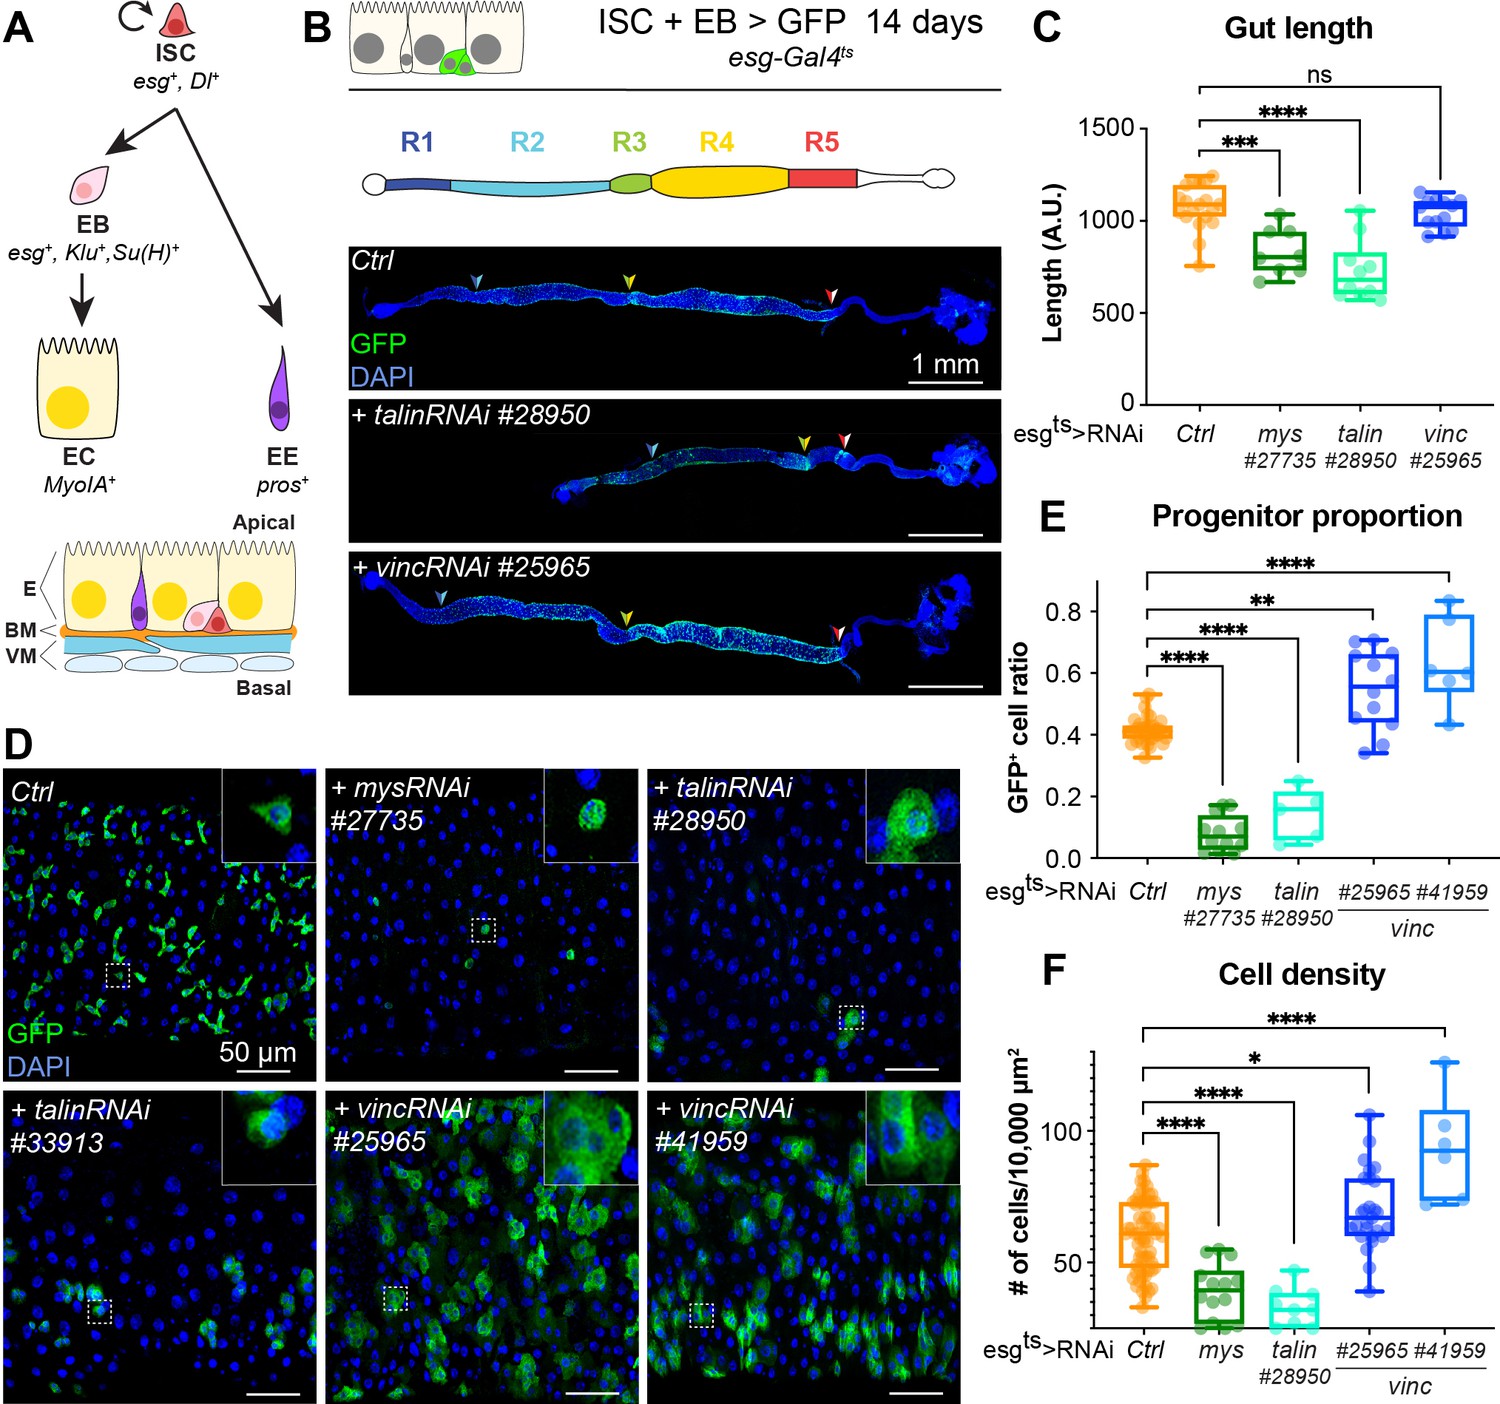
talin and vinculin knockdowns produce opposite phenotypes in the gut.
(A) Lineage of the adult midgut: intestinal stem cells (ISCs) self-renew and give rise to post-mitotic enteroblasts (EBs) which terminally differentiate into enterocytes (ECs), and enteroendocrine cells (EEs). Cell type-specific genes are shown in italics. Schematic at bottom shows overall tissue organisation. E: epithelium, BM: basement membrane, VM: visceral muscles. (B, C) Gut regions R4 and R5 are reduced by RNAi knockdown of talin but not vinculin, green fluorescent protein (GFP; green) marks cells expressing the RNAi, and nuclei are blue (DAPI, 4′,6-diamidino-2-phenylindole). Anterior is to the left in this and all subsequent figures. (D, E) Surface view of region R4/5. RNAi knockdown of integrin and talin shows reduced number of RNAi-expressing ISC/EB cells (GFP+) and their rounded morphology (insets). In contrast there are more ISC/EB cells in the absence of vinculin and they are enlarged. These changes result in an overall change in total cell density (F). Two-tailed Mann–Whitney tests were used: ns: not significant; ****p < 0.0001, ***p < 0.001, **p < 0.01, *p < 0.05.
-
Figure 1—source data 1
Raw data for Figure 1, Figure 1—figure supplement 1.
- https://cdn.elifesciences.org/articles/72836/elife-72836-fig1-data1-v1.xlsx
Figure 1—figure supplement 1
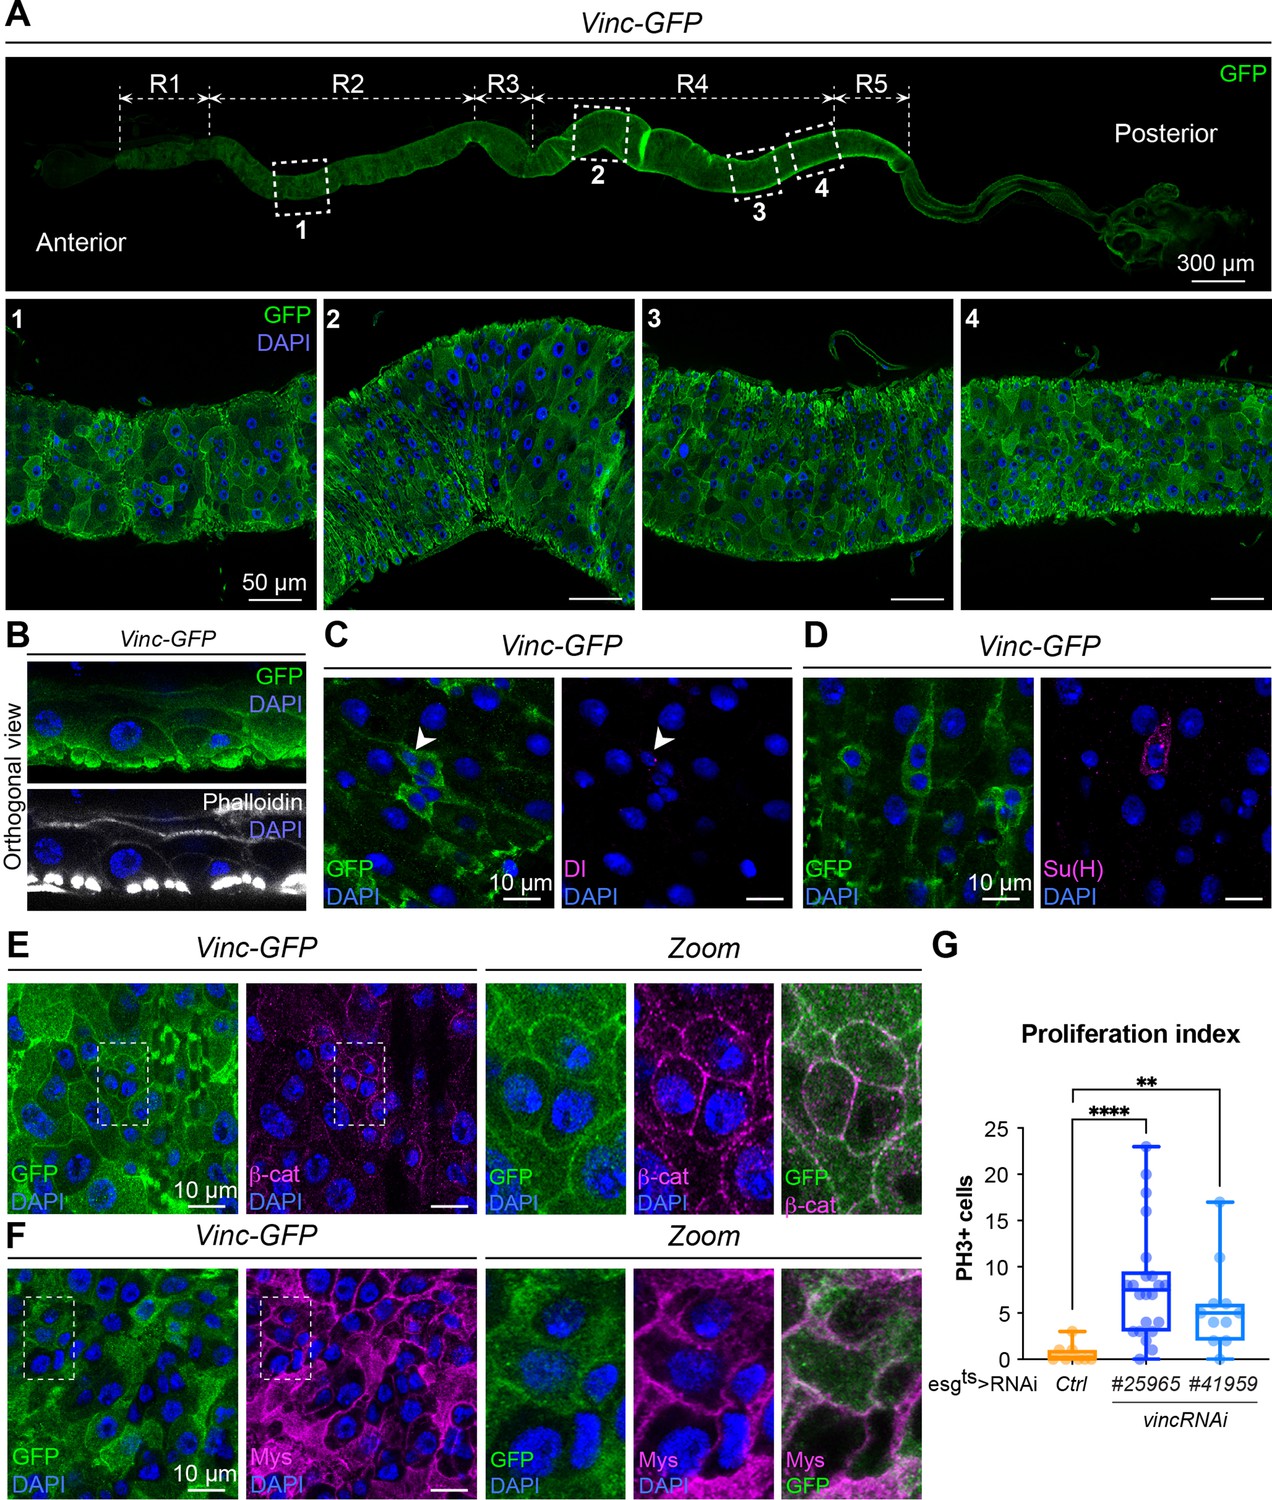
Vinculin localises to cell–cell and cell–extracellular matrix junctions and affects intestinal cell divisions.
(A) Vinculin localisation along the whole gut (top panel). Vinculin tagged with GFP (Vinc-GFP, green) is encoded by a genomic construct. Bottom panels: close-ups in regions R2 (1) and R4 (2–4) of the intestine showing vinculin localisation in the epithelium. Nuclei are marked with DAPI (blue) throughout the figure. (B) Orthogonal view of the intestinal epithelium showing vinculin (Vinc-GFP, green) in epithelial cell membranes and in visceral muscles marked with Phalloidin (bottom panel, white). (C) Vinculin is expressed in intestinal stem cells (ISCs) marked with Delta (Dl, magenta). (D) Vinculin is expressed in enteroblasts (EBs) marked by expression of Su(H) (magenta). (E) Vinculin colocalises with β-catenin (β-cat, magenta). Right panels present close-ups of individual and merged vinculin and β-catenin protein localisation from dashed line area highlighted in left panel. (F) Vinculin colocalises with integrin βPS subunit (Mys, magenta). Right panels present close-ups of individual and merged vinculin and Mys protein localisation from dashed line area highlighted in left panel. (G) Quantification of proliferative index (number of PH3+/posterior midgut) showing the increased proliferation following vincRNAi expression in ISCs + EBs. Ctrl: n = 8 guts; vincRNAi#25965: n = 22 guts; vincRNAi#41959: n = 11 guts. Two-tailed Mann-Whitney tests were used: **** p<0.0001, ** p<0.01.
Figure 2 with 2 supplements
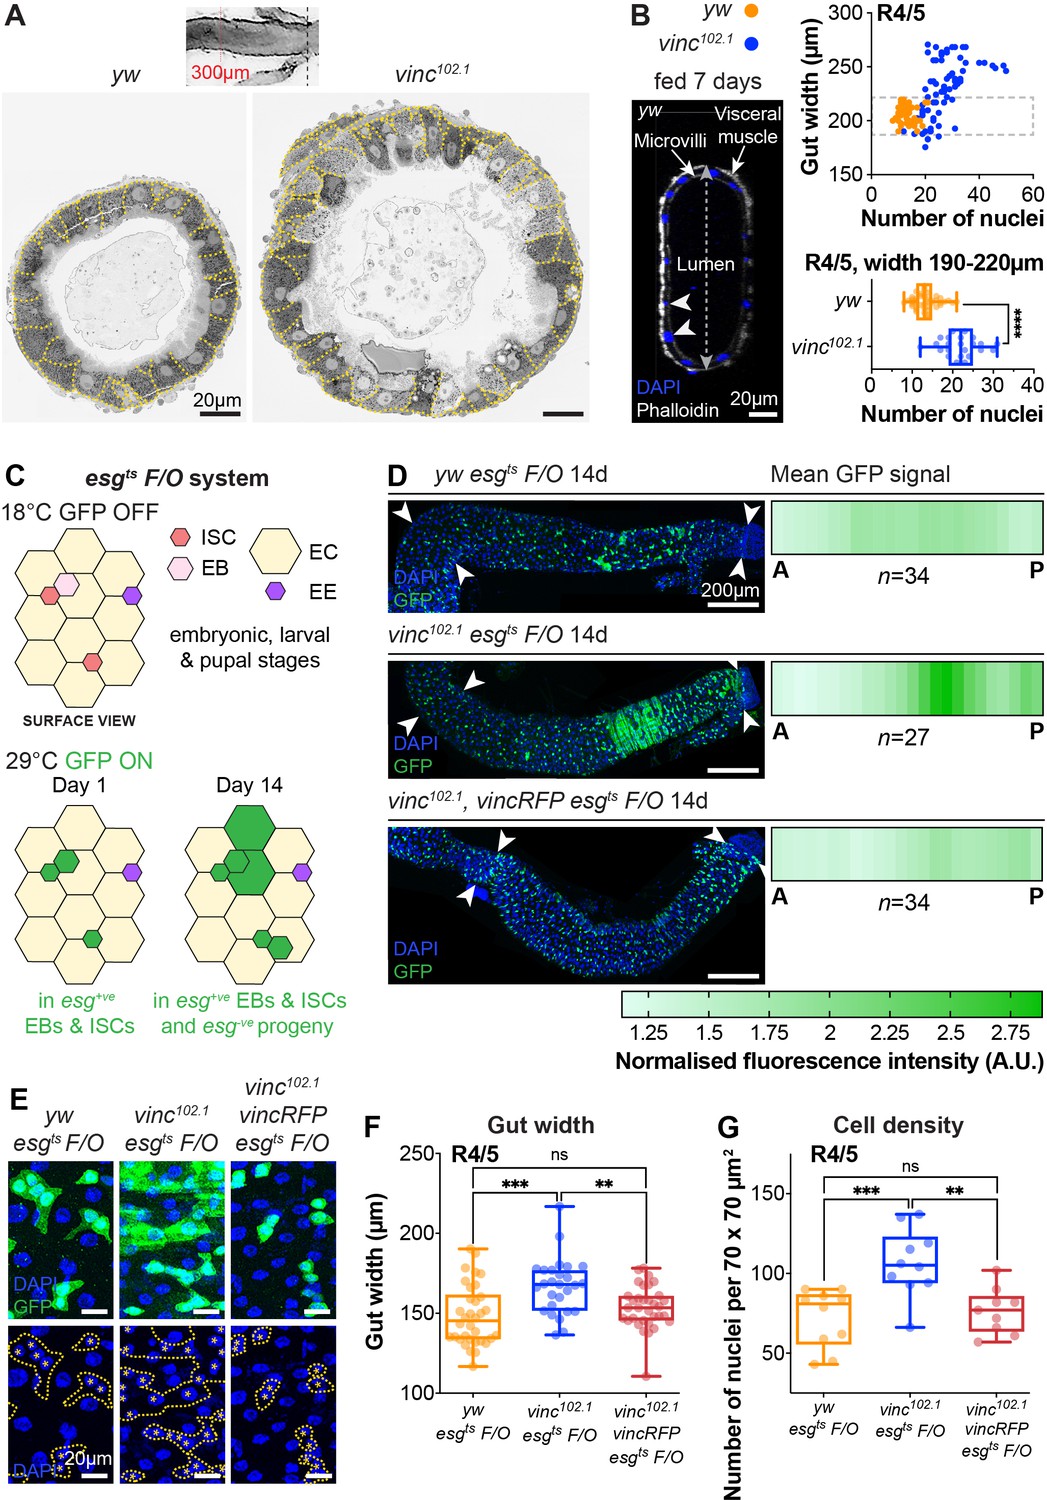
Global loss of vinculin accelerates intestinal cell production.
(A) SEM cross-sections of yw and vinc102.1 midguts. Dashed lines indicate cell boundaries. vinc102.1 guts are wider than yw guts. Inset indicates that cross-sections were taken 300 μm anterior to the Malpighian tubule attachment sites. (B) Confocal cross-sections of midguts stained with Phalloidin (white) and DAPI (blue) were analysed to extract gut width (arrow in lumen) and epithelial cell numbers (arrowheads indicate nuclei of epithelial cells). Nuclei number per gut cross-section were plotted against R4/5 midgut width. yw: n = 55 datapoints from five guts, vinc102.1: n = 77 datapoints from seven guts. vinc102.1 midguts contain more cells than yw, even when comparing guts of the same width. (subset of guts with comparable width [dashed box] replotted in bottom graph yw: n = 55 datapoints from five guts, vinc102.1: n = 34 datapoints from four guts). (C) Top view schematic of the esgts F/O system. At the permissive temperature for Gal4 expression (29°C), the intestinal stem cell (ISC)- and enteroblast (EB)-specific esg-Gal4 drives expression of both UAS-GFP and UAS-flp, which mediates permanent, heritable expression of green fluorescent protein (GFP). Thus, as ISCs divide and EBs differentiate during adulthood, all cells which arise from progenitors will express GFP. (D) Left panels: progenitors and newly produced cells (GFP+, green) 14 days after induction of Gal4 expression. A large GFP+ region is present in the R4/5 region of vinc102.1 esgts F/O guts. Arrowheads indicate the region along which heatmaps were generated. Images are z-projections through half the gut depth. Right panels: heatmaps of GFP-fluorescence intensity. Dark green corresponds to high levels of GFP fluorescence, indicating elevated tissue turnover. yw esgts F/O n = 34 guts, vinc102.1 esgts F/O n = 27 guts, vinc102.1 vincRFP esgts F/O n = 34 guts, from three replicates. (E) esgts F/O patches with GFP-DAPI overlay and DAPI only. Dashed lines indicate patch boundaries. Asterisks indicate GFP+ nuclei. Images are z-projections. (F) Quantification of gut width. yw esgts F/O n = 34 guts, vinc102.1 esgts F/O n = 27 guts, vinc102.1 vincRFP esgts F/O n = 34 guts. (G) Quantification of cell density. yw esgts F/O n = 10 guts, vinc102.1 esgts F/O n = 10 guts, vinc102.1 vincRFP esgts F/O n = 9 guts. Two-tailed Mann-Whitney tests were used: ns: not significant, **** p<0.0001, *** p<0.001, ** p<0.01.
-
Figure 2—source data 1
Raw data for Figure 2, Figure 2—figure supplement 1.
- https://cdn.elifesciences.org/articles/72836/elife-72836-fig2-data1-v1.xlsx
Figure 2—figure supplement 1
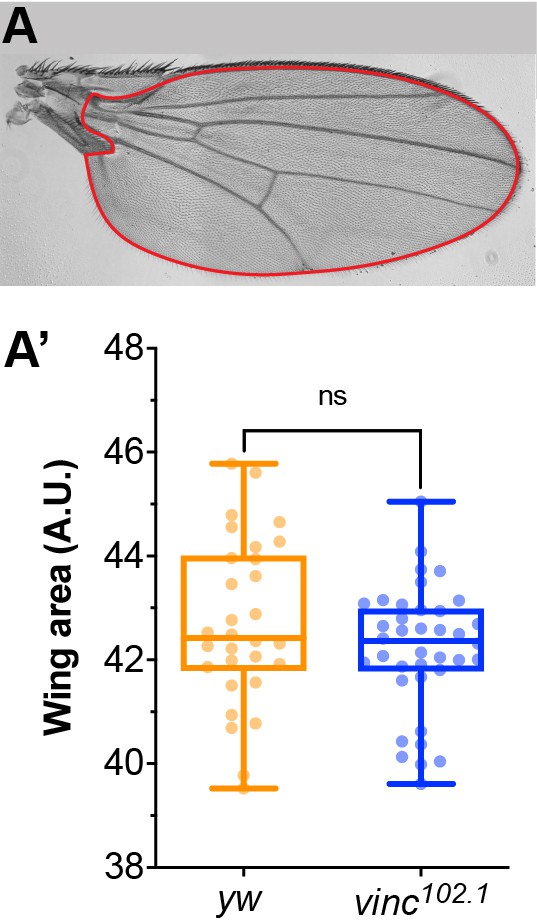
Adult wing size is not affected by loss of vinculin.
(A) Adult female wing from a yw fly shown as an example. Only the red area depicted was considered for size quantifications shown in A’. (A’) Quantification of wing area in yw and vinc102.1 female flies. yw: n = 30 wings; vinc102.1: n = 37 wings. Two-tailed Mann–Whitney test. ns: not significant.
Figure 2—figure supplement 2
Quantification of tissue turnover.
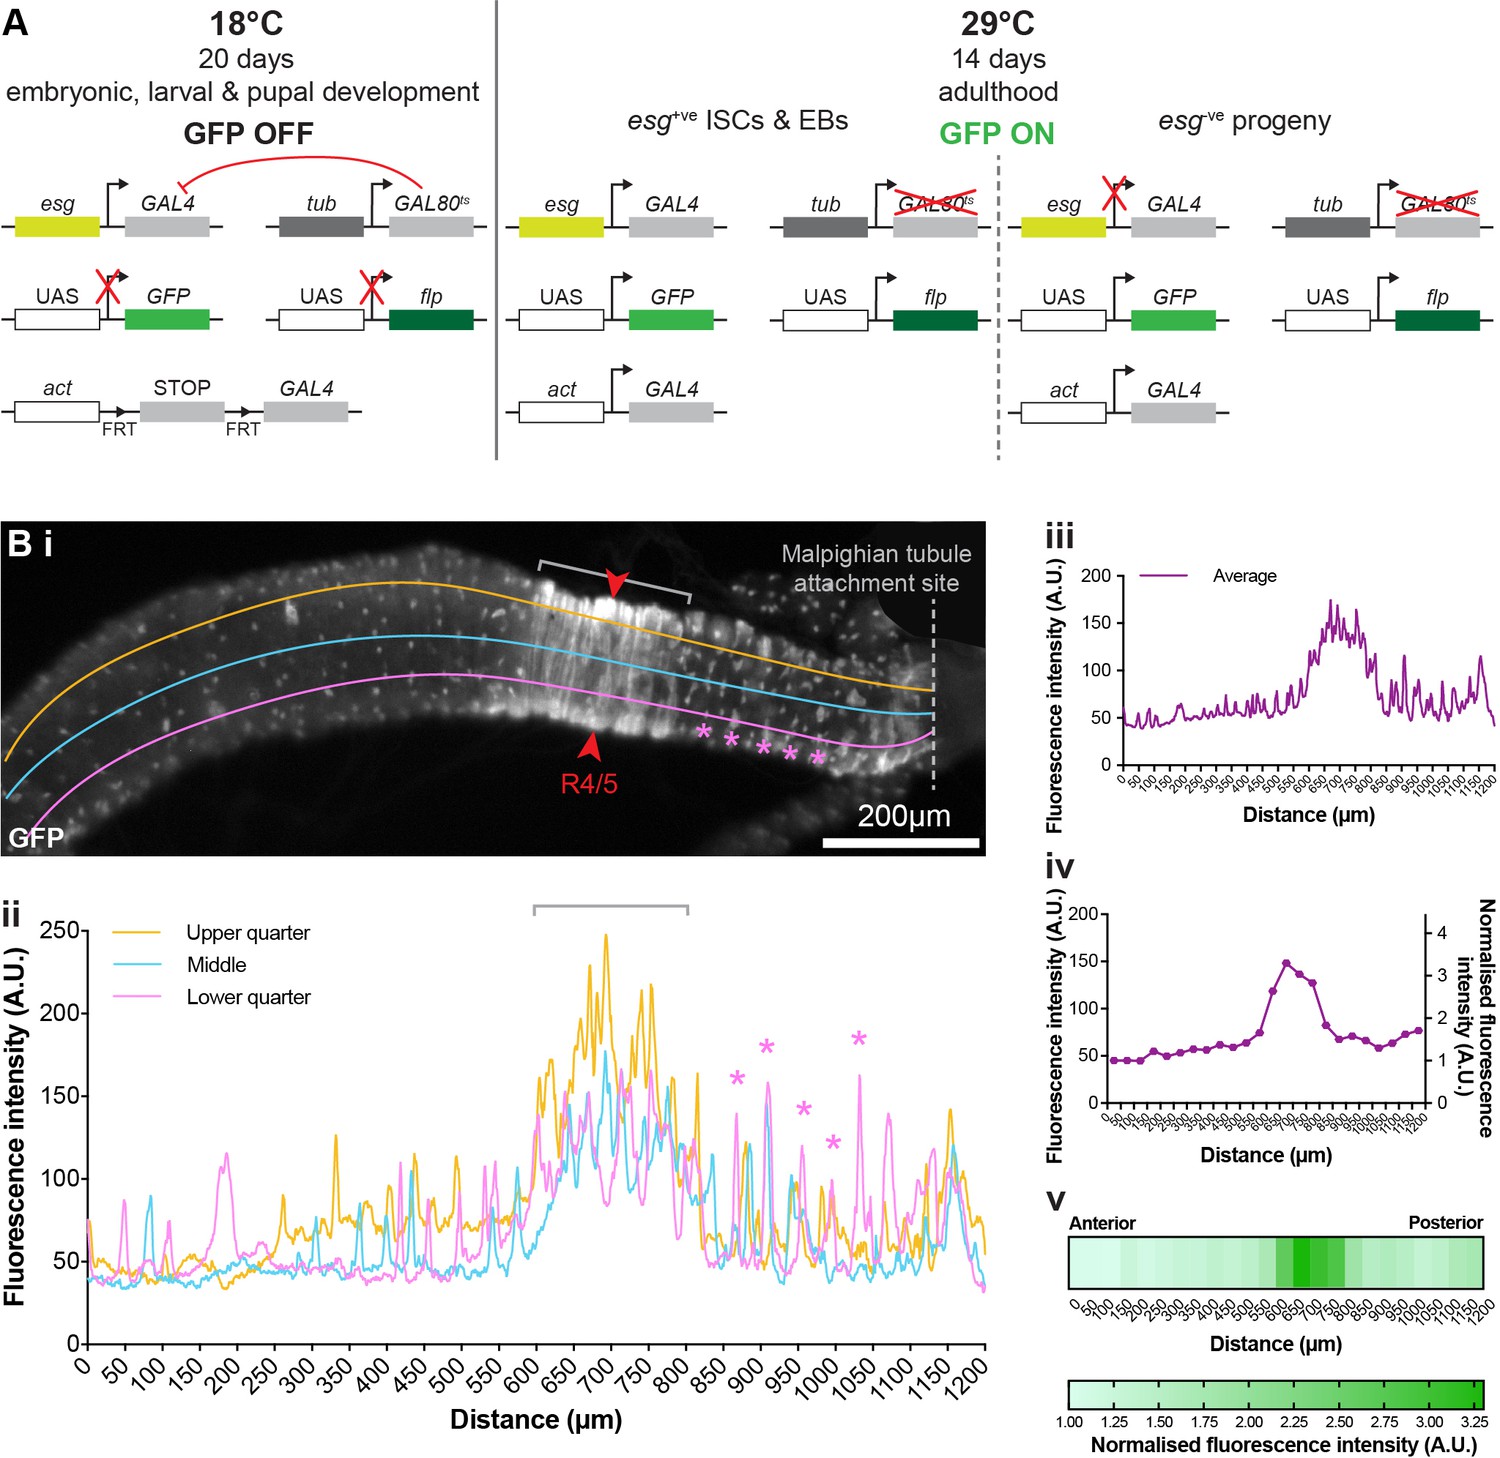
(A) Schematic of the genetic esgts F/O system used in this study. Flies were reared at non-permissive temperature (18°C) from embryo up until adult hatching. Therefore, during all developmental stages, the thermosentitive Gal4 inhibitor Gal80, expressed under the tubulin (tub) promoter, prevents green fluorescent protein (GFP) and flippase expression in esg+. Three-day-old adult flies were then incubated at 29°C for 14 consecutive days. At this temperature the Gal80 is inactivated, allowing the concomitant expression of the GFP and the flippase in all esg+. The STOP codon surrounded by two FRT cassettes is then excised activating constitutive expression of GFP in esg+ and their progeny under actin (act) promoter. (Bi–Bv) Workflow for generating fluorescence intensity heatmaps. (i) Example of a vinc102.1 esgts F/O gut showing GFP fluorescence intensity measurement at three positions, ‘upper quarter’ (orange line), ‘middle’ (blue line), and ‘lower quarter’ (pink line), along the posterior-most 1200 μm of each midgut. Red arrows indicate R4c and R4/5 regions of the posterior midgut where gut width was measured (ii) Example of a GFP intensity plot where individual GFP-positive patches appear as isolated peaks (pink asterisks) and the stereotypic extended GFP area, corresponding to increased intestinal cell renewal, appear as large continuous peaks (grey bracket) in vinc102.1 gut. (iii) Average of fluorescence intensity along the three lines (upper, middle, and lower quarters) at each position. (iv) Average fluorescence intensity calculated for each 50 μm gut segment and normalised by dividing by the lowest fluorescence value (to account for variation in image brightness within and between genotypes). (v) Normalised values plotted as a heatmap showing GFP intensity.
Figure 3
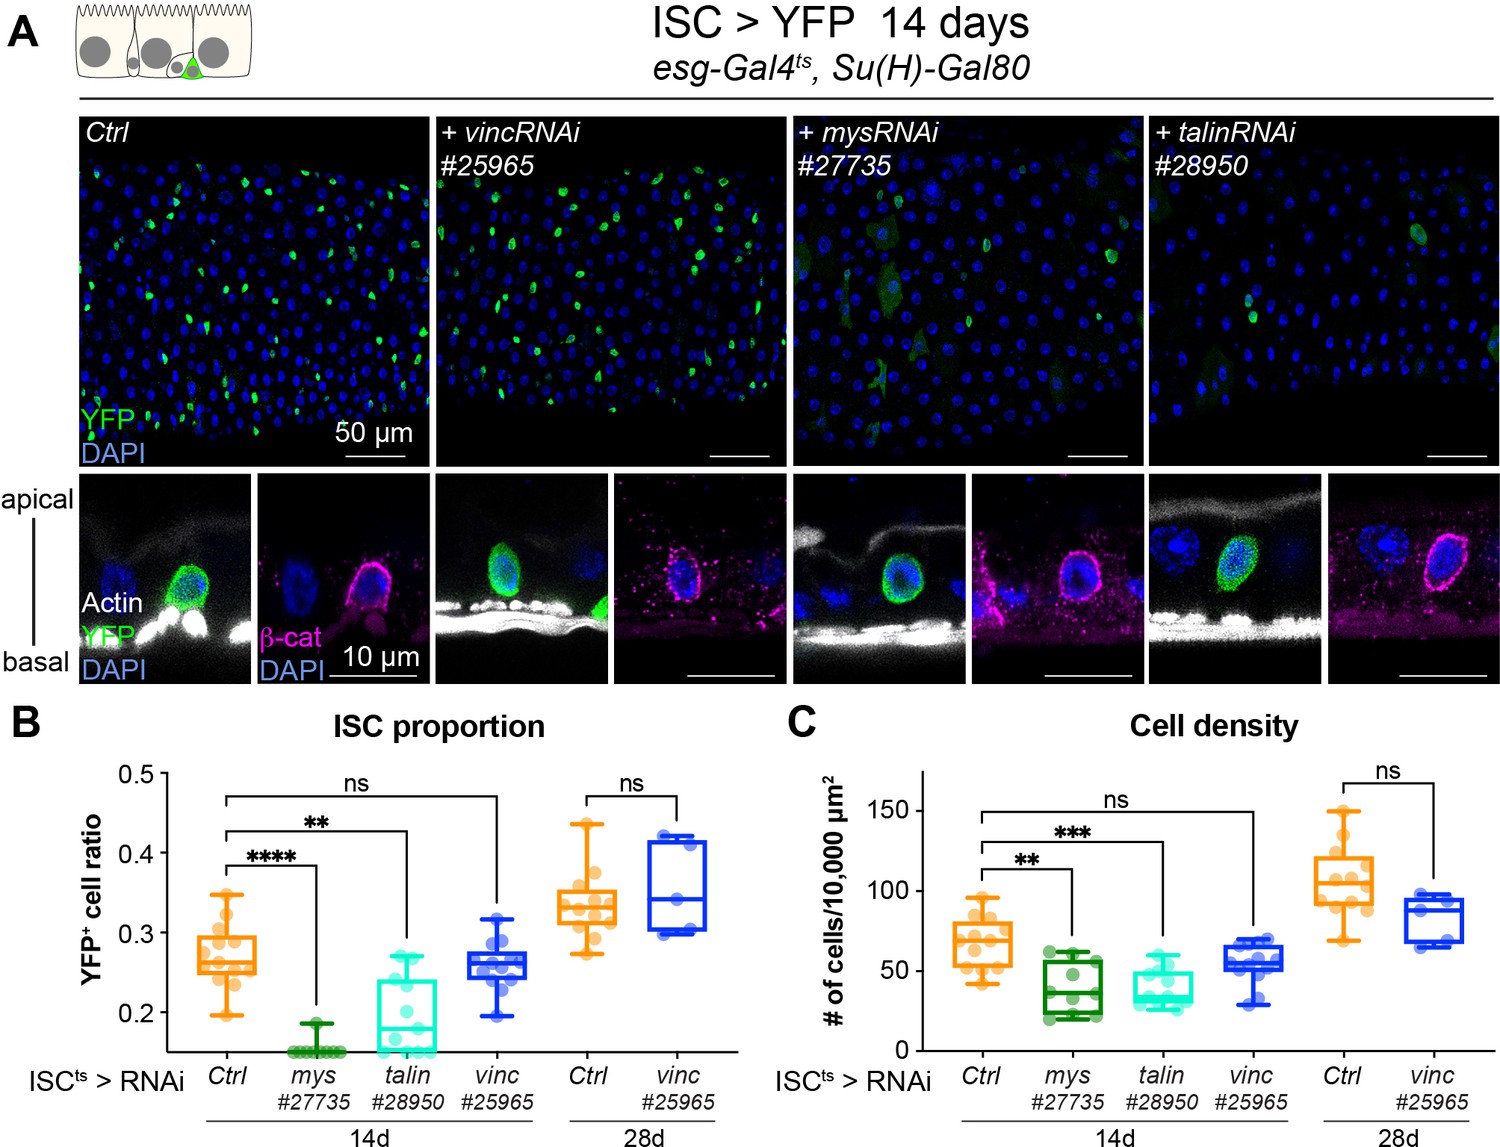
Vinculin is not required in stem cells to regulate cell proliferation.
(A) Fourteen-day RNAi-mediated knockdown of mys, talin, and vinculin in intestinal stem cells (ISCs) (YFP, green). Nuclei are blue throughout the figure (DAPI). mys and talin, but not vinc, knockdown induce stem cell rounding and detachment from the basal side orthogonal views from guts stained with Phalloidin (white) and β-catenin (β-cat, magenta). Quantification of the ratio of YFP+ ISCs to the total number of cells (B) or cell density (C), after 14 or 28 days of RNAi expression. Two-tailed Mann-Whitney tests were used: ns: not significant, **** p<0.0001, *** p<0.001, ** p<0.01.
-
Figure 3—source data 1
Raw data for Figure 3.
- https://cdn.elifesciences.org/articles/72836/elife-72836-fig3-data1-v1.xlsx
Figure 4 with 2 supplements
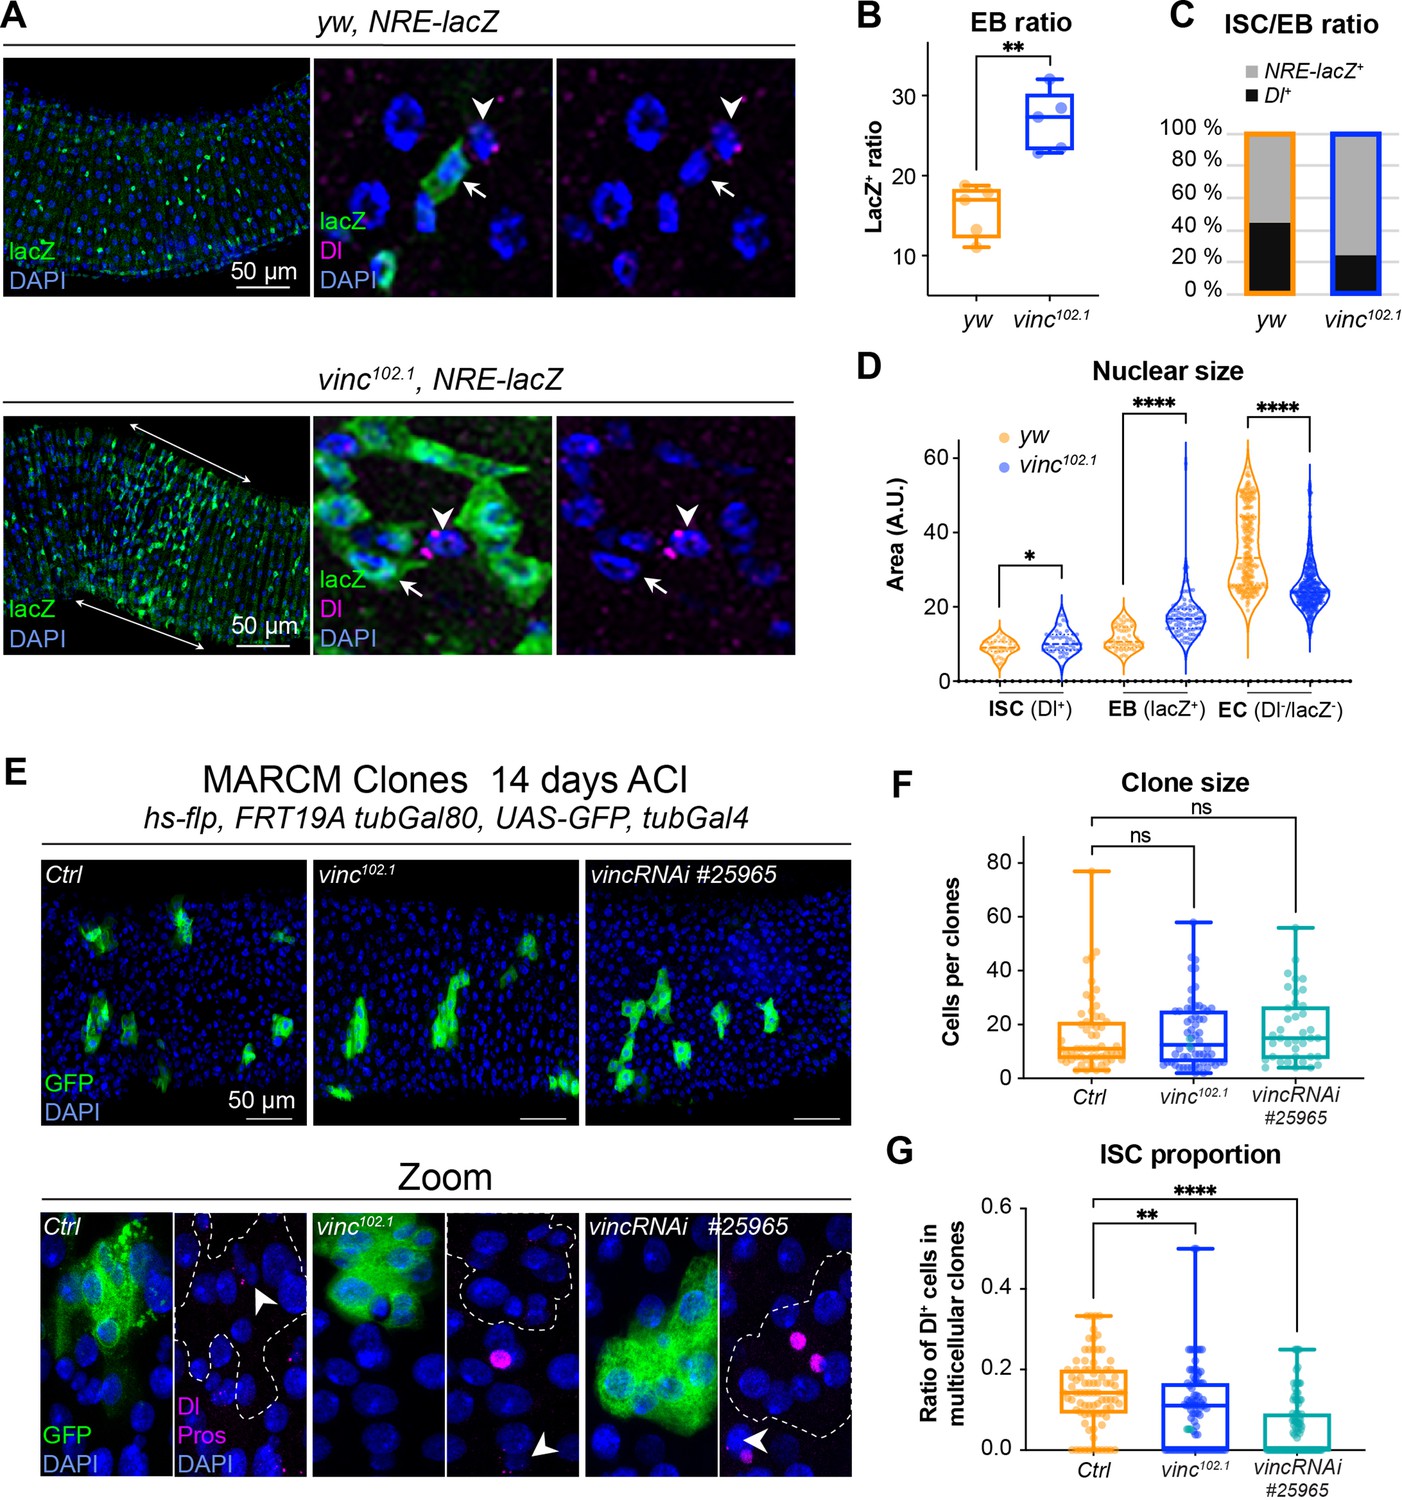
The enteroblast (EB) pool expands upon vinculin depletion.
(A) EBs in 14-day-old yw or vinc102.1 guts of male flies, marked by expression of Notch reporter NRE-lacZ (β-galactosidase antibody staining green, arrows in insets). Dl marks intestinal stem cells (ISCs) (magenta, arrowheads). Nuclei are blue throughout the figure (DAPI). Arrows highlight the region R4/5 where NRE-lacZ+ cells accumulate in vinc102.1 guts. (B) Quantification of EB ratio (number of NRE-lacZ+ cells/total number of cells) showing the excess of EBs in vinc102.1 guts. (C) Quantification of ISC/EB ratio. (D) Quantification of nuclear size of the different cell populations. Note the distribution of EBs in two groups in yw guts, representing dormant and activated EBs. vinc102.1 EBs have overall larger nuclear size. (E) Green fluorescent protein (GFP)-labelled mitotic clones representing wild-type (left), vinc102.1 homozygous mutant (middle) or vincRNAi-expressing cells (right). In all conditions, unlabelled cells are considered wild-type. Zoom panels show clones (GFP, green) outlined with dotted lines, ISCs (anti-Dl, arrowheads, magenta), and enteroendocrine cells (EEs) (anti-Pros, magenta nuclear signal). Examples of multicellular clones devoid of Dl staining are shown for vinc102.1 and vincRNAi. (F) Quantification of cell numbers in clones containing Dl+ cells. Ctrl: n = 56 clones across 26 guts; vinc102.1: n = 58 clones across 34 guts; VincRNAi: n = 40 clones across 25 guts. (G) Quantification of stem cell proportion in multicellular clones (number of Dl+ cells/number of cells per clone). Ctrl: n = 85 clones across 26 guts; vinc102.1: n = 86 clones across 34 guts; VincRNAi: n = 92 clones across 25 guts. Two-tailed Mann-Whitney tests were used: ns: not significant, **** p<0.0001, ** p<0.01.
-
Figure 4—source data 1
Raw data for Figure 4 and Figure 4—figure supplement 1.
- https://cdn.elifesciences.org/articles/72836/elife-72836-fig4-data1-v1.xlsx
Figure 4—figure supplement 1
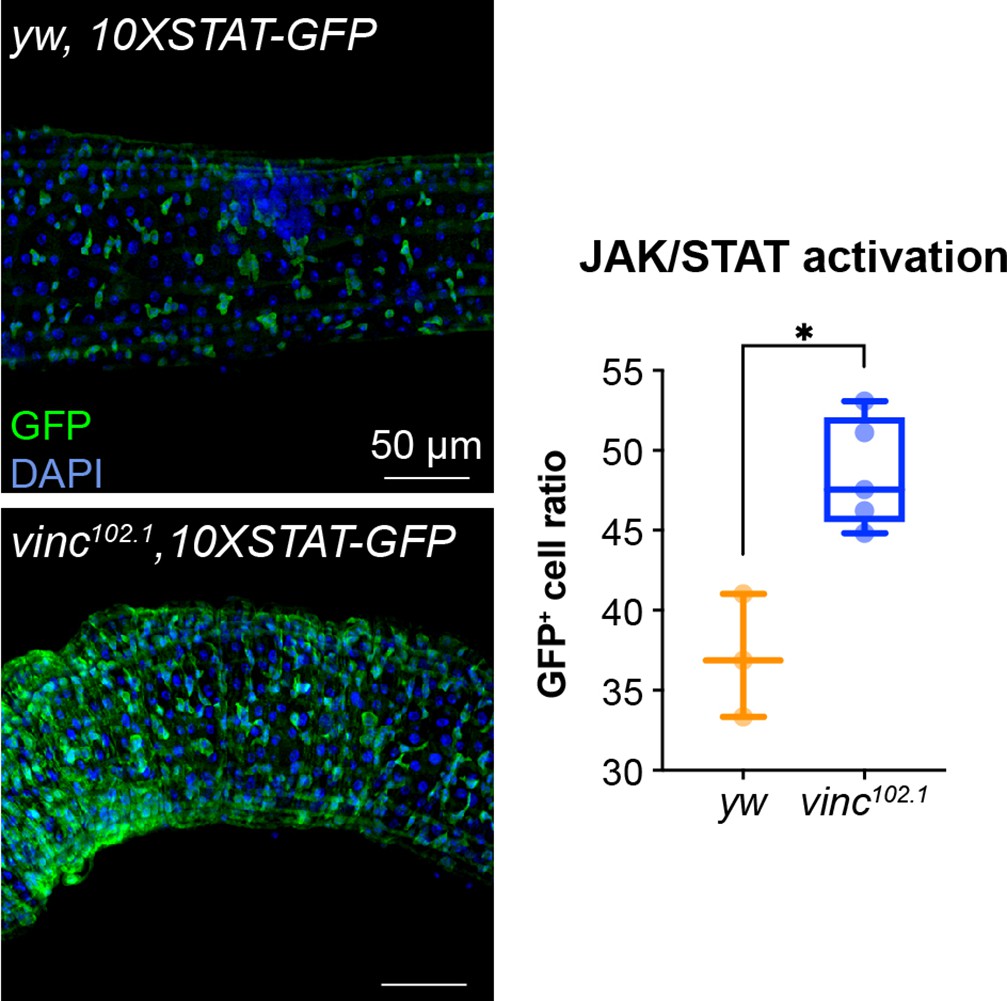
The number of cells with active JAK–STAT signalling increases in vinc102.1 guts.
JAK–STAT reporter (10XSTAT-GFP) detected by GFP antibody staining (green) in 14-day-old yw or vinc102.1 guts of male flies. Nuclei are stained with DAPI (blue). Right graph shows quantification of JAK/STAT activation (number of GFP+ cells/total number of cells) in yw and vinc102.1. Two-tailed Mann–Whitney tests were used for analysis. *p < 0.05.
Figure 4—figure supplement 2
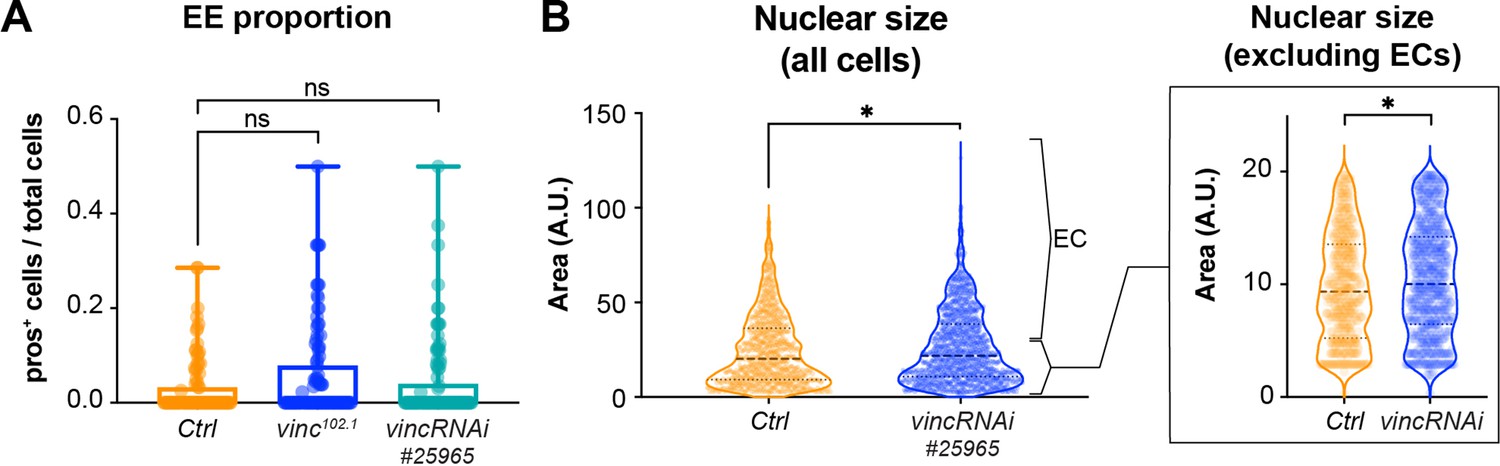
Clones lacking vinculin accumulate enteroblasts (EBs) but not enteroendocrine cells (EEs).
(A) Quantification of EEs proportion in multicellular clones (number of pros+ cells/number of cells per clone). Ctrl: n = 95 clones across 26 guts; vinc102.1: n = 106 clones across 34 guts; vincRNAi#25965: n = 102 clones across 25 guts. (B) Left plot: quantification of clone cells nuclear size (DAPI area per cells). Ctrl: n = 936 cells across 26 guts; vincRNAi#25965: n = 1235 cells across 25 guts. Right plot: same quantification of clone cells nuclear size shown in the left plot but excluding expected enterocyte (EC) nuclear size data showing that ISC/EB pool nuclear size is still significantly different between Ctrl and vincRNAi#25965 clones. In A and B, two-tailed Mann–Whitney test. ns: not significant, *p < 0.05.
Figure 5 with 2 supplements
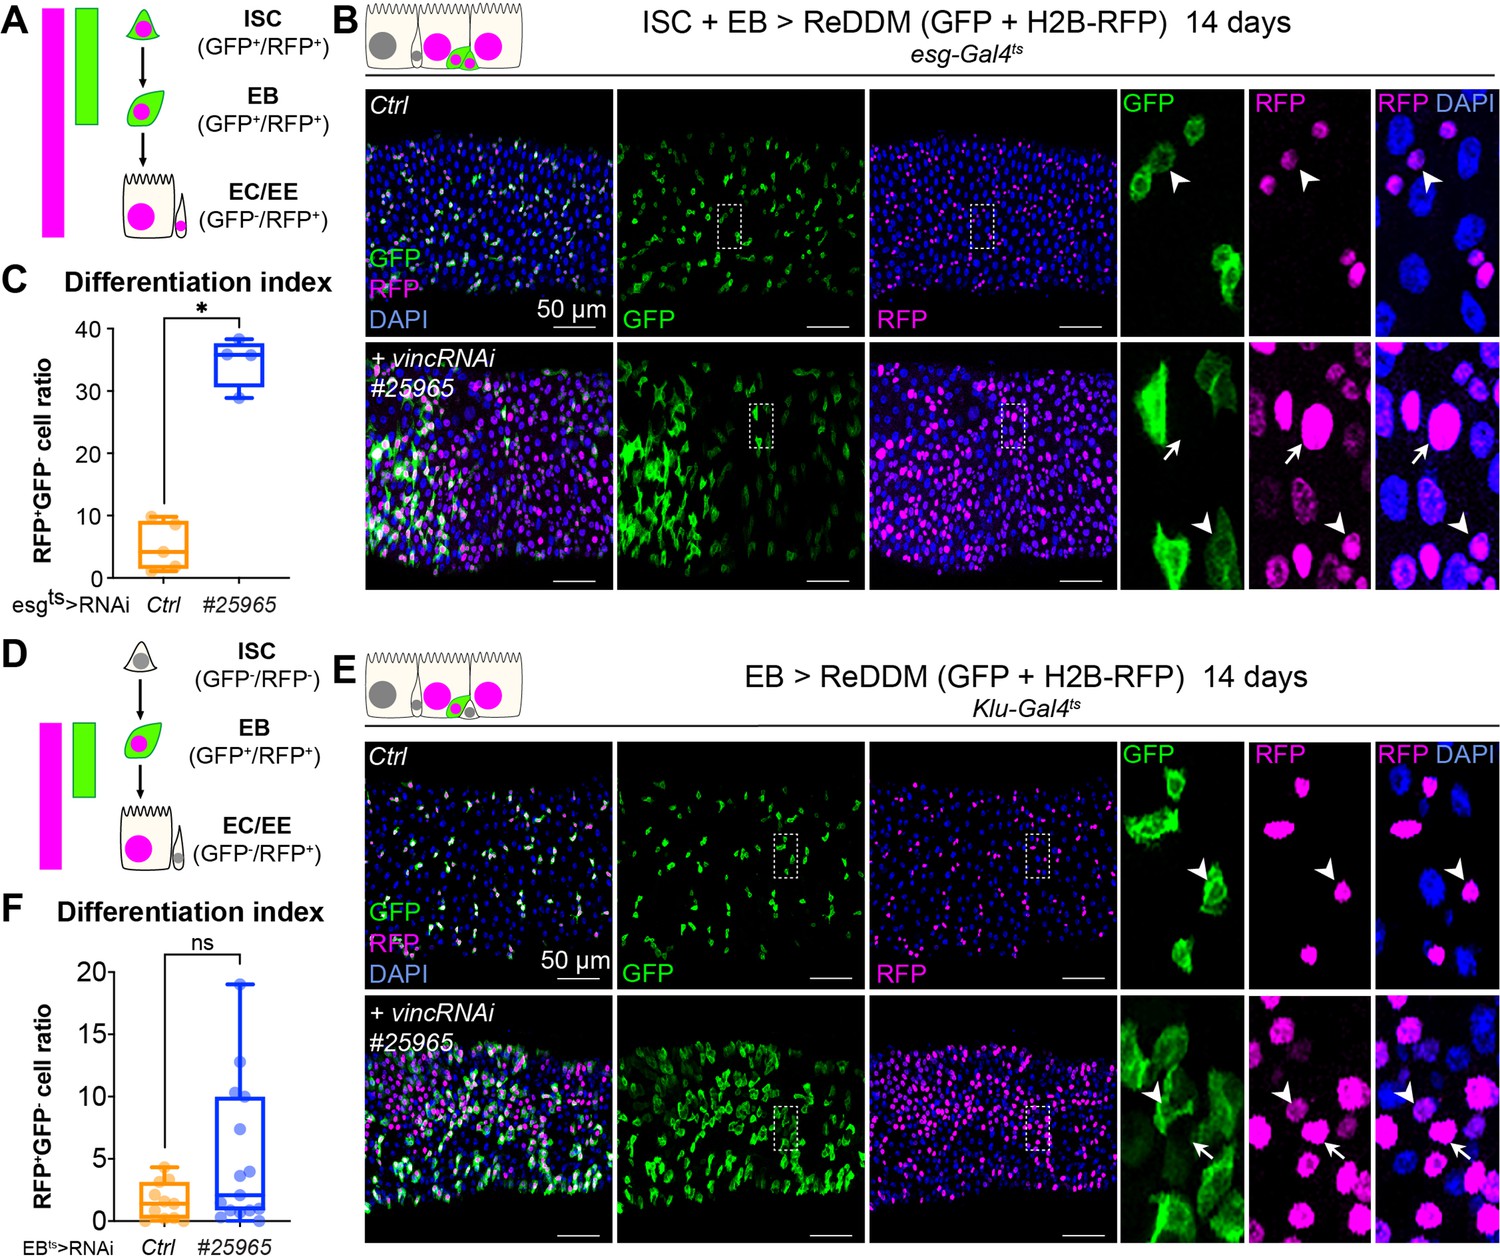
Vinculin slows enterocyte precursor differentiation.
(A) Schematic of the ReDDM system expressed in progenitor cells. (B) Expression of ReDDM in progenitors with vincRNAi#25965 or without (Ctrl) for 14 days. Close-ups (dashed line rectangles) show GFP−RFP+ differentiated cells (arrows) upon vinc knockdown. Arrowheads indicate GFP+RFP+ progenitors. (C) Quantification of the differentiation index (proportion of GFP−RFP+ cells) Expression of vincRNAi#25965 in progenitors accelerates differentiation. (D) Schematic of the ReDDM system expressed in enteroblasts (EBs). (E) vincRNAi#25965 expression in EBs leads to the accumulation of GFP+ cells. Close-ups show GFP+RFP+ (arrowheads) and GFP−RFP+ (arrows) cells seen more in vincRNAi#25965-expressing guts. (F) Quantification of the differentiation index when RedDM is expressed with Klu-Gal4. No statistical difference was noted when vincRNAi#25965 was expressed, suggesting Klu+ cells accumulate and stall in this condition. Two-tailed Mann-Whitney tests were used: ns: not significant, * p<0.05.
-
Figure 5—source data 1
Raw data for Figure 5 and Figure 5—figure supplements 1 and 2.
- https://cdn.elifesciences.org/articles/72836/elife-72836-fig5-data1-v1.xlsx
Figure 5—figure supplement 1
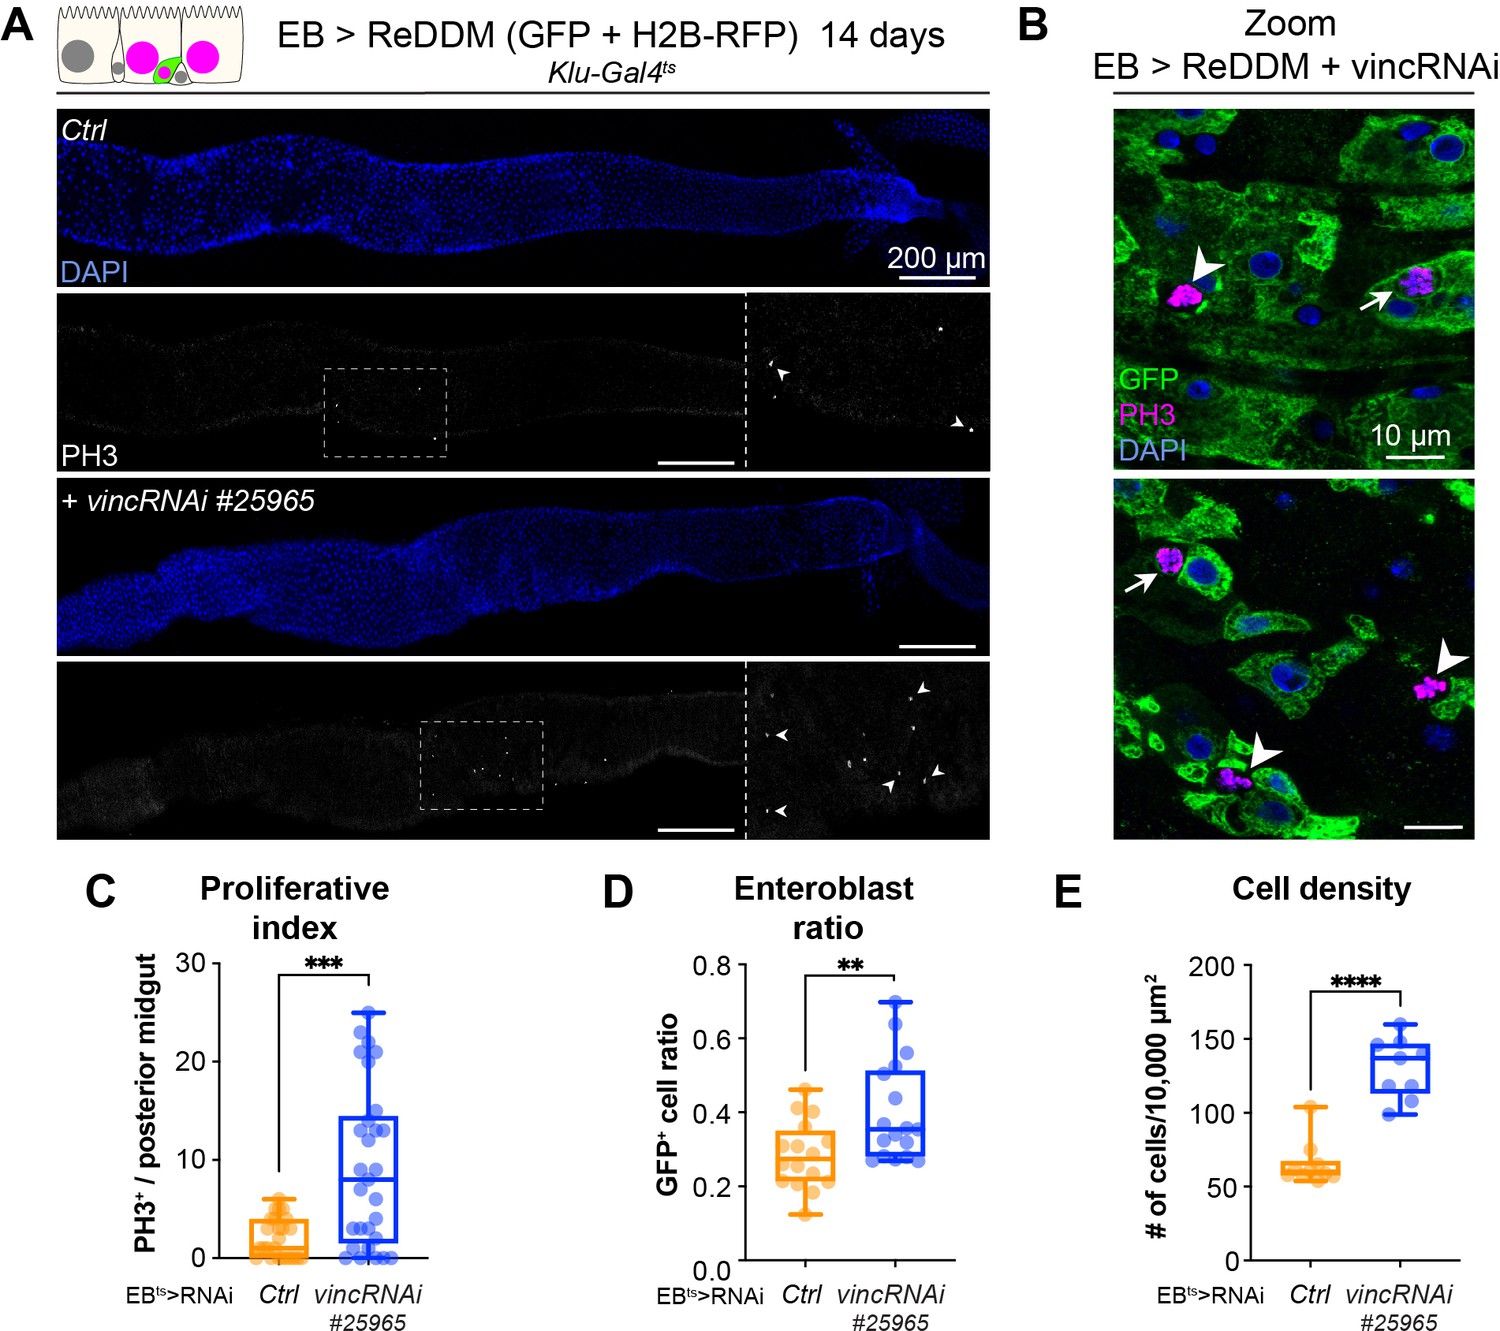
Vinculin knockdown in enteroblasts (EBs) results in increased proliferation.
(A) Expression of ReDDM in EBs with vincRNAi#25965 or without (Ctrl) for 14 days. Note the increased number of mitotic cells (PH3+) when vincRNAi#25965 is expressed. Close-ups show dashed line rectangles region with increased PH3+ cells (arrowheads) in vincRNAi#25965-expressing guts compared to Ctrl. Nuclei are stained with DAPI (blue). (B) Expression of ReDDM in EBs with vincRNAi#25965 for 14 days. Arrowheads indicate GFP−PH3+ dividing stem cells normally present in control conditions while arrows point at GFP+PH3+ dividing EB which can be observed after vincRNAi#25965 expression and not in control. Only GFP expression from the ReDDM system is shown here. Nuclei are stained with DAPI (blue). (C) Quantification of proliferative index (number of PH3+/posterior midgut) showing the increased proliferation following vincRNAi#25965 expression in EBs. Ctrl: n = 25 guts; vincRNAi#25965: n = 29 guts. (D) Quantification of the ratio of GFP+ EBs to the total number of cells after 14 days of ReDDM expression with vincRNAi#25965 or without (Ctrl). Ctrl: n = 16 guts; vincRNAi#25965: n = 17 guts. (E) Quantification of cell density. Ctrl n = 10 guts, vincRNAi#41959: n = 9 guts. Two-tailed Mann–Whitney tests were used: ****p<0.0001, ***p<0.001, **p < 0.01.
Figure 5—figure supplement 2
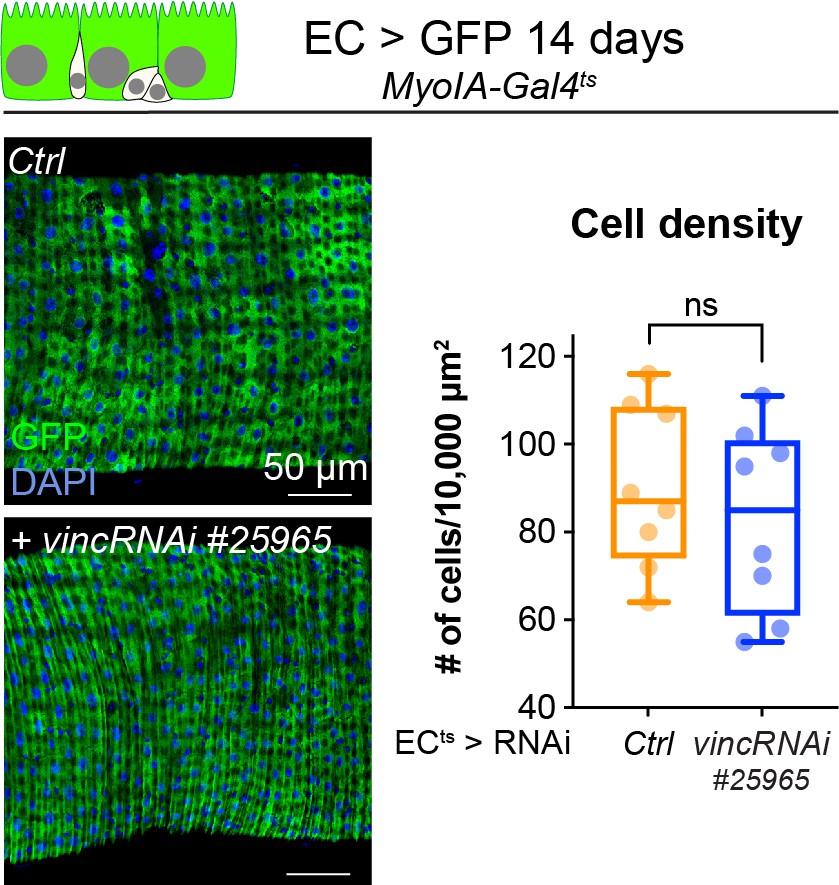
Vinculin knockdown in enterocytes (ECs) does not affect cell density.
Effect of 14-day vincRNAi#25965 expression in ECs (GFP+) under the control of a thermosensitive Gal4 driver (MyoIA-Gal4ts) visualised in midguts stained for GFP (green) and DAPI (blue). Right graph represents the quantification of cell density (number of nuclei per 1000 μm2 area) from Ctrl: n = 8 guts; vincRNAi#25965: n = 8 guts. Two-tailed Mann-Whitney tests were used for analysis. ns: not significant.
Figure 6 with 4 supplements
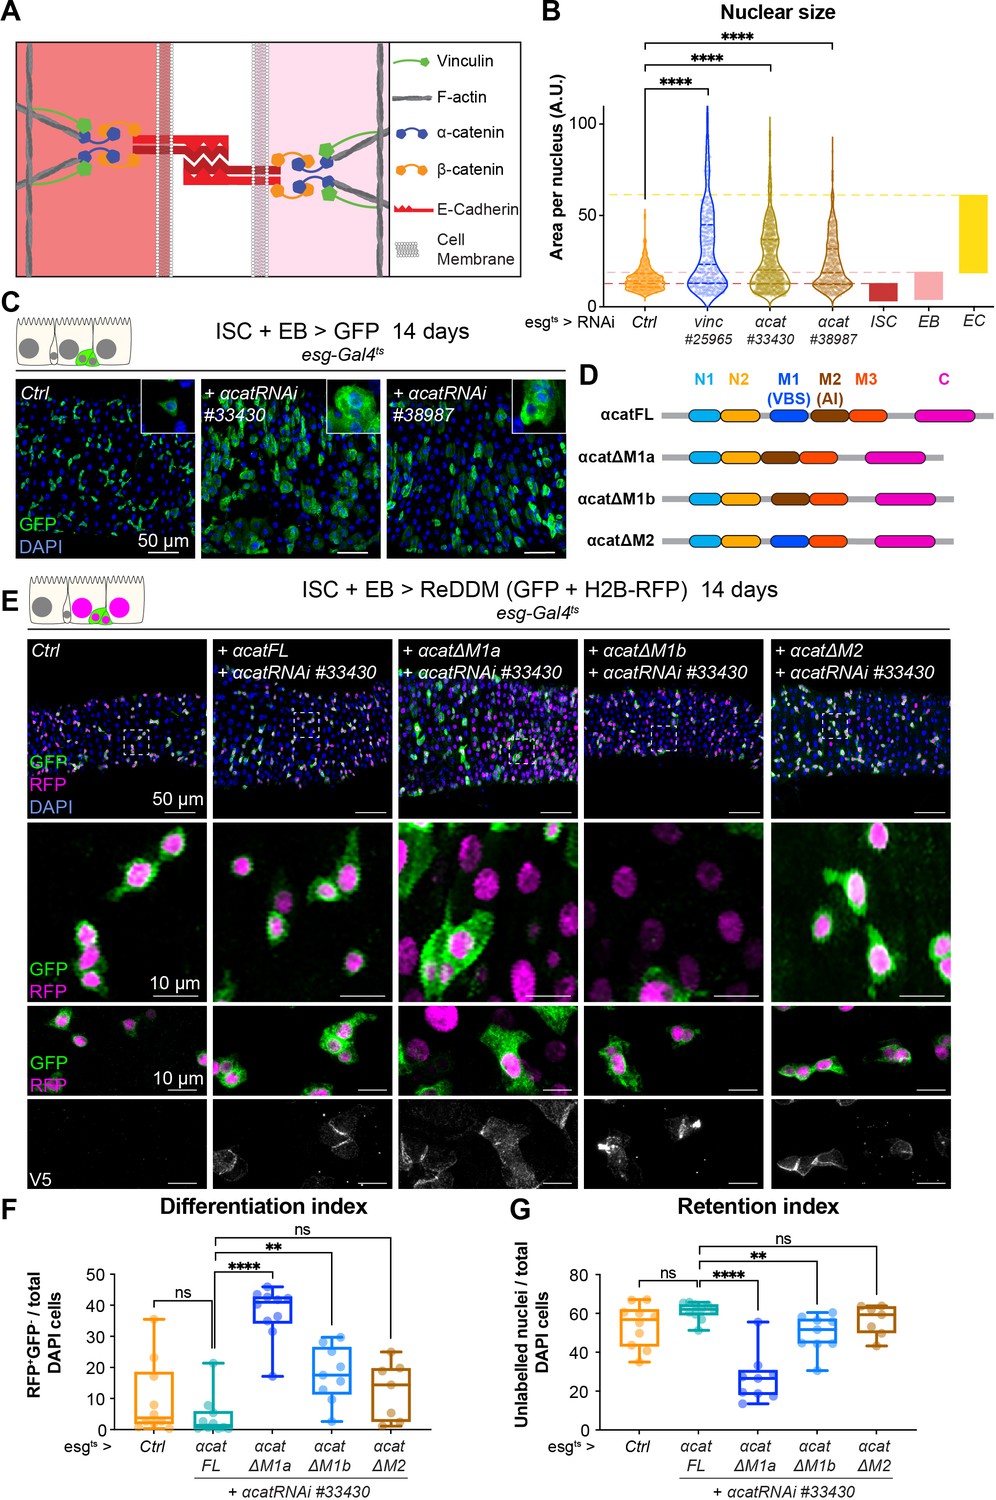
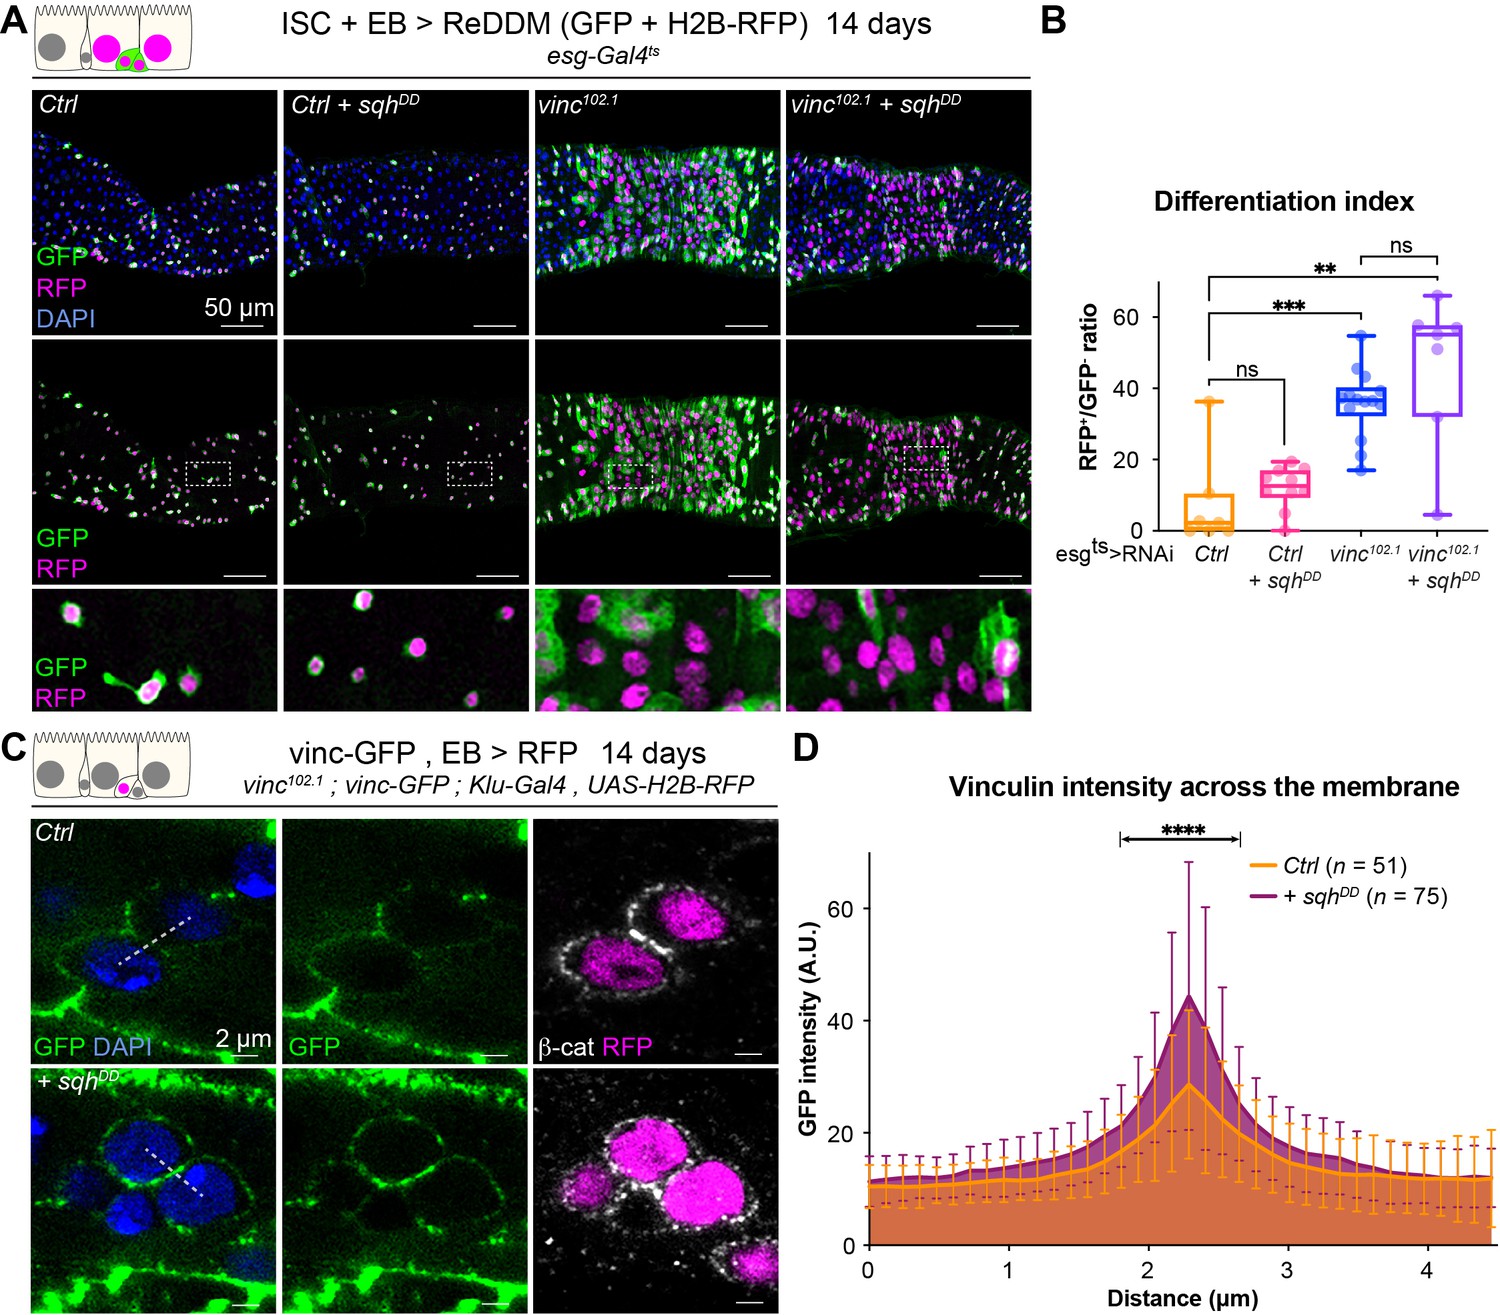
Vinculin recruitment to α-catenin prevents enterocyte (EC) differentiation.
(A) Cartoon depicting activated vinculin binding to α-catenin and actin filaments at adherens junctions. (B, C) Expression of two different α-cat RNAi in progenitors (marked by green fluorescent protein [GFP], green) for 14 days. (B) Quantification of nuclear size in GFP+ cells for indicated genotypes. Cells were recorded from a minimum of 3 guts per genotype. The coloured boxes intestinal stem cell (ISC), enteroblast (EB), and EC on the right-hand side of the graph indicate nuclear size distributions of each cell type determined in yw guts (as in Figure 4D). Expression of vinc or α-cat RNAi produces an accumulation of cells with nuclear size equivalent to large EBs and ECs. (C) Representative images of guts analysed in B. The insets show clusters of GFP cells, comparable to those observed when vincRNAi is expressed (see Figure 1D). (D) Summary of the rescuing α-catenin constructs used. FL: full-length α-cat; ΔX: full length depleted of indicated domain. The different α-cat domains are coloured. M1 contains the vinculin-binding site (VBS). M2 contains the auto-inhibitory domain. (E) Expression of ReDDM in progenitors with α-cat RNAi#33430 and various V5-tagged α-cat rescuing constructs for 14 days. Ctrl represents expression of ReDDM only. Nuclei are blue (DAPI). Second row shows high magnifications without DAPI staining. Bottom high-magnification panels include V5 staining (white), showing accumulation of α-catenin at cell junctions in all conditions, and cytoplasmic enrichment of the ΔM1a fusion protein. (F) Quantification of the differentiation index (proportion of newly differentiated GFP−RFP+ cells) indicates that expression of α-cat ΔM1a in α-cat RNAi accelerates differentiation. (G) Quantification of the proportion of unlabelled cells indicates the cell retention rate. Expression of α-cat ΔM1a in α-cat RNAi accelerates tissue turnover. Two-tailed Mann-Whitney tests were used: ns: not significant, ****p<0.0001, **p<0.01.
-
Figure 6—source data 1
Raw data for Figure 6, Figure 6—figure supplement 1.
- https://cdn.elifesciences.org/articles/72836/elife-72836-fig6-data1-v1.xlsx
Figure 6—figure supplement 1
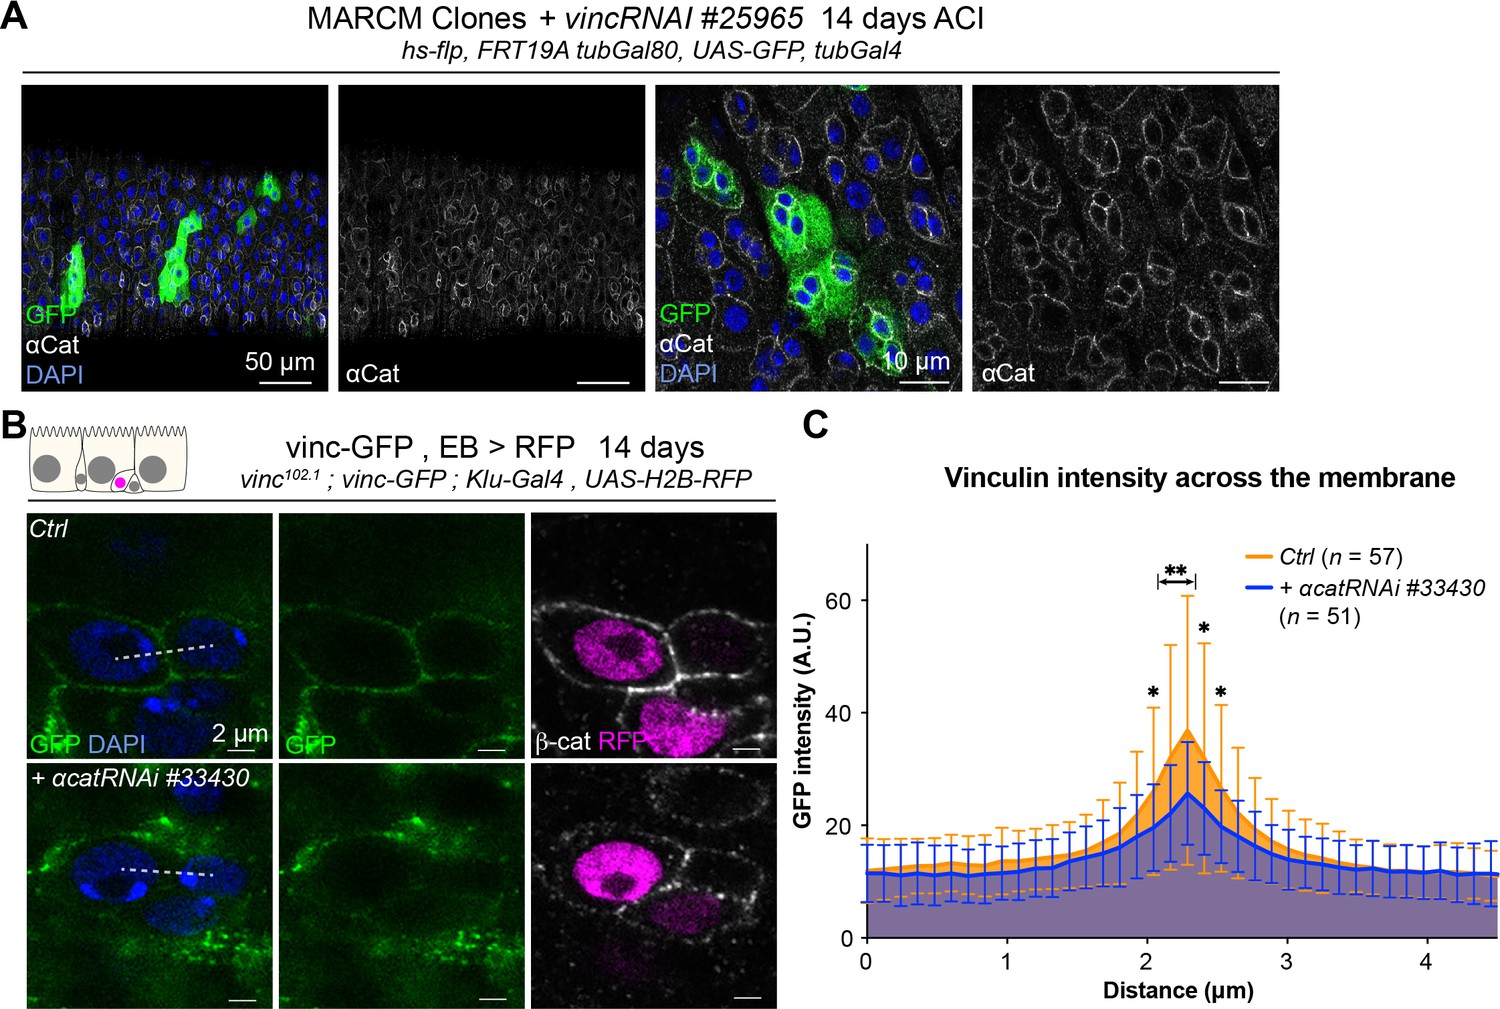
Vinculin recruitment to enteroblast (EB) cell junctions is reduced in the absence of α-catenin, but α-catenin localises independently of vinculin.
(A) Examples of guts containing green fluorescent protein (GFP)-labelled mitotic clones vinc102.1 homozygous (GFP, green) stained for α-catenin (α-Cat, white). The distribution of α-Cat is indistinguishable between vinc102.1 clones and unlabelled control cells. Nuclei are stained with DAPI (blue). (B) Localisation of Vinculin tagged with GFP (Vinc-GFP, green) across cellular junctions (β-cat, white) of doublets containing at least one EB (labelled by expression of Histone-RFP in Klu-expressing cells, red) expressing a-catRNAi#33430 or not (Ctrl). Dotted lines represent examples of regions used to measure GFP intensity. (C) Quantification of Vinc-GFP intensity (arbitrary units, A.U.) from doublets, centred at the highest intensity value (corresponding to the cell/cell junction) indicates reduced vinculin recruitment at cell junctions upon downregulation of α-cat. Two-tailed Mann-Whitney tests were used: **p<0.01, *p<0.05.
Figure 6—figure supplement 2
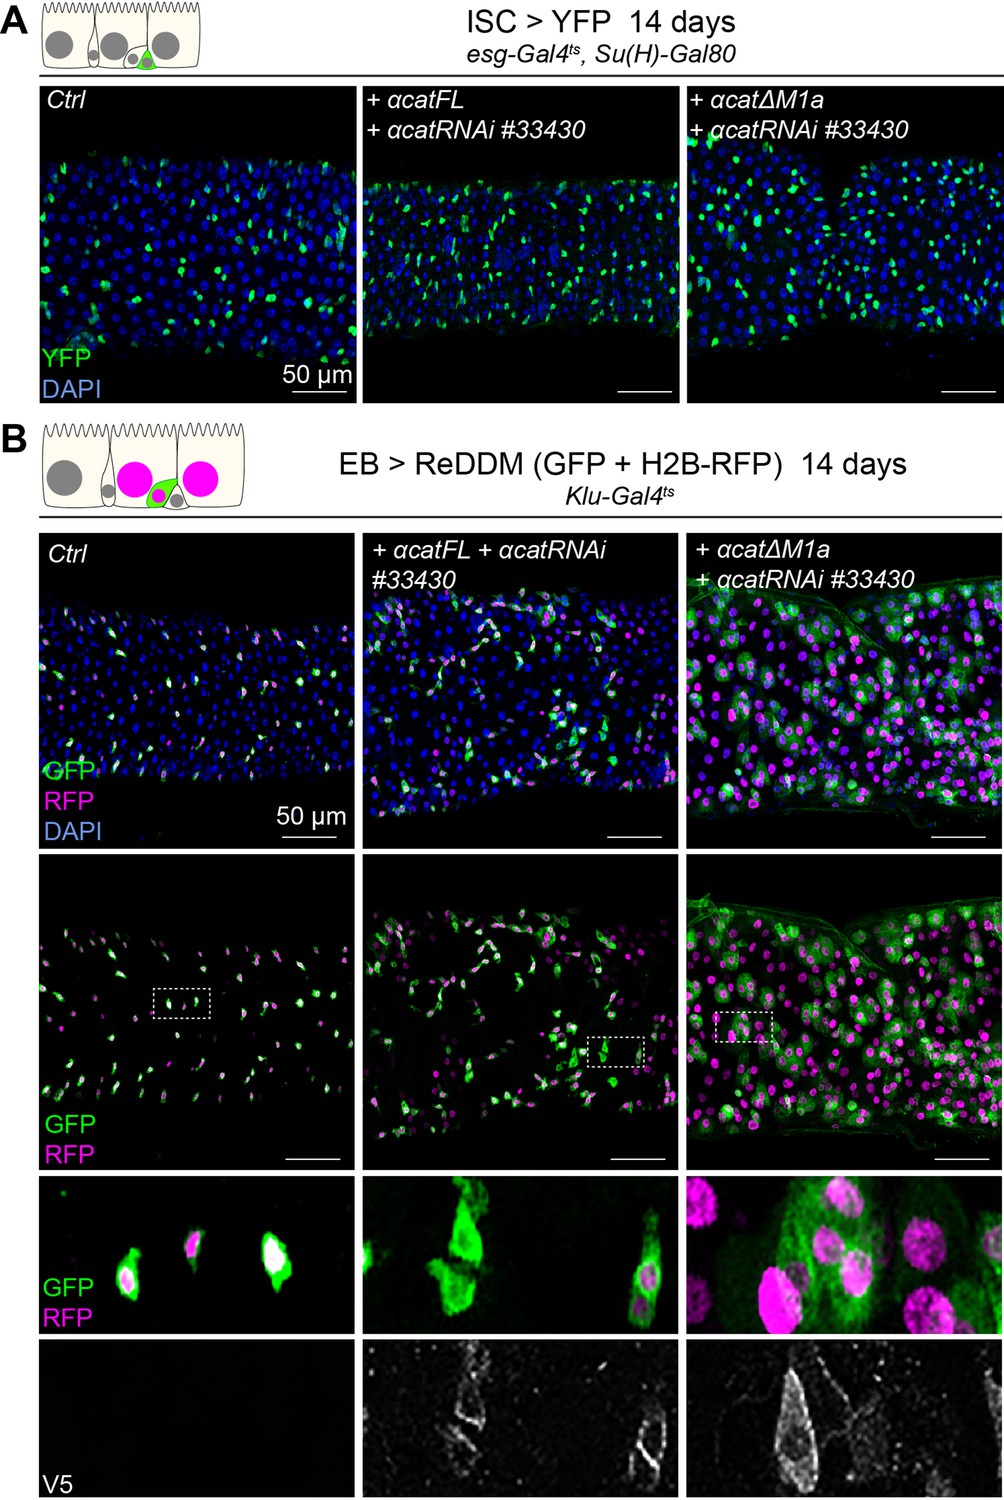
Vinculin recruitment to α-catenin in enteroblasts (EBs) but not intestinal stem cells (ISCs) alters tissue turnover.
Expression of α-cat RNAi#33430 and a full-length (FL) or vinculin-binding site (VBS) lacking α-cat rescuing construct (ΔM1a) for 14 days, in ISCs, with YFP (A) or EBs, with ReDDM (B). Ctrl represents expression of YFP or ReDDM only. Nuclei are blue (DAPI). High-magnification panels in (B) show V5 staining (white) reporting α-catenin fusion proteins.
Figure 6—figure supplement 3
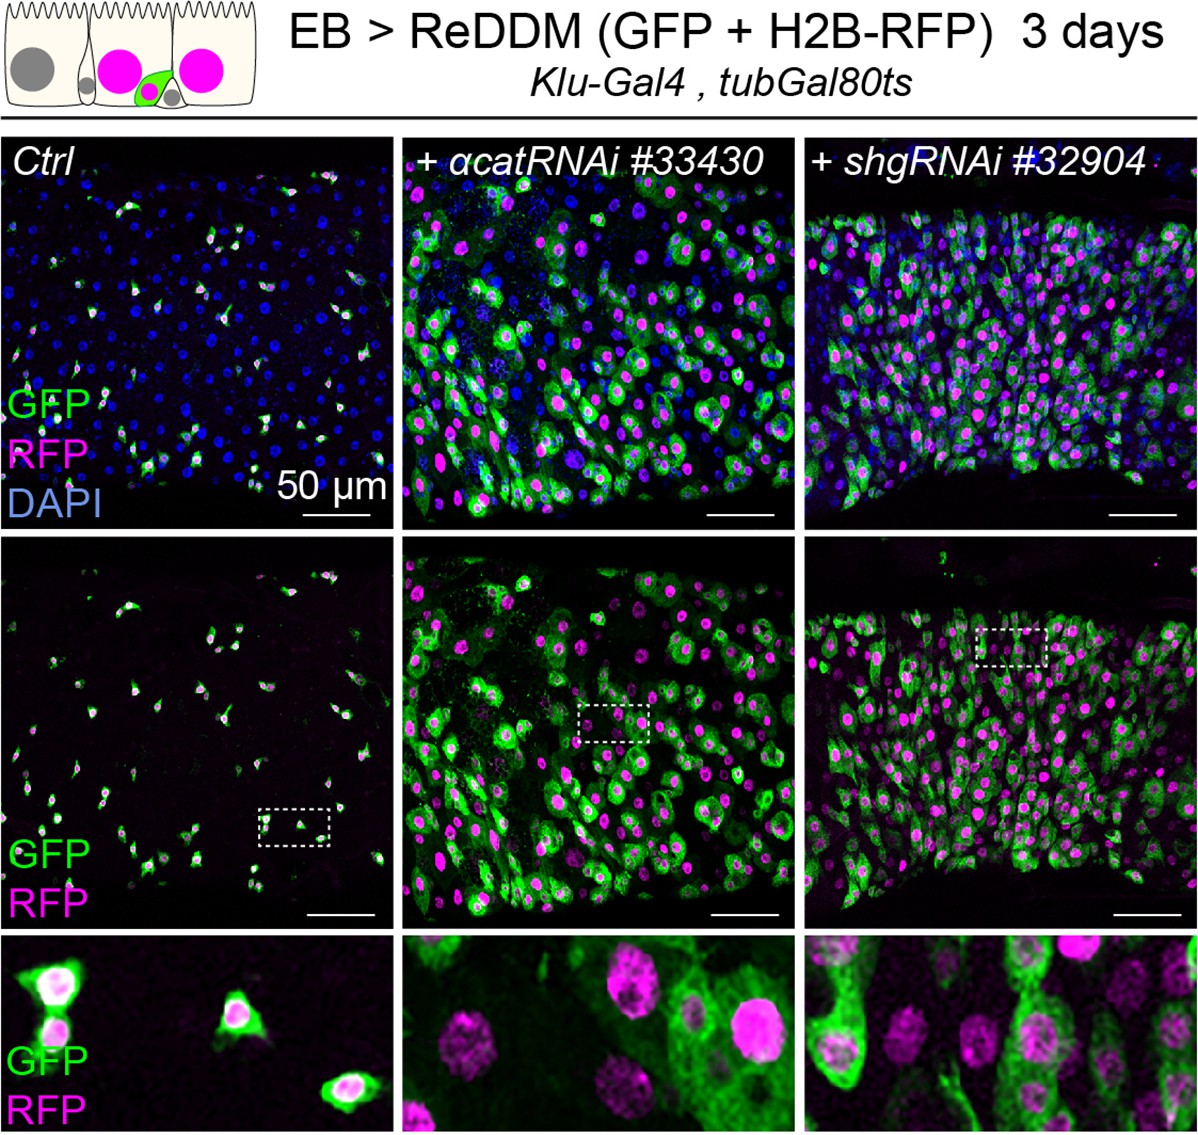
Enteroblast (EB) knockdown of α-catenin and E-cadherin results in EB differentiation.
Expression of ReDDM in EBs in control guts (Ctrl) or with α-catRNAi#33430 or shgRNAi#32904 for 3 days. Close-ups (dashed line rectangles) show GFP−RFP+ differentiated cells upon α-Cat or shg/E-Cad knockdown.
Figure 6—figure supplement 4
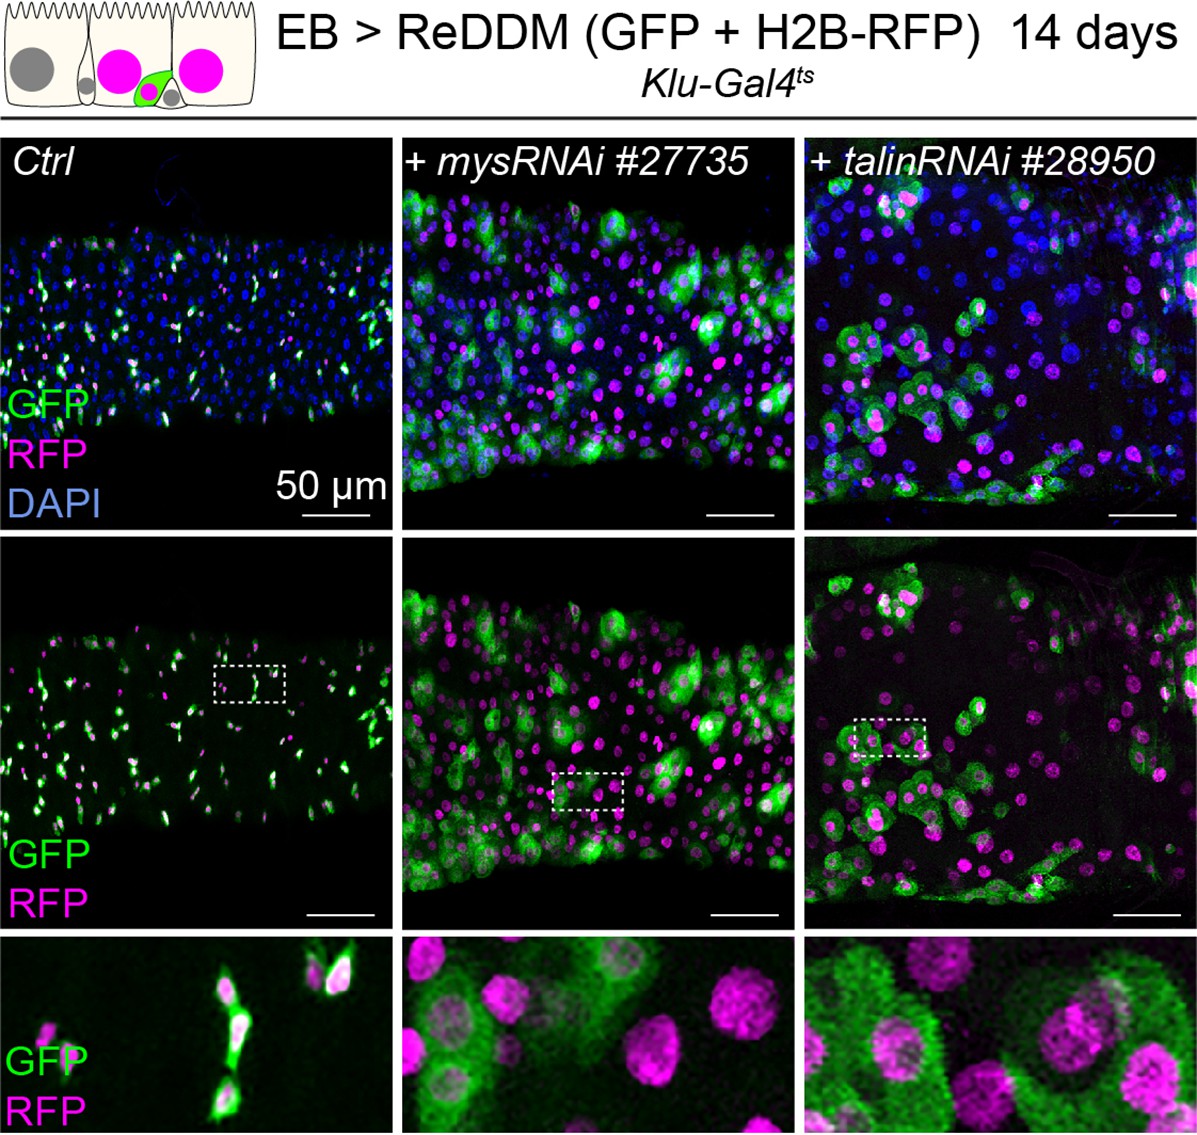
Integrin-mediated adhesion contributes to enteroblast (EB) differentiation.
Expression of ReDDM in EBs in control guts (Ctrl) or with mysRNAi#77355 or talinRNAi#28950 without (Ctrl) for 14 days. Close-ups (dashed line rectangles) show GFP−RFP+ differentiated cells upon mys or talin knockdown.
Figure 7 with 2 supplements
Vinculin links cellular tension to enteroblast (EB) differentiation.
(A) Expression of ReDDM in progenitors with SqhDD for 14 days, in yw (Ctrl) or vinc102.1 guts. Top panels show the overlay of RFP, green fluorescent protein (GFP), and DAPI (nuclei, blue). Middle and bottom panels show RFP and GFP only. Bottom panels show high-magnification pictures of the boxes outlined in middle panels. Progenitors round up and remain small upon constitutive activation of Sqh. (B) Quantification of the differentiation index (proportion of newly differentiated GFP−RFP+ cells) indicates that loss of vinc expression accelerates differentiation, even upon myosin activation. (C) Localisation of Vinculin tagged with GFP (Vinc-GFP, green) across cellular junctions (β-cat, white) of progenitor doublets containing at least one EB (labelled by expression of Histone-RFP in Klu-expressing cells, red) expressing SqhDD or not (Ctrl). Dotted lines represent examples of regions used to measure GFP intensity. (D) Quantification of Vinc-GFP intensity (arbitrary units, A.U.) from doublets, centred at the highest intensity value (corresponding to the cell/cell junction) indicates increased vinculin recruitment at cell junctions upon expression of SqhDD. Two-tailed Mann-Whitney tests were used: ns: not significant, ****p<0.0001, ***p<0.001, **p<0.01.
-
Figure 7—source data 1
Raw data for Figure 7.
- https://cdn.elifesciences.org/articles/72836/elife-72836-fig7-data1-v1.xlsx
Figure 7—figure supplement 1
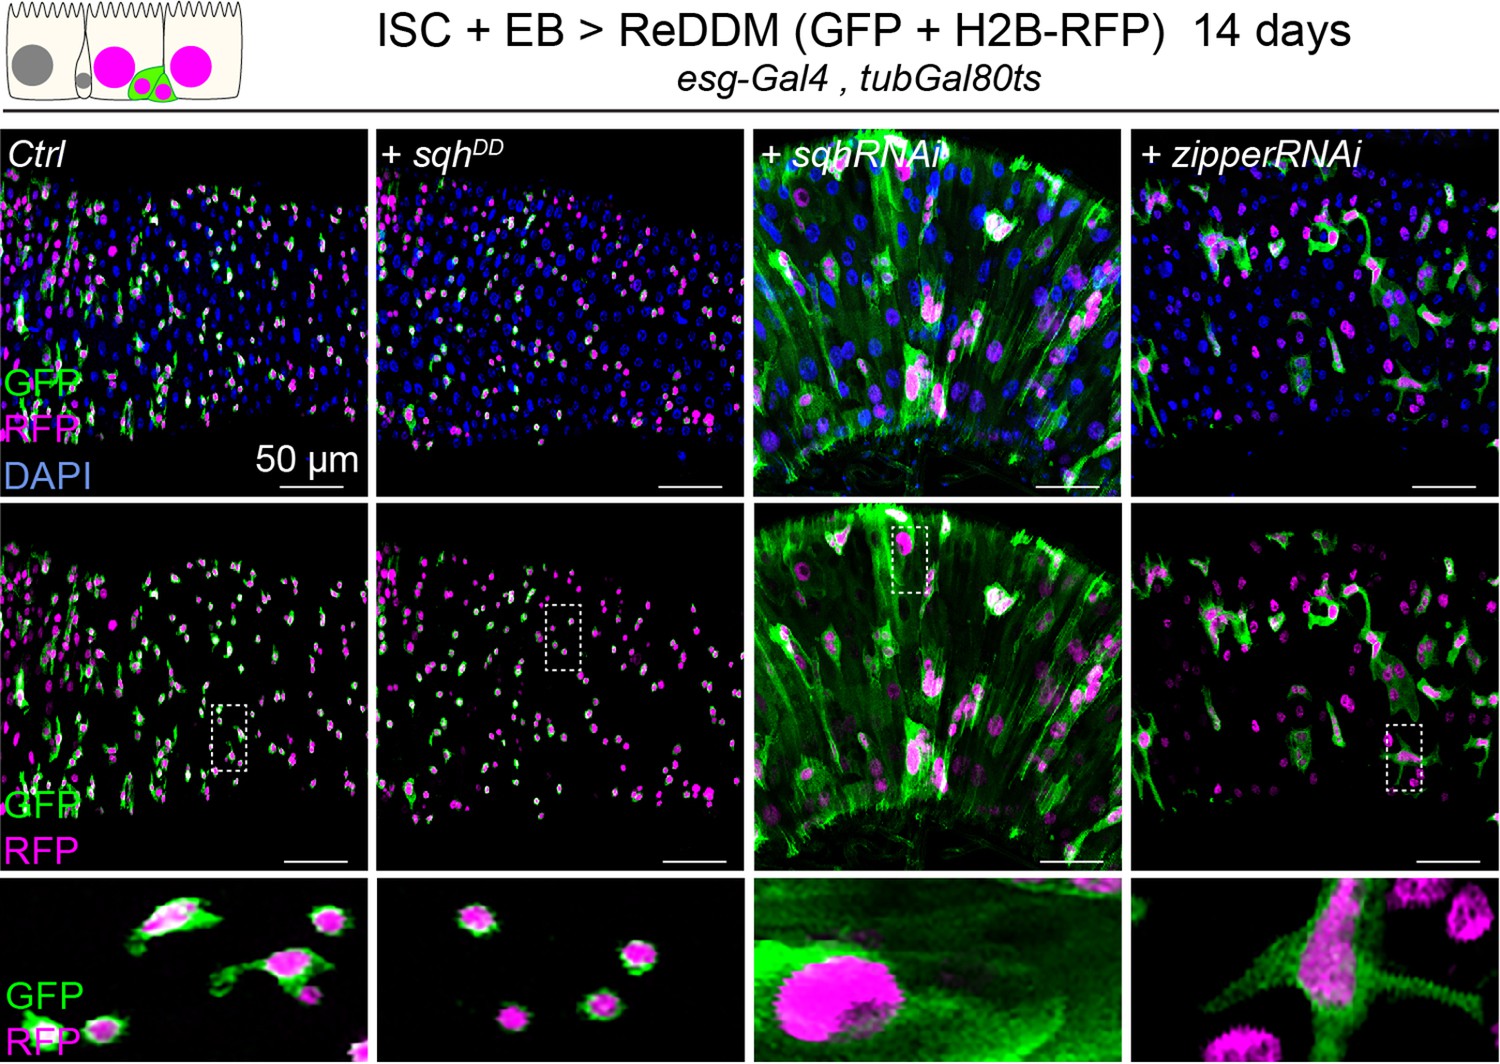
Myosin activity contributes to progenitor differentiation.
Expression of ReDDM in intestinal stem cells (ISCs) and enteroblasts (EBs) for 14 days with sqhDD, sqhRNAi, or zipperRNAi compared to controls (Ctrl). Top panels show the overlay of RFP, green fluorescent protein (GFP), and DAPI (nuclei, blue). Middle and bottom panels show RFP and GFP only. Bottom panels show high-magnification pictures of the boxes outlined in middle panels. Progenitors round up and remain small upon constitutive activation of Sqh but increase in size and undergo differentiation upon sqh or zipper knockdown.
Figure 7—figure supplement 2
Expression of an active form of vinculin slows down tissue turnover in vinc102.1 guts.
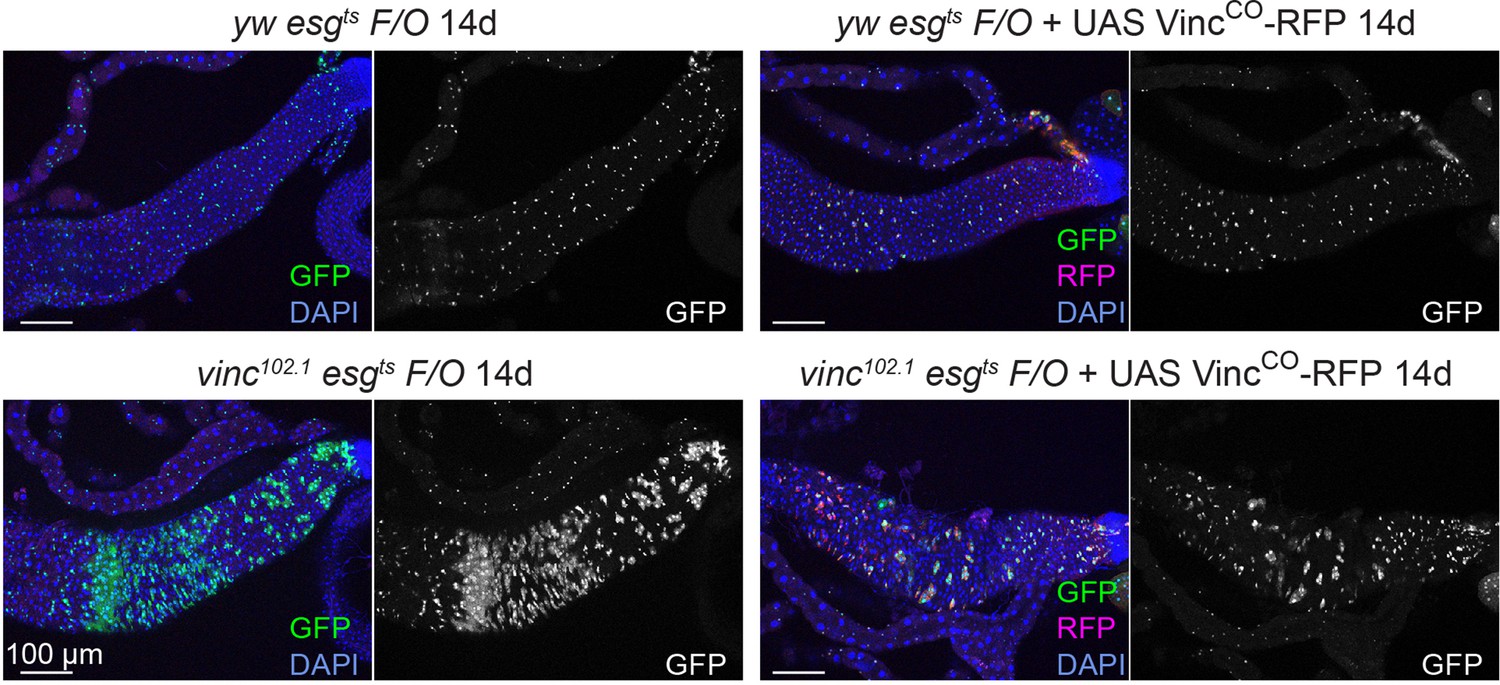
Tissue turnover was assessed in yw or vinc102.1 guts expressing the esgts F/O system, with or without UAS-VincCO-RFP (see Figure 2 for methodology). Expression of VincCO-RFP in progenitors and their newly produced cells (GFP+, green) 14 days after induction of Gal4 expression prevents the formation of large GFP+ patches in the R4/5 region of vinc102.1 esgts F/O guts, indicating that tissue turnover was no longer accelerated as in vinc102.1 guts. Expression of VincCO-RFP in yw control guts did not affect turnover rates. Green fluorescent protein (GFP) (green/white) marks progenitors and newly produced cells, RFP (red) marks cells expressing VincCO, and DAPI (blue) marks nuclei.
Figure 8 with 1 supplement
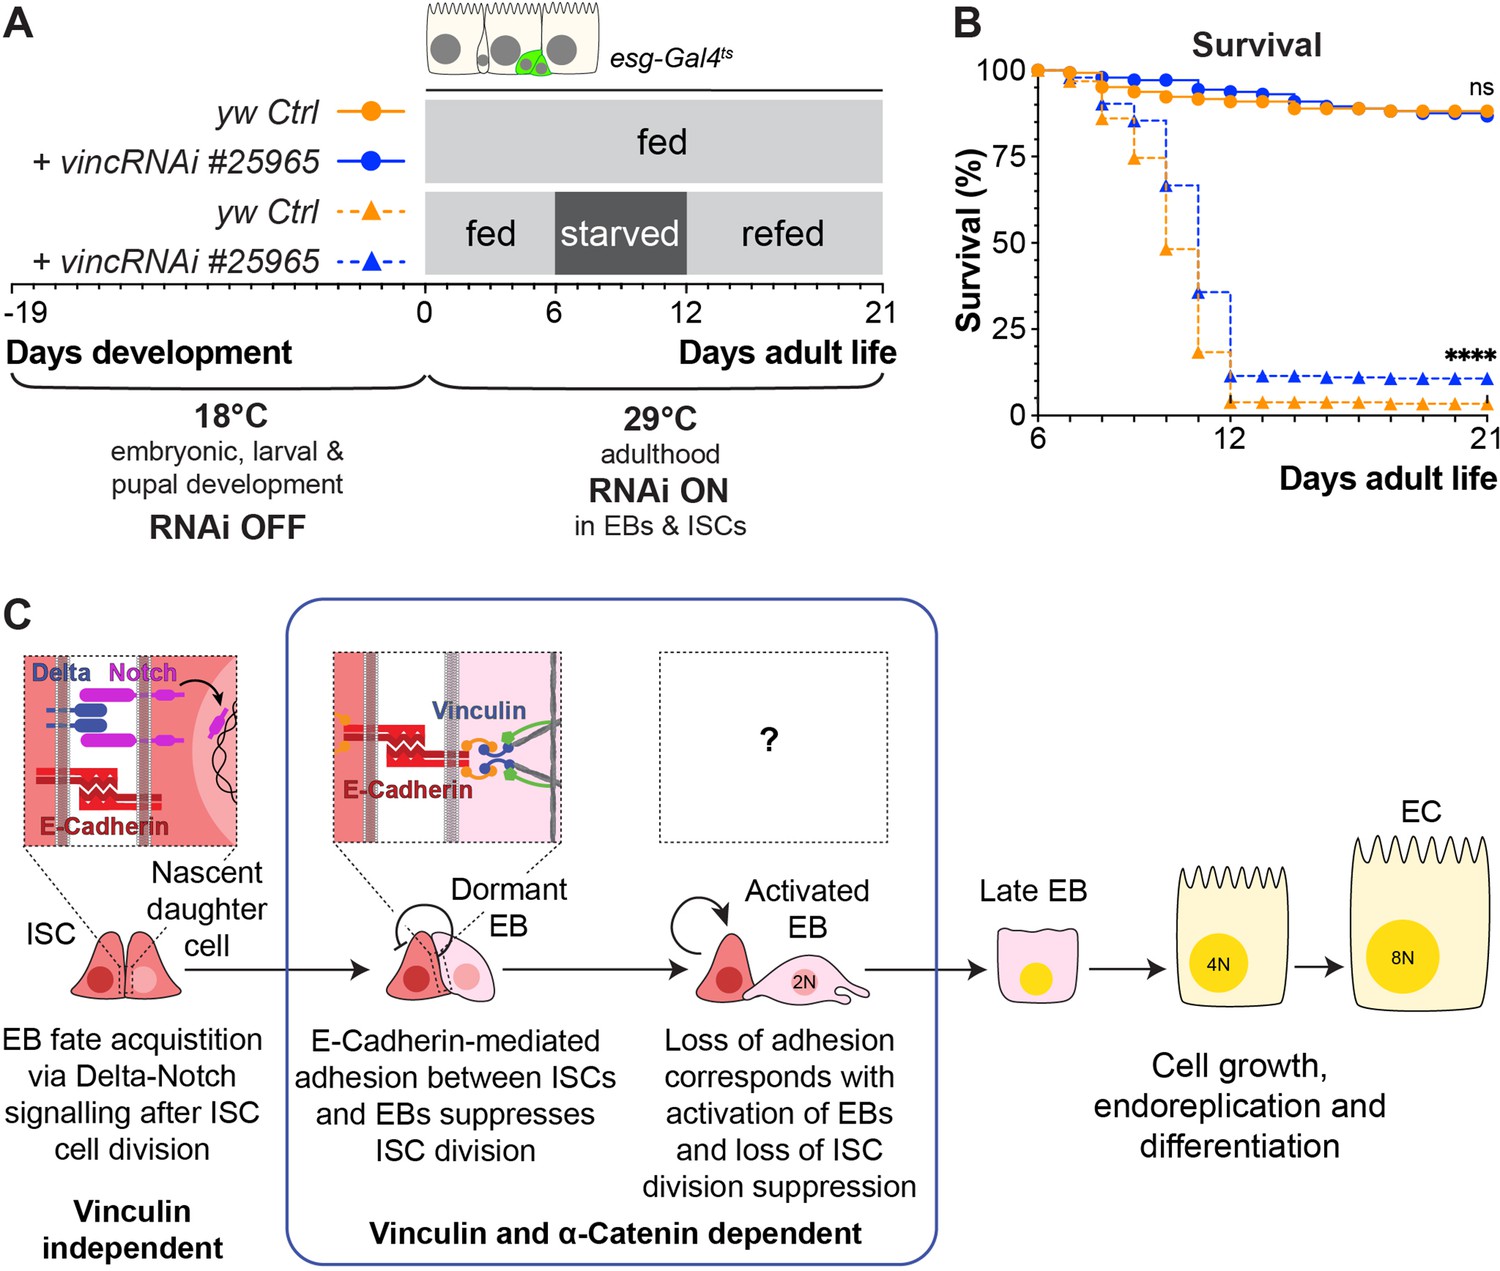
Vinculin knockdown in progenitor cells promotes recovery after starvation.
(A) Schematic of vincRNAi#25965 expression in intestinal stem cells (ISCs) and enteroblasts (EBs) and feeding regime for flies expressing vincRNAi#25965 in ISCs and EBs. (B) Survival during cycle of feeding, starving and refeeding as shown in (A). VincRNAi-expressing flies survive better than control flies. p-values for survival were obtained using a Log-rank test. ns: not significant, ****p<0.0001. (C) Model: reinforcement of cell adhesion by α-catenin and vinculin helps to maintain EBs in a dormant state. The mechanical or chemical cues that relieve vinculin from the adhesion complex and promote tissue renewal and enterocyte (EC) differentiation remain to be identified.
-
Figure 8—source data 1
Raw data for Figure 8.
- https://cdn.elifesciences.org/articles/72836/elife-72836-fig8-data1-v1.xlsx
Figure 8—figure supplement 1
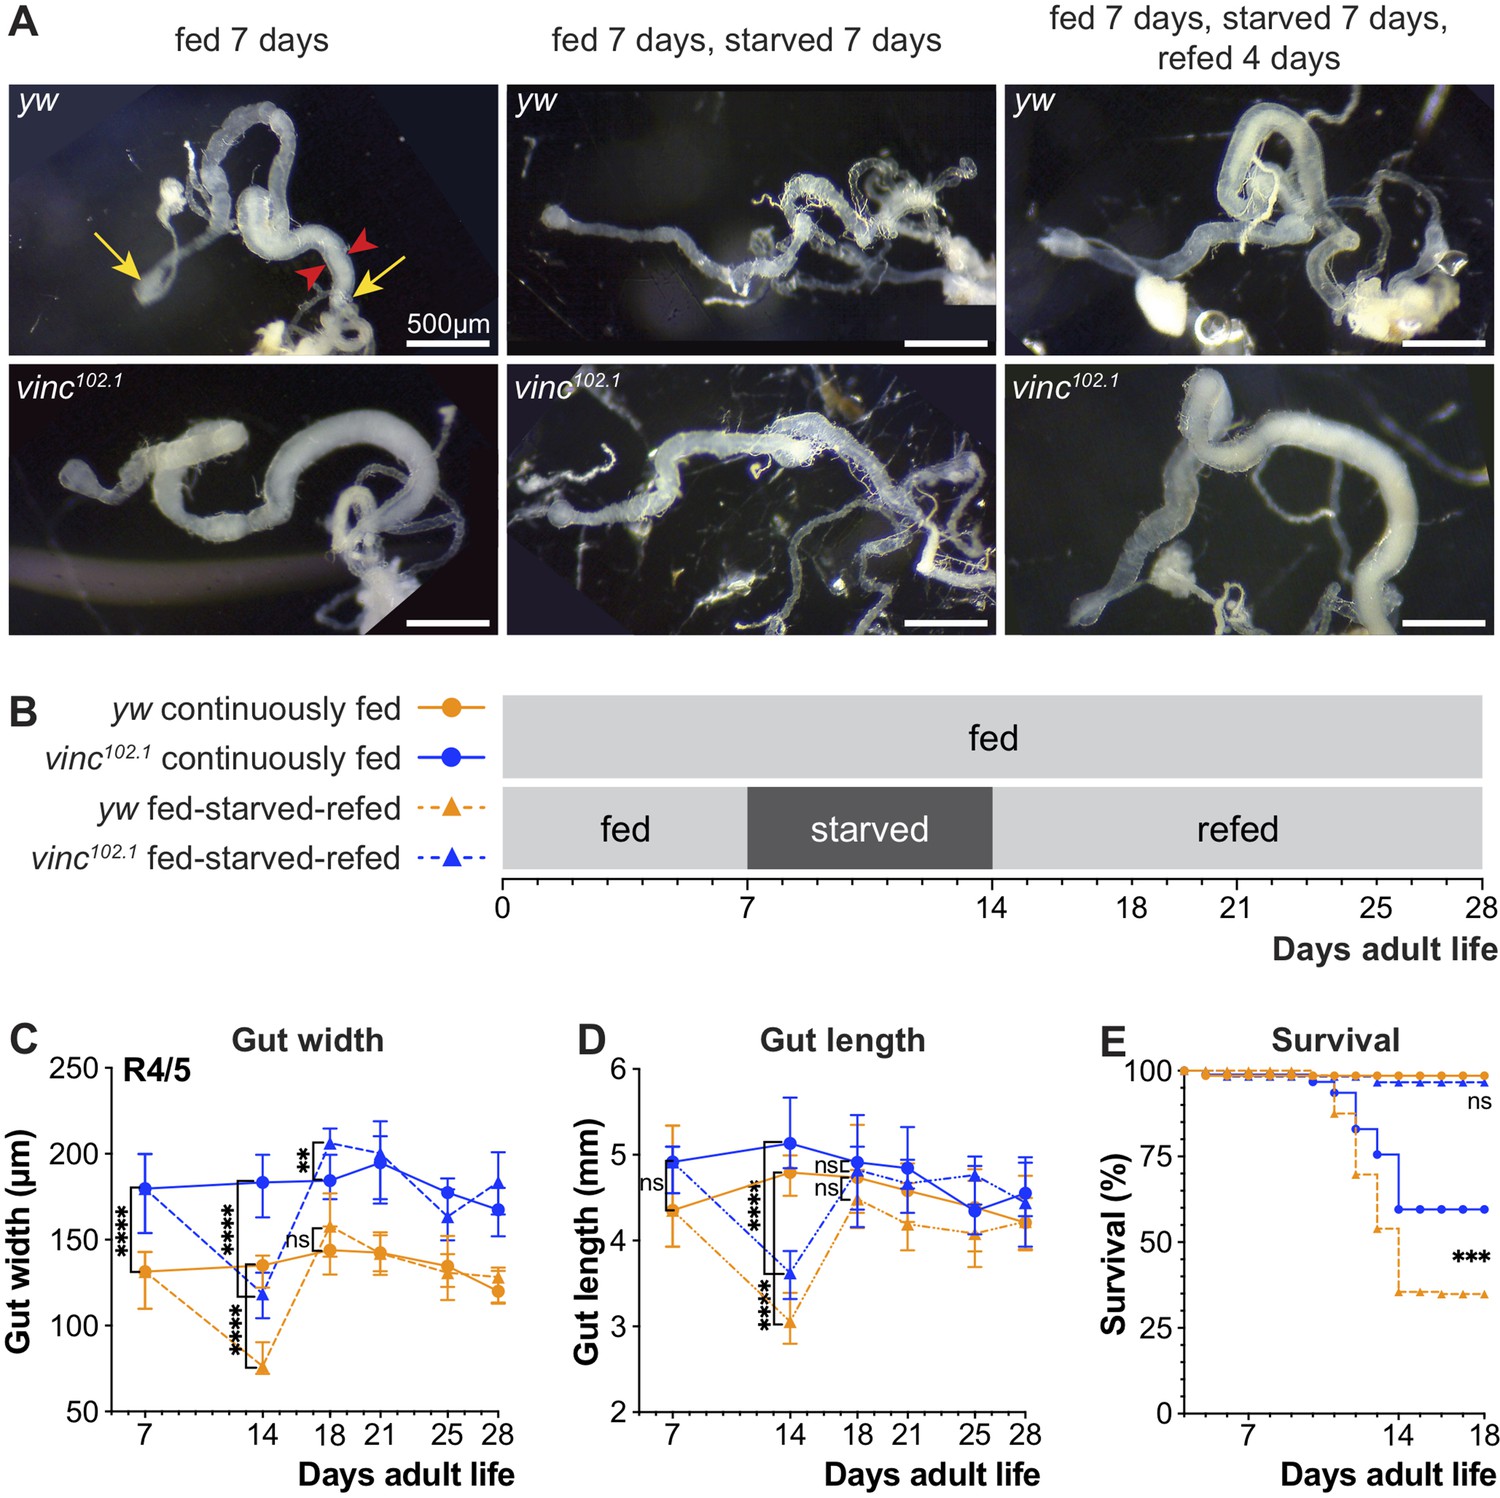
Loss of vinculin activity promotes survival following a period of starvation.
(A) Gross midgut size changes during feeding, starving and refeeding. Gut width was recorded at the R4/5 position (arrowheads). (B) Schematic of the feeding regime. Flies from each genotype and condition were dissected and midgut length and width measured at indicated days. (C) Following 7 days of starvation, R4/5 midgut width is significantly narrower in fed-starved compared to continuously fed flies for both yw and vinc102.1. yw midgut width recovers after 4 days of refeeding, however, vinc102.1 midgut width of fed-starved-refed flies exceeds that of continuously fed flies at this time point, before reverting back to original gut width. Symbols represent the median of 8–23 midguts measured, error bars indicate interquartile range. (D) Following 7 days of starvation, gut length (distance from proventriculus to Malpighian tubule attachment site, yellow arrows (A)) is significantly shorter in fed-starved compared to continuously fed flies for both yw and vinc102.1. Midgut length recovers after 4 days of refeeding. Symbols represent the median of 8–23 midguts measured, error bars indicate interquartile range. (E) Survival during cycle of feeding, starving, and refeeding as shown in (B). After the third day of starvation considerable death is experienced by both yw and vinc102.1 flies, with yw showing the poorest survival. After transfer to refed conditions, remaining starved flies survive well. p-values for gut length and width were obtained using a two-tailed Mann-Whitney test. p-values for lifespan were obtained using a Log-rank test. ns: not significant, ****p<0.0001, ***p<0.001, **p<0.01.
-
Figure 8—figure supplement 1—source data 1
Raw data for Figure 8—figure supplement 1.
- https://cdn.elifesciences.org/articles/72836/elife-72836-fig8-figsupp1-data1-v1.xlsx
Additional files
-
Transparent reporting form
- https://cdn.elifesciences.org/articles/72836/elife-72836-transrepform1-v1.pdf
-
Supplementary file 1
List of experimental genotypes used throughout the figures.
- https://cdn.elifesciences.org/articles/72836/elife-72836-supp1-v1.xlsx
Download links
A two-part list of links to download the article, or parts of the article, in various formats.
Downloads (link to download the article as PDF)
Open citations (links to open the citations from this article in various online reference manager services)
Cite this article (links to download the citations from this article in formats compatible with various reference manager tools)
Vinculin recruitment to α-catenin halts the differentiation and maturation of enterocyte progenitors to maintain homeostasis of the Drosophila intestine
eLife 11:e72836.
https://doi.org/10.7554/eLife.72836


