Heavy isotope labeling and mass spectrometry reveal unexpected remodeling of bacterial cell wall expansion in response to drugs
- Centre de Recherche des Cordeliers, INSERM, Sorbonne Université, Université Paris Cité., France
- Robustesse et Evolvabilité de la vie, Institut Cochin, Université de Paris, INSERM U1016, CNRS UMR 8104, France
- PAPPSO, Université Paris-Saclay, INRAE, CNRS, France
Figures
Figure 1 with 3 supplements
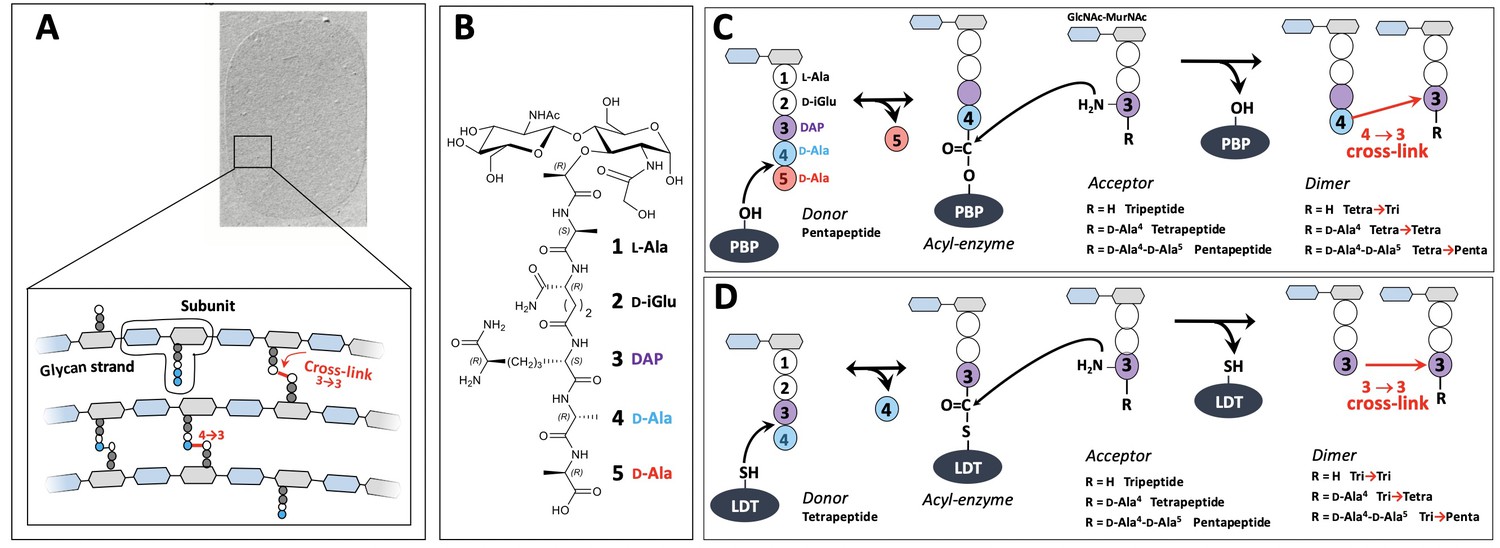
Structure and biosynthesis of Escherichia coli peptidoglycan.
(A) Structure of peptidoglycan. The net-like macromolecule is made of glycan strands cross-linked by short peptides. The polymerization of peptidoglycan involves glycosyltransferases that catalyze the elongation of glycan strands and transpeptidases that form 4→3 or 3→3 cross-links. (B) Structure of the peptidoglycan subunit. The stem peptide is assembled in the cytoplasm as a pentapeptide, L-Ala1-D-iGlu2-DAP3-D-Ala4-D-Ala5, in which D-iso-glutamic acid (D-iGlu) and diaminopimelic acid (DAP) are connected by an amide bond between the γ-carboxyl of D-iGlu and the L stereo-center of DAP. (C) Formation of 4→3 cross-links. Active-site Ser transpeptidases belonging to the penicillin-binding protein (PBP) family catalyze the formation of 4→3 cross-links connecting the carbonyl of D-Ala at the 4th position of an acyl donor stem peptide to the side-chain amino group of DAP (D stereo-center) at the 3rd position of an acyl acceptor stem peptide. A pentapeptide stem is essential in the donor substrate to form the acyl enzyme intermediate. The acyl acceptor potentially harbors a tripeptide, a tetrapeptide, or a pentapeptide stem leading to the formation of Tetra-Tri, Tetra-Tetra, or Tetra-Penta dimers, respectively. (D) Formation of 3→3 cross-links. Active-site Cys transpeptidases belonging to the L,D-transpeptidase (LDT) family catalyze the formation of 3→3 cross-links connecting two DAP residues. LDTs are specific of tetrapeptide-containing donors.
Figure 1—figure supplement 1
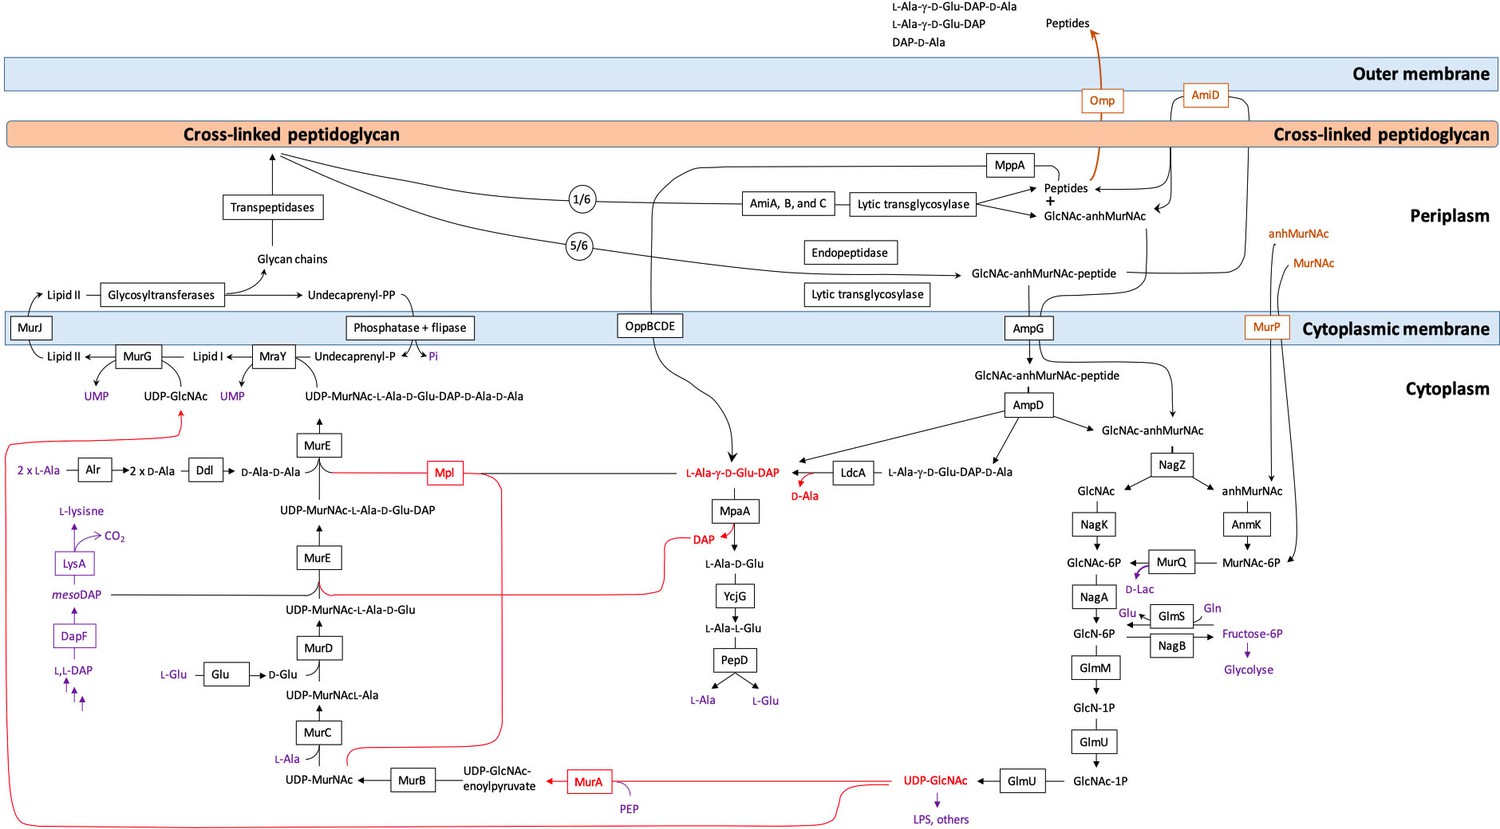
Synthesis and recycling of peptidoglycan in Escherichia coli.
Key intermediates connecting synthesis (on the left) to recycling (on the right) are figured in red. Metabolites common to peptidoglycan metabolism and to other metabolic pathways are figured in purple. Effective incorporation of diaminopimelic acid (DAP) from the culture medium requires inactivation of the genes encoding DapF and LysA generating lysine auxotrophy. Peptidoglycan turnover refers to the release of peptidoglycan fragments (<600 Da) into the culture medium by crossing the outer membrane through porins.
Figure 1—figure supplement 2
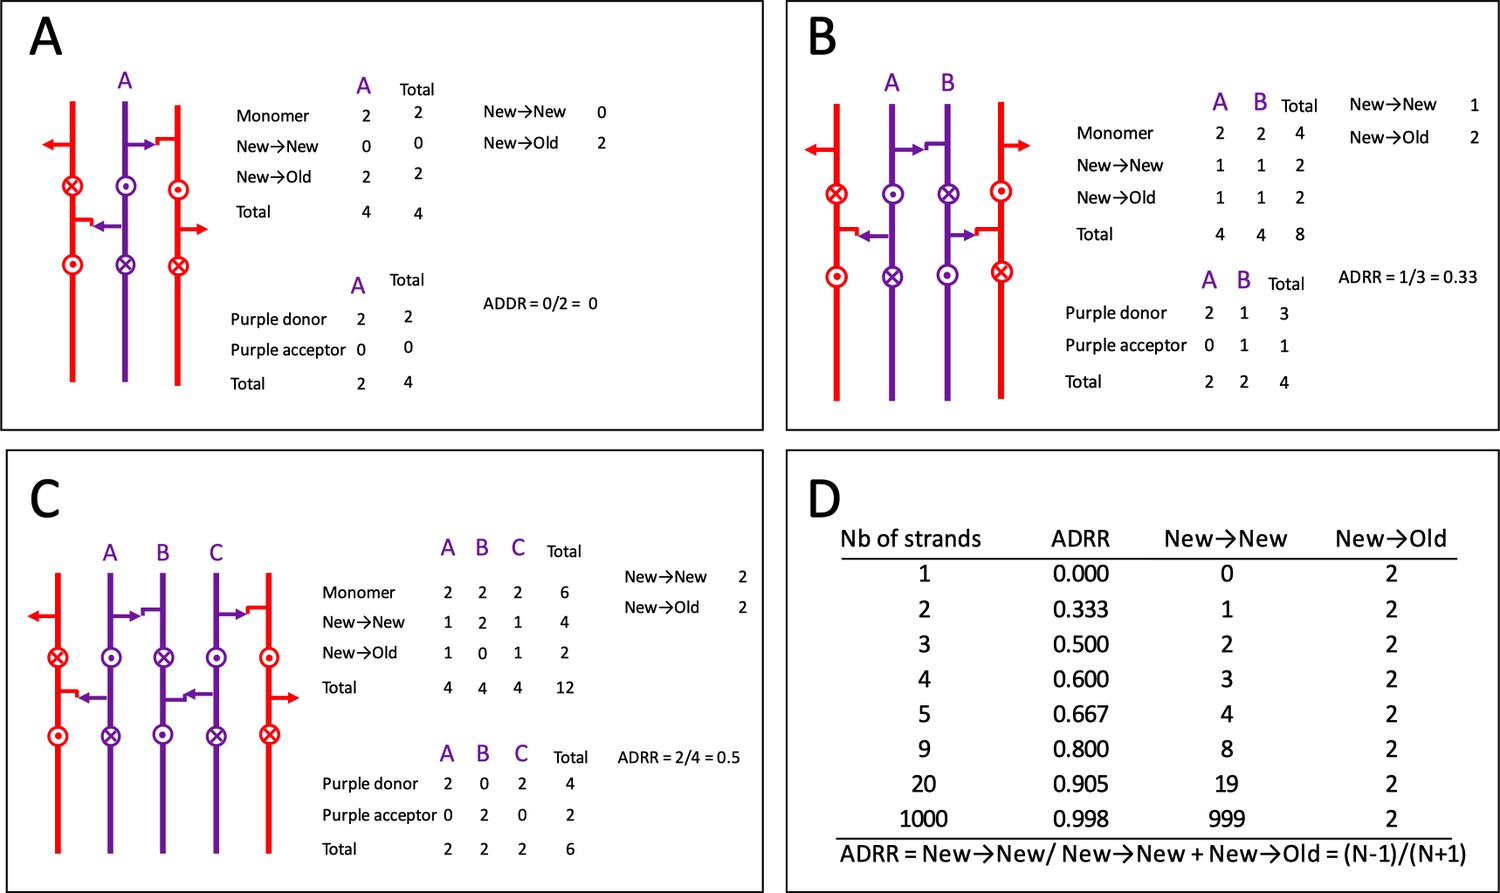
Acceptor-to-donor radioactivity ratio (ADRR) as a function of the number of glycan strands inserted at the same time in the peptidoglycan layer.
(A) One strand at a time. (B) Two strands at a time. (C) Three stands at a time (applies to the three-for-one model). (D) Calculation for various numbers of strands. Existing and neo-synthesized strands are figured in red and in purple, respectively. Donor and acceptor stems are represented by an arrow and by a hook, respectively. Uncross-linked peptide stems that protrude above and below the plan are indicated by circles with a dot or a cross, respectively.
Figure 1—figure supplement 3
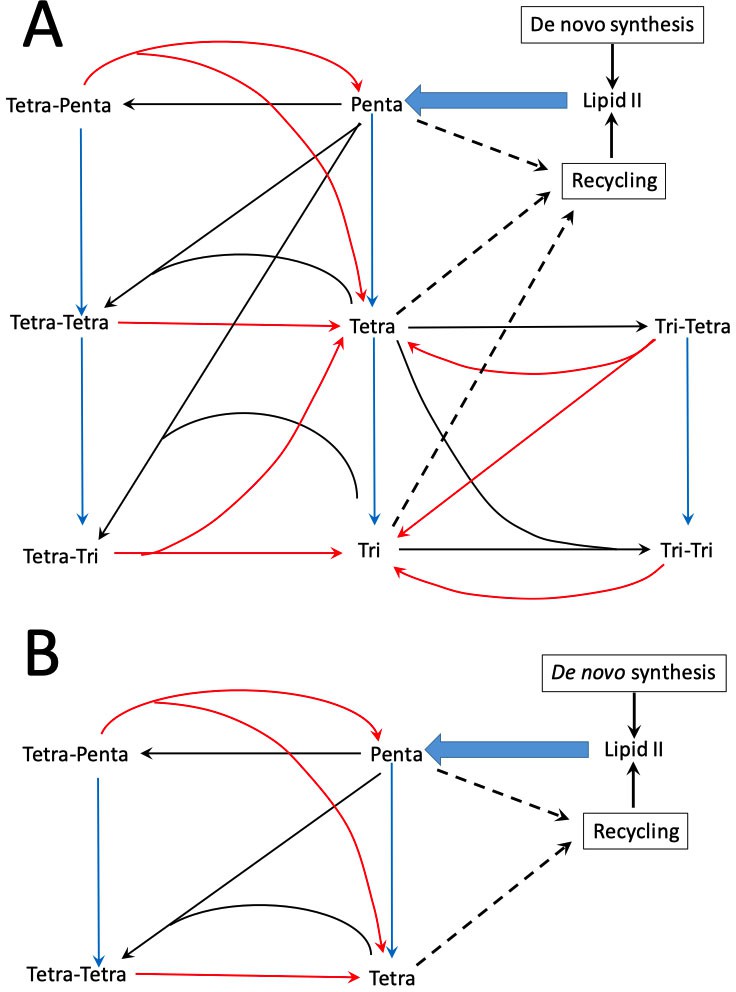
Peptidoglycan metabolism in Escherichia coli M1.5 (A) and Δ6ldt (B).
The reactions catalyzed by transpeptidases (formation of cross-links), endopeptidases (hydrolysis of cross-links), and carboxypeptidases (hydrolysis of C-terminal D-Ala4 and D-Ala5 are indicated by black, red, and blue arrows, respectively). PG is polymerized from a single precursor, Lipid II originates from de novo synthesis and from recycling. This lipid consists of the disaccharide-pentapeptide subunit linked to the lipid carrier (undecaprenyl) by a pyrophosphate bond.
Figure 2 with 2 supplements
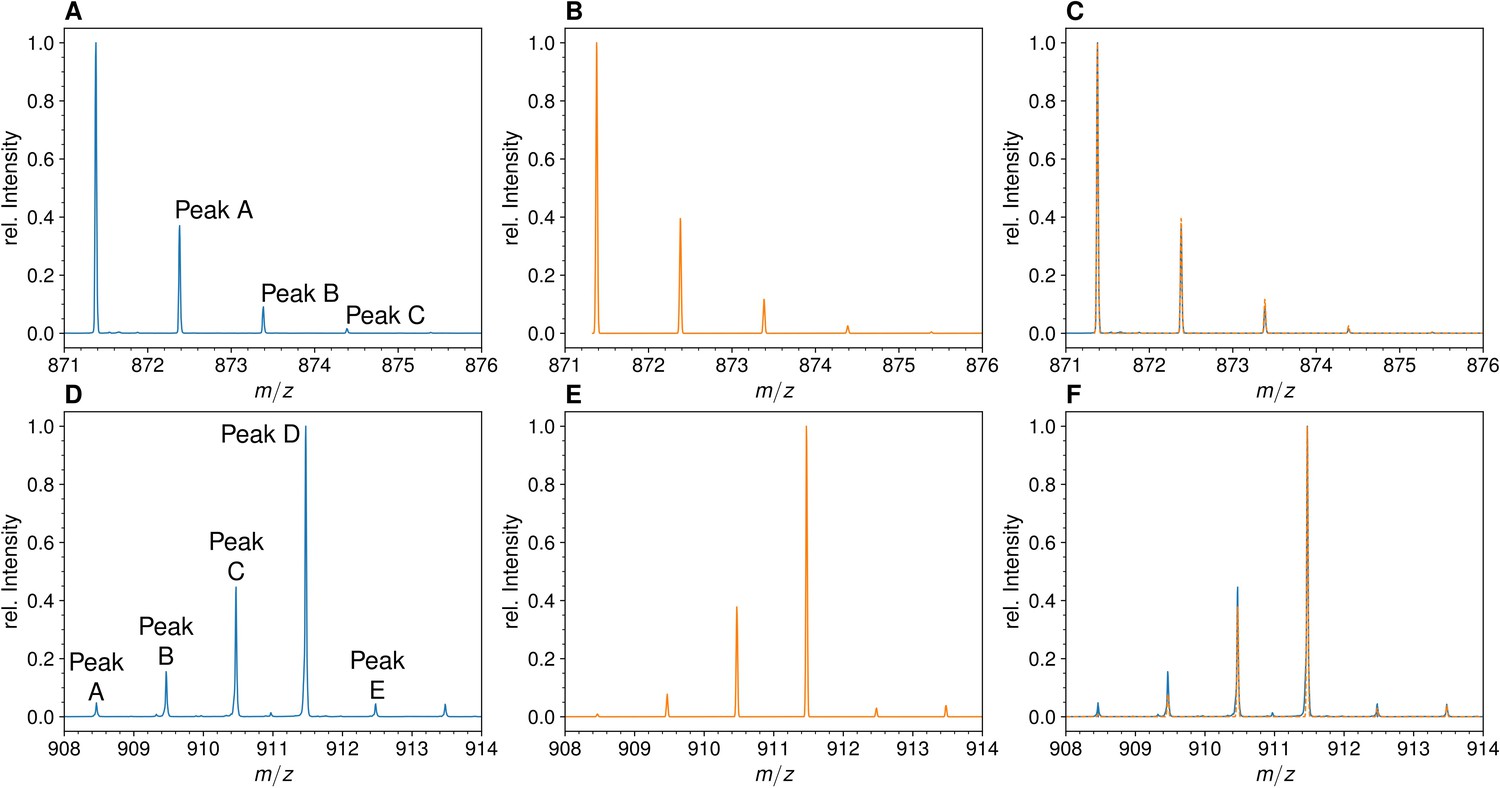
Mass spectra of the unlabeled and fully labeled disaccharide-tripeptide monomers.
(A) Experimental mass spectrum of the mono-protonated ([M+H]+) disaccharide-tripeptide (C34H58N6O20•H+) extracted from Escherichia coli M1.5 grown in unlabeled M9 minimal medium. (B) Simulated spectrum obtained for the natural abundance of carbon and nitrogen isotopes. (C) Overlay of the spectra in A and B. (D) Observed mass spectrum of the GlcNAc-MurNAc-tripeptide purified from the peptidoglycan of E. coli M1.5 grown in the labeled M9 minimal medium. (E) Simulated mass spectrum obtained for 99% 13C and 15N labeling. (F) Overlay of spectra in D and E. GlcNAc, N-acetylglucosamine; MurNAc, N-acetyl muramic acid.
Figure 2—figure supplement 1
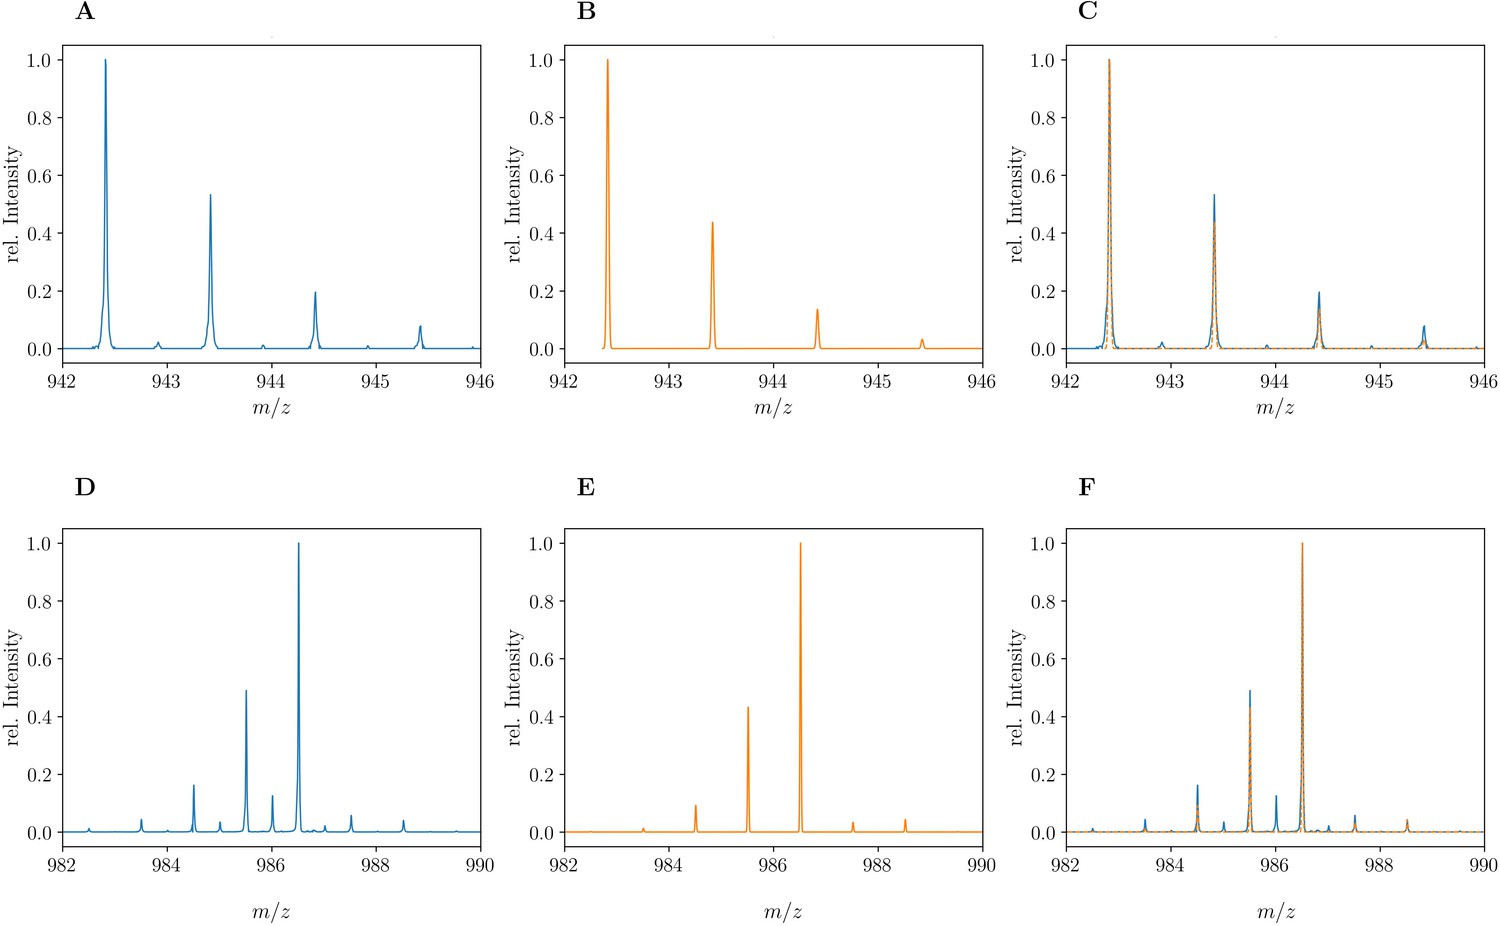
Mass spectra of the unlabeled and fully labeled disaccharide-tetrapeptide monomers.
(A) Experimental mass spectrum of the mono-protonated ([M+H]+) disaccharide-tetrapeptide (C37H63N7O21•H+) extracted from Escherichia coli M1.5 grown in unlabeled M9 minimal medium. (B) Simulated spectrum obtained for the natural abundance of carbon and nitrogen isotopes. (C) Overlay of the spectra in A and B. (D) Observed mass spectrum of the GlcNAc-MurNAc-tetrapeptide purified from the peptidoglycan of E. coli M1.5 grown in the labeled M9 minimal medium. (E) Simulated mass spectrum obtained for 99% 13C and 15N labeling. (F) Overlay of spectra in D and E. The additional peaks of low intensity in the experimental spectra, in particular for the labeled disaccharide-tetrapeptide, correspond to the [2M+2H]2+ ion. GlcNAc, N-acetylglucosamine; MurNAc, N-acetyl muramic acid.
Figure 2—figure supplement 2
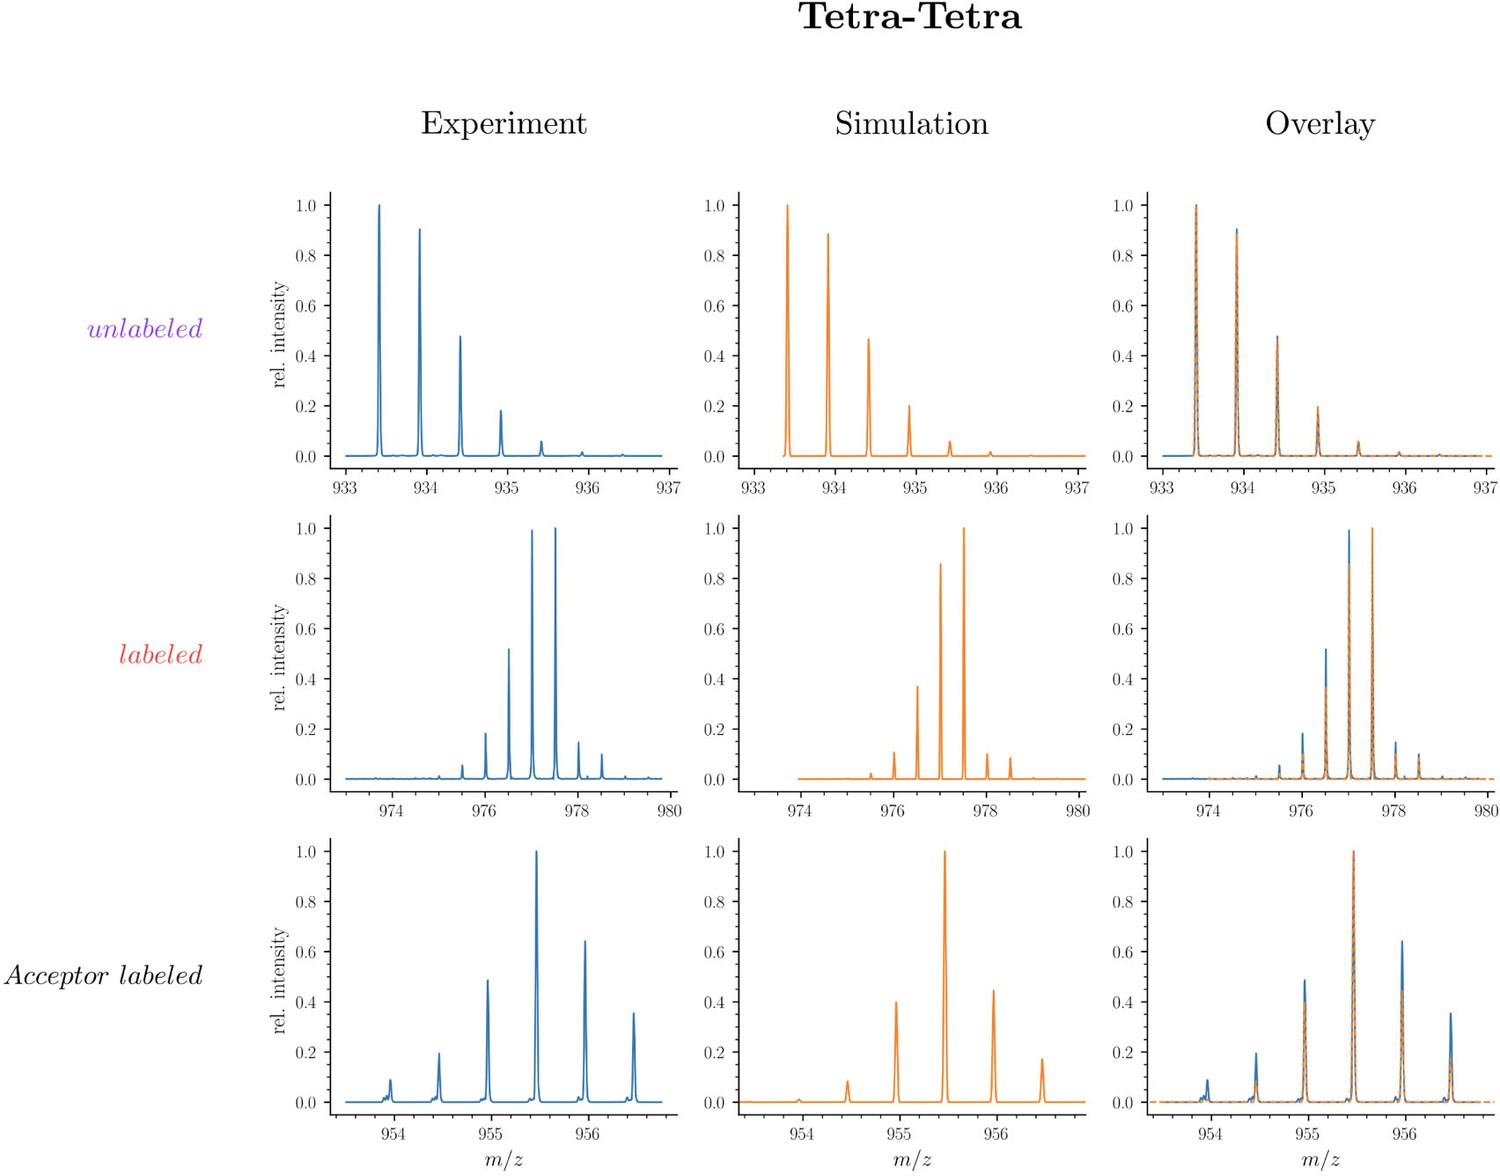
Mass spectra of unlabeled and fully labeled Tetra→Tetra dimer.
Figure 3
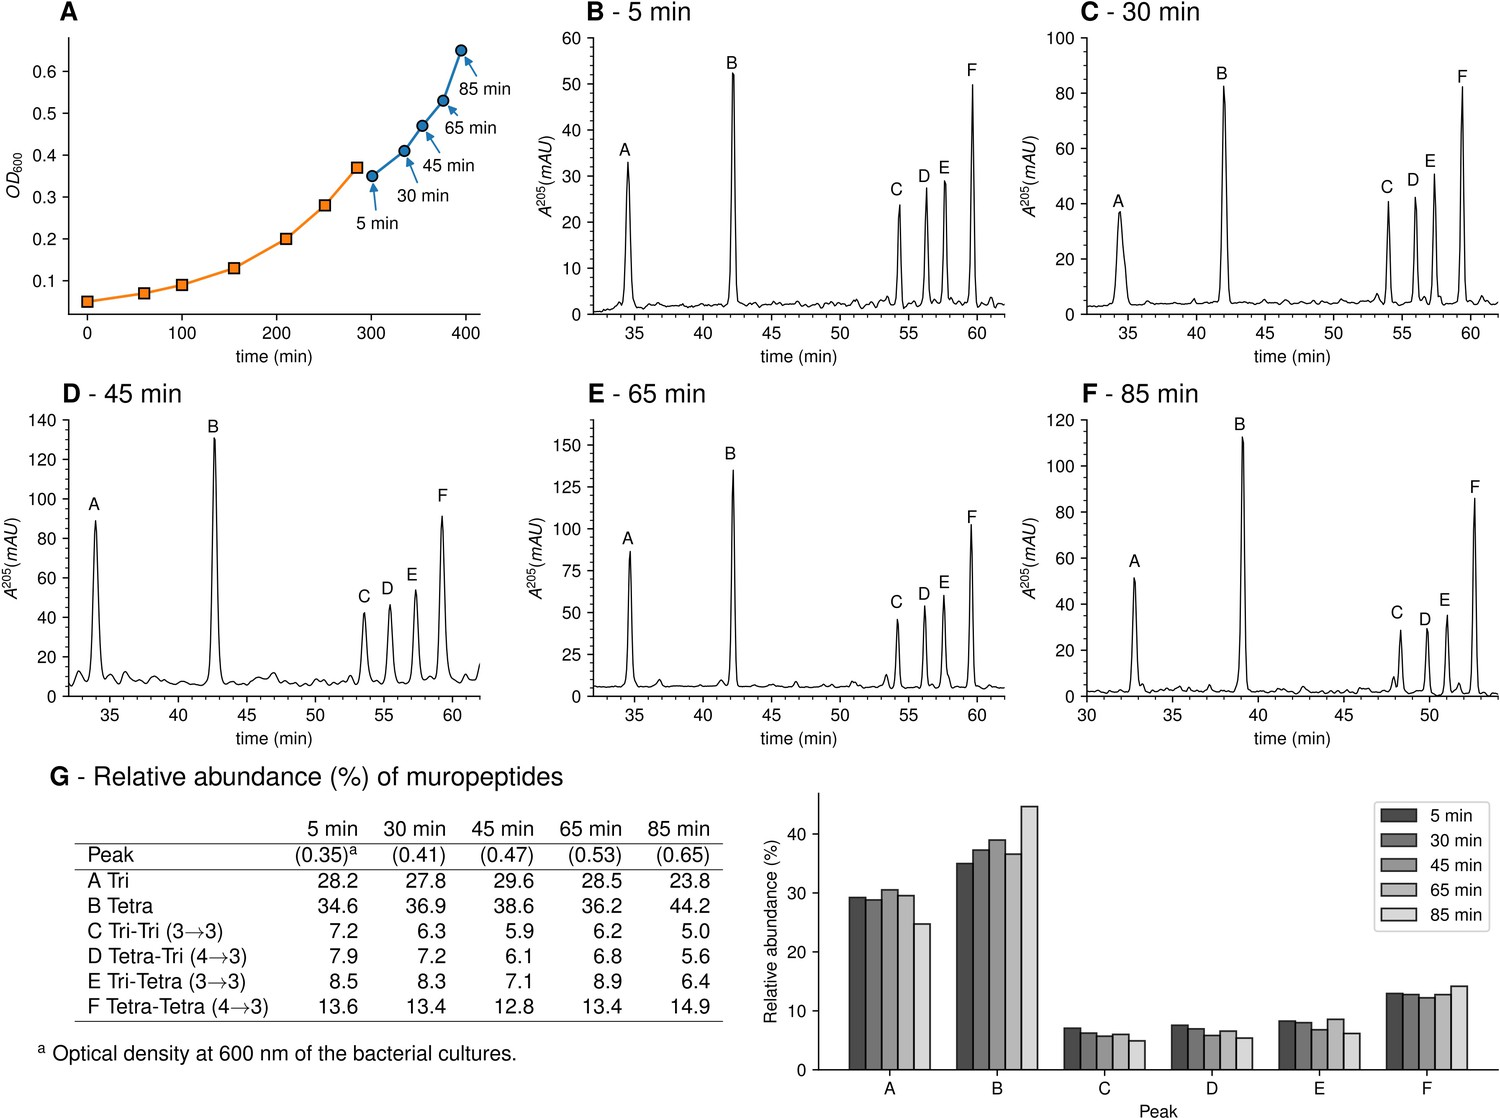
Muropeptide profile of peptidoglycan extracted from Escherichia coli M1.5 after the medium switch.
(A) E. coli M1.5 was inoculated in the labeled minimal medium and bacterial growth was monitored by determining the OD600 (orange curve, squares). When the optical density reached 0.4, bacteria were collected by centrifugation, resuspended in the unlabeled minimum medium, incubation was continued (blue curve), and samples were withdrawn at 5, 30, 45, 65, and 85 min (circles). (B) to (F) Peptidoglycan was extracted from these five culture samples, digested with muramidases, and the resulting muropeptides were separated by rpHPLC. (G) Identification and relative abundance of muropeptides in the major chromatographic peaks.
Figure 4 with 2 supplements
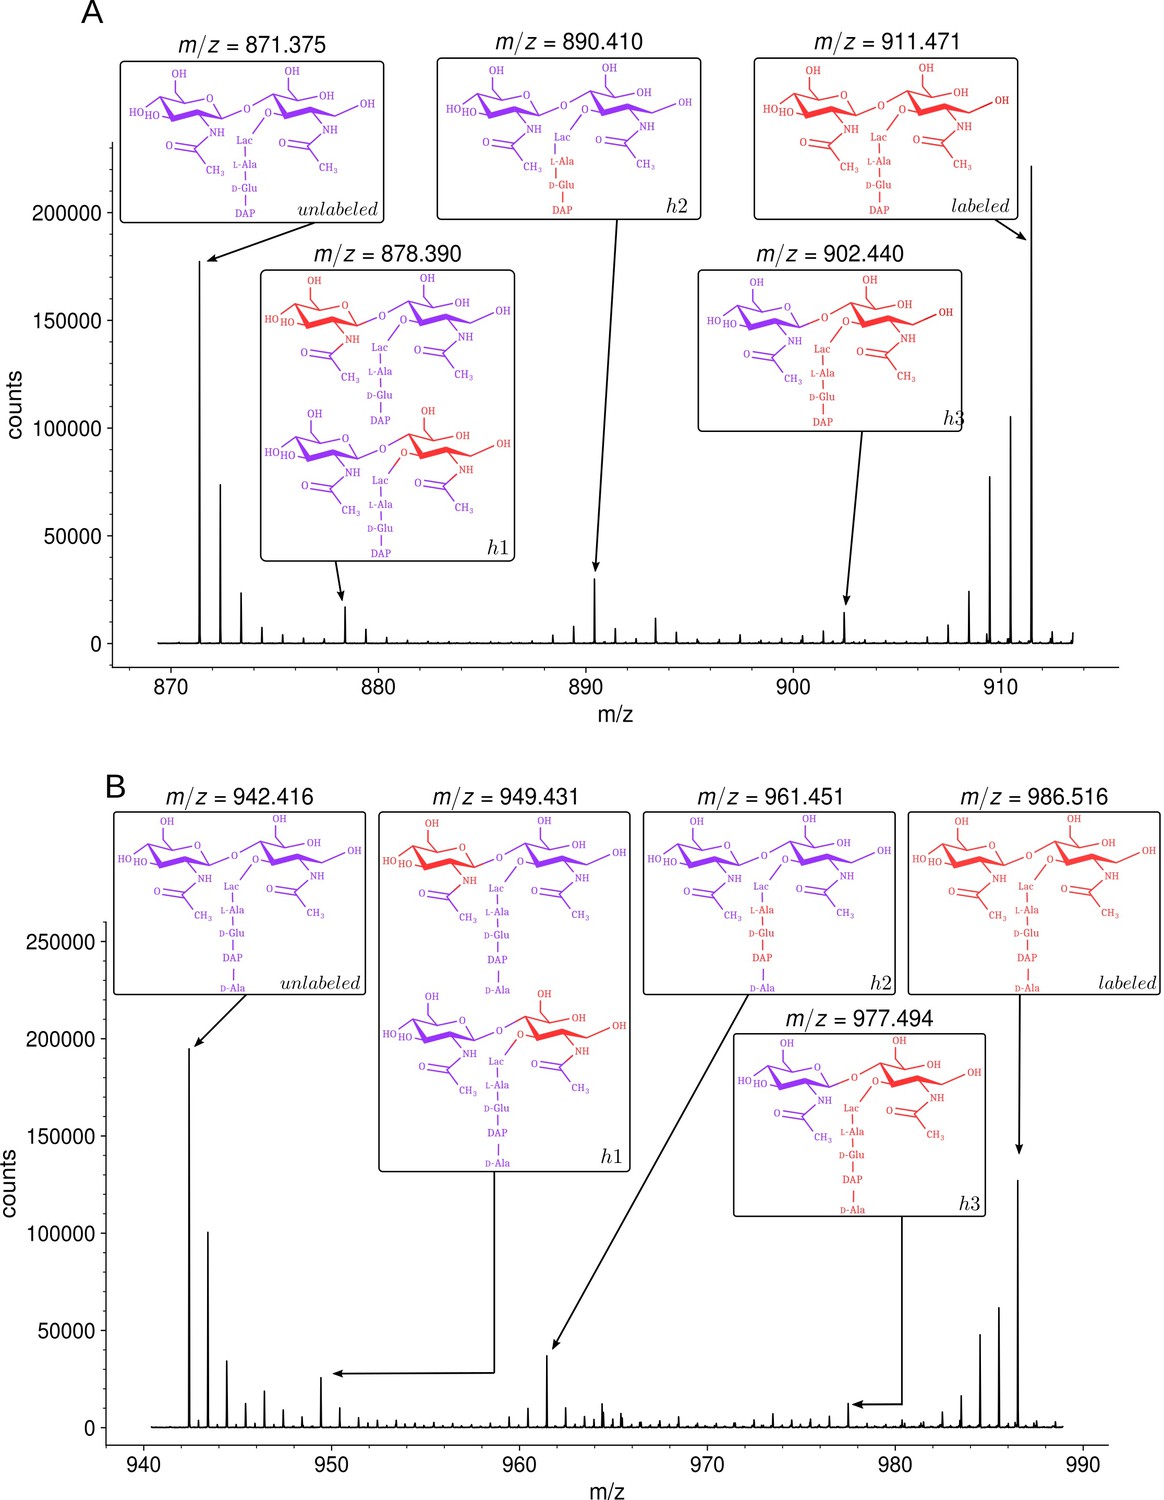
Isotopic composition of monomers isolated from the peptidoglycan of Escherichia coli M1.5 after the medium switch.
(A) Mass spectrum obtained for the GlcNAc-MurNAc-tripeptide monomer recovered in peak A of the chromatogram in Figure 3D. (B) Mass spectrum obtained for the GlcNAc-MurNAc-tetrapeptide monomer recovered in peak B of the chromatogram in Figure 3D. Purple and red colors indicate the unlabeled (12C and 14N) and labeled (13C and 15N) isotopic content of the amino acid and sugar residues of the monomers, respectively. GlcNAc, N-acetylglucosamine; MurNAc, N-acetyl muramic acid.
Figure 4—figure supplement 1
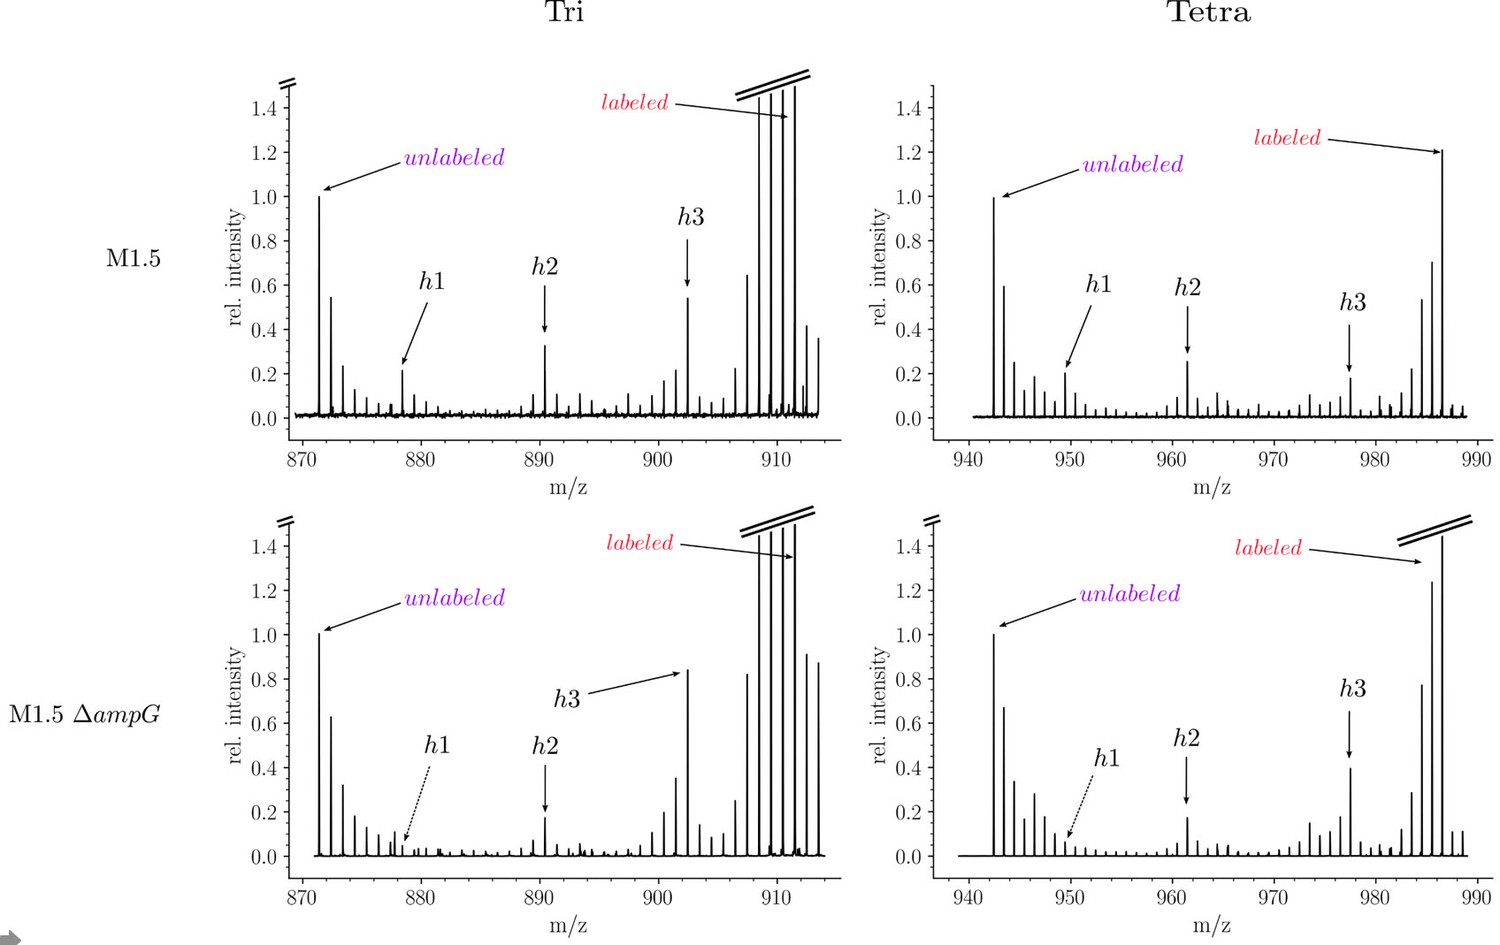
Isotopic composition of monomers isolated from the peptidoglycan of Escherichia coli M1.5 and a recycling-deficient derivative obtained by deletion of the ampG permease gene.
Figure 4—figure supplement 2
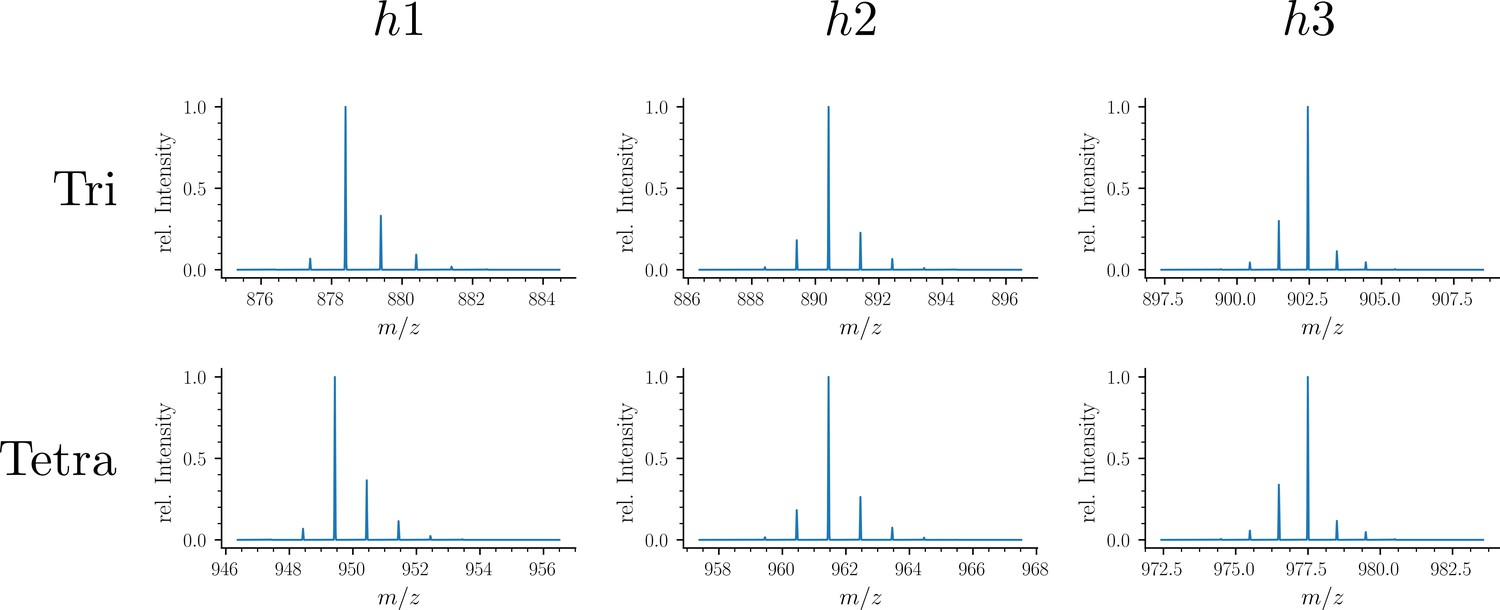
Simulated spectra of hybrid monomers.
Figure 5
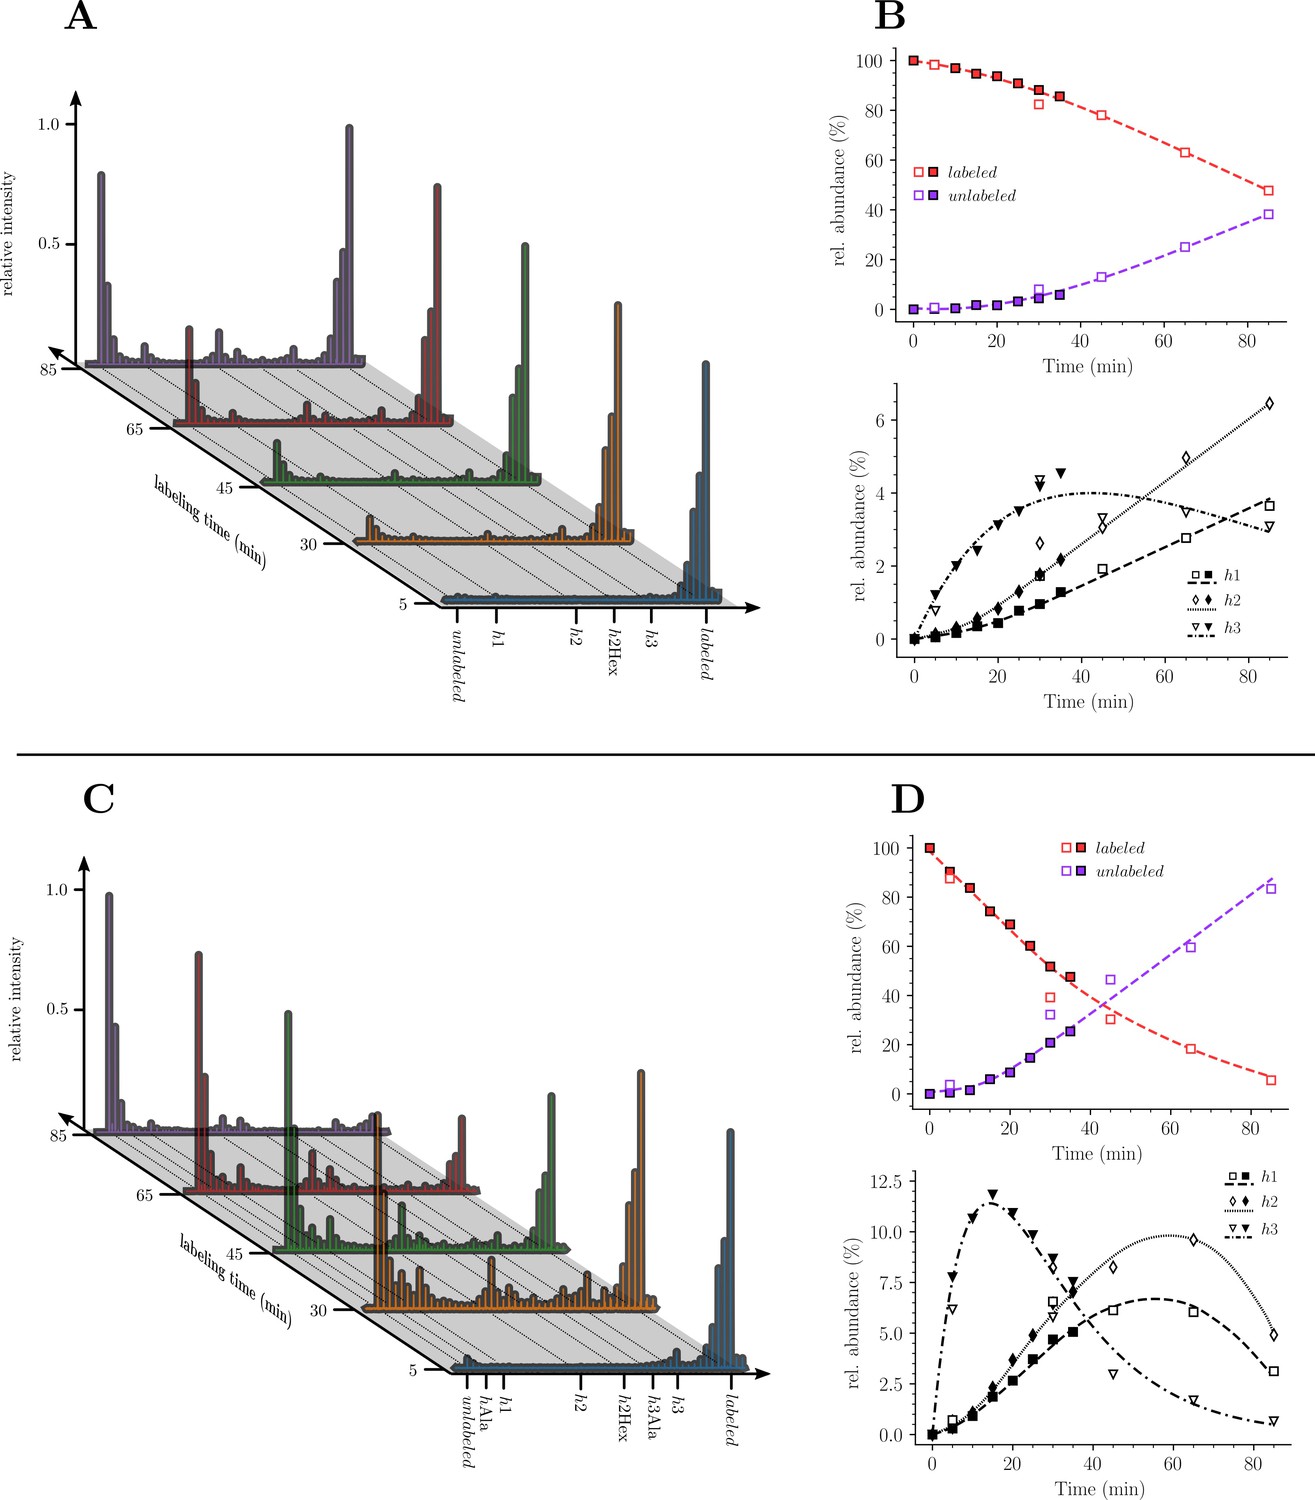
Kinetics analysis of the proportion of isotopologue monomers in the peptidoglycan of strain M1.5.
(A) and (C), Mass spectra of disaccharide-tripeptide and disaccharide-tetrapeptide from bacteria collected at 5, 30, 45, 65, 85 min after the medium switch. (B) and (D), Kinetics analysis of the ratios of isotopologues calculated from relative ion current intensities for the disaccharide-tripeptide and disaccharide-tetrapeptide, respectively. The upper panels show the evolution of the relative abundance of uniformly labeled and unlabeled monomers. The lower panels present the evolution of the relative abundance of hybrids relative to the complete set of monomers. The open and solid symbols are the results from two biological repeats. See Supplementary data for the complete assignment of hybrid structures. The curves are interpolations (Virtanen et al., 2020).
Figure 6 with 3 supplements

Structure of Tri→Tri isotopologues in the peptidoglycan of strain M1.5 grown in the absence of β-lactams.
Mass spectrum highlighting the 10 major isotopologues. Structure of the 10 major isotopologues. The observed (obs) and calculated (cal) m/z values of the ions of interest (Ion) and the difference in part per million (ppm) between these values are indicated. New (neo-synthesized) unlabeled moieties of isotopologues are indicated in purple. Old (existing) labeled moieties of isotopologues are indicated in red. h1, h2, and h3 (in red) refer to recycled moieties originating from existing labeled peptidoglycan (h1 and h2) or from the existing (labeled) UDP-MurNAc-pentapeptide pool as described in Figure 4. The origin of the donor and acceptor participating in the cross-linking reaction, new (neo-synthesized) or old (existing in the cell wall), are indicated in purple and red, respectively. The relative abundance of the isotopologues (%) was deduced from the relative intensity of peaks corresponding to [M+2 H]2+ ions as labeled in the upper panel. Abbreviations: h1, hybrid containing a recycled glucosamine moiety; h2, hybrid containing a recycled tripeptide moiety; h3, hybrid containing a labeled MurNAc-tripeptide moiety originating from the existing UDP-MurNAc-pentapeptide pool. NA, not applicable, as the sodium adduct was not taken into consideration.
Figure 6—figure supplement 1

Structure of Tetra→Tri isotopologues in the peptidoglycan of strain M1.5 grown in the absence of β-lactams.
Figure 6—figure supplement 2
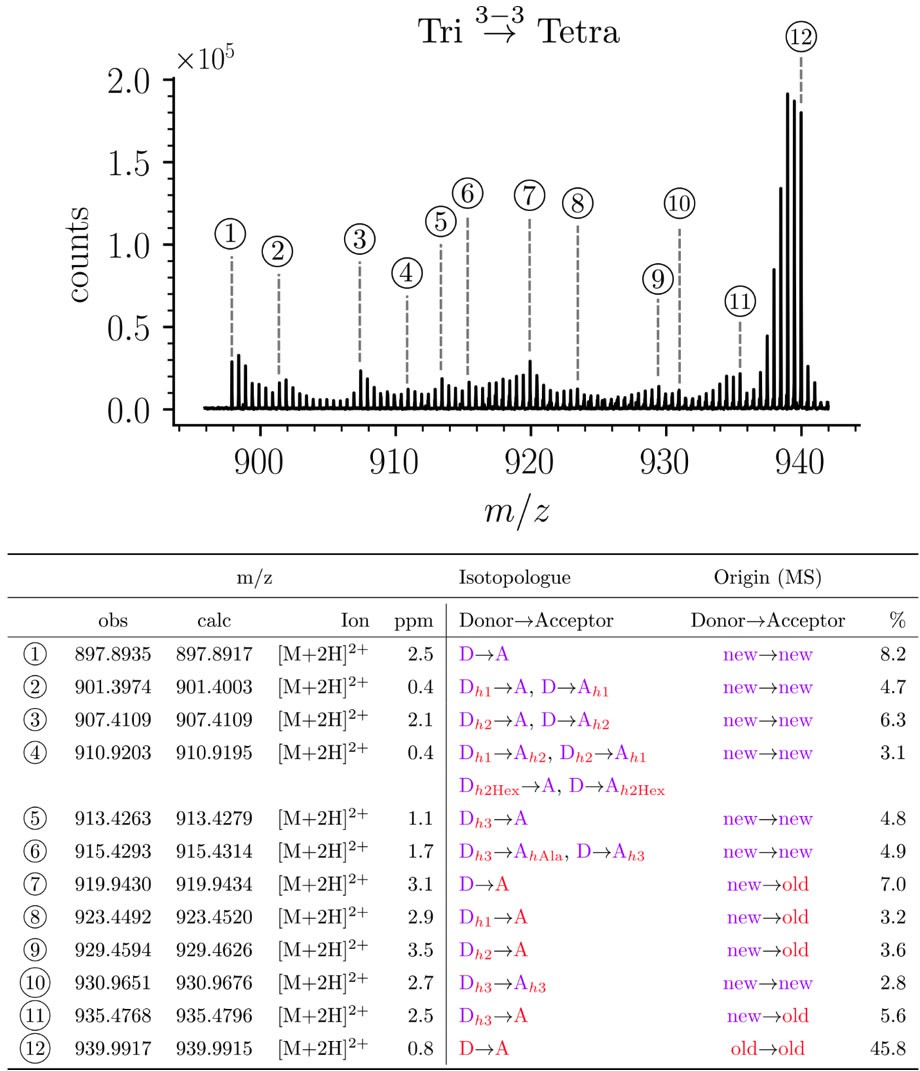
Structure of Tri→Tetra isotopologues in the peptidoglycan of strain M1.5 grown in the absence of β-lactams.
Figure 6—figure supplement 3
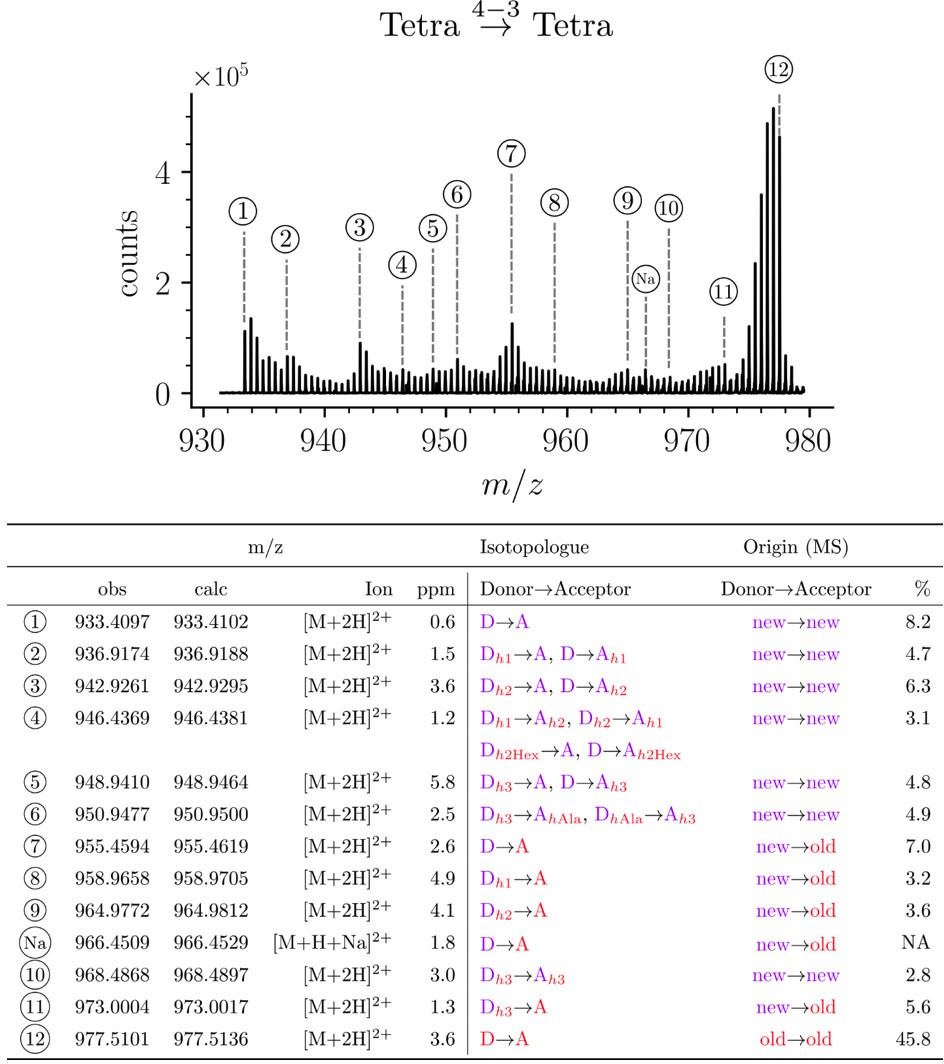
Structure of Tetra→Tetra isotopologues in the peptidoglycan of strain M1.5 grown in the absence of β-lactams.
Figure 7

Mode of cross-linking of de novo synthesized peptidoglycan subunits in Escherichia coli M1.5 grown in the absence of β-lactam.
For each dimer (A), (B), (C), and (D), the relative abundance (rel. abundance) was calculated for isotopologues originating from cross-linking of (i) two existing stems (old→old; red), (ii) a new donor stem (i.e. a stem synthesized after the medium switch) and an existing acceptor stem (new→old; gray), and (iii) two new stems (new→new; purple). The calculations take into account the contribution of de novo synthesized stems originating from recycled moieties and from the labeled UDP-MurNAc-pentapeptide pool as described in Figure 6 and in Figure 6—figure supplements 1–3 for the Tri→Tri, Tetra→Tri, Tri→Tetra, and Tetra→Tetra dimers, respectively. The open and closed symbols correspond to data from two independent experiments. The curves are interpolations (Virtanen et al., 2020).
Figure 8 with 4 supplements
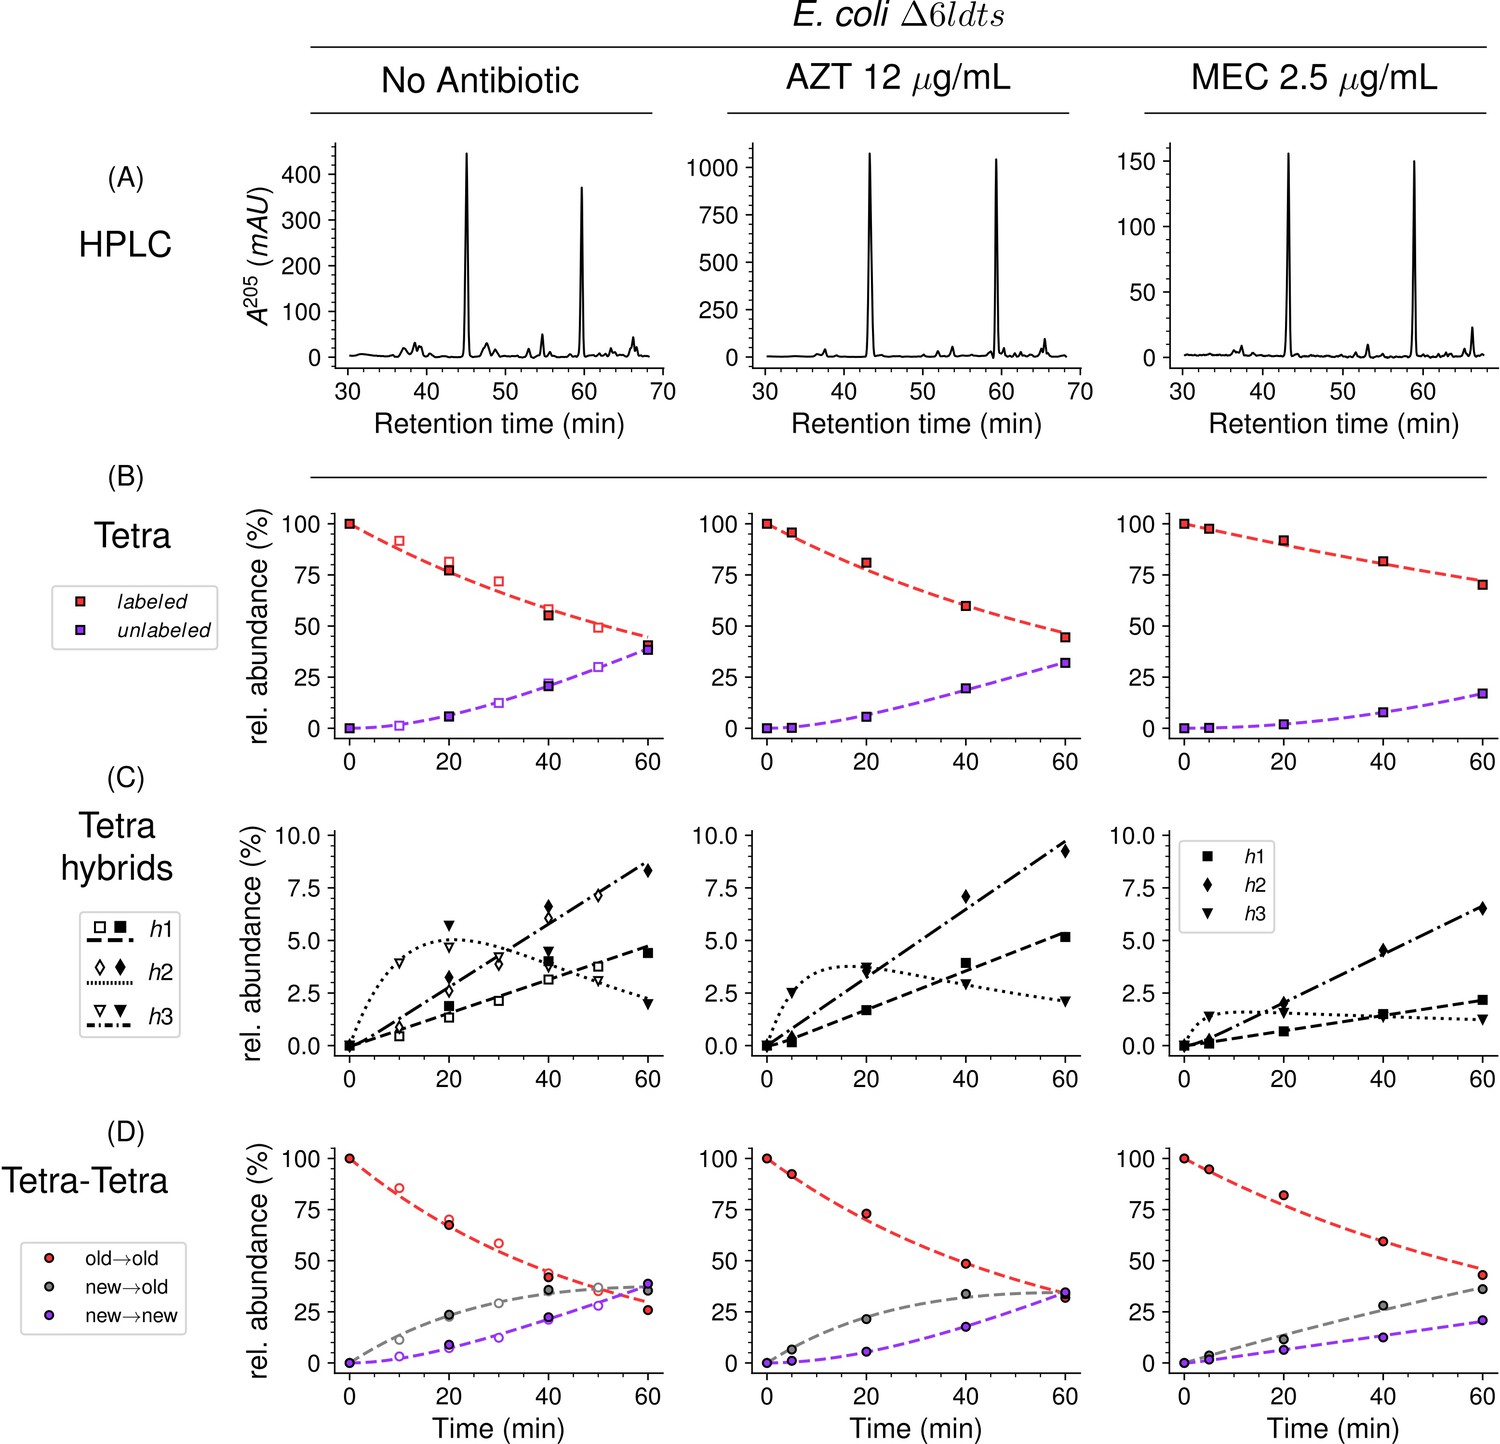
Mode of insertion of peptidoglycan subunits in the absence of L,D-transpeptidases and impact of the inhibition of penicillin-binding proteins (PBPs) by aztreonam and mecillinam.
(A) Muropeptide rpHPLC profile of PG from Escherichia coli strain Δ6ldt grown in the absence of β-lactam or in the presence of aztreonam (AZT) or mecillinam (MEC). Kinetic data were collected for fully labeled (red), fully unlabeled (purple) tetrapeptide monomers (Tetra) (B) and hybrids (C) defined in Figure 6—figure supplement 3. For the Tetra→Tetra dimer (D), the relative abundance (rel. abundance) was calculated for isotopologues originating from cross-linking of (i) two existing stems (old→old; red), (ii) a new donor stem (i.e. a stem synthesized after the medium switch) and an existing acceptor stem (new→old; gray), and (iii) two new stems (new→new; purple). The calculations take into account the contribution of de novo synthesized stems originating from recycled moieties and from the labeled UDP-MurNAc-pentapeptide pool. The open and closed symbols correspond to data from two independent experiments. The curves are interpolations (Virtanen et al., 2020).
Figure 8—figure supplement 1
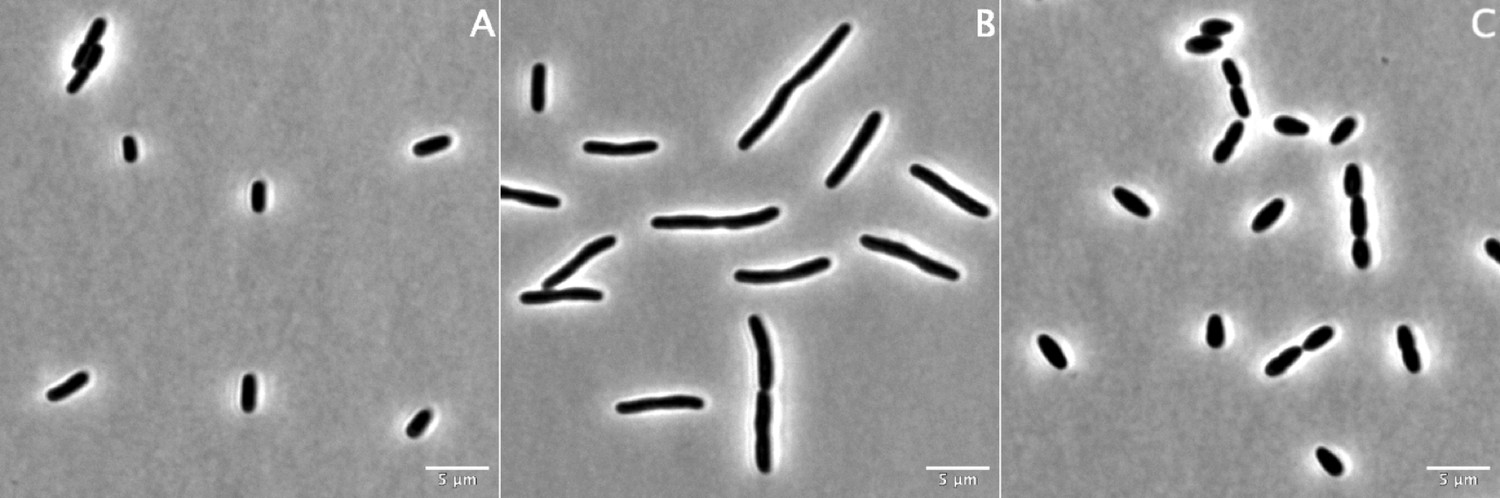
100× phase contrast images of strain BW25113 grown for 60 min in the absence of β-lactams (A) or in the presence of aztreonam at 12 µg/mL (B) or mecillinam at 2.5 µg/mL (C).
Figure 8—figure supplement 2
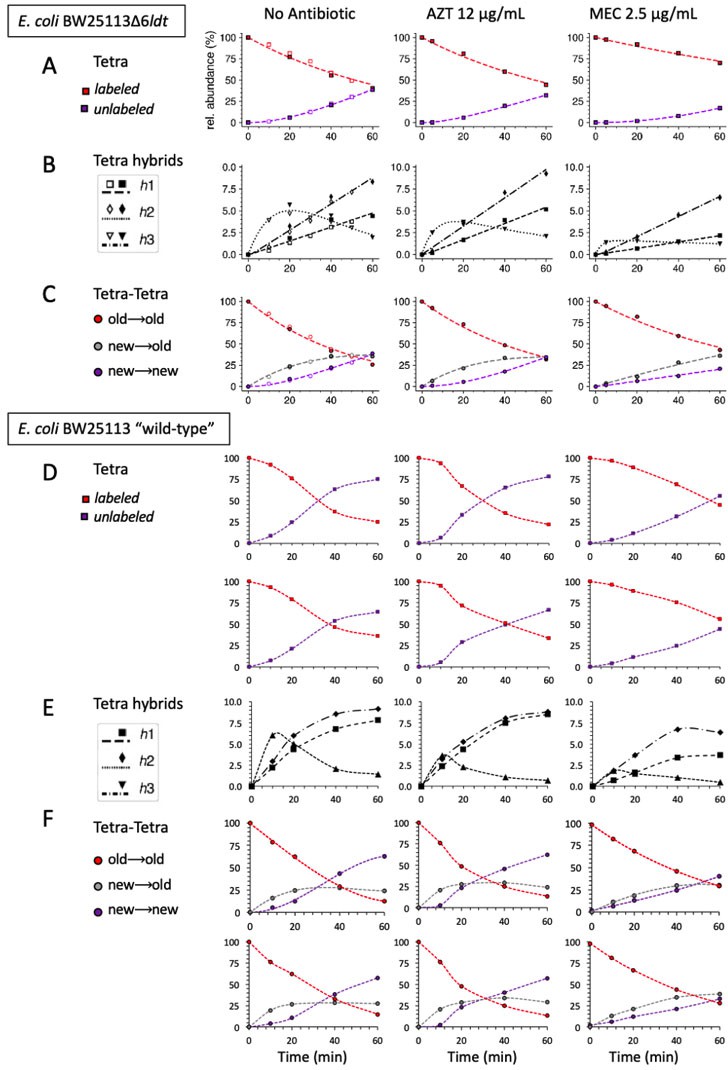
Comparison of the mode of insertion of peptidoglycan subunits in Escherichia coli strain Δ6ldt that does not produce any L,D-transpeptidase (A), (B), and (C) and in the parental ‘wild-type’ strain BW25113 (D), (E), and (F).
Strains were grown in the absence of β-lactams or in the presence of either aztreonam (AZT) or mecillinam (MEC). The upper panels show the evolution of the relative abundance of labeled and unlabeled monomers (A and D) and of hybrid monomers defined in Figure 4. In panel (D), we also plotted, in a second row of graphs, the evolution of the combined relative abundance of tripeptides and tetrapeptides as the former is expected to originate at least in part from the removal of D-Ala from the tetrapeptide. Therefore, this plot provides a closer comparative estimate of monomers from strain BW25113Δ6ldt (tetrapeptide only) versus those from the parental ‘wild-type’ strain (tetrapeptides plus tripeptides). The evolution of the relative abundance of the Tetra→Tetra dimers is shown in panels (C) and (F) for strain BW25113Δ6ldt and for the parental ‘wild-type’ strain, respectively. The relative abundance was calculated for isotopologues originating from cross-linking of (i) two existing stems (old→old; red), (ii) a new donor stem (i.e. a stem synthesized after the medium switch) and an existing acceptor stem (new→old; gray), and (iii) two new stems (new→new; purple). The calculations take into account the contribution of de novo synthesized stems originating both from recycled moieties and from the labeled UDP-MurNAc-pentapeptide pool. The data obtained for strain BW25113Δ6ldt are those appearing in Figure 8 (open and closed symbols correspond to data from two independent experiments). The data obtained for strain BW25113 (‘wild-type’) are the means of 4 (10 min) or 2 (20, 40, 60 min) independent repeats. Panel F shows the combined relative abundance of Tetra→Tetra and Tetra→Tri as the latter may be generated by the removal of D-Ala from the former. The curves are interpolations (Virtanen et al., 2020). rel. abundance, relative abundance.
Figure 8—figure supplement 3
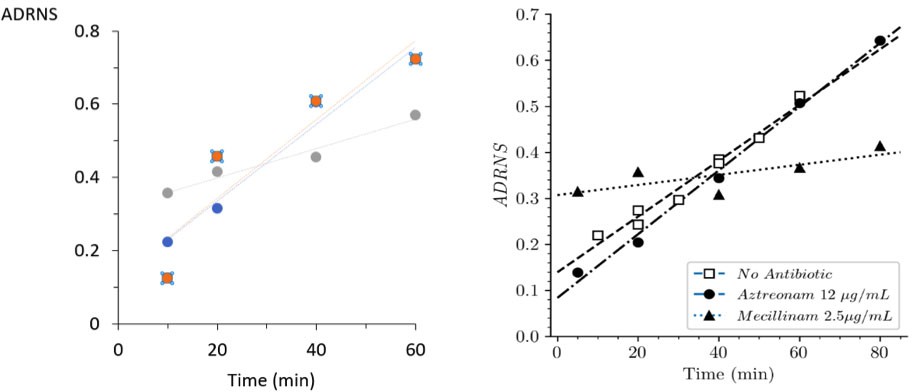
Acceptor-to-donor ratio of neo-synthesized stems (ADRNS) of 'wild-type' Escherichia coli BW25113 and strain Δ6ldt.
(A) Acceptor-to-donor ratios of neo-synthesized Tetra-Tetra dimer from parental ‘wild-type’ strain BW25113.
The ratios were computed for growth in the absence of β-lactam (blue), in the presence of aztreonam (orange) or of mecillinam (gray). The acceptor-to-donor ratio of neo-synthesized stems (ADRNS) values extrapolated for time = 0 min were 0.13, 0.13, and 0.32. (B) Data obtained for strain BW25113∆6ldt, as appearing in the main text (Figure 8), are included for comparison. The ADRNS values extrapolated for time = 0 min for this strain were 0.14, 0.08, and 0.31. This comparison indicates that the mode of insertion of new strands is similar in both strains, predominantly involving (i) single-strand insertion in the absence of β-lactam and in the presence of aztreonam and (ii) multi-strand insertion in the presence of mecillinam.
Figure 8—figure supplement 4
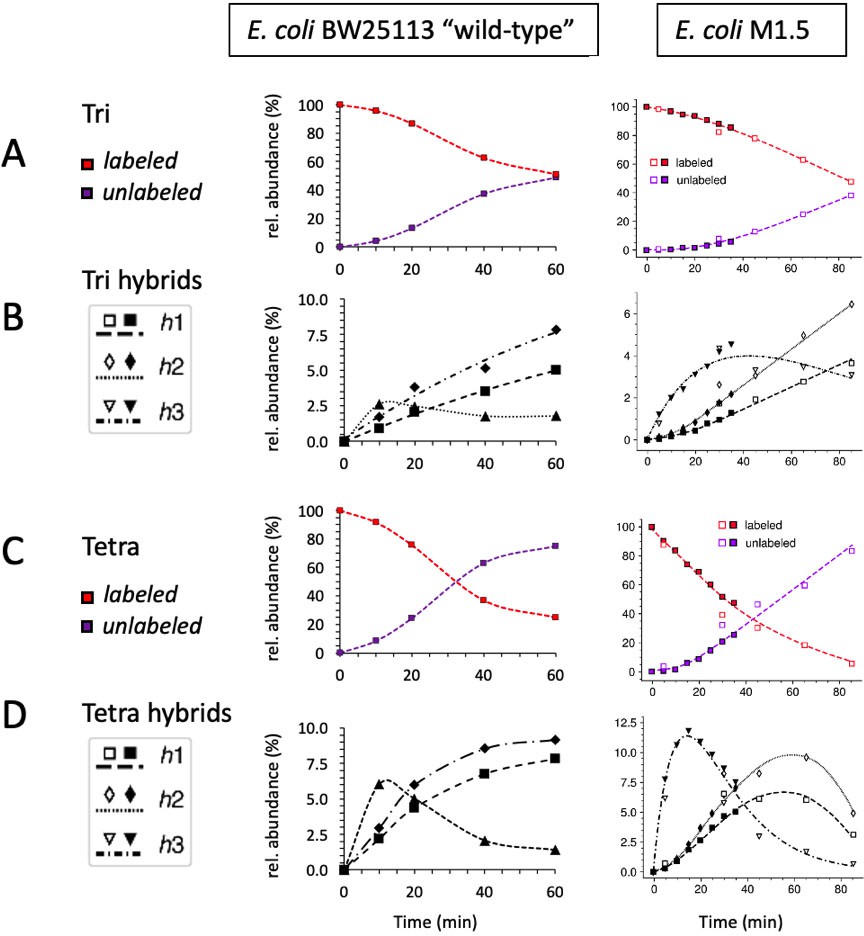
Kinetic analysis of the isotopologue content of monomers from Escherichia coli BW25113 (left) and M1.5 (right).
Data were collected for fully labeled and unlabeled tripeptide (A) and tetrapeptide (C). Data were also collected for tripeptide (B) and tetrapeptide (D) hybrids defined in Figure 4. Qualitatively, the kinetics were similar although the overall replacement of old muropeptides by new ones was more rapid for the ‘wild-type”’strain than for mutant M1.5 (note that the kinetics were recorded for 60 min versus 85 min for ‘wild-type’ and M1.5, respectively). The data obtained for E. coli M1.5 are those appearing in Figure 5.
Figure 9
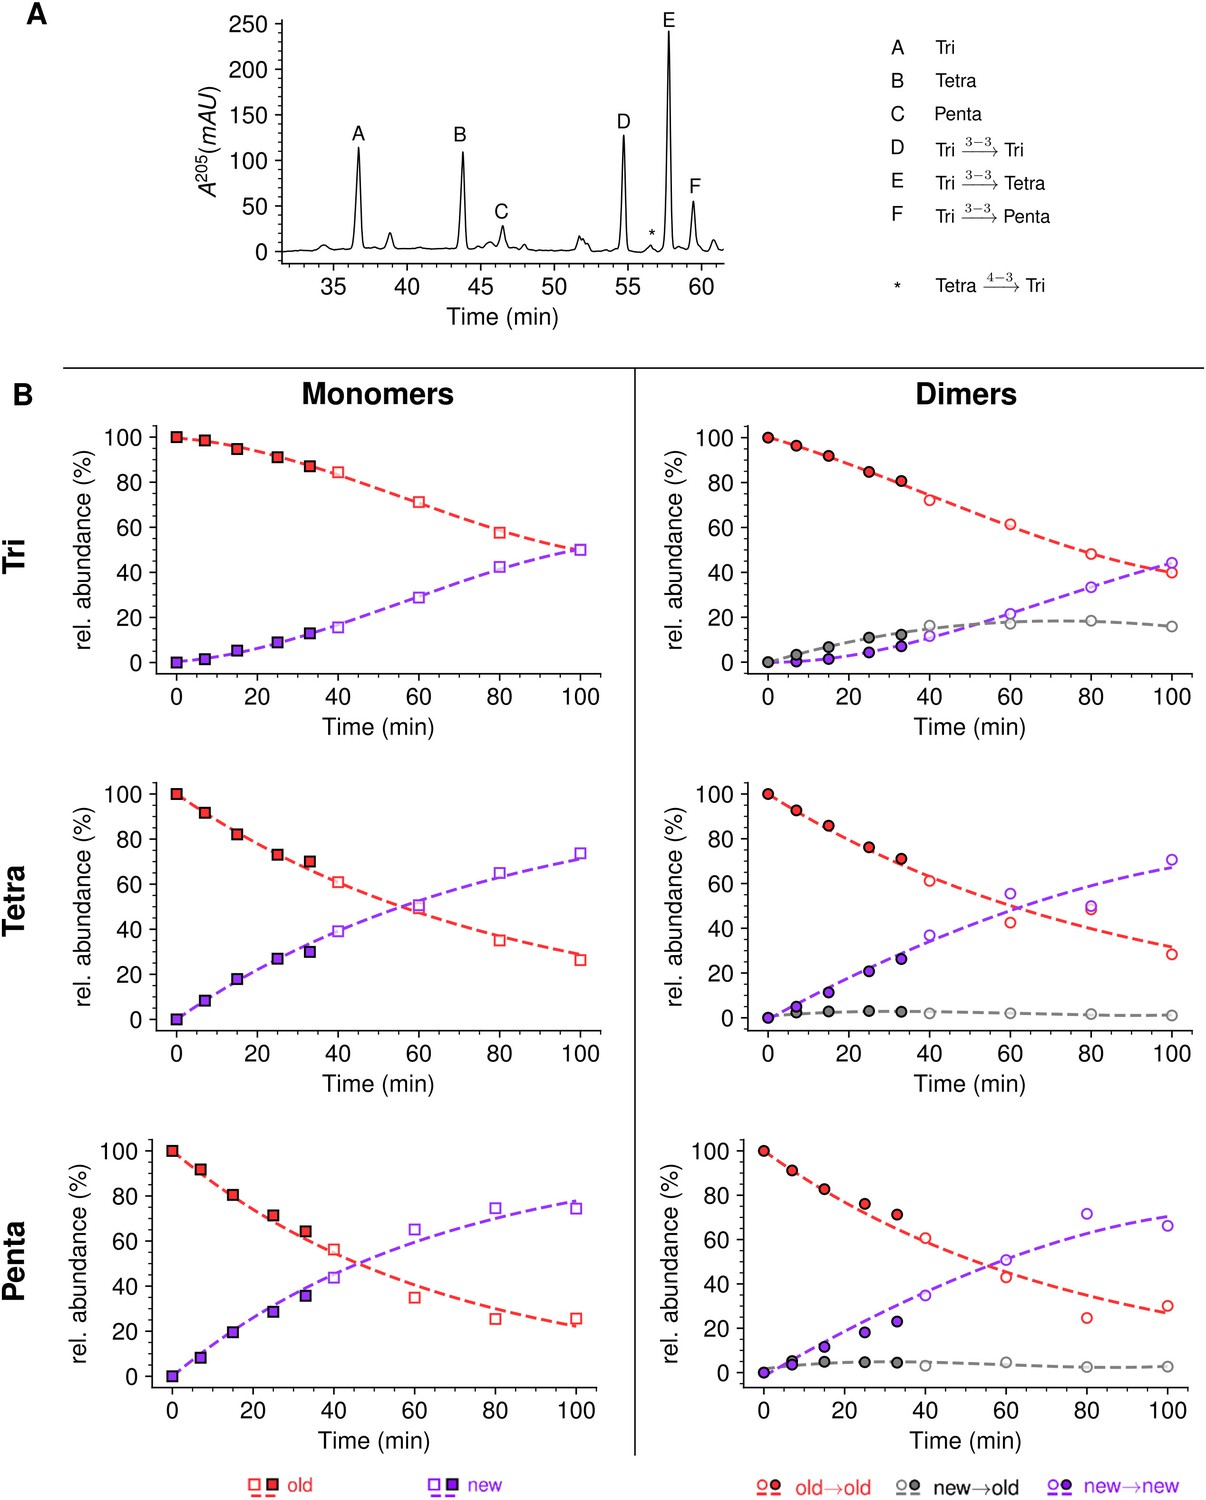
Mode of insertion of peptidoglycan in conditions in which YcbB is the only functional transpeptidase following inhibition of the D,D-transpeptidase activity of penicillin-binding proteins (PBPs) by ampicillin.
(A) Muropeptide rpHPLC profile of PG from Escherichia coli strain M1.5 grown in the presence of ampicillin (16 µg/mL), which was added 5 min prior to the medium switch and to the unlabeled culture medium used for the medium switch corresponding to t=0. (B) Kinetic data were collected for newly synthesized (new, purple) and existing (old, red) monomers.Kinetic data were also collected for dimers originating from cross-linking of (i) two existing stems (old→old; red), (ii) a new donor stem (i.e. a stem synthesized after the medium switch) and an existing acceptor stem (new→old; gray), and (iii) two new stems (new→new; purple). The calculations take into account the contribution of de novo synthesized stems originating from recycled moieties and from the labeled UDP-MurNAc-pentapeptide pool. The open and closed symbols correspond to data from two independent experiments. Rel. abundance, relative abundance of isotopologues. Disaccharide-peptide subunits contained a tripeptide (Tri), a tetrapeptide (Tetra), or a pentapeptide (Penta) stem. The curves are interpolations (Virtanen et al., 2020).
Figure 10
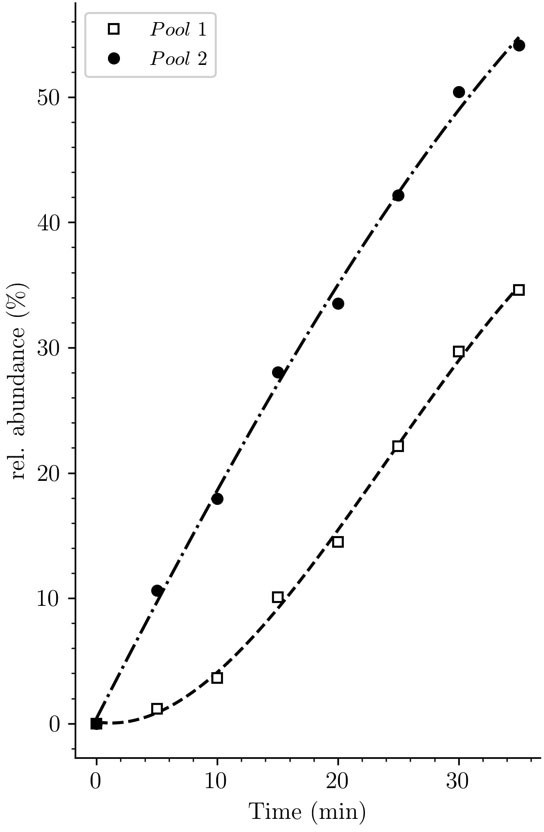
Potential origin of the lag phase previously observed in experiments based on incorporation of radioactive diaminopimelic acid (DAP).
The accumulation kinetics of neo-synthesized disaccharide-tetrapeptide isotopologues containing unlabeled DAP (pool 1, squares) was compared to that of all neo-synthesized disaccharide-tetrapeptide isotopologues, including hybrids h2 and h3 (pool 2, solid circles) (data from strain Δ6ldt grown in the absence of β-lactam). The curves are interpolations (Virtanen et al., 2020).
Figure 11
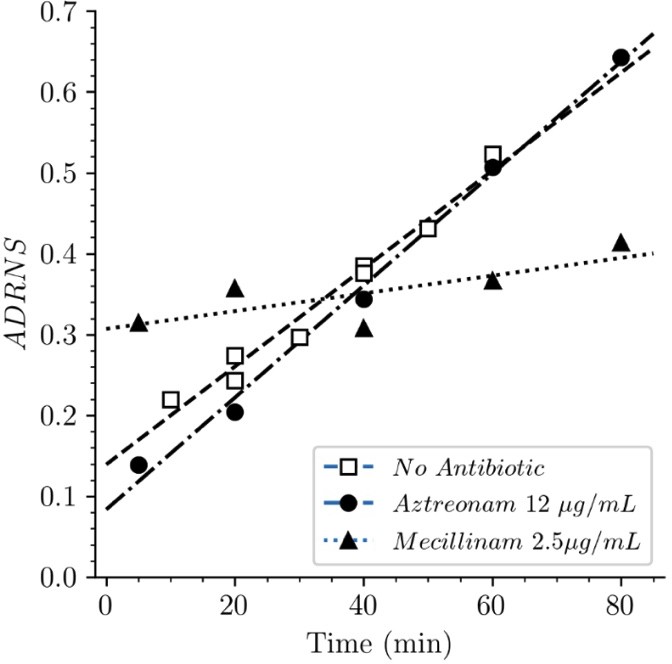
Acceptor-to-donor ratio of neo-synthesized stems (ADRNS) of Escherichia coli Δ6ldt.
Bacteria were grown in the presence of aztreonam, mecillinam, or in the absence of drug. Curves are obtained by linear regression. ADRNS were deduced from the relative abundance of new→old and new→new dimers appearing in Figure 8. Please note that the ADRNS was the highest for growth in the presence of mecillinam (this figure) in spite of the fact that the overall rate of replacement of old stems by new stems was the lowest for this growth condition, as evidenced by the slow rise of both the new→old and new→new dimers (Figure 8). This apparent discrepancy is accounted for by the fact that the ADRNS is a ratio solely based on neo-synthesized dimers.
Figure 12
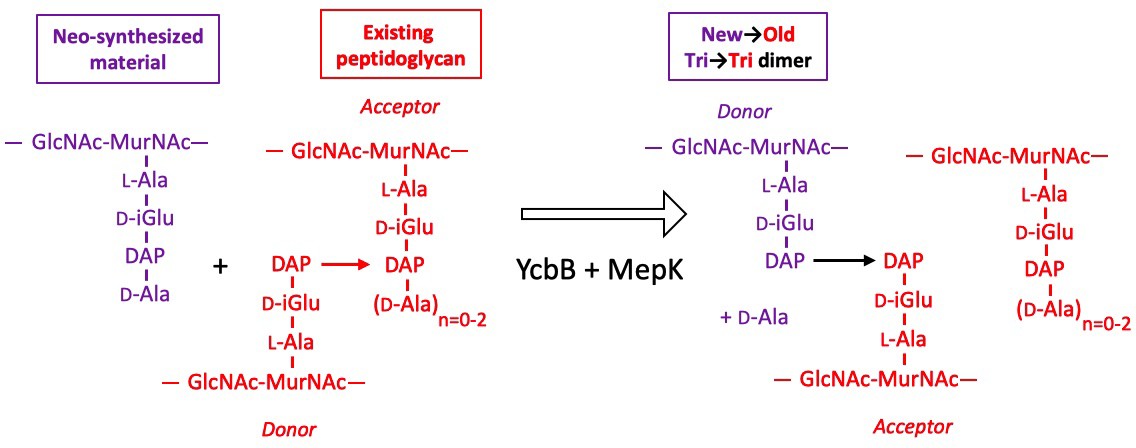
Model for the cross-linking of neo-synthesized material to existing peptidoglycan in strain M1.5 grown in the presence of ampicillin.
The formation of new→old cross-links results from cleavage of existing 3→3 cross-links by endopeptidase MepK thereby providing the tripeptide acceptor of the cross-linking reaction catalyzed by YcbB. Please note that the stem tripeptide in the donor position of dimers in the existing peptidoglycan is used as an acceptor in the neo-synthesized cross-links. This accounts for the fact that new→old dimers are exclusively of the Tri→Tri type. The acceptor stem in the existing peptidoglycan may harbor 0, 1, or 2 D-Ala residue (n=0–2).
Figure 13
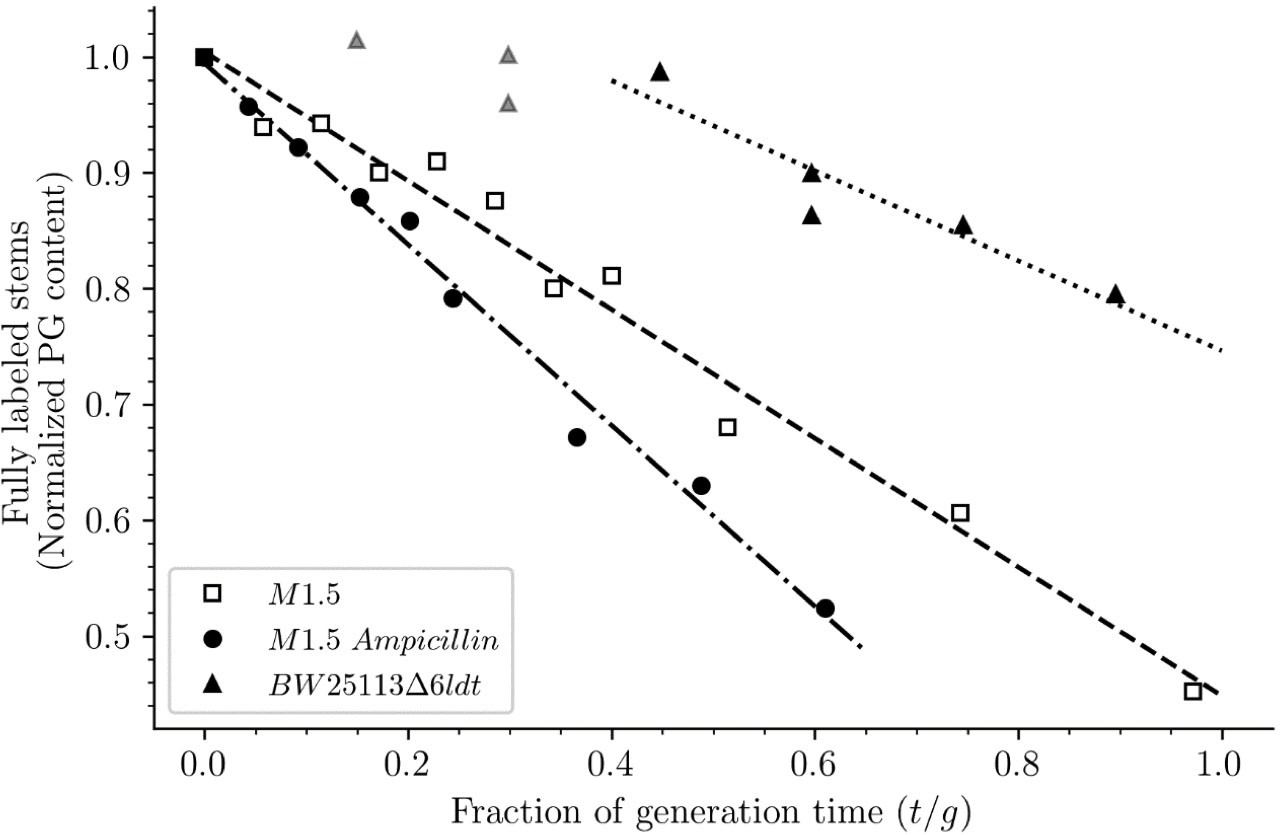
Release of peptidoglycan fragments from sacculi.
Kinetics of the isotopologue composition of sacculi was used to determine the extent of the release of peptidoglycan fragments from sacculi. For this purpose, we considered that the decrease in the number of fully labeled disaccharide-peptide subunits is equal to the number of subunits released from the peptidoglycan. This is legitimate since peptidoglycan subunits are recycled in a large number of moieties including two glucosamine residues, two acetyl groups, one D-lactoyl residue, the L-Ala-D-iGlu-DAP tripeptide or its constitutive amino acids, and two D-Ala residues (Figure 1—figure supplement 1). Disaccharide-peptide units issued from recycling are therefore mixtures of labeled and unlabeled moieties that can be easily distinguished from fully labeled subunits. Of note, release of peptidoglycan fragments in the culture medium, corresponding to a small proportion of peptidoglycan degradation products (Goodell and Schwarz, 1985b), also results in a reduction in the content of fully labeled disaccharide-peptides. Thus, the decrease in the absolute number of fully labeled disaccharide-peptide subunits in one generation directly provides an estimate of the fraction of the existing peptidoglycan that is degraded during each generation. For this reason, the decrease in the relative amount of fully labeled peptidoglycan disaccharide-peptides (normalized to 1.0 at the medium switch) was computed as a function of time (normalized for the generation time; Supplementary file 2-table S2). The decrease was linear for M1.5 grown in the presence or absence of ampicillin. For BW25113∆6ldt, a decrease in the fully labeled stems was only observed after 0.45 generation time. For this reason, regression analysis was performed for a portion of the kinetics (from 0.45 to 0.85 generation time; data points excluded from regression analysis are shown as gray triangles). The estimates of combined peptidoglycan turnover and recycling per generation were 39% for strain Δ6ldt and 56% or 78% for M1.5 grown in the absence or presence of ampicillin, respectively.
Tables
Table 1
Tandem mass spectrometry analysis of isotopologues of the GlcNAc-MurNAc-tetrapeptide.
| Structure | Isotopologue | m/zcal | Fully labeled | One light nucleus | ||
|---|---|---|---|---|---|---|
| m/zobs | Intensity (%) | m/zobs | Intensity (%) | |||
| GlcNAc-MurNAc- L-Ala-γ-D-Glu- DAP-D-Ala* | Fully labeled | 986.52 | 986.52 | 100 | ND | 0 |
| One light nucleus | 985.52 | ND | 0 | 985.60 | 100 | |
| MurNAc- L-Ala-γ-D-Glu- DAP-D-Ala | Fully labeled | 774.42 | 774.42 | 100 | 774.45 | 18 |
| One light nucleus | 773.41 | ND | 0 | 773.45 | 82 | |
| MurNAc- L-Ala-γ-D-Glu- DAP | Fully labeled | 681.36 | 681.36 | 100 | 681.40 | 12 |
| One light nucleus | 680.36 | ND | 0 | 680.40 | 88 | |
| L-Ala-γ-D-Glu- DAP-D-Ala | Fully labeled | 485.27 | 485.27 | 100 | 485.30 | 35 |
| One light nucleus | 484.26 | ND | 0 | 484.30 | 65 | |
| γ-D-Glu-DAP- D-Ala | Fully labeled | 410.22 | 410.22 | 100 | 410.25 | 47 |
| One light nucleus | 409.22 | ND | 0 | 409.25 | 53 | |
| L-Ala-γ-D-Glu -DAP | Fully labeled | 392.21 | 392.21 | 100 | 392.25 | 48 |
| One light nucleus | 391.21 | ND | 0 | 391.25 | 52 | |
| γ-D-Glu-DAP | Fully labeled | 317.17 | 317.17 | 100 | 317.20 | 54 |
| One light nucleus | 316.16 | ND | 0 | 316.20 | 46 | |
-
*
Mono-protonated precursor ion: C37H63N7O21•H+.
-
m/zcal, calculated m/z; m/zobs, observed m/z; ND, not detected.
Additional files
-
Supplementary file 1
Supplemental Tables.
(a) Muropeptide composition of the peptidoglycan of strains BW25113∆6ldt, M1.5, and BW25113 ‘wild-type’. aData are the mean ± standard deviation from independent experiments (see note c). bβ-Lactam added to the growth medium. AZT, aztreonam at 12 µg/mL; MEC, mecillinam at 2.5 µg/mL; AMP, ampicillin at 16 µg/mL. cThe number of independent peptidoglycan analyses is indicated in parenthesis. Abbreviations: ND, not detected; Tri, tripeptide monomer; Tetra, tetrapeptide monomer; Penta, pentapeptide monomer; Tri→Tri, Tri→Tetra, and Tri→Penta, 3→3 cross-linked dimers; Tetra→Tri and Tetra→Tetra, 4→3 cross-linked dimers. The inter-peptide cross-link direction is indicated using the donor→acceptor conventional notation. (b) Generation time for growth of BW25113 derivatives in M1 minimal medium aβ-lactam added to the growth medium. AZT, aztreonam at 12 µg/mL; MEC, mecillinam at 2.5 µg/mL; AMP, ampicillin at 16 µg/mL. bFor growth in the presence of aztreonam and mecillinam, the values were deduced from the variation in OD600 during 90 min. (c) Susceptibility of Escherichia coli strains to β-lactams. Data are the medians from six experiments.
- https://cdn.elifesciences.org/articles/72863/elife-72863-supp1-v2.docx
-
Supplementary file 2
Tandem mass spectrometry analysis of muropeptides.
- https://cdn.elifesciences.org/articles/72863/elife-72863-supp2-v2.pdf
-
Supplementary file 3
Supplementary Material and Methods.
- https://cdn.elifesciences.org/articles/72863/elife-72863-supp3-v2.docx
-
Transparent reporting form
- https://cdn.elifesciences.org/articles/72863/elife-72863-transrepform1-v2.pdf
Download links
A two-part list of links to download the article, or parts of the article, in various formats.
Downloads (link to download the article as PDF)
Open citations (links to open the citations from this article in various online reference manager services)
Cite this article (links to download the citations from this article in formats compatible with various reference manager tools)
Heavy isotope labeling and mass spectrometry reveal unexpected remodeling of bacterial cell wall expansion in response to drugs
eLife 11:e72863.
https://doi.org/10.7554/eLife.72863


