Condensation of Ede1 promotes the initiation of endocytosis
- Department of Biochemistry and NCCR Chemical Biology, University of Geneva, Switzerland
Figures
Figure 1 with 2 supplements
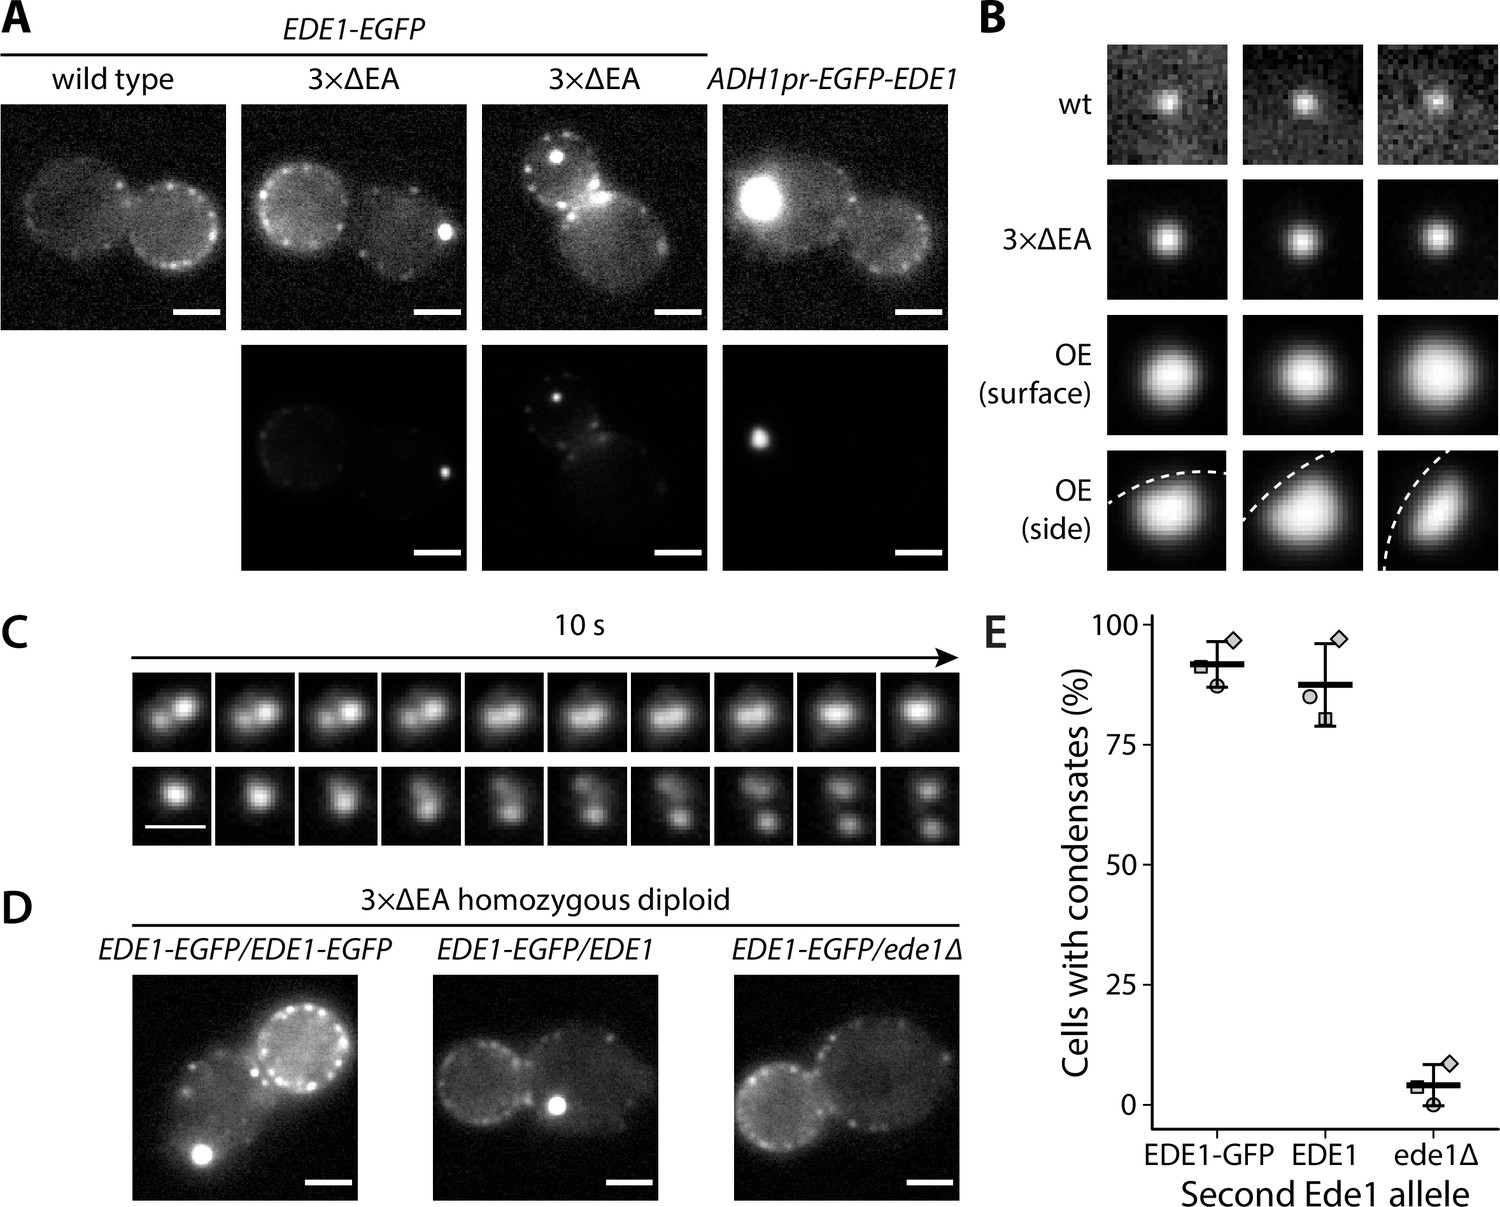
Excess cytosolic Ede1 assembles into condensates in vivo.
(A) Representative images of yeast cells expressing Ede1-EGFP in wild-type (wt) and 3×ΔEA genetic backgrounds, or overexpressing EGFP-Ede1 under the control of the ADH1 promoter. Mutant cell micrographs are shown using the same display range as the wt (top) or their full display range (bottom). Two cells are shown for 3×ΔEA background to display the membrane-associated and cytoplasmic localizations of Ede1 condensates. Scale bars: 2 μm. (B) Representative images of Ede1-EGFP at endocytic sites in wt background, Ede1-EGFP condensates in 3×ΔEA cells, and EGFP-Ede1 overexpression-induced condensates (OE). OE condensates are shown in two different orientations. Each frame is 1.5 μm × 1.5 μm; dotted white line represents the approximate position of the plasma membrane. (C) Two time series of Ede1-EGFP condensates undergoing apparent fusion (top) and fission (bottom) events. Scale bar: 1 μm. (D) Representative images of diploid cells homozygous for the 3×ΔEA background, each expressing Ede1-EGFP and differing in the second Ede1 locus: EDE1-EGFP, EDE1, or ede1Δ. Scale bars: 2 μm. (E) The fraction of cells containing condensates in each strain from panel D. Bars and whiskers show mean ± SD of three independent experiments. A range of 40–70 cells were analyzed per data point.
-
Figure 1—source data 1
Source data (panel E).
- https://cdn.elifesciences.org/articles/72865/elife-72865-fig1-data1-v2.csv
Figure 1—figure supplement 1
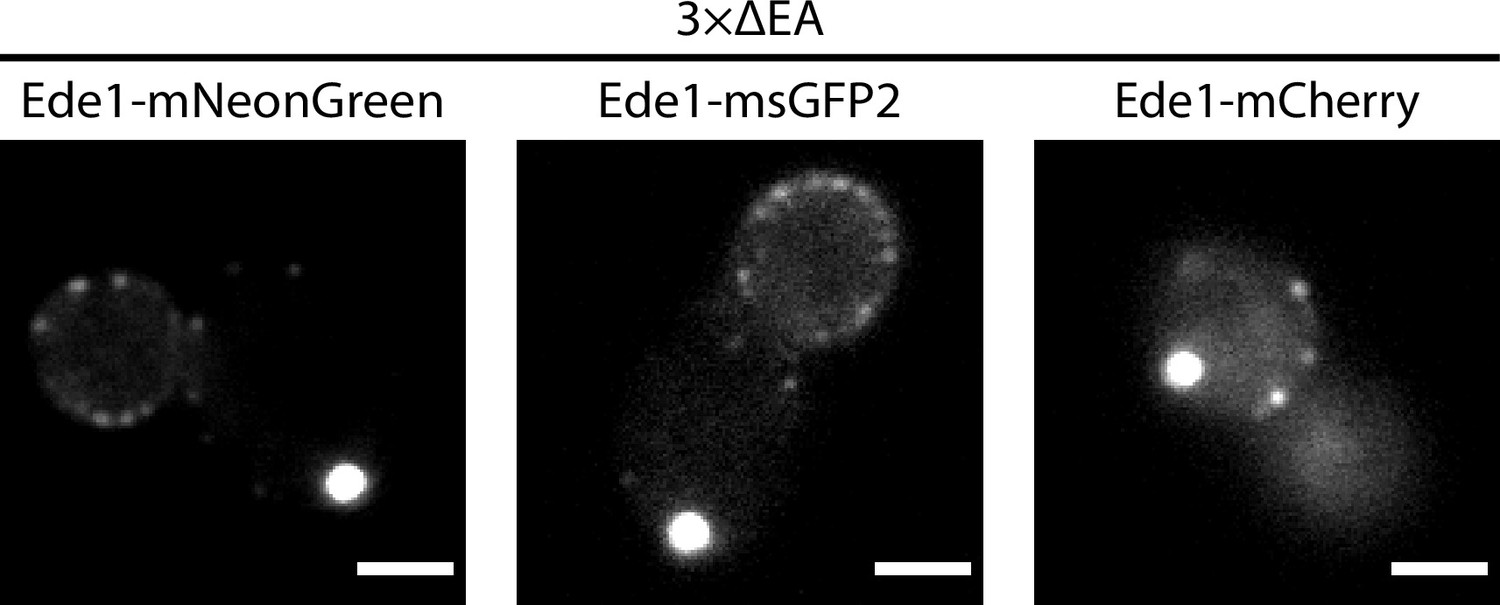
Representative 3×ΔEA cells expressing Ede1 tagged with mNeonGreen, msGFP2, or mCherry.
Figure 1—video 1
A 1-hour movie of Ede1-EGFP in 3×ΔEA cells.
Scale bar: 2 µm.
Figure 2 with 1 supplement
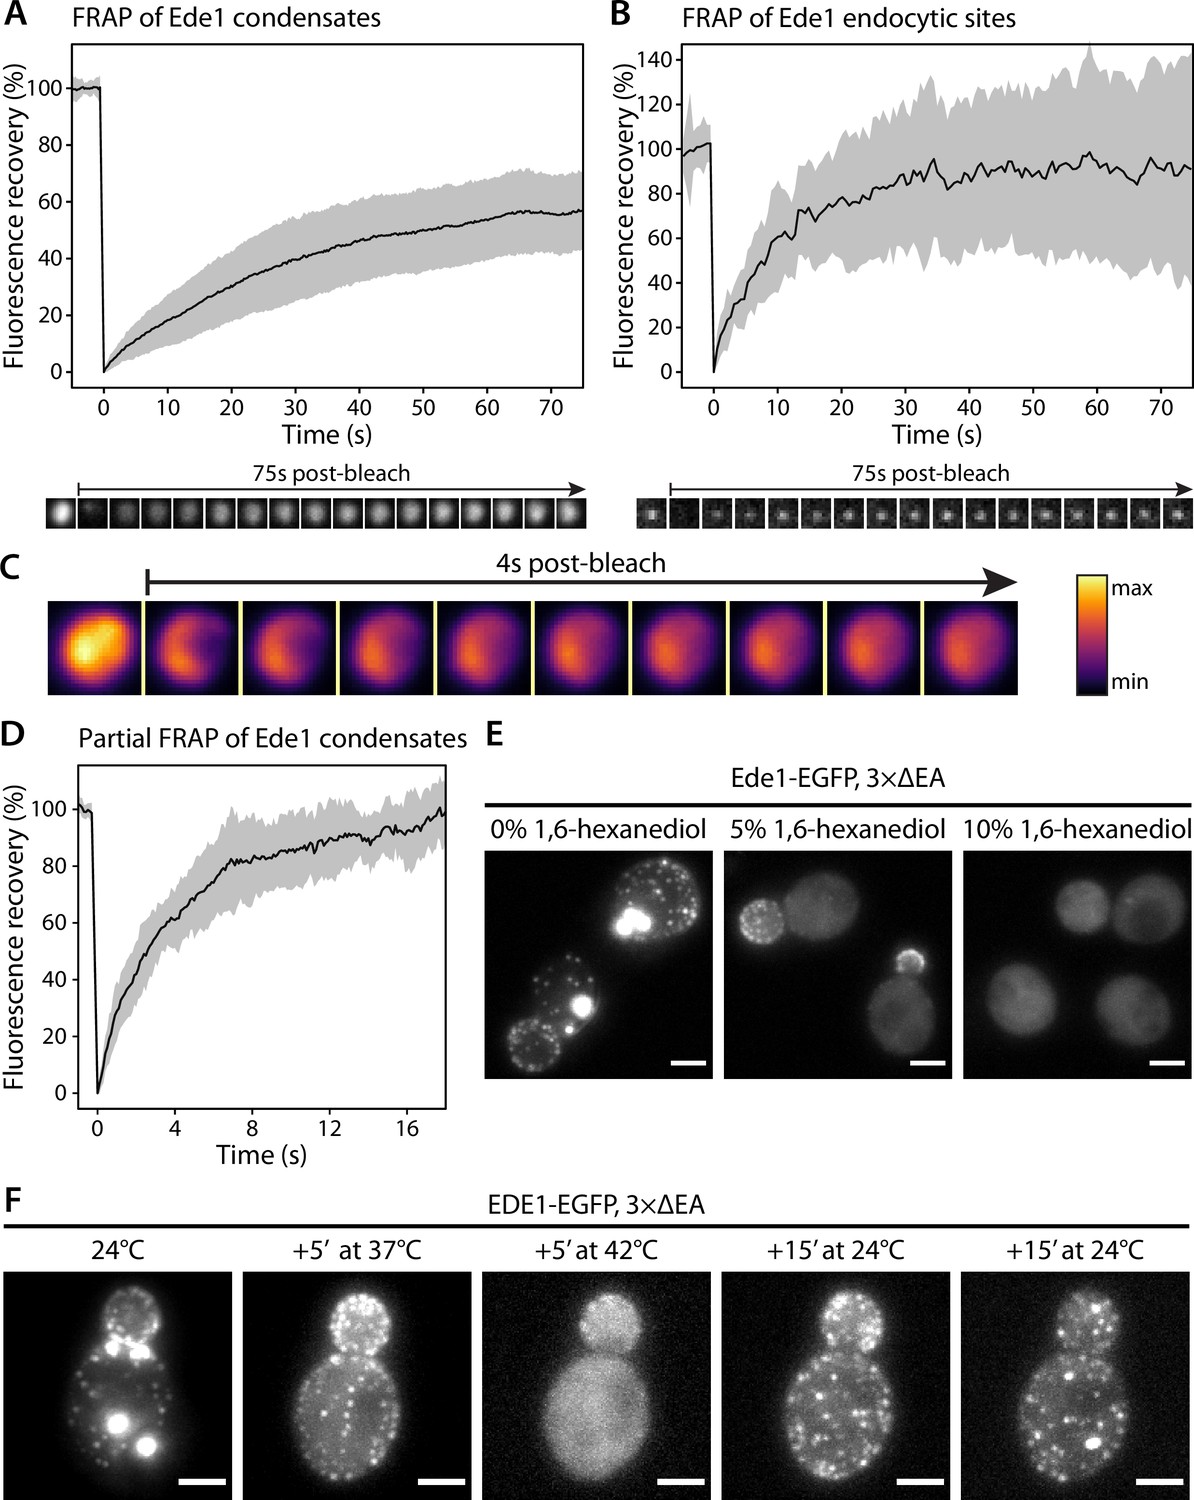
Ede1 structures exchange molecules with the cytoplasm and respond to temperature changes.
(A, B) Fluorescence recovery after photobleaching (FRAP) of Ede1-EGFP condensates in 3×ΔEA cells (A) and endocytic sites in normal cells (B). Plots show mean fluorescence recovery ± SD; n = 36 across four independent experiments (panel A) and n = 14 across three independent experiments (panel B). Representative time series are shown below each plot. Each frame is 1 μm × 1 μm. (C) Time series of a partial bleaching of a condensate in a cell overexpressing EGFP-Ede1. A perceptually uniform color lookup table has been applied to highlight the changes in intensity. Each frame is 1.5 μm × 1.5 μm.(D) Average fluorescence recovery (n = 14) after partial bleaching of condensates in cells overexpressing EGFP-Ede1, as in panel (C). (E) Representative cells after 5-min treatment with indicated concentrations of 1,6-hexanediol. Maximum Z-projections. (F) Ede1-EGFP was imaged in 3×ΔEA cells at different temperatures. Cells were grown and imaged at 24°C. The temperature was raised to 37 and 42°C and returned to 24°C for the indicated amounts of time. Maximum Z-projections. All scale bars: 2 μm.
-
Figure 2—source data 1
Fluorescence recovery data (panel A).
- https://cdn.elifesciences.org/articles/72865/elife-72865-fig2-data1-v2.csv
-
Figure 2—source data 2
Fluorescence recovery data (panel B).
- https://cdn.elifesciences.org/articles/72865/elife-72865-fig2-data2-v2.csv
-
Figure 2—source data 3
Fluorescence recovery data (panel D).
- https://cdn.elifesciences.org/articles/72865/elife-72865-fig2-data3-v2.csv
Figure 2—video 1
Partial condensate bleaching in Ede1 overexpression cells.
Scale bar: 1 μm.
Figure 3 with 1 supplement

Condensate formation limits the concentration of Ede1 in the cytoplasm.
(A) Fluorescence intensity was measured in wild-type (wt) and 3×ΔEA cells expressing Ede1-EGFP, or cells overexpressing (oe) EGFP-Ede1 from the ADH1 promoter. Gray points represent mean pixel intensities of entire cell volumes (Cellular), or small regions manually selected from cell cross-sections (Cytosolic). Large points: mean values from independent replicates; central line and whiskers: mean ± SD of replicate means. Pairwise comparisons based on a linear mixed model (n.s., not significant; ***, p<0.001). (B) Two yeast strains were imaged for 8 hr after change of carbon source from glucose to galactose (see Materials and methods). Cells express EGFP-Ede1 under the control of GALS promoter (green channel only), or Ede1-EGFP and Sla1-mCherry expressed from the endogenous loci (green and magenta, respectively). Scale bars: 2 μm. (C) Fluorescence intensity during the expression induction was measured in regions representing entire cells (2 and 4 in panel B) and their cytoplasm (1 and 3). Mean intensity is shown for endogenously expressed (wt) or overexpressed (oe) Ede1 after background subtraction, ±2 × SEM (n = 40 cells for each strain).
-
Figure 3—source data 1
Source data, code, and statistical details (panel A).
- https://cdn.elifesciences.org/articles/72865/elife-72865-fig3-data1-v2.zip
-
Figure 3—source data 2
Source data and code (panel C).
- https://cdn.elifesciences.org/articles/72865/elife-72865-fig3-data2-v2.zip
Figure 3—video 1
Movie of cells shown in panel B.
Figure 4 with 2 supplements
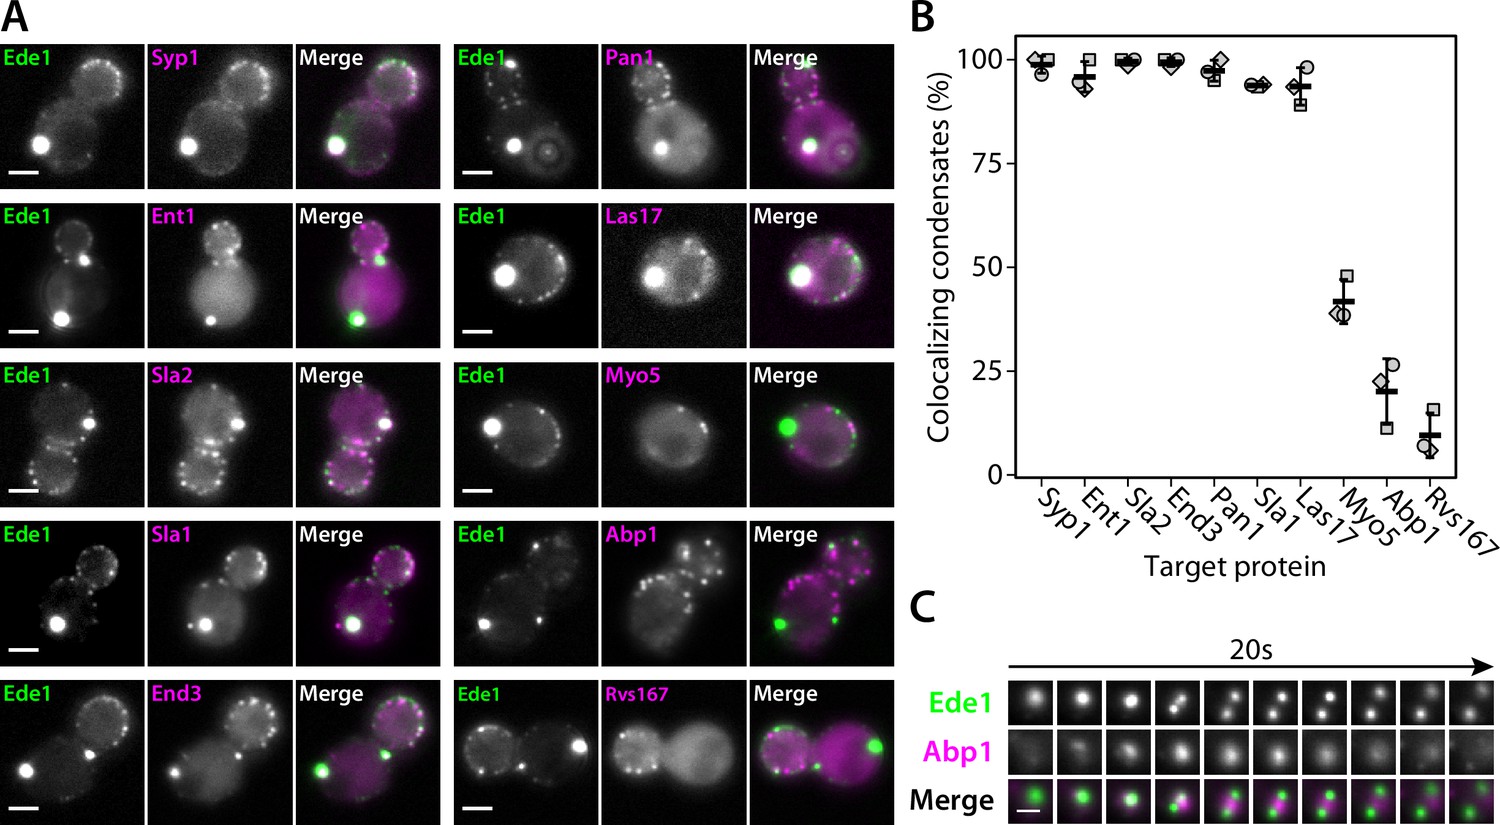
Endocytic condensates recruit many proteins.
(A) Images of representative cells expressing Ede1-EGFP and indicated endocytic proteins tagged with mCherry in 3×ΔEA background. (B) Fraction of Ede1-EGFP condensates that colocalized with mCherry puncta in each strain from panel A. Bars and whiskers show mean ± SD of three independent experiments. A range of 36–98 cells were analyzed per data point. (C) Montage from timelapse imaging of Ede1-EGFP and Abp1-mCherry during apparent fission of an Ede1 condensate.
-
Figure 4—source data 1
Source data (panel B).
- https://cdn.elifesciences.org/articles/72865/elife-72865-fig4-data1-v2.csv
Figure 4—figure supplement 1
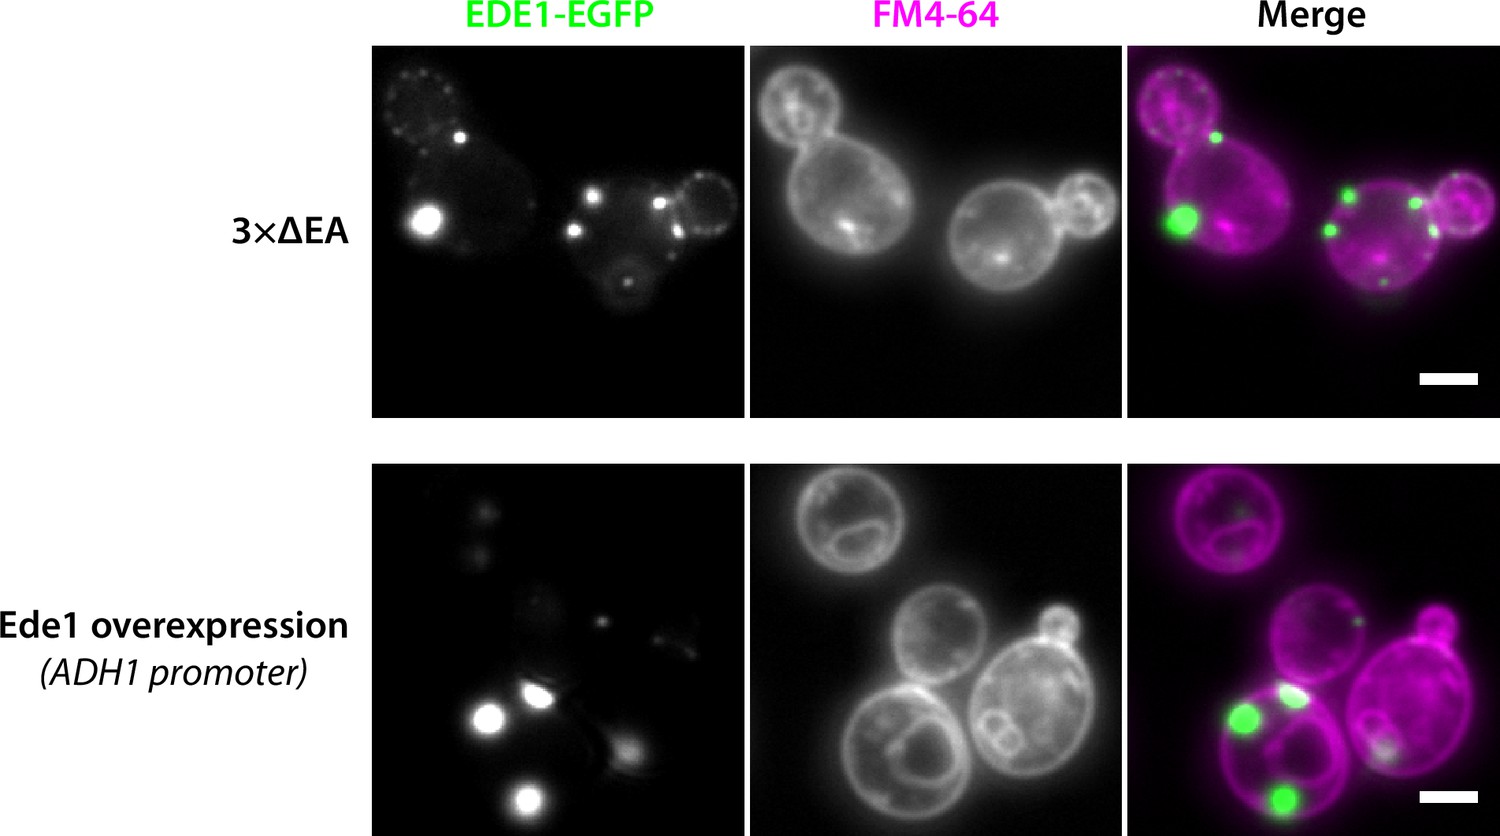
Ede1 condensates do not colocalize with membranes stained by FM4-64.
Representative cells expressing Ede1-EGFP in the 3×ΔEA background, or overexpressing EGFP-Ede1 under the control of the ADH1 promoter after a 60-min staining with FM4-64. Scale bar 2 μm.
Figure 4—video 1
A 2-min movie of Ede1-EGFP (green) and Abp1-mCherry (magenta) in 3×ΔEA background showing repeated transient localization of Abp1 to Ede1 condensates, and an example of Abp1 recruitment coinciding with apparent condensate fission and subsequent fusion.
Scale bar 2 μm.
Figure 5 with 1 supplement
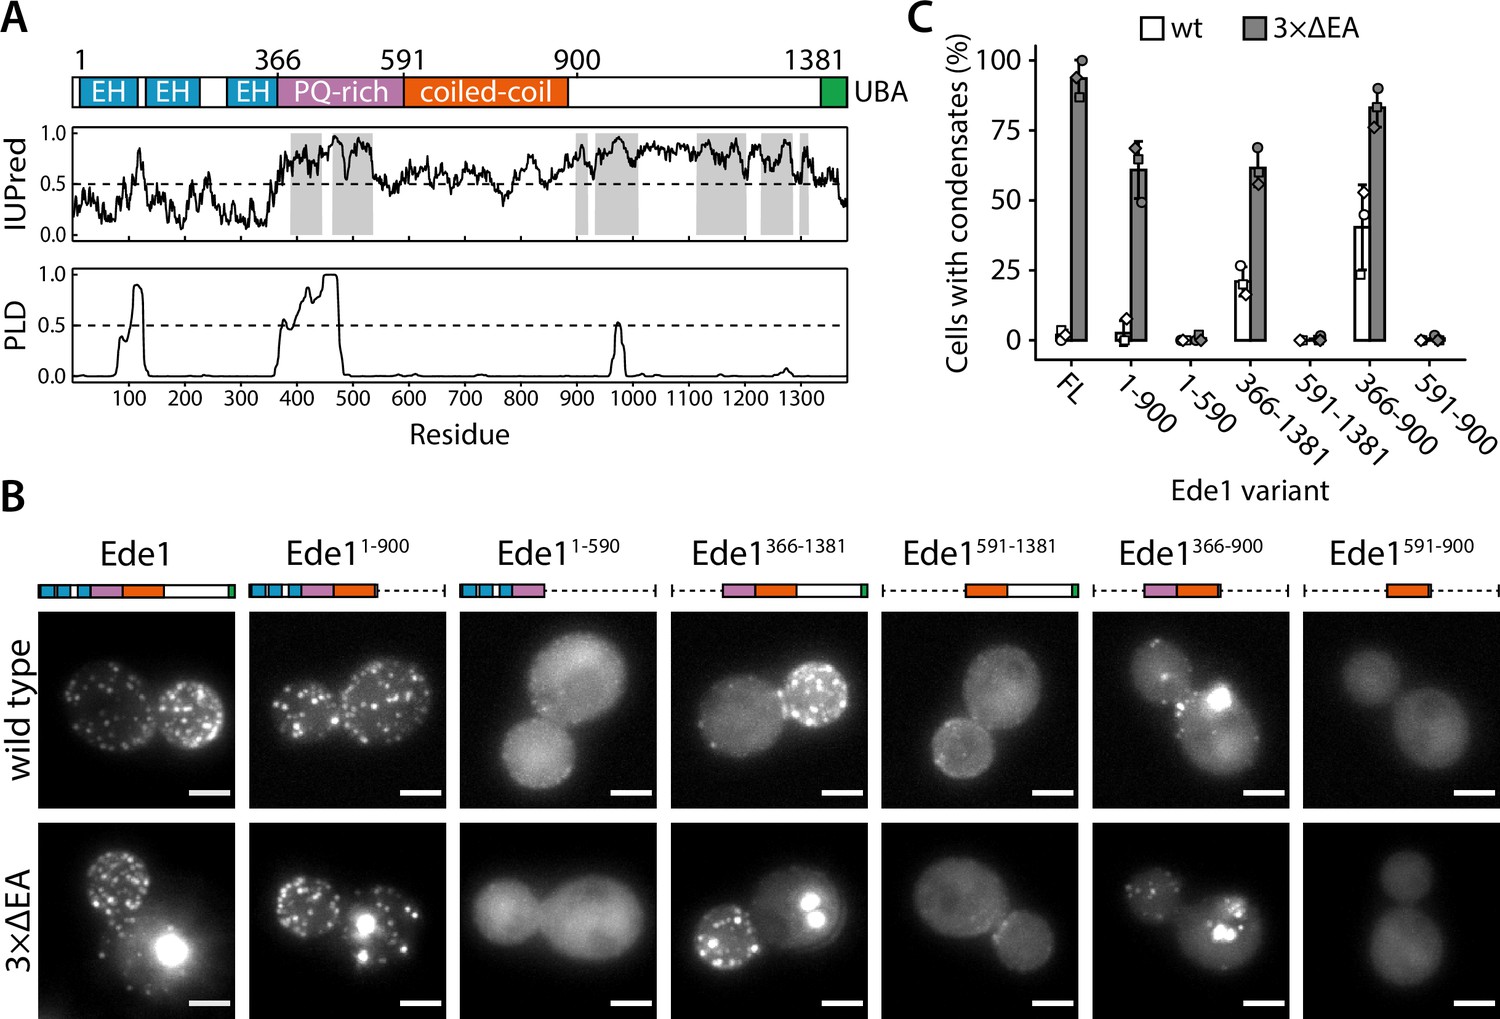
The central region of Ede1 is necessary and sufficient for condensate formation.
(A) The domain structure of Ede1 and prediction of disordered and prion-like regions. EH, Eps15-homology domain; UBA, ubiquitin-associated domain. Domains are drawn to scale according to UniProt entry P34216, and numbers above mark domain boundaries used in our constructs. The top plot represents IUPred2a disorder prediction score, with the shaded areas predicted to be disordered by MobiDB-lite consensus method. Prion-like domain (PLD) prediction score was calculated using the PLAAC software. (B) Representative cells expressing full-length (FL) Ede1 and its truncation mutants in wild-type and 3×ΔEA backgrounds. All constructs are C-terminally tagged with EGFP. Maximum intensity projections of 3D volumes, scale bars: 2 μm. (C) The fraction of cells containing condensates in each strain from panel B. Bars and whiskers show mean ± SD of three independent experiments. A range of 37–78 cells were analyzed per data point.
-
Figure 5—source data 1
Source data (panel C).
- https://cdn.elifesciences.org/articles/72865/elife-72865-fig5-data1-v2.csv
Figure 5—figure supplement 1
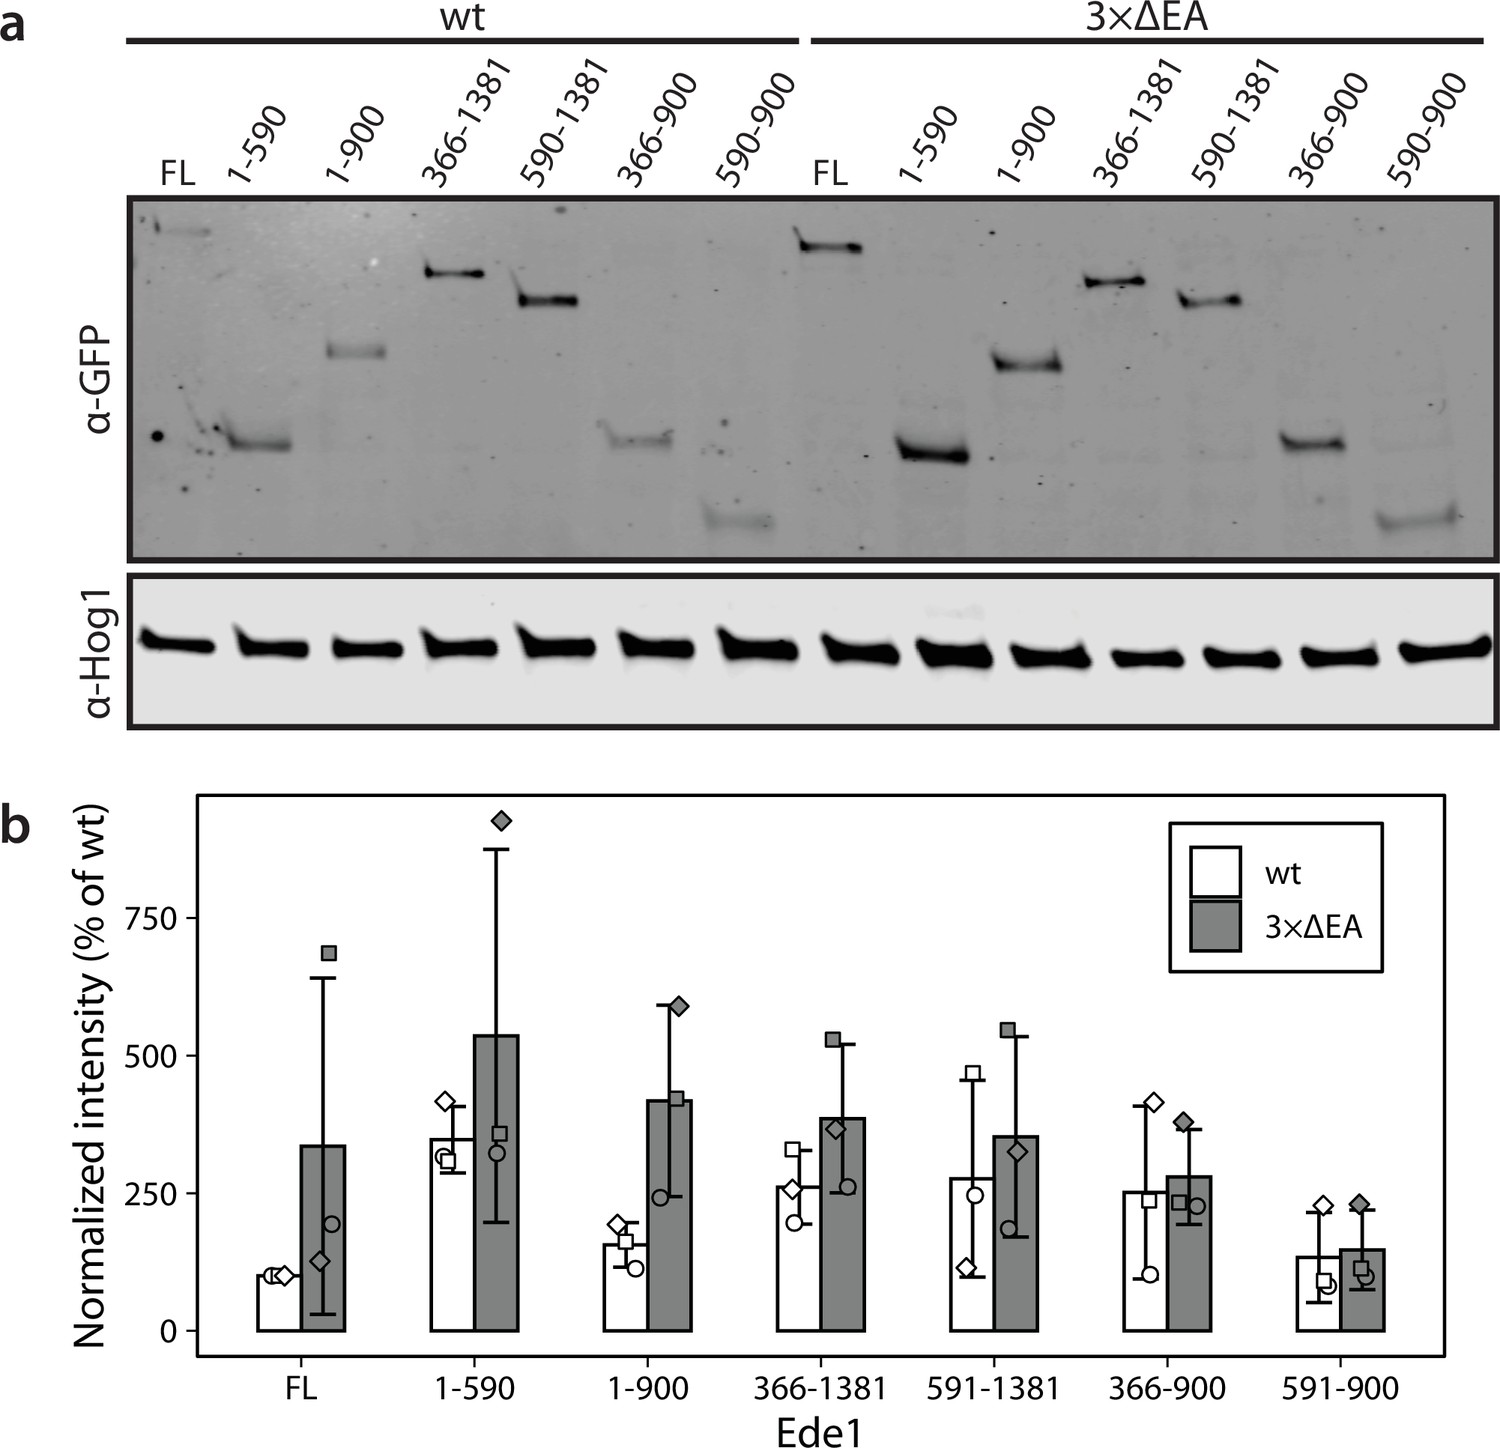
Levels of Ede1 mutants assessed by western blotting.
(a) Representative western blot of EGFP-tagged Ede1 truncation constructs expressed in wild-type (wt) and 3×ΔEA backgrounds. (b) Band intensity relative to full-length (FL) Ede1-EGFP in wt cells was calculated for three independent experiments. Hog1 was used as a loading control. Bars and whiskers show mean ± SD.
-
Figure 5—figure supplement 1—source data 1
Source data (western blotting).
- https://cdn.elifesciences.org/articles/72865/elife-72865-fig5-figsupp1-data1-v2.zip
Figure 6 with 1 supplement

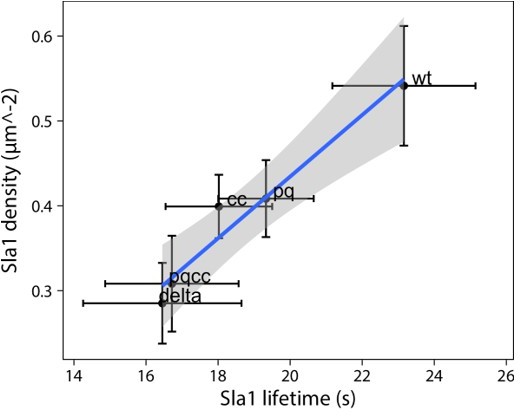
Ede1 features necessary for phase separation are also crucial for its function.
(A) Representative cells expressing full-length Ede1 and three internal Ede1 deletion mutants: Ede1ΔPQ (Δ366-590), Ede1ΔCC (Δ591-900), and Ede1ΔPQCC (Δ366-900) tagged with EGFP. (B) Representative cells expressing Sla1-EGFP and indicated Ede1 mutants. (C, D) Sla1 patch density and lifetime in Ede1 mutants. Large points represent mean measurements from independently repeated datasets. Central line and whiskers denote the mean ± SD calculated from dataset averages. Gray points show individual observations. Letters denote pairwise comparisons based on Tukey-Kramer test; groups which do not share any letters are significantly different at α = 0.05. Scale bars: 2 μm.
-
Figure 6—source data 1
Source data, code, and statistical details (panel C).
- https://cdn.elifesciences.org/articles/72865/elife-72865-fig6-data1-v2.zip
-
Figure 6—source data 2
Source data, code, and statistical details (panel D).
- https://cdn.elifesciences.org/articles/72865/elife-72865-fig6-data2-v2.zip
Figure 6—figure supplement 1
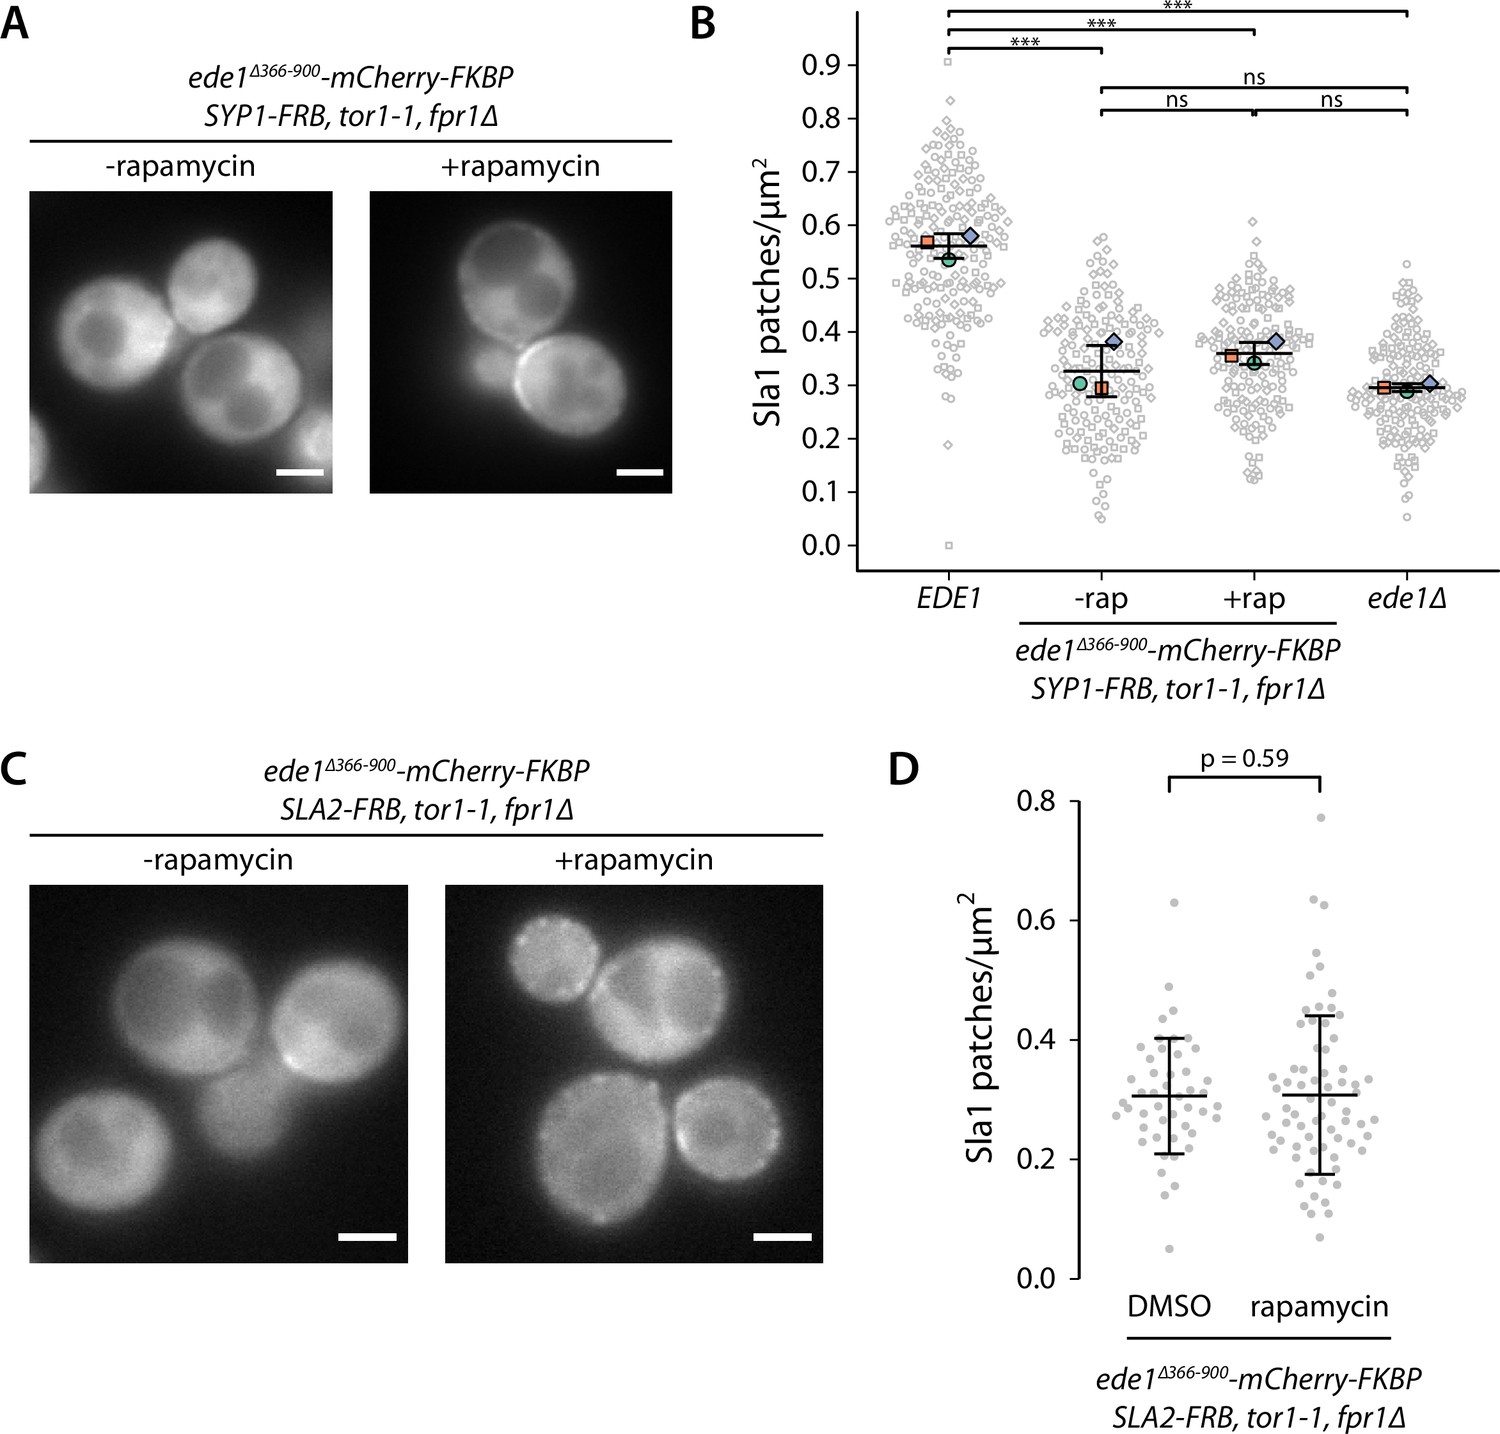
Recruitment of Ede1ΔPQCC to other proteins cannot rescue the endocytic defect.
Ede1ΔPQCC-mCherry-FKBP was recruited to Syp1-FRB or Sla2-FRB by addition of 10 μg ml−1 of rapamycin to the growth medium. (A) Ede1ΔPQCC-mCherry-FKBP signal in cells coexpressing Syp1-FRB and Sla1-EGFP. (B) Density of Sla1-EGFP patches in cells expressing wild-type Ede1, Ede1ΔPQCC-mCherry-FKBP, and Syp1-FRB cultured with or without rapamycin, or no Ede1. Large points: mean measurements from independently repeated datasets. Central line and whiskers: mean ± SD calculated from dataset averages. Gray points: individual cells from all datasets. Statistical significance of pairwise comparisons was determined by Tukey-Kramer test; n.s., not significant; ***, p<0.001. (C) Ede1ΔPQCC-mCherry-FKBP signal in cells coexpressing Sla2-FRB and Sla1-EGFP. (D) Density of Sla1-EGFP patches in the same cells cultured with or without rapamycin. P-value from Welch’s t-test. Scale bars: 2 μm.
Figure 7
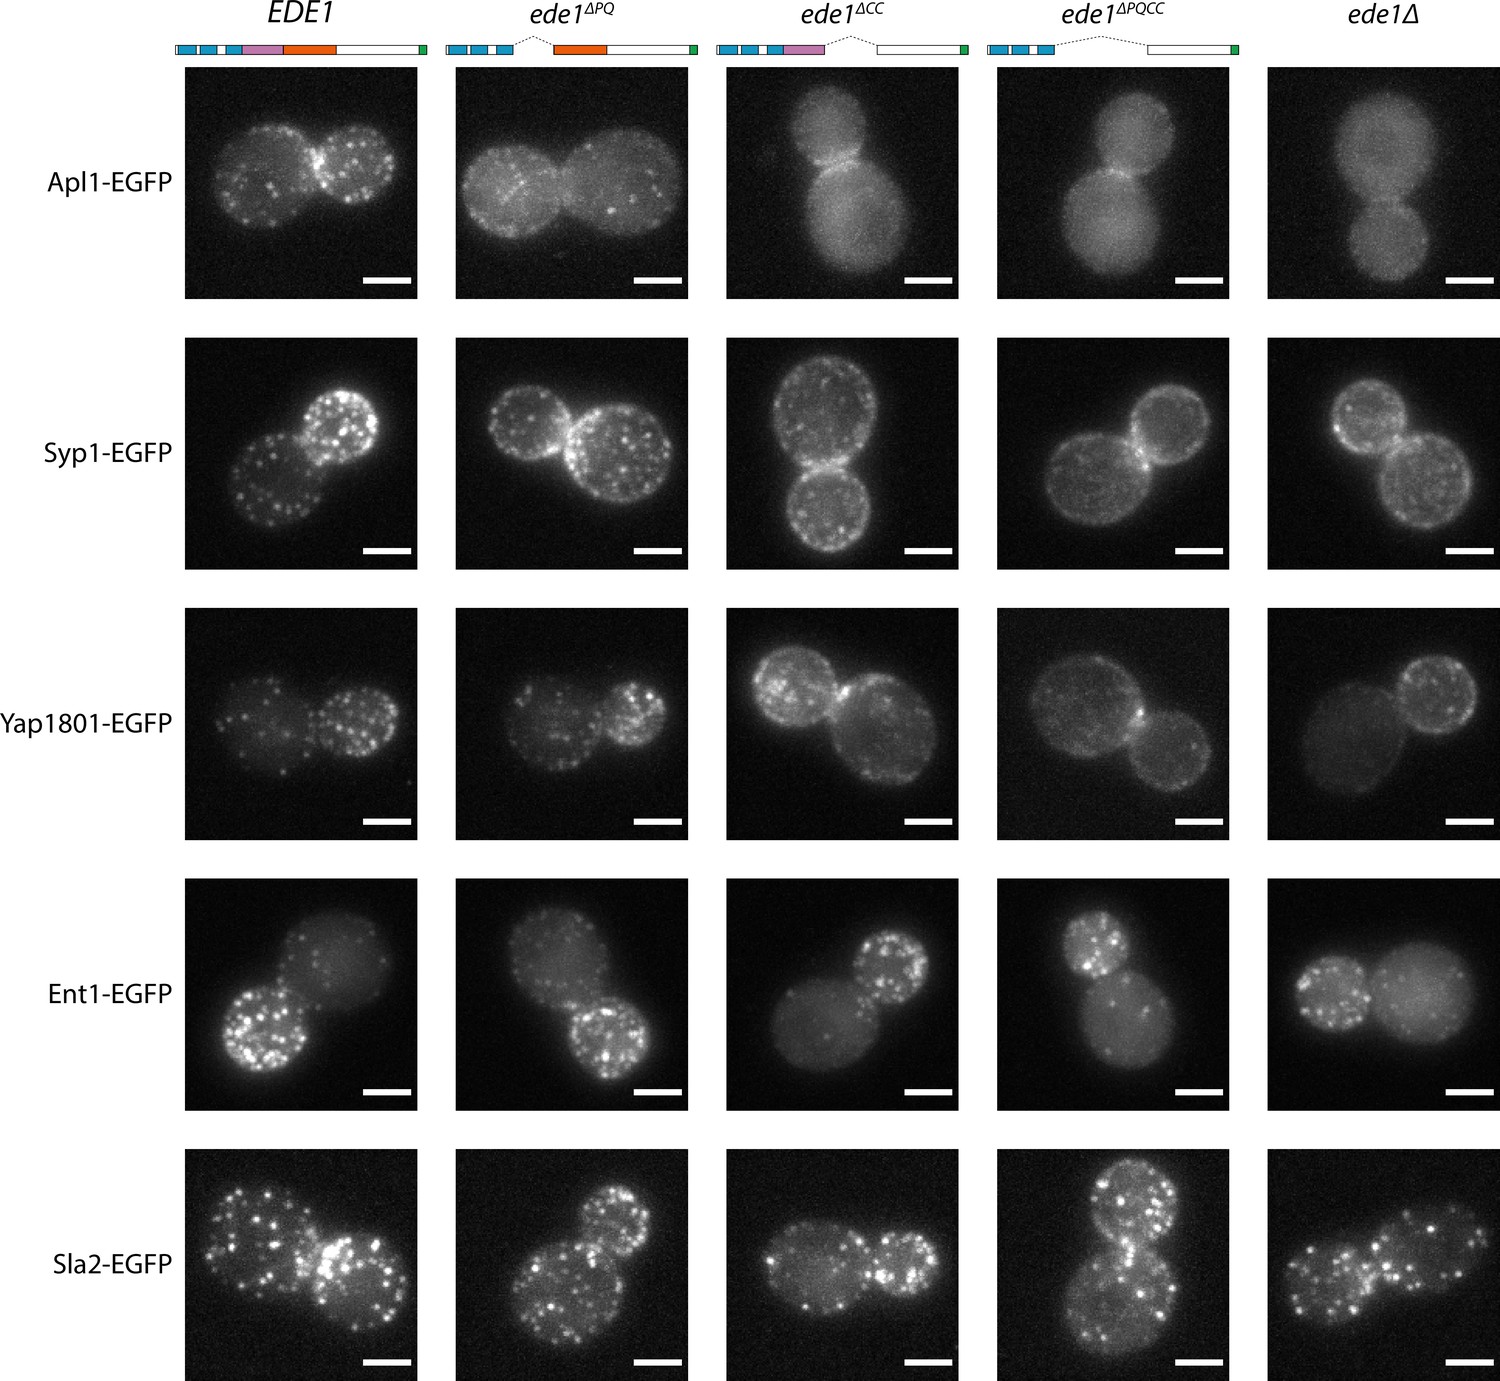
Ede1 central deletion mutants are defective in early protein localization.
Maximum-intensity projections of 3D volumes are shown for representative cells with different early proteins tagged with EGFP. The strains express Ede1 species indicated at the top. Scale bars: 2 μm.
Figure 8 with 1 supplement
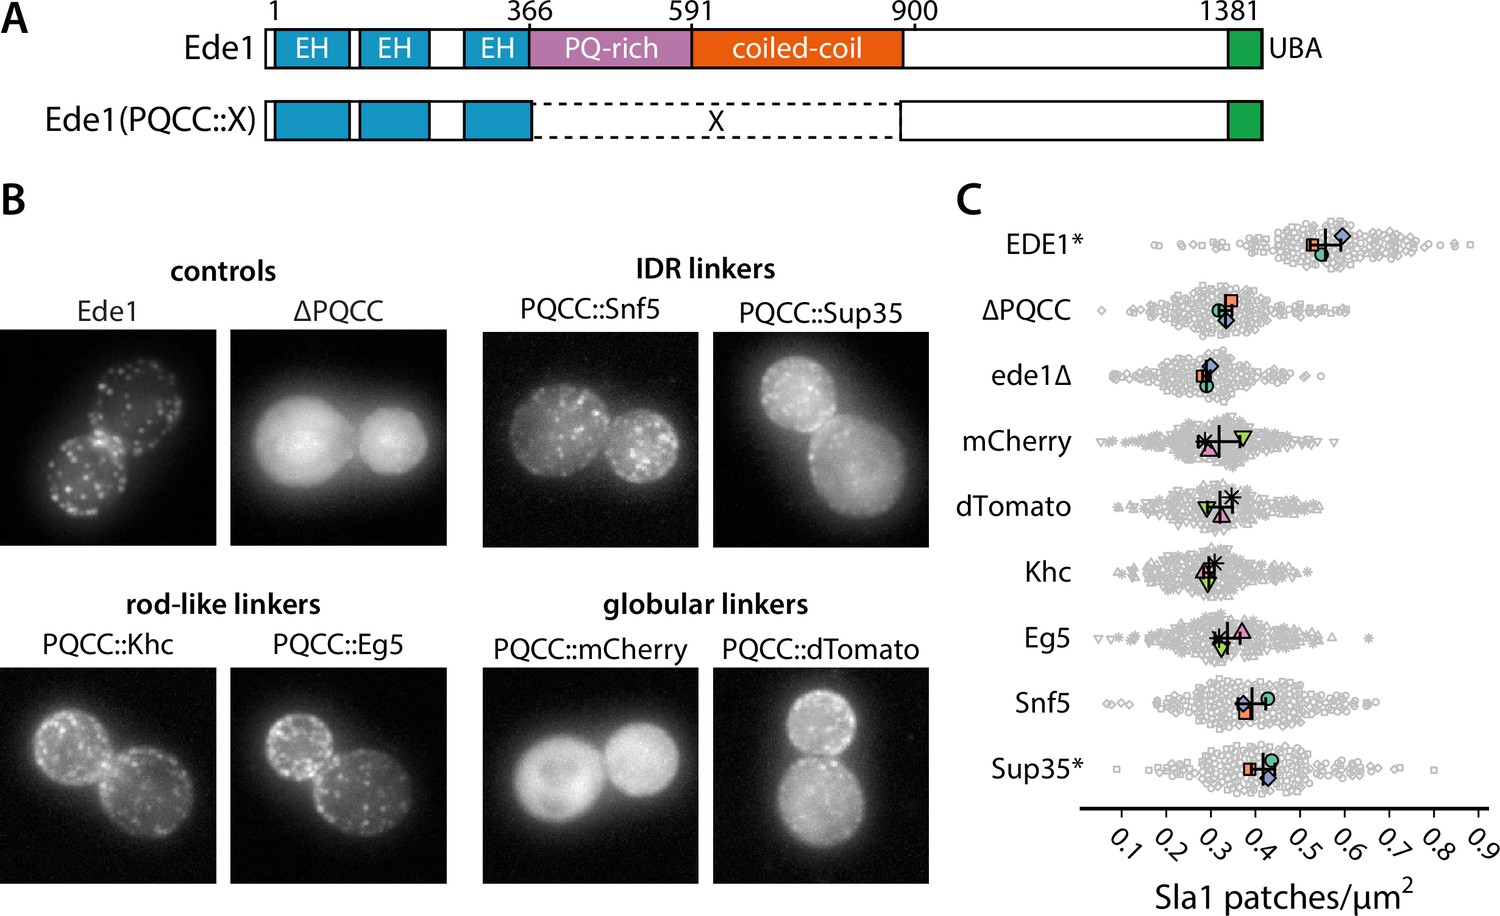
Prion-like domains can partially replace Ede1 central region.
(A) Domain structure of the Ede1 central region replacement constructs. Amino acids 366–900 of Ede1 were replaced with prion-like intrinsically disordered region (IDR) sequences, monomeric (mCherry) or dimeric (dTomato) fluorescent proteins, and dimeric (Khc) or tetrameric (Eg5) coiled-coils. All mutants were expressed from the Ede1 locus under the control of the native promoter. (B) Representative cells expressing indicated Ede1 mutants tagged C-terminally with msGFP2. (C) Quantification of Sla1-EGFP patch density in strains expressing indicated Ede1 mutants. Large points represent mean measurements from independently repeated datasets. Central line and whiskers denote the mean ± SD calculated from dataset averages. Gray points show individual cells from all datasets. At α = 0.05, all mutants are significantly different from wild type, and groups marked with an asterisk (*) are significantly different from Ede1ΔPQCC (Tukey-Kramer test; a complete table of pairwise comparisons and effect sizes can be found in Figure 8—source data 1). All scale bars: 2 μm.
-
Figure 8—source data 1
Source data, code, and statistical details (panel C).
- https://cdn.elifesciences.org/articles/72865/elife-72865-fig8-data1-v2.zip
Figure 8—figure supplement 1

Ede1FUS and Ede1Whi3 intrinsically disordered region replacement constructs.
Representative cells expressing Ede1FUS and Ede1Whi3 tagged C-terminally with msGFP2.
Figure 9 with 3 supplements
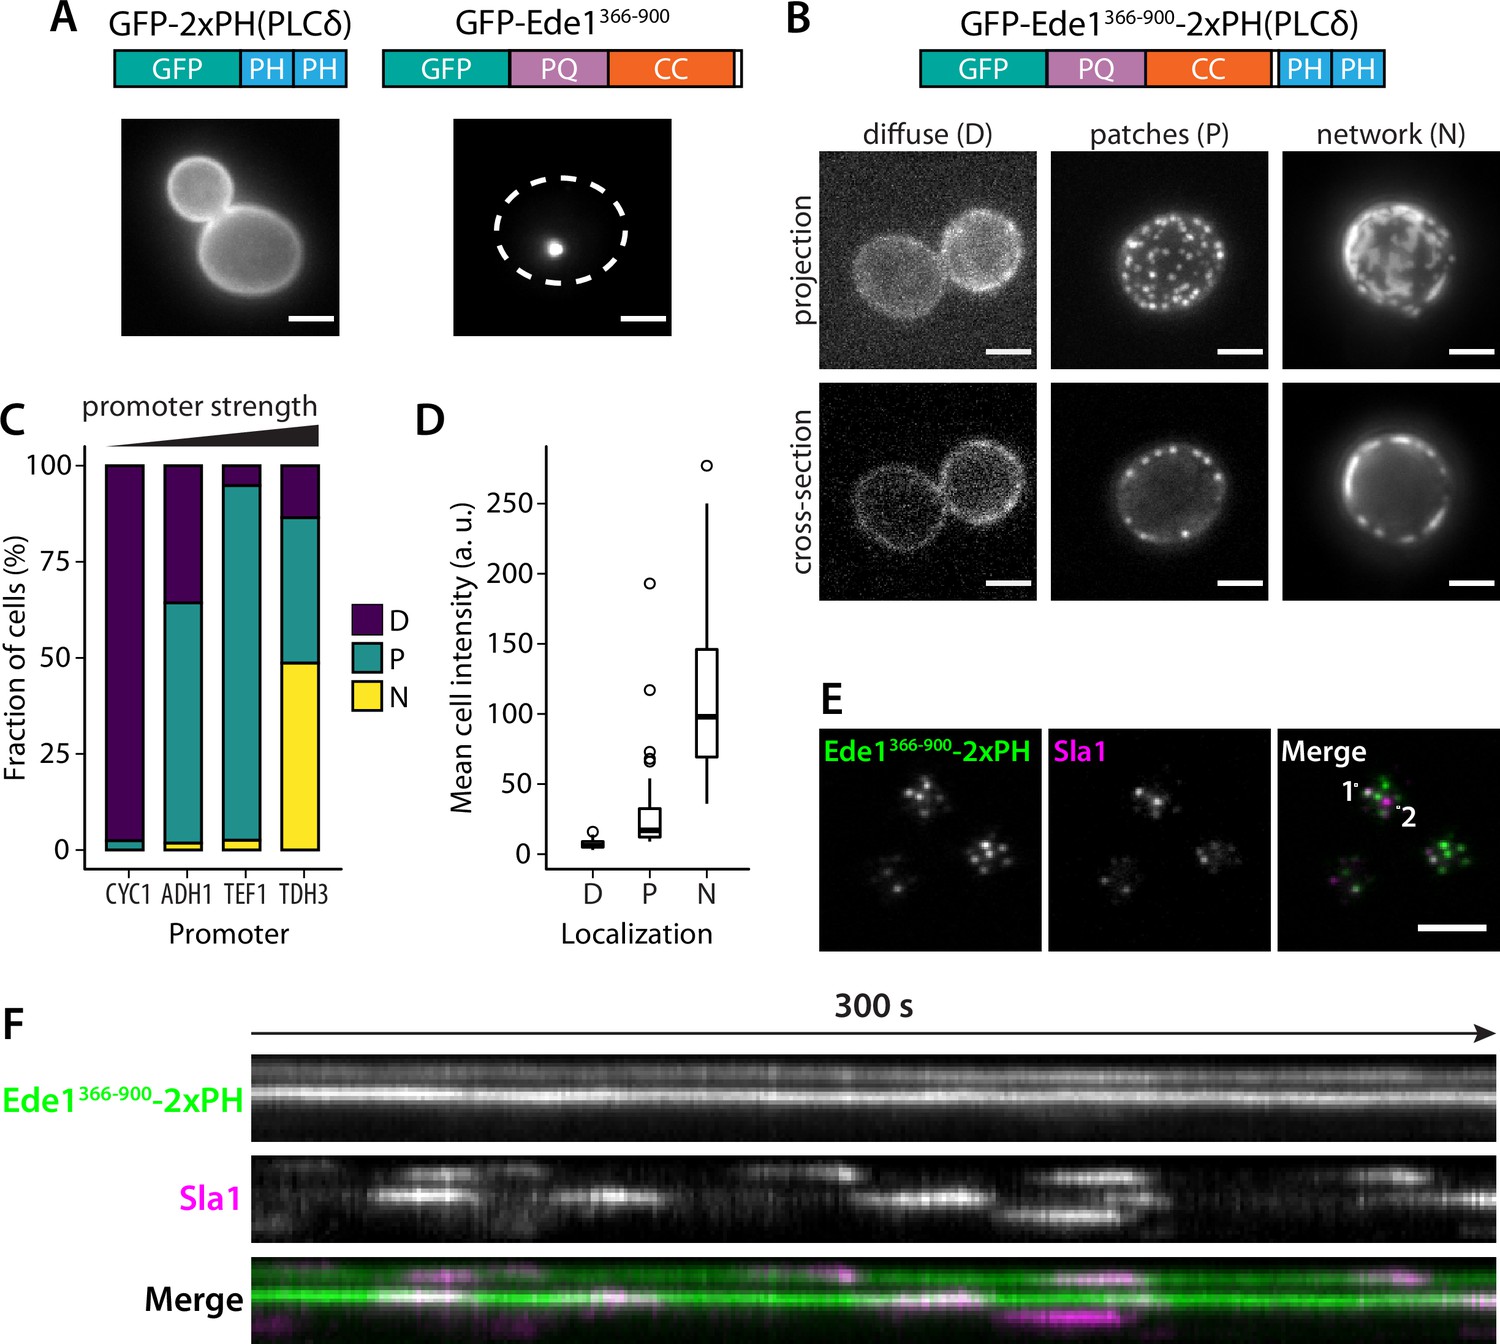
Fusion with Ede1 central region changes the distribution of a PI(4,5)P2 probe.
(A) Maximum projections of cells expressing GFP-2 × PH and GFP-Ede1366-900 from a yeast centromeric plasmid under the control of TDH3 promoter. White dotted line shows cell outline. (B) Cells expressing GFP-Ede1366-900-2×PH from a multicopy plasmid. Examples of different structures classified as ‘Diffuse’, ‘Patches’, or ‘Networks’. (C) and (D) The same construct was expressed from four centromeric plasmids under different promoters. Individual cells were classified as in panel B. Plots show percentage of cells falling into each class per promoter (C), and mean cell pixel intensity per class (D). (E) Movies of cells coexpressing GFP-Ede1366-900-2×PH and Sla1-mCherry were acquired using TIRF microscopy. Single frame from a representative movie; points labeled ‘1’ and ‘2’ mark the top and bottom of the kymograph (F). Scale bars: 2 μm. All cells in this figure: SLA1-mCherry::KANMX4, ede1Δ::natNT2.
-
Figure 9—source data 1
Source data (panels C and D).
- https://cdn.elifesciences.org/articles/72865/elife-72865-fig9-data1-v2.csv
Figure 9—figure supplement 1
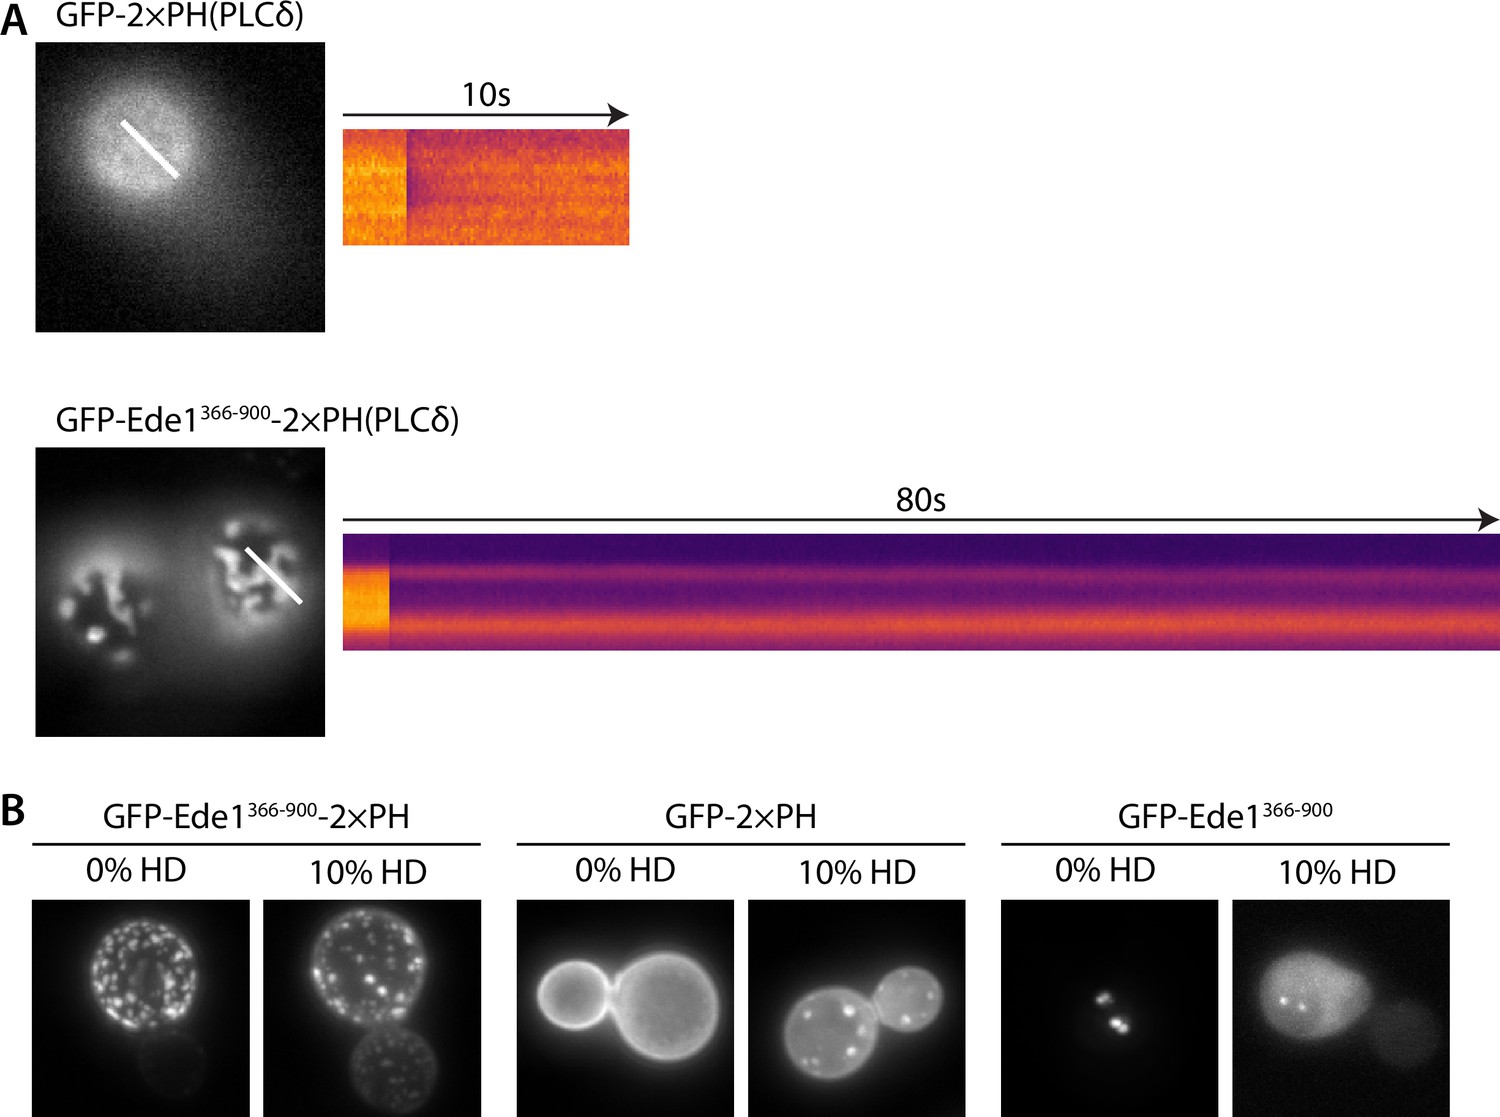
Fluorescence recovery after photobleaching and hexanediol treatment of the fusion construct.
(A) Kymographs of representative photobleaching experiments performed on the GFP-2×PH or GFP-Ede1366-900-2×PH constructs. (B) Effects of 10% 1,6-hexanediol (HD) treatment on cells overexpressing GFP-2 × PH, GFP-Ede1366-900-2×PH, or GFP-Ede1366-900 from a single-copy plasmid under the control of the TDH3 promoter.
Figure 9—video 1
The 5-min TIRF movie of GFP-Ede1366-900-2×PH (green) and Sla1-mCherry (magenta) represented in panels E and F.
Scale bar: 2 μm.
Figure 9—video 2
A 3-min equatorial plane movie of GFP-Ede1366-900−2×PH (green) and Sla1-mCherry (magenta) showing inward movement of Sla1 patches.
Scale bar: 2 μm.
Author response image 1
Author response image 2

Additional files
-
Transparent reporting form
- https://cdn.elifesciences.org/articles/72865/elife-72865-transrepform1-v2.docx
-
Supplementary file 1
Yeast strains and plasmids used in the study.
- https://cdn.elifesciences.org/articles/72865/elife-72865-supp1-v2.xlsx
Download links
A two-part list of links to download the article, or parts of the article, in various formats.
Downloads (link to download the article as PDF)
Open citations (links to open the citations from this article in various online reference manager services)
Cite this article (links to download the citations from this article in formats compatible with various reference manager tools)
Condensation of Ede1 promotes the initiation of endocytosis
eLife 11:e72865.
https://doi.org/10.7554/eLife.72865


