The control and training of single motor units in isometric tasks are constrained by a common input signal
- Department of Bioengineering, Imperial College London, United Kingdom
- Department of Clinical and Movement Disorders, Institute of Neurology, University College London, United Kingdom
- BSICoS, IIS Aragón, Universidad de Zaragoza, Spain
- Bernstein Center Freiburg, University of Freiburg, Germany
- Faculty of Biology, University of Freiburg, Germany
Figures
Figure 1 with 1 supplement
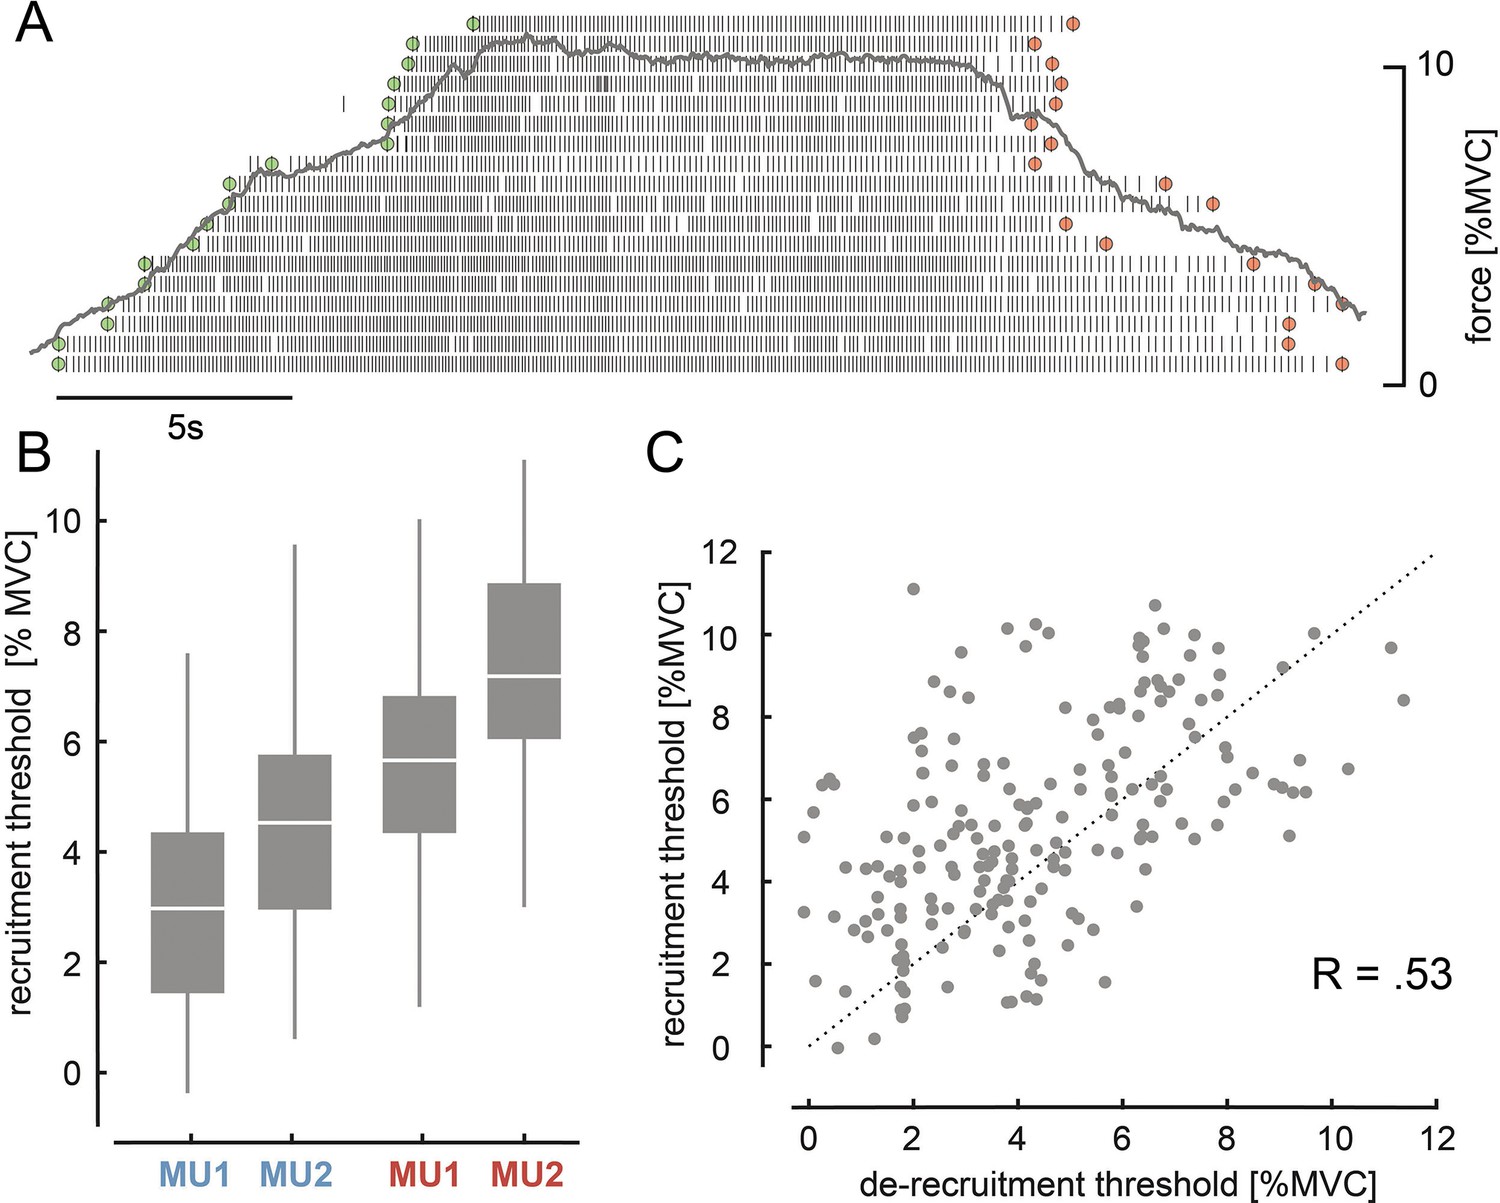
Motor unit (MU) recruitment and de-recruitment.
(A) The identified MU pool ranked on the recruitment order of one representative subject is shown with the underlying force profile (grey). Time points of recruitment (green) and de-recruitment (red) for each MU are marked. (B) Recruitment levels for MU1 and MU2 of the lower (blue) and higher threshold pair (red) across all subjects and days are shown with their median and quartiles. (C) Recruitment and de-recruitment threshold for the selected MUs across all days showed a significant relationship (p<0.001). Dashed line indicates the diagonal. The three subjects for whom no de-recruitment thresholds were determined were neglected in this correlation analysis.
Figure 1—figure supplement 1
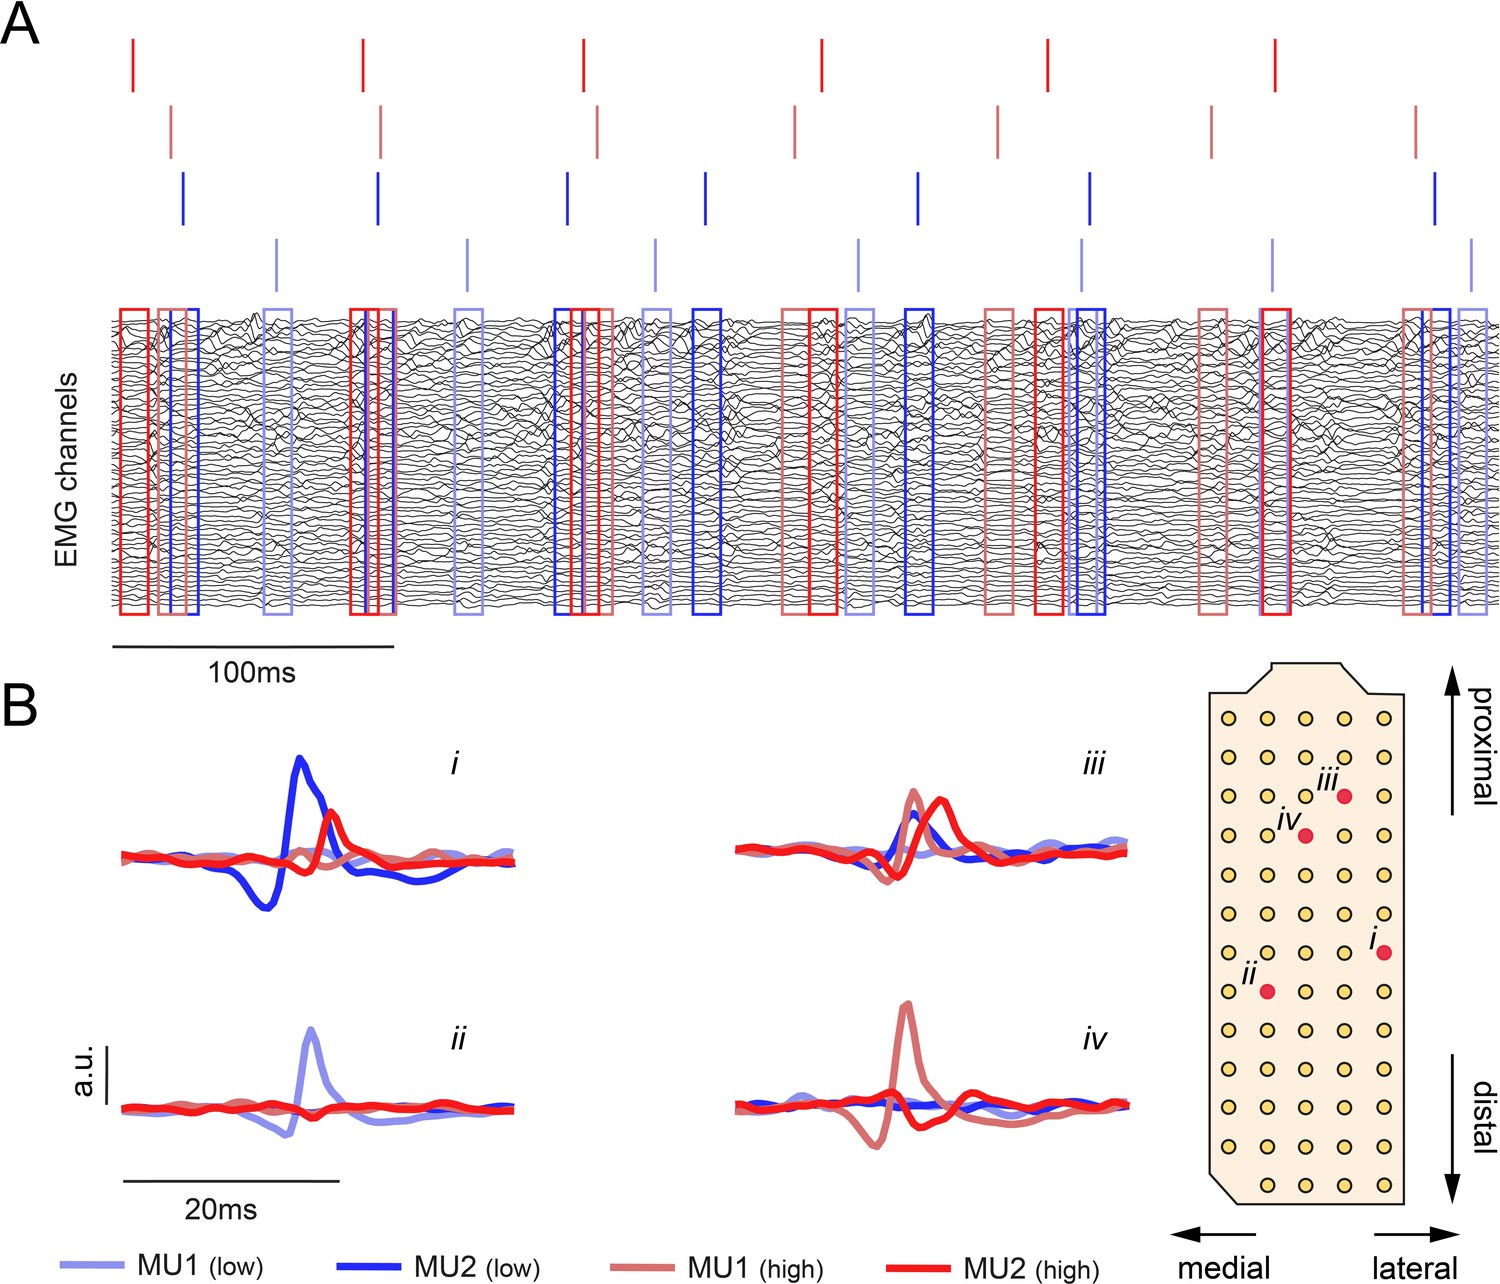
High-density surface electromyogram (HDsEMG) from a single subject.
(A) HDsEMG at 10% maximum voluntary contraction (MVC) during the initial force task overlayed with the spike timing of the four selected motor units (MUs). Rectangles indicate a 10 ms window centred at the time of a detected MU action potential. (B) Spike-triggered average of the four selected MUs over 10 s at 10% MVC at the initial force task for four different locations i–iv. The locations are indicated on the schematic electrode layout on the right. Double differential signals are displayed for visualisation purposes.
Figure 2

Schematic overview of the target task.
High-density surface electromyogram (HDsEMG) of tibialis anterior muscle (TA) was acquired and decomposed from the underlying neural activity in real time. Concurrently, the force due to dorsiflexion of the ankle (red arrow) and bipolar electromyogram (EMG) of fibularis longus (FL), lateral head of the gastrocnemius muscle (GL), and medial head of the gastrocnemius muscle (GM) were recorded. The identified motor unit (MU) pool was ranked accordingly to the recruitment order. Two pairs of MUs with a similar recruitment threshold were selected from the initial (blue) and the latter recruited half (red). During the target task, subjects were instructed to navigate a cursor inside a 2D space by modulating the normalised discharge rate (DR) of MU1 and MU2. The selection of MU1 and MU2 was determined by three different conditions. In condition I, MU1 and MU2 were coming from the low recruitment threshold pair (blue), in condition II from the high recruitment threshold pair (red), while in condition III, the lowest threshold MU of the low threshold pair was pooled with the highest threshold MU of the high threshold pair. During the target task, subjects were asked to stay inside the origin until the target-of-interest (blue) appeared (randomly selected). By navigating the cursor inside the angle area around the target-of-interest, subjects were granted an angle hit (yellow). The trial was terminated when either the subject managed to place and hold the cursor inside the target area (target hit, green) or more than 20 s had passed since the target-of-interest appeared. In each condition, 30 targets are shown, that is, each target 10 times.
Figure 3 with 1 supplement
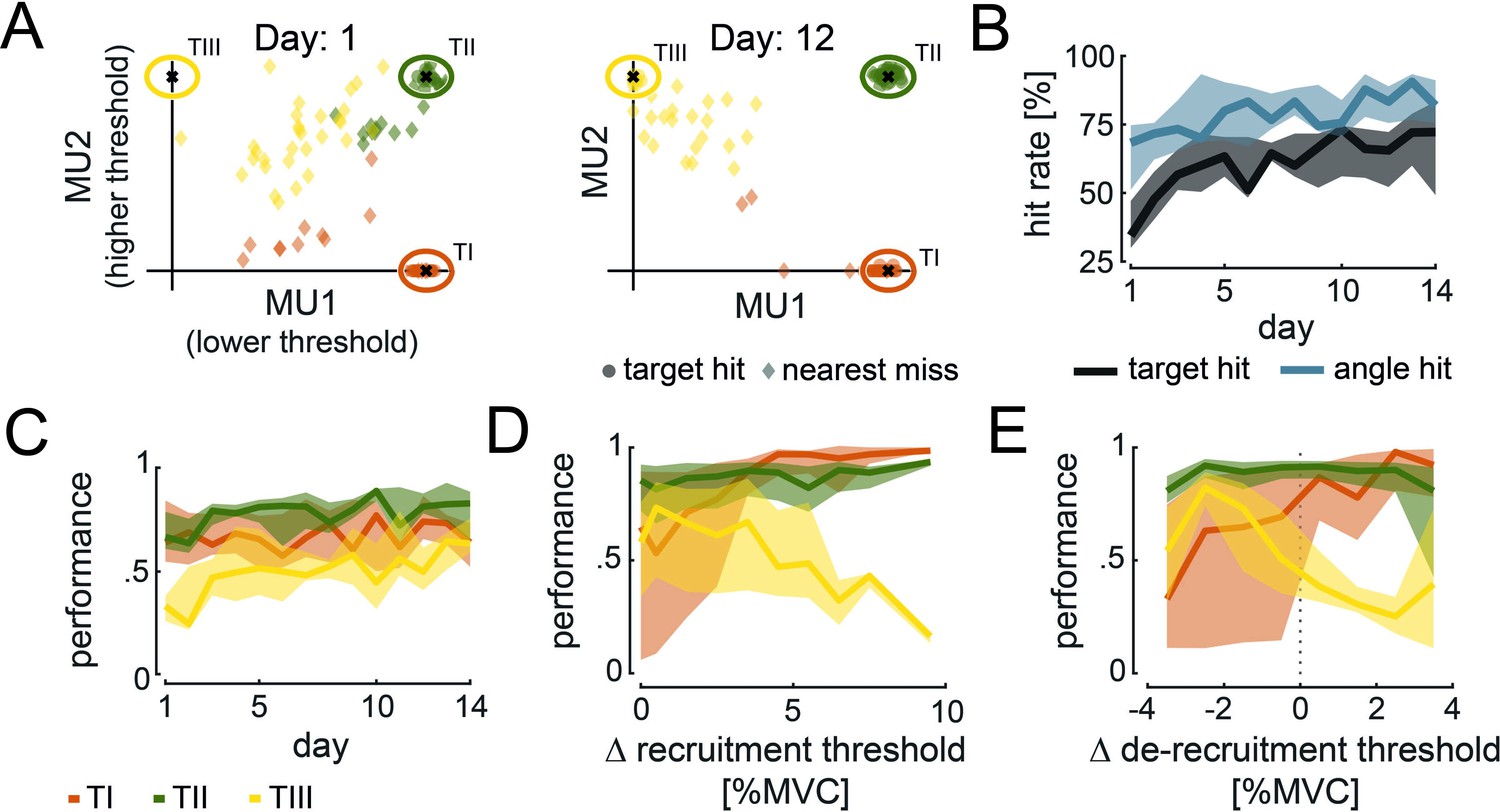
Cursor movement and performance during target task.
(A) Average cursor position during target hits (circle) and nearest misses (diamond) across conditions is shown for the 1st and 12th day of experiments for TI (orange), TII (green), and TIII (yellow) of one subject. (B) Target (black) and angle hit rate (blue) across subjects, conditions, and targets-of-interest are shown with their medians (solid line) and 25 and 75% quartiles (shaded areas) across days. (C) Performance values across subjects and conditions for TI (orange), TII (green), and TIII (yellow) are shown with their medians (solid line) and 25 and 75% quartiles (shaded areas) across days. (D, E) Performance values corresponding to the difference in recruitment threshold (D) and de-recruitment threshold (E) between motor unit (MU)2 and MU1 are shown across subjects and conditions for the last 5 days of training. The median (solid line) and 25 and 75% quartiles (shaded area) for TI (orange), TII (green), and TIII (yellow) are illustrated in steps of 1% maximum voluntary contraction (MVC).
Figure 3—figure supplement 1
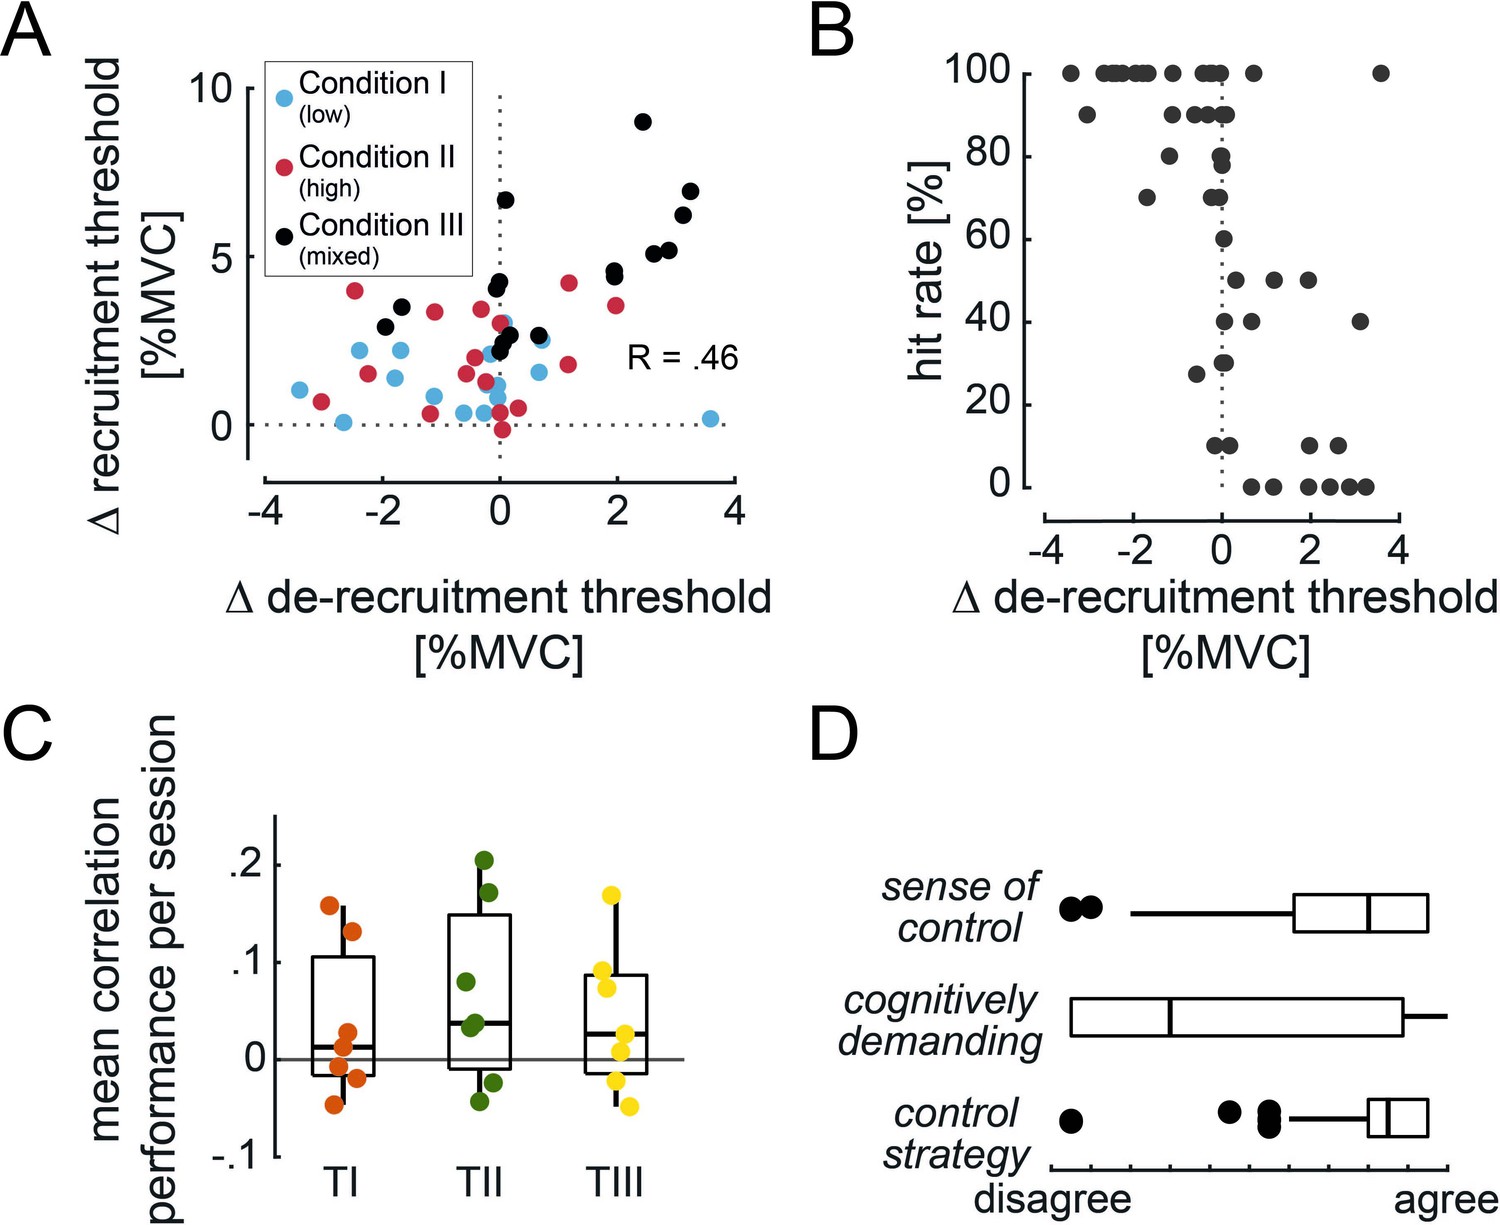
Additional metrics concerning the target-tracking task.
(A) Difference in recruitment threshold of the selected motor unit (MU) pair versus their difference in the de-recruitment threshold for the last 5 days of training (Spearman’s correlation coefficient R=0.46, p=0.001). Each dot represents a MU pair coloured based on the condition. (B) Angle hit rate of all TIII instructed trials during the last 5 days of training versus the within-pair difference in the de-recruitment threshold. (C) Estimation of within-session learning grouped by the three targets TI (orange), TII (green), and TIII (yellow). Learning was estimated by calculating Spearman’s correlation coefficient between performance and consecutive trails per target and condition. Each dot represents the mean correlation coefficient for one subject averaged across conditions and all 14 days of training. A Friedman test revealed no difference between targets (p=0.103). The positive median values indicate small learning within one session across subjects for each target. (D) Subjective experience of controlling MU2 when reaching towards TIII based on the questionnaire response during the last 5 days of training across subjects and conditions are shown by their medians and quartiles.
Figure 4

Cursor trajectories of one subject during the target task.
Cursor movement towards TI (orange, top), TII (green, centre), and TIII (yellow, bottom) in each trial for condition I on the 14th day of one representative subject is shown. Trials 1–10 indicate the 1st to the 10th appearance of each target-of-interest. The grey intensity of the cursor trajectories increases over time within the trial.
Figure 5

Movement towards targets-of-interest.
(A) Relative hit rates of intended and unintended hits (grey) of targets and angles are shown for the targets-of-interest TI, TII, and TIII during the last 5 days of training across subjects for condition I (top), condition II (centre), and condition III (bottom). Note that the hit rates above 100% can be reached for unintended hits when subjects re-entered the target before the trial ended. Colour intensity corresponds to the hit rate. Relative occurrence of direct movement towards TI (orange), that is, only activating motor unit (MU)1 without MU2, and TIII (yellow), that is, only activating MU2 without MU1, during successful attempts (at least angle hits), is shown with respect to the difference in recruitment threshold between MU2 and MU1 (B) and across subjects (C).
Figure 6 with 1 supplement
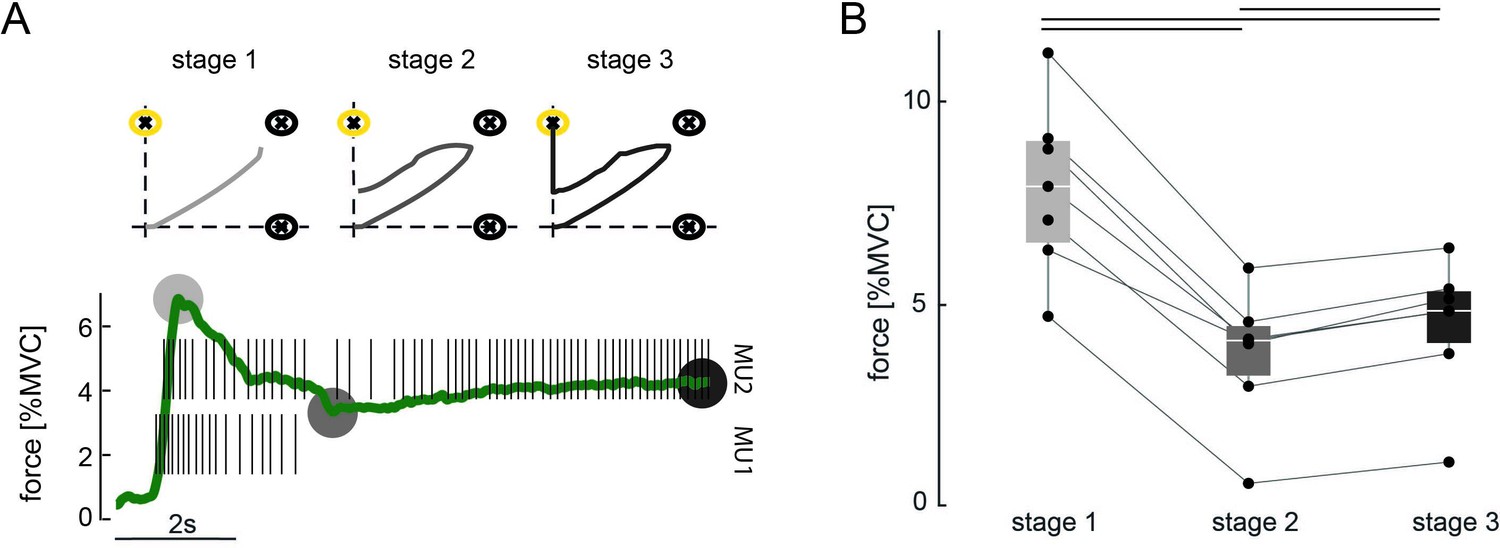
Three-stage approach to hit TIII.
(A) Force due to ankle dorsiflexion (green) and the discharge behaviour of the selected motor unit (MU) pair during a successful attempt of hitting TIII (yellow) for a representative subject. The subject used a three-stage approach to achieve the target task: stage 1: increasing the force to orderly recruit both MUs; stage 2: reducing the force until MU1 stops firing while the cursor is placed along the vertical axis; stage 3: slightly increasing the force again to manoeuvre the cursor inside TIII. Grey circles mark the characteristic force values of each stage. Stage 1: maximum force while both MUs are active; stage 2: minimum force after MU1 stopped firing; stage 3: force during hit of TIII. The corresponding cursor movement for each stage is shown on the top. Grey intensity increases with stages. (B) Characteristic forces (due to ankle dorsiflexion) are shown with their median and quartiles at each stage of control for all subjects across all conditions during all TIII hits in the last 5 days of training. Each dot represents a subject, and corresponding values are connected via the lines. Black bars indicate a significant difference with p<0.05.
Figure 6—figure supplement 1
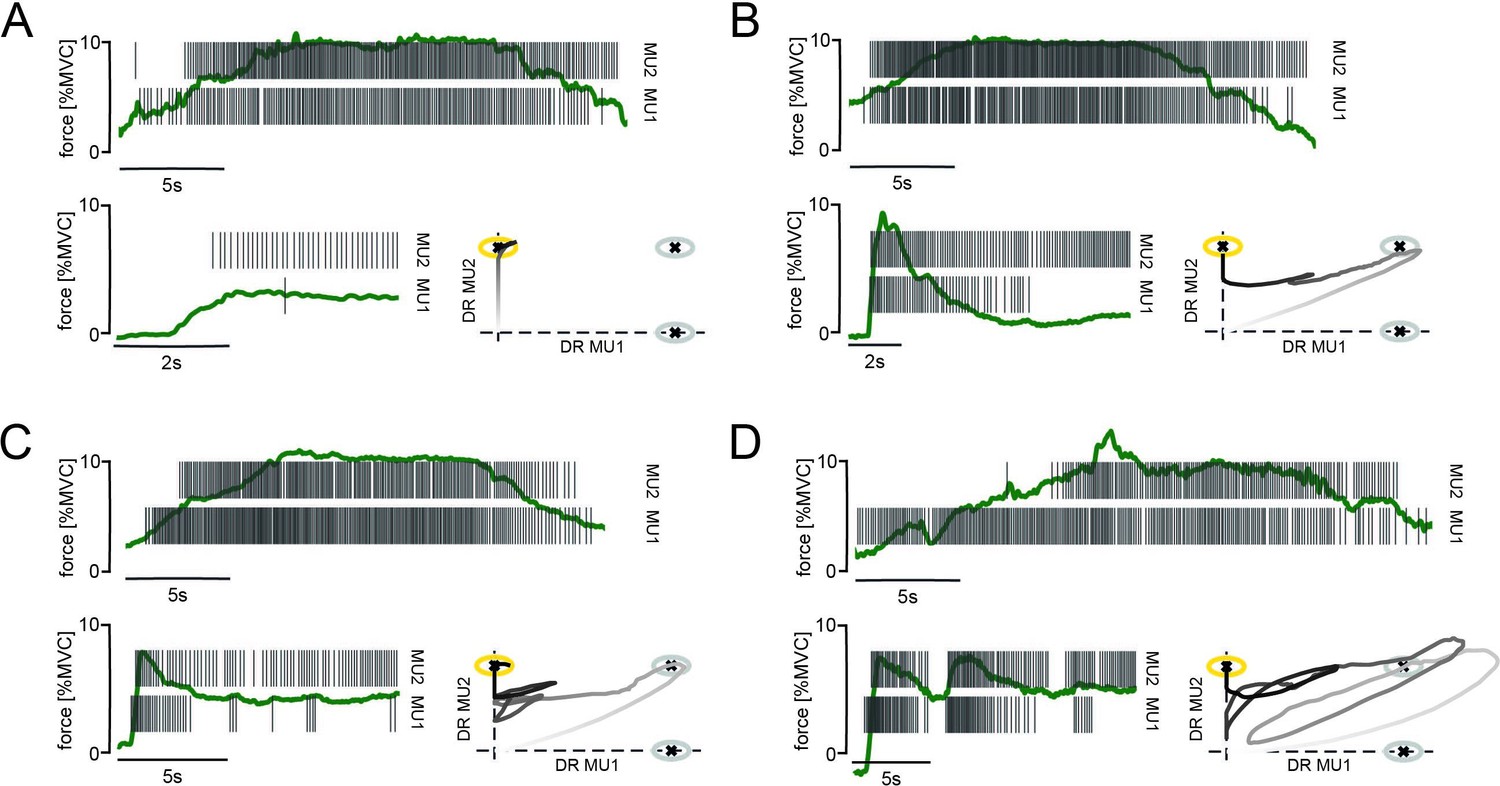
Various successful trials of hitting TIII for different subjects, conditions, and training days.
The top figure in each segment shows the discharge activity of motor unit (MU)1 and MU2 (selected MU pair) and force due to dorsiflexion (green) during the initial force task. The bottom-left figure shows the discharge activity of MU1 and MU2 and the force (green) during a single successful TIII instructed trial, while the bottom-right figure shows the corresponding cursor movement towards TIII (yellow). The grey intensity of the cursor trajectories increases over time within the trial. (A) Direct movement towards TIII besides the initial difference in recruitment threshold. (B) Indirect movement towards TIII. (C, D) Indirect movement towards TIII for an MU pair in which the higher threshold MU (MU2) was initially recruited after and de-recruited before the lower threshold one (MU1). DR: discharge rate.
Figure 7
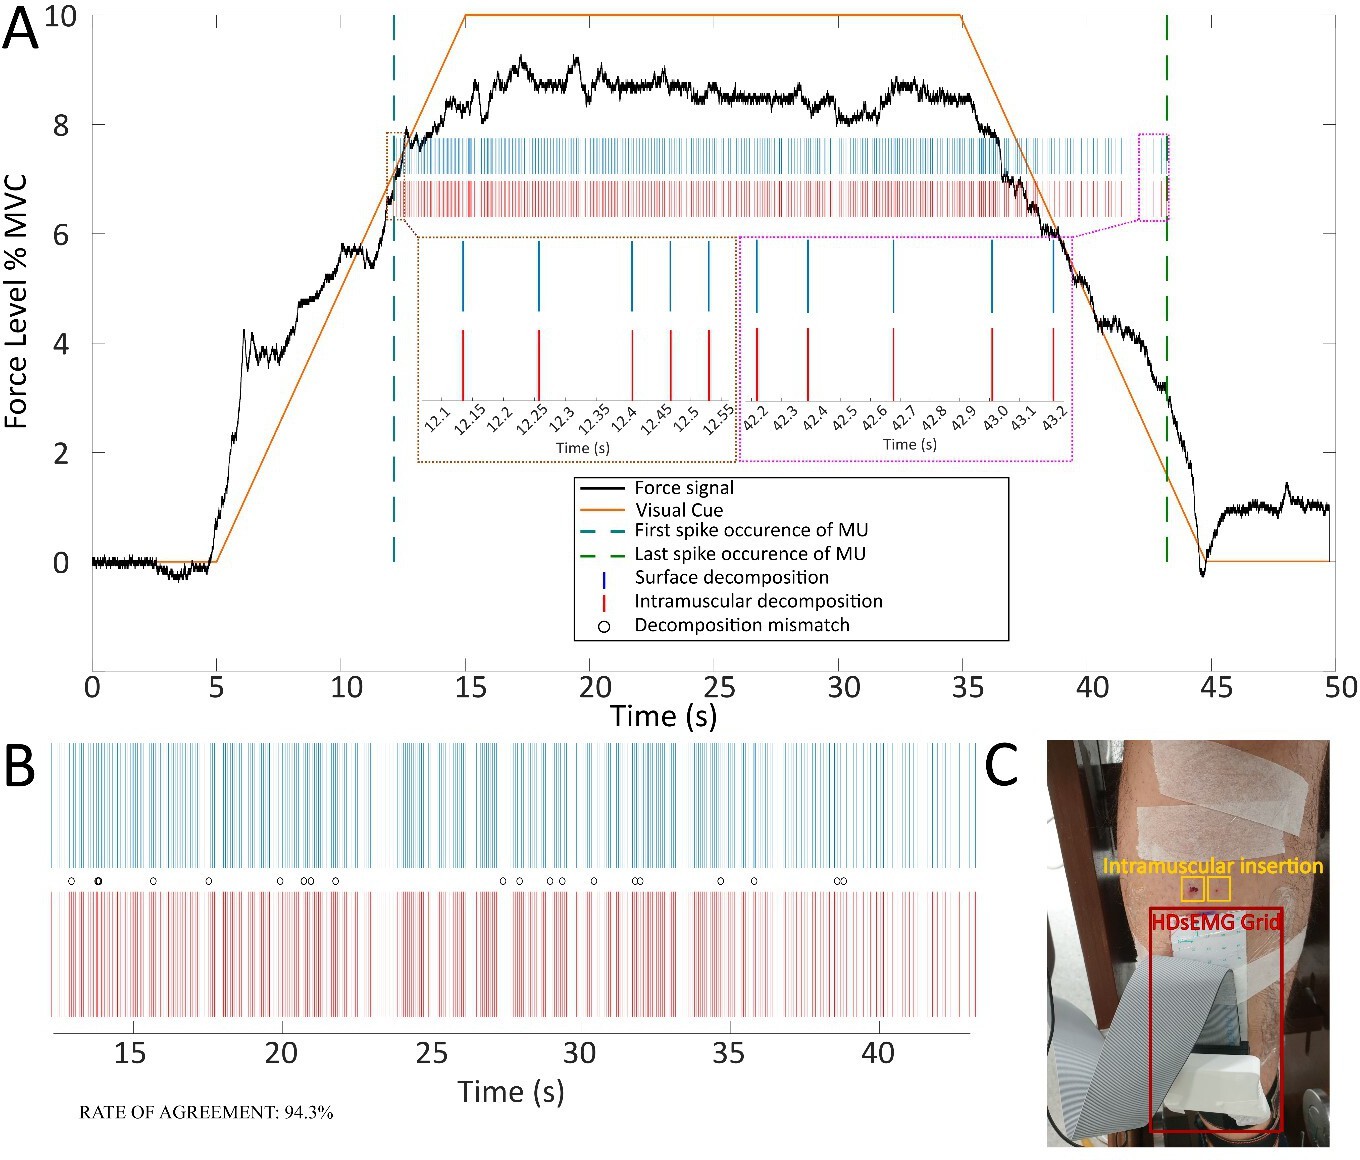
An example two-source validation of surface and intramuscular recorded electromyogram (EMG) signals during recruitment/de-recruitment.
(A) The visual cue provided to the user during the trial (orange solid line), the force feedback on the ankle dorsiflexion (black solid line), the first and last occurrence of motor unit (MU) firing (teal and green dashed lines, respectively) and two subpanels showing the first and last five MU discharges identified for intramuscular and surface decomposed signals (brown and magenta subpanels). (B) The decomposed MU spike train from surface EMG (blue) and intramuscular EMG (red), as well as decomposition mismatches, identified (black circles). (C) The experimental setup for concurrent intramuscular and surface EMG recordings.
Videos
Video 1
A simulation of the biofeedback as shown to the subjects.
Video illustrates biofeedback environment as presented to the subjects during the target task, showing feedback on the motor unit (MU) spiking activity and the resulting cursor movement in the target space. Simulated data stream based on real data of a TII-instructed trial recorded from one exemplary subject. MU1 is shifted by +250 ms every iteration. Simulated data stream loads buffers of new incoming data every 125 ms as during the experiment. The lower-left window shows the incoming discharge behaviour of the selected MUs MU1 and MU2. The right window shows the targets and cursor movement according to the incoming data stream.
Additional files
Download links
A two-part list of links to download the article, or parts of the article, in various formats.
Downloads (link to download the article as PDF)
Open citations (links to open the citations from this article in various online reference manager services)
Cite this article (links to download the citations from this article in formats compatible with various reference manager tools)
The control and training of single motor units in isometric tasks are constrained by a common input signal
eLife 11:e72871.
https://doi.org/10.7554/eLife.72871


