Multiple motors cooperate to establish and maintain acentrosomal spindle bipolarity in C. elegans oocyte meiosis
- Department of Molecular Biosciences, Northwestern University, United States
Figures
Figure 1 with 2 supplements

Dynein is required for acentrosomal pole focusing.
(A) Schematic representation of the Dynein auxin-inducible degron (AID) system for DHC-1 depletion in the C. elegans germ line. Methodologies for all three auxin treatments used in this study are depicted. (B) Immunofluorescence (IF) imaging of one-cell mitotically dividing embryos shows that auxin treatment causes efficient dynein depletion and canonical mitotic spindle defects (n = 22). Shown are tubulin (green), DNA (blue), ASPM-1 (red), and dynein (not shown in merge). (C) IF imaging of oocyte spindles in the Dynein AID strain shows that dynein is localized to the spindle, with increasing enrichment at acentrosomal poles at the anaphase transition; shown are tubulin (green), DNA (blue), dynein (red), and ASPM-1 (not shown in merge). Cortex is represented by the dashed line. (D) Representative images of oocyte spindles (GFP::tubulin and GFP::histone) in germline counting and corresponding quantifications; auxin treatment leads to splayed poles and spindle rotation defects. Cortex is represented by the dashed line. (E) IF imaging of Dynein AID conditions showing effects of 4 hr auxin treatment on metaphase (second row) and anaphase (bottom row); shown are tubulin (green), DNA (blue), ASPM-1 (red), and dynein (not shown in merge). ASPM-1 labeling supports initial observations of splayed poles seen in germline counting. (F) Quantifications of IF imaging shown in (E); meiotic spindles have significantly splayed poles upon auxin treatment. All scale bars = 2.5 µm. Controls for exposure to auxin plates can be found in Figure 1—figure supplement 1. Further experimentation with dynein mislocalization through aspm-1(RNAi) or lin-5(RNAi) can be found in Figure 1—figure supplement 2.
Figure 1—figure supplement 1
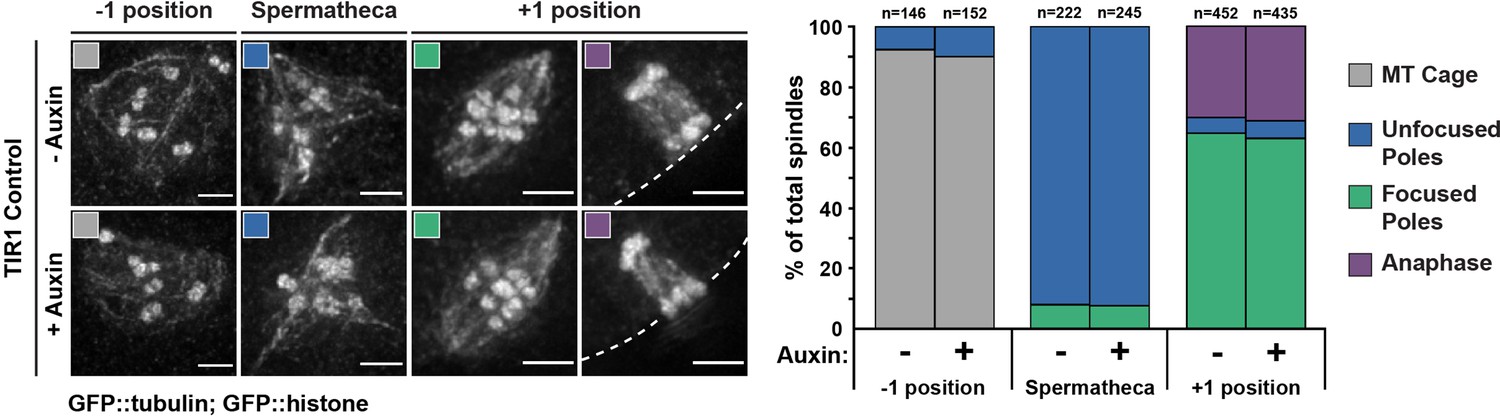
Long-term treatment of wild-type worms with auxin does not have adverse effects on oocyte spindle assembly.
Representative images of spindles (left side) assessed using germline imaging from a worm strain expressing GFP::tubulin, GFP::histone, and TIR1, but lacking degron-tagged DHC-1 (referred to as TIR1 control). Adult worms were either untreated or left on auxin plates for 4 hr, identical to our long-term Dynein auxin-inducible degron (AID) protocol. Three positions in the germline were analyzed to determine if auxin alone had adverse effects on spindle morphology; we observed no change in spindle phenotypes between control and auxin-treated worms. Cortex is represented by the dashed line. All scale bars = 2.5 μm.
Figure 1—figure supplement 2
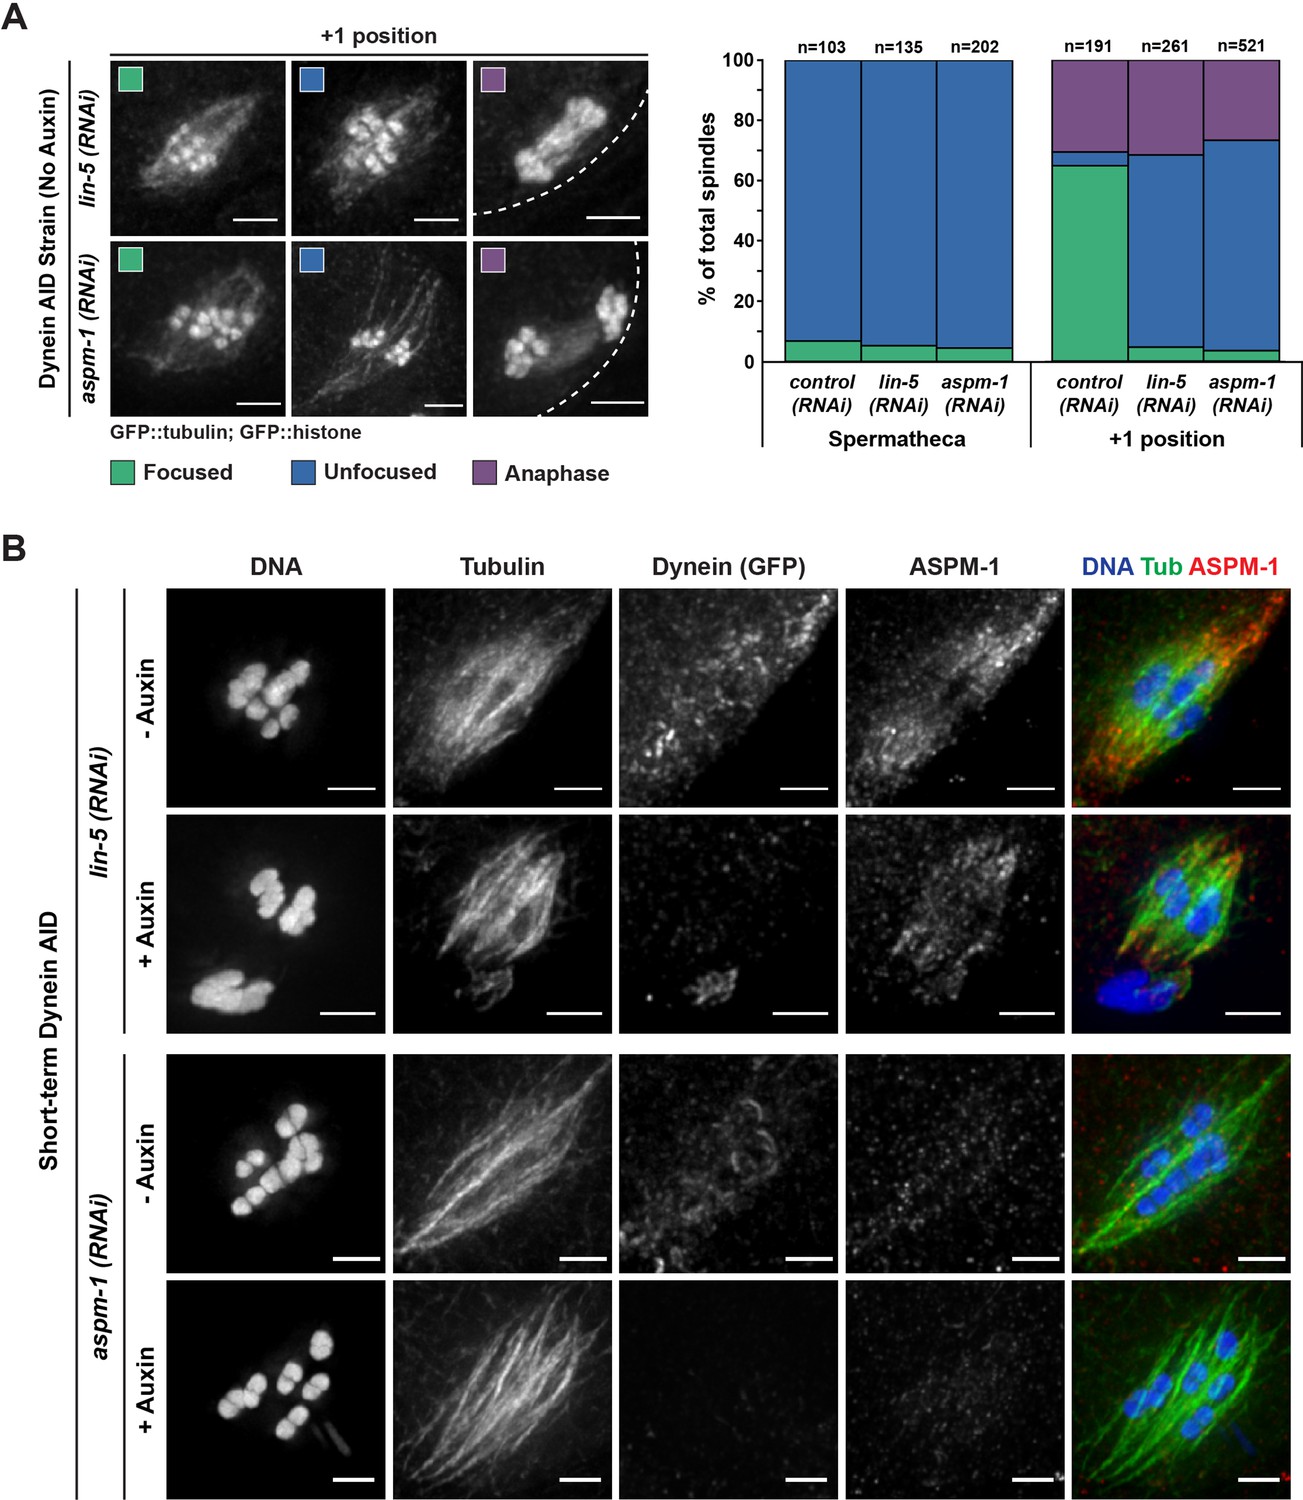
Oocyte spindles assembled following either ASPM-1 or LIN-5 depletion are morphologically similar to Dynein auxin-inducible degron (AID).
(A) Representative images of spindles counted in germline imaging from the Dynein AID strain expressing GFP::tubulin and GFP::histone. In both aspm-1(RNAi) and lin-5(RNAi) conditions, splaying of acentrosomal poles can be observed in the +1 position. We also observed improper spindle rotation during anaphase, consistent with prior studies. Quantification of both aspm-1(RNAi) and lin-5(RNAi) revealed a drastic increase in unfocused poles at the +1 position and demonstrated similar ratios of unfocused poles as those seen in Dynein AID germline counting. Cortex is represented by the dashed line. (B) Immunofluorescence (IF) imaging of embryos from Dynein AID worms following either aspm-1(RNAi) or lin-5(RNAi); shown are tubulin (green), DNA (blue), ASPM-1 (red), and dynein (not shown in merge). ASPM-1 labeling further supports splaying of acentrosomal poles. Concurrent dynein depletion (rows 2, 4) does not appear to exacerbate the spindle defects observed in either aspm-1(RNAi) or lin-5(RNAi) alone. All scale bars = 2.5 μm.
Figure 2 with 3 supplements
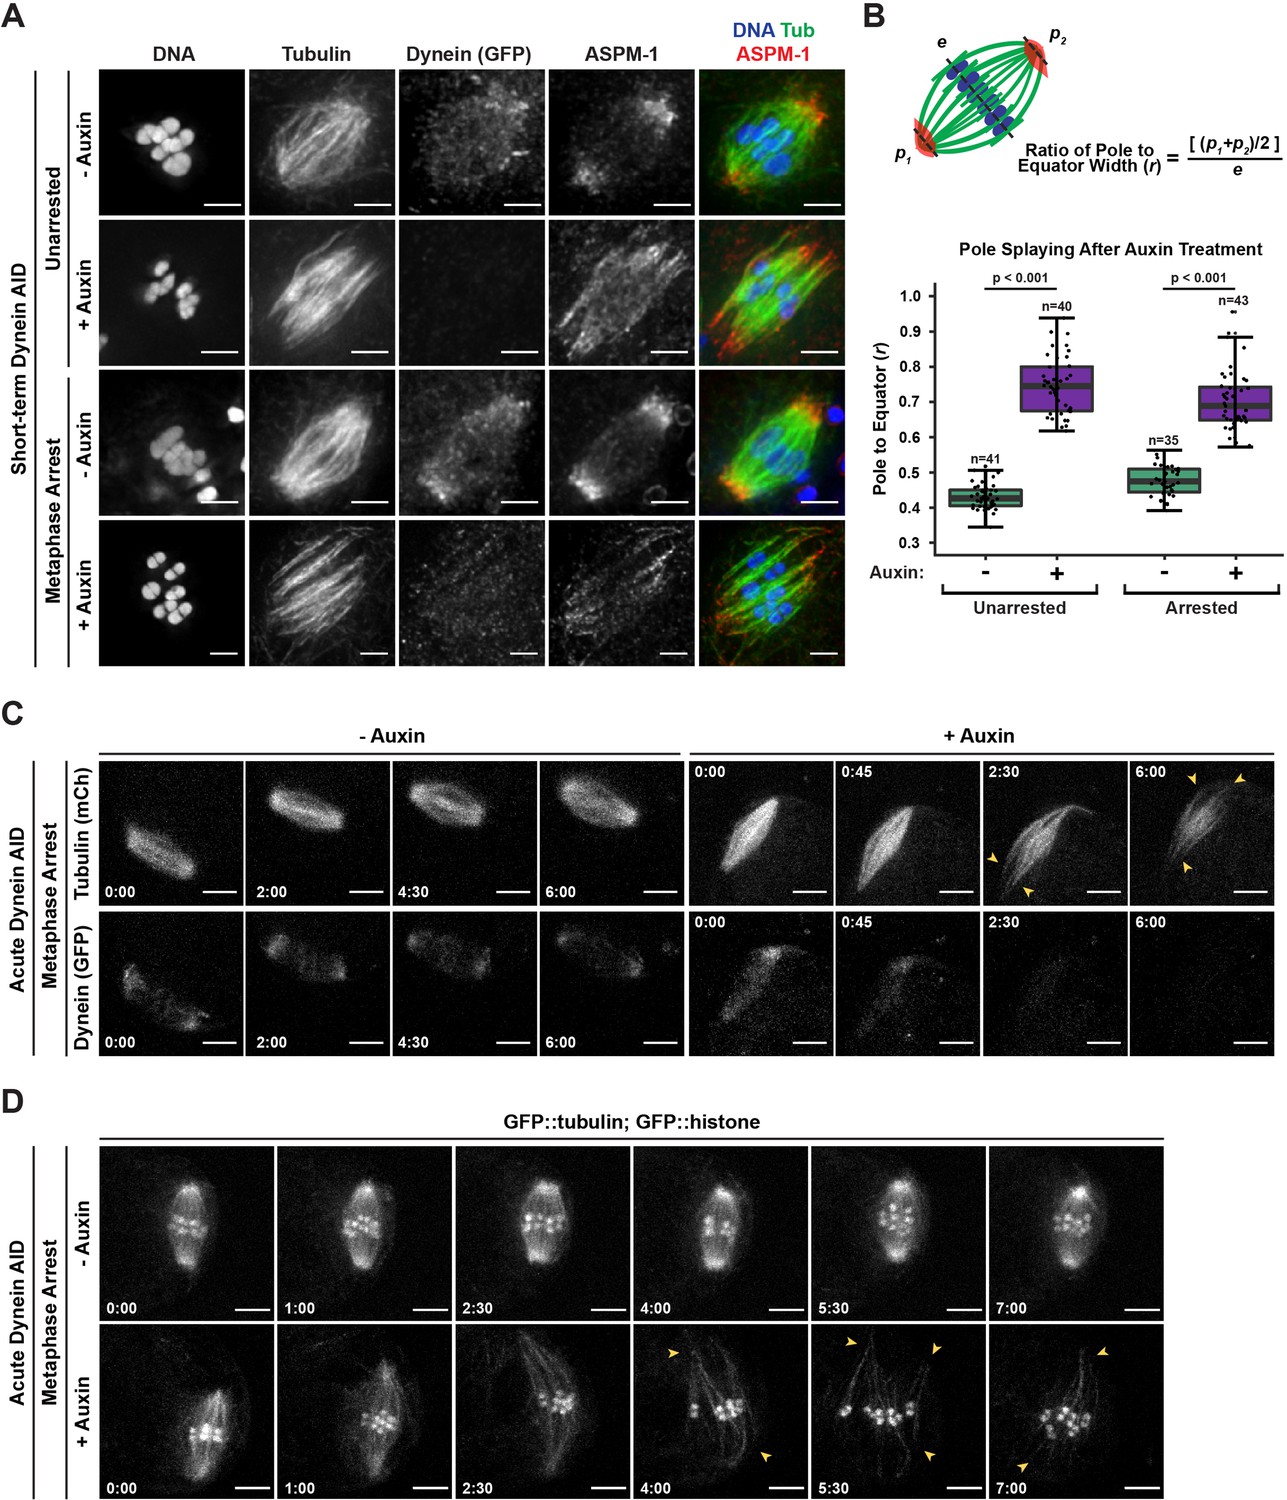
Dynein is required to maintain focused spindle poles.
(A) Immunofluorescence (IF) imaging of oocyte spindles in control or metaphase I-arrest (emb-30(RNAi)) conditions; shown are tubulin (green), DNA (blue), ASPM-1 (red), and dynein (not shown in merge). Acentrosomal poles become unfocused upon acute dynein depletion. Scale bars = 2.5 µm. (B) Quantification of the ratio between the width of the spindle equator and the width of the spindle poles shows that addition of auxin causes nearly all spindle poles to unfocus and splay, both with and without the metaphase arrest. Statistical significance between means of pole splaying was determined via a two-tailed t-test for unarrested and arrested conditions, with a p-value of <2.2 × 10⁻¹⁶ for both. Further quantification of changes in spindle length and microtubule minus end distribution upon auxin treatment can be seen in Figure 2—figure supplement 1A and B. (C) Ex utero live imaging of metaphase-arrested spindles; vehicle-treated control oocytes are shown on the left, auxin-treated oocytes are shown on the right. Addition of auxin causes rapid depletion of dynein (labeled with GFP, bottom row) and dynamic splaying of both spindle poles (shown using mCherry::tubulin, top row; arrowheads). Time elapsed shown in min:s. Scale bars = 5 µm. (D) Ex utero live imaging of metaphase-arrested spindles, shown using GFP::tubulin and GFP::histone; addition of auxin (bottom row) causes dynamic splaying of poles (arrowheads) but does not grossly disrupt chromosome alignment; vehicle-treated control oocytes are shown on the top row. Time elapsed shown in min:s. Scale bars = 5 µm. Controls for effects of auxin alone in ex utero imaging can be seen in Figure 2—figure supplement 2. Additional ex utero imaging of unarrested oocytes treated with auxin can be seen in Figure 2—figure supplement 3.
-
Figure 2—source data 1
The source data for Figure 2B is provided.
The equator and pole widths are listed for each spindle, as well as the calculated pole/equator ratio; data for unarrested (control(RNAi)) and metaphase I-arrested (emb-30(RNAi)) spindles are listed in separate tabs.
- https://cdn.elifesciences.org/articles/72872/elife-72872-fig2-data1-v3.xlsx
Figure 2—figure supplement 1
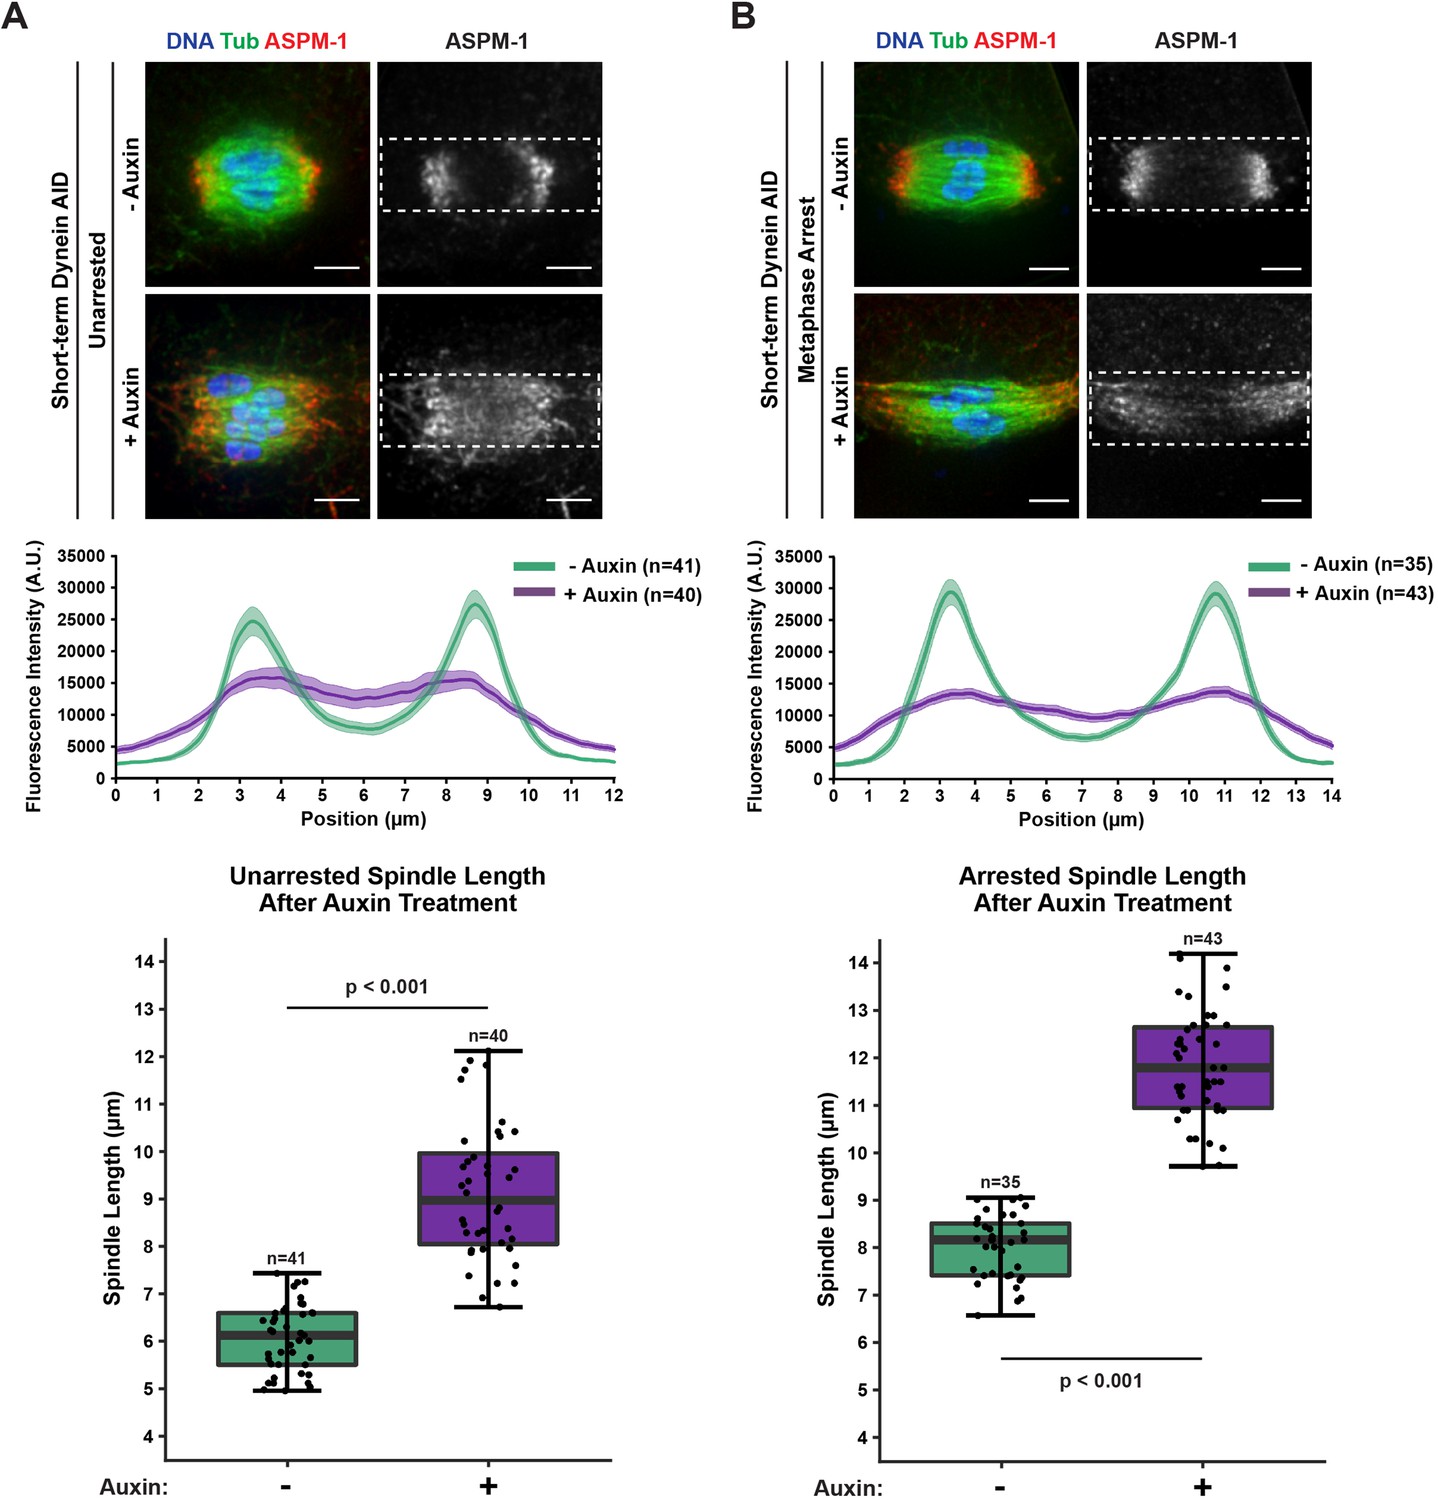
Acute dynein depletion leads to dispersion of ASPM-1 across the spindle and increased pole-to-pole spindle length.
Representative immunofluorescence (IF) images showing the phenotype of acute dynein depletion from control spindles (A) or metaphase-arrested (emb-30(RNAi)) spindles (B) in Dynein auxin-inducible degron (AID) worms; shown are microtubules (green), DNA (blue), and ASPM-1 (red). Dashed rectangles represent ROI used for linescan measurements (4 μm tall × 12 or 14 μm wide). Quantifications of fluorescence intensity across the length of the spindle demonstrate that dynein depletion leads to considerably more uniform and dispersed ASPM-1 localization. All images used for linescan analysis were also measured for pole-to-pole spindle length, and these measurements were plotted in corresponding boxplots (boxes represent first quartile, median, and third quartile). Upon addition of auxin, the spindle is significantly longer. All scale bars = 2.5 μm. Statistical significance between means of spindle length was determined via a two-tailed t-test for unarrested and arrested conditions, with a p-value of <2.2 × 10⁻¹⁶ for both.
-
Figure 2—figure supplement 1—source data 1
The spindle length measurements for unarrested (control(RNAi)) and metaphase I-arrested (emb-30(RNAi)) spindles are listed in separate tabs.
The spindle length measurements (in μm) are provided for each image, as well as the averages lengths and standard errors with and without auxin.
- https://cdn.elifesciences.org/articles/72872/elife-72872-fig2-figsupp1-data1-v3.xlsx
-
Figure 2—figure supplement 1—source data 2
The measurements of ASPM-1 intensity across each spindle for unarrested (control(RNAi)) and metaphase I-arrested (emb-30(RNAi)) spindles are listed in separate tabs.
The raw intensity at each position across the spindle is provided for each image, as well as the average values and standard errors with and without auxin.
- https://cdn.elifesciences.org/articles/72872/elife-72872-fig2-figsupp1-data2-v3.xlsx
Figure 2—figure supplement 2
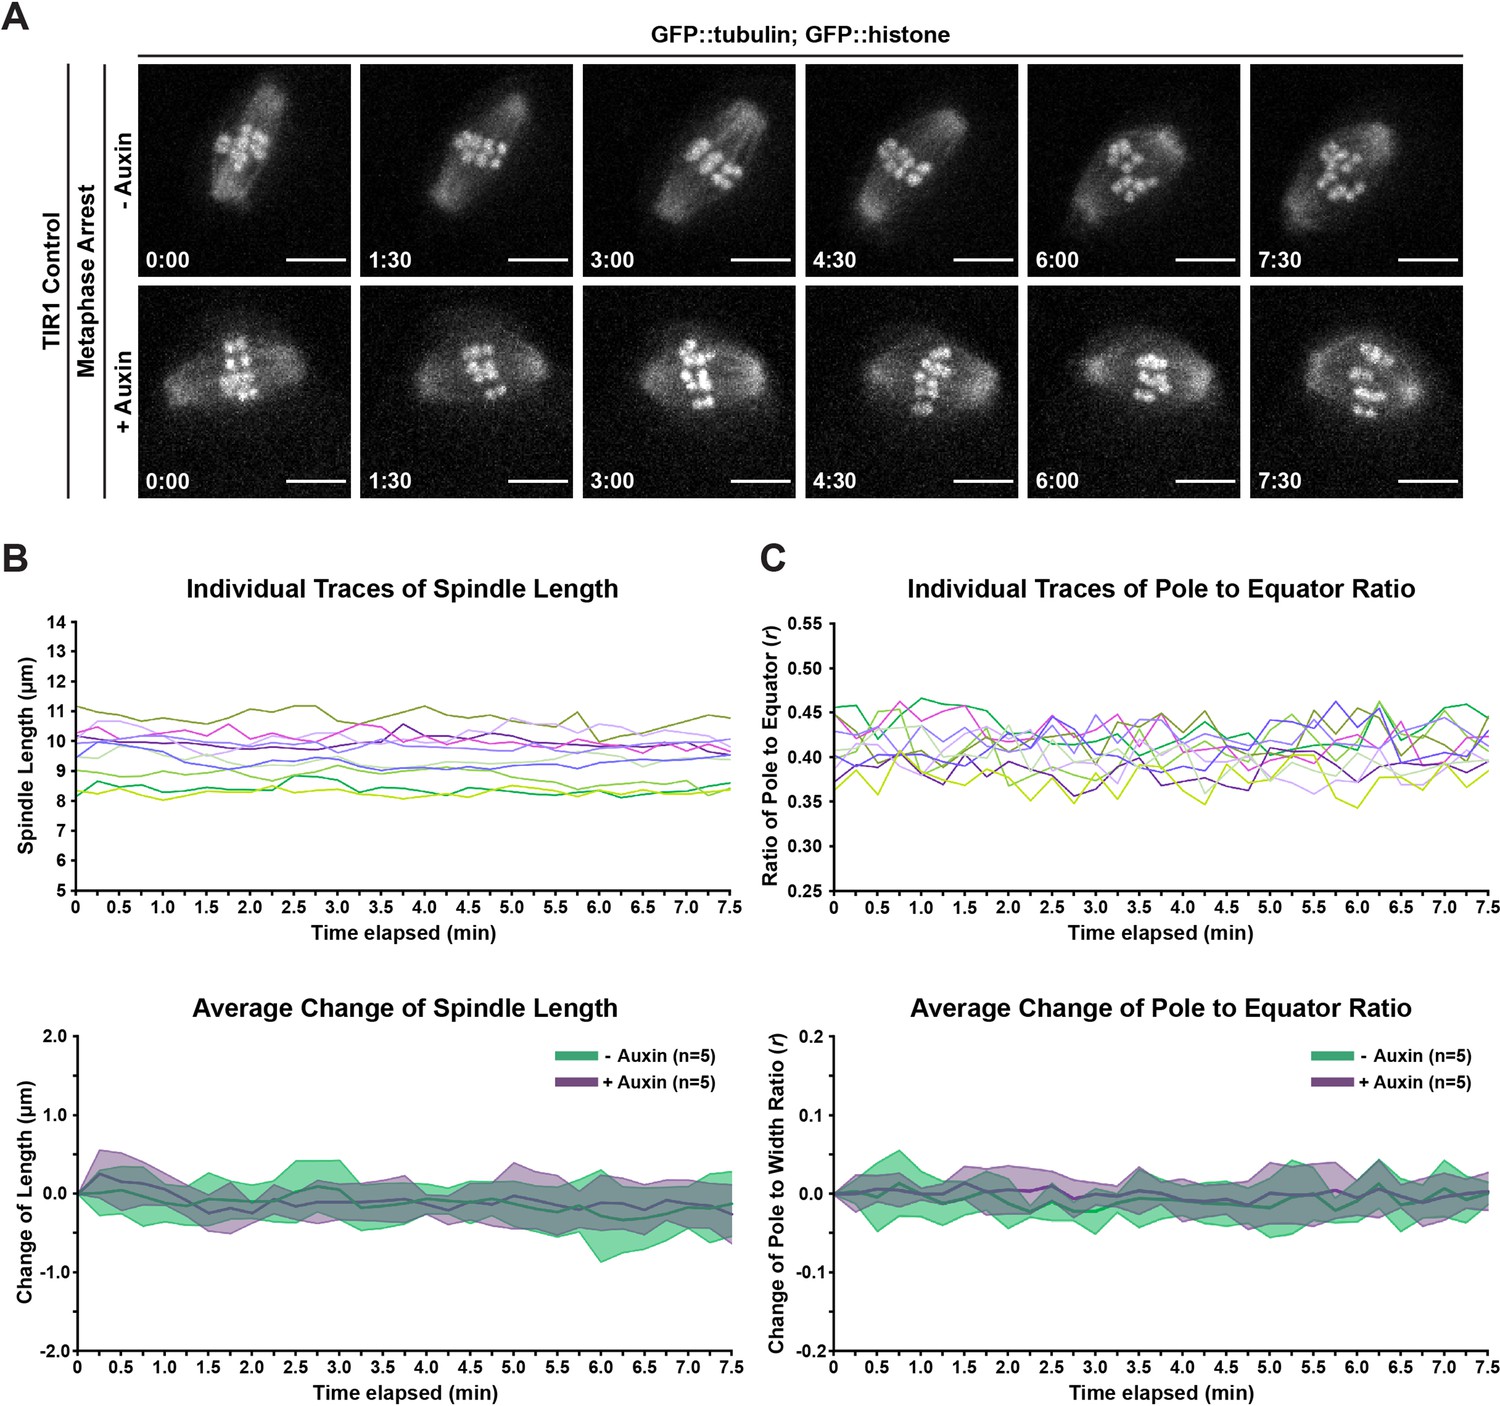
Treatment of wild-type oocytes with auxin during ex utero imaging does not perturb spindle architecture or organization.
(A) Representative timelapses of metaphase-arrested spindles in oocytes expressing GFP::tubulin, GFP::histone, TIR1, but lacking degron-tagged DHC-1 (referred to as TIR1 control). Oocytes were treated to the same ex utero live imaging protocol used in our acute Dynein auxin-inducible degron (AID) experiments and dissected into either control Meiosis Medium or Meiosis Medium containing auxin. The addition of auxin alone does not appear to have any effect on spindle morphology or organization. Time elapsed shown in min:s. Scale bars = 5 µm. (B) Quantifications of spindle length in timelapses shown in (A); both individual traces and average change of spindle length are displayed. No significant change in spindle length was observed between control and auxin-treated oocytes. For average change plots, shaded area represents the standard deviation between timelapses in that condition. (C) Quantifications of pole splaying ratio (r) in timelapses shown in (A); both individual traces and average change of pole splaying ratio are displayed. No significant change in this ratio was observed between control and auxin-treated oocytes. For average change plots, shaded area represents the standard deviation between timelapses in that condition.
-
Figure 2—figure supplement 2—source data 1
The measurements for spindle length and pole/equator width are listed in separate tabs.
The measurements (in μm) are provided for each frame (taken every 15 s) of each movie.
- https://cdn.elifesciences.org/articles/72872/elife-72872-fig2-figsupp2-data1-v3.xlsx
Figure 2—figure supplement 3
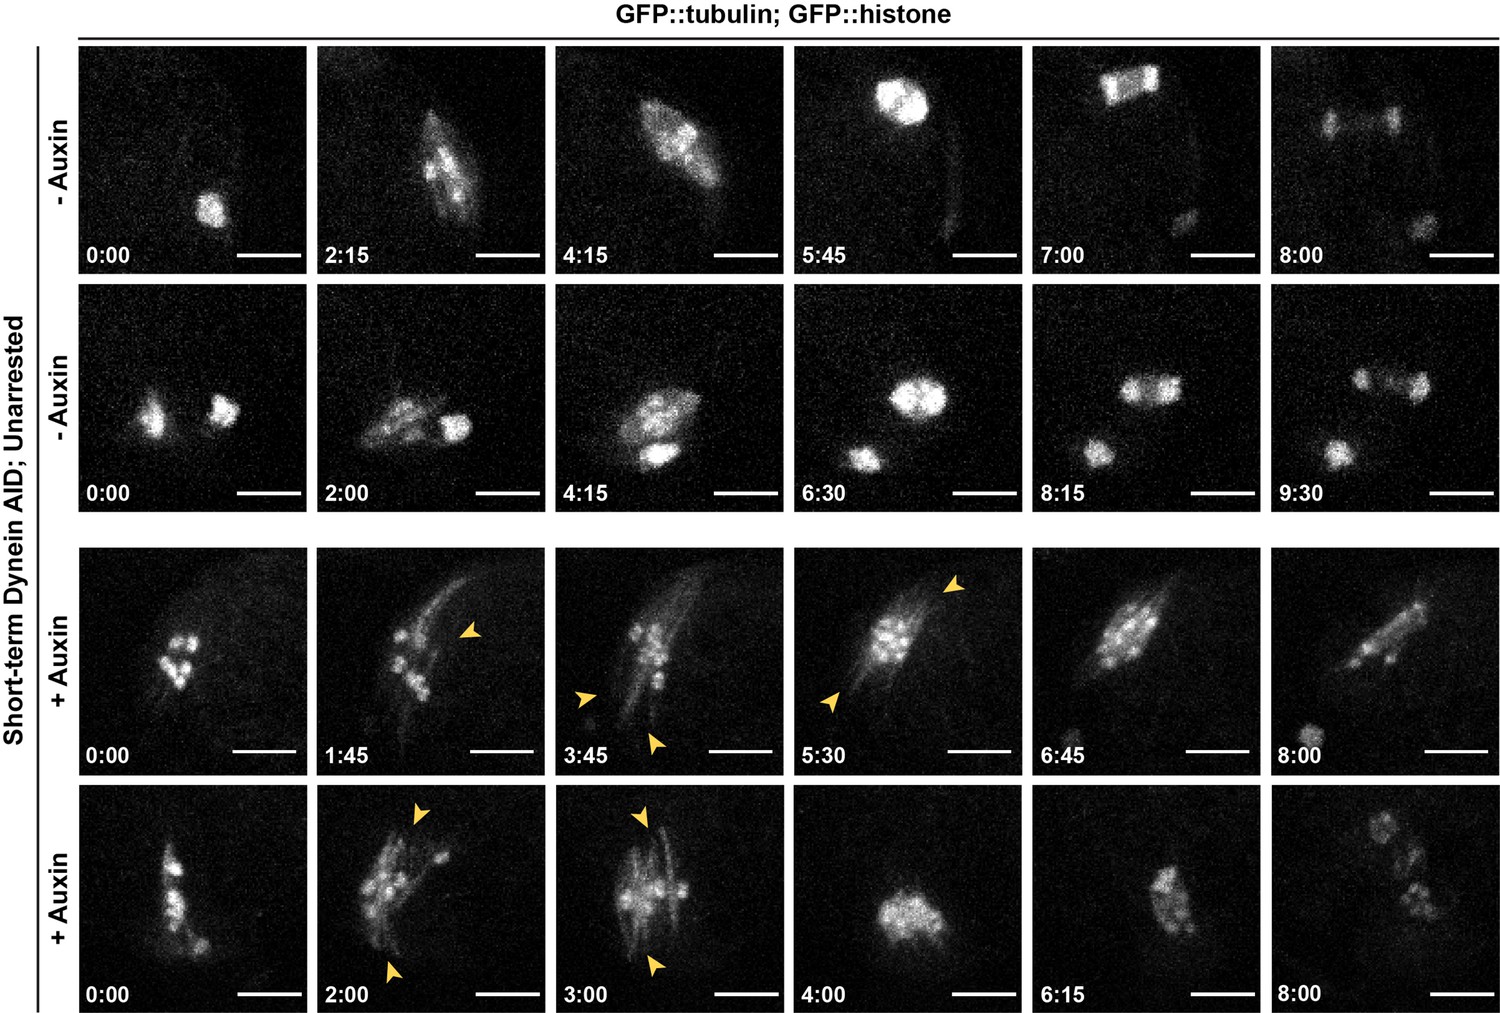
Phenotypes seen in dynein depletion are not an artifact of metaphase arrest.
Repeats of ex utero live imaging in Figure 2D, but with unarrested oocytes (two examples per condition). Splaying of spindle poles (arrowheads) is identical to splaying observed in metaphase-arrested spindles (Figure 2C and D). We also observed spindle rotation defects and lagging chromosomes in anaphase, consistent with prior studies. Time elapsed shown in min:s. t = 0 is defined as the start of meiosis II; oocytes where the first polar body had been extruded but where the meiosis II spindle had not yet formed were selected for imaging. Scale bars = 5 µm.
Figure 3
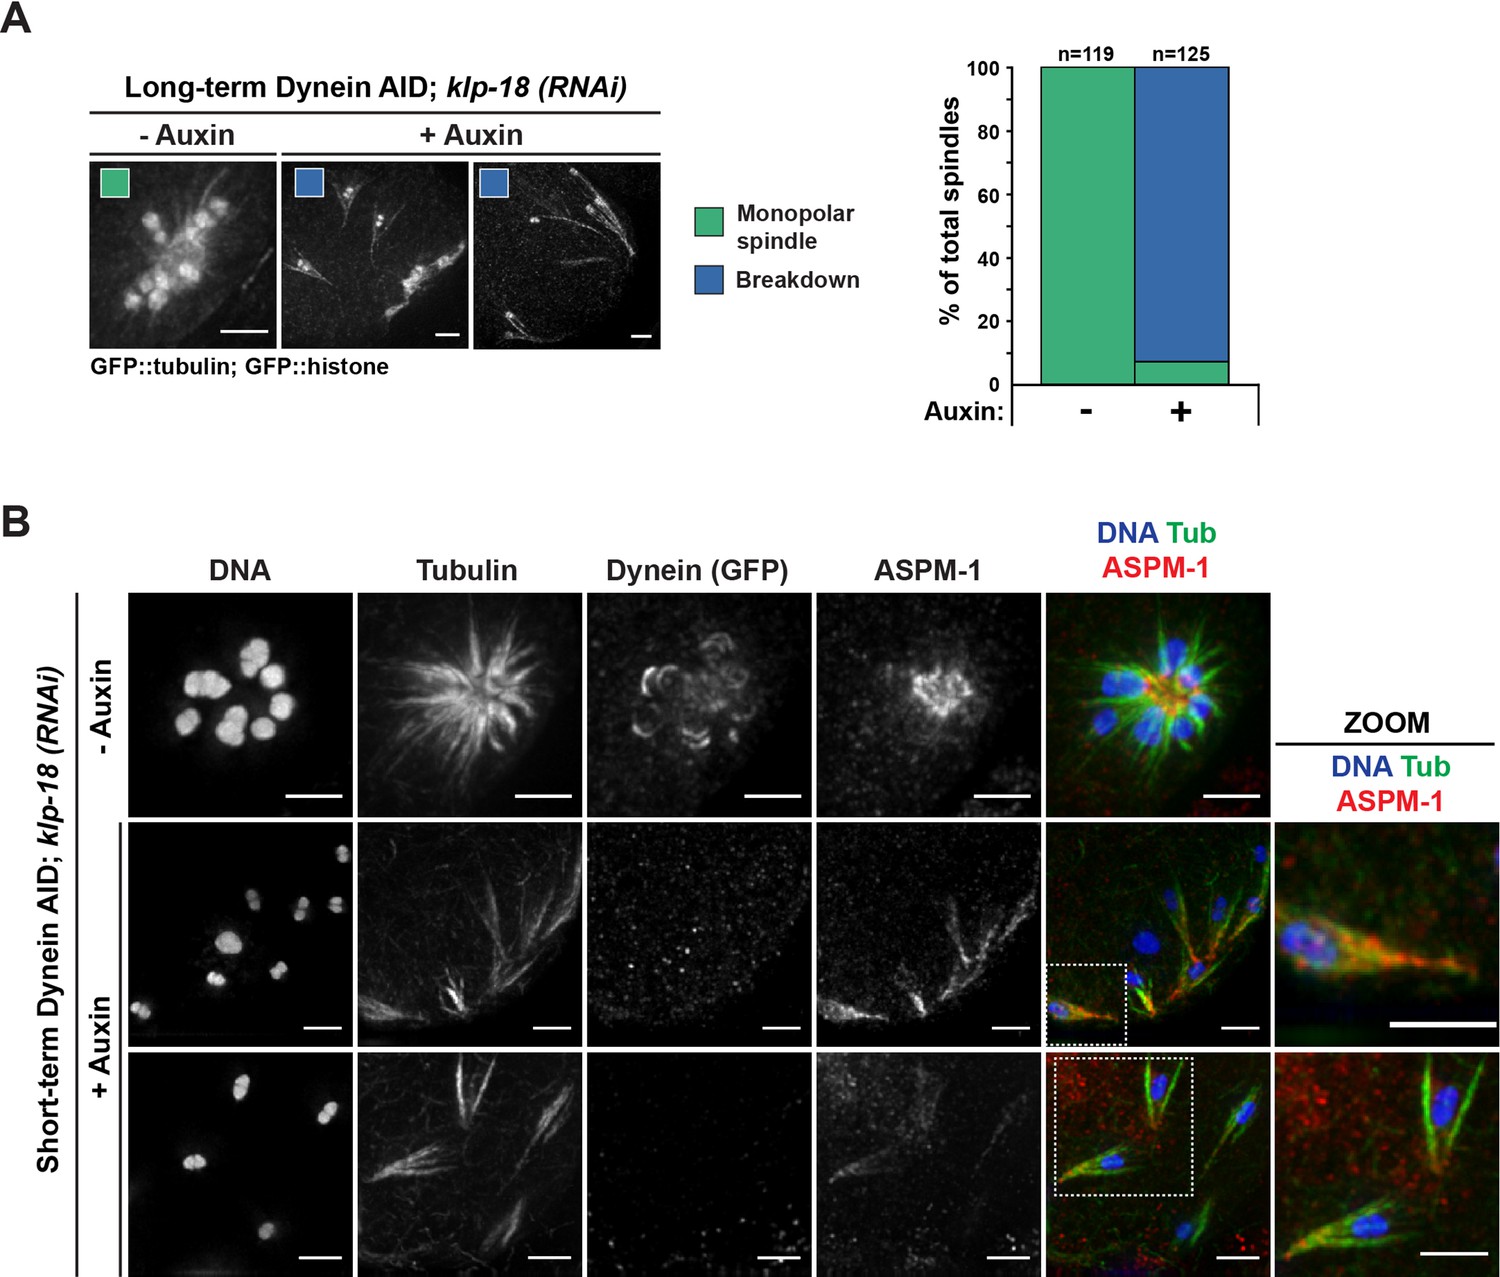
Monopolar spindles break down upon dynein depletion.
(A) Representative images of klp-18(RNAi) oocyte spindles (GFP::tubulin and GFP::histone) in germline counting and corresponding quantifications; dynein depletion leads to dissolution of monopoles, releasing chromosomes with associated microtubule bundles into the cytoplasm. Scale bars = 2.5 μm (B) Immunofluorescence (IF) imaging of monopole breakdown after dynein depletion; shown are tubulin (green), DNA (blue), ASPM-1 (red), and dynein (not shown in merge). Chromosomes released into the cytoplasm retain lateral microtubule associations (zooms). Scale bars = 2.5 μm; note that the +Auxin images are zoomed out more since chromosomes are more dispersed following monopole breakdown and a larger region needed to be imaged.
Figure 4

Individualized chromosomes undergo anaphase-like segregation in the absence of KLP-18 and dynein.
(A) Ex utero live imaging of oocytes expressing GFP::tubulin and GFP::histone in control and klp-18(RNAi) conditions. In the control (top row), a monopolar spindle forms and then chromosomes move back towards the monopole in anaphase, as previously described (Muscat et al., 2015). Addition of auxin to acutely deplete dynein (row 2) leads to rapid breakdown of monopolar spindles. Intriguingly, individualized chromosomes undergo an anaphase-like segregation post-breakdown (zooms, row 3). Microtubule bundles remain laterally associated with chromosomes (arrowheads) prior to anaphase-like segregation. Time elapsed shown in min:s. Scale bars = 5 µm. (B) Another example of acute auxin treatment, to remove dynein, from an oocyte expressing GFP::tubulin and GFP::histone in klp-18(RNAi) conditions; after breakdown of the monopole and reorganization of microtubules (arrowheads), individual chromosomes are able to undergo synchronized anaphase-like segregation. Time elapsed shown in min:s. Scale bars = 5 µm. (C) Quantification of timelapses from control anaphases (the Dynein auxin-inducible degron [AID] strain without auxin), anaphases following dynein depletion (the Dynein AID strain with auxin), and miniature anaphases. Each timelapse was synchronized to initiation of anaphase A, and the distance between the center of each chromosome was measured at each 15 s timepoint. For each condition, the number of timelapses used is represented by n, and the shaded area around each average line represents the SEM. Note that for the mini anaphase condition, though we used five movies, we measured multiple mini anaphases in each (total anaphases = 35). Miniature anaphases do not exhibit significant differences in segregation rates or distances to wild-type anaphase spindles, but do not reach distances of dynein depletions alone.
-
Figure 4—source data 1
The source data for Figure 4C is provided.
The chromosome segregation distances (in μm) for each timepoint are shown for control spindles (control(RNAi) without auxin), dynein-depleted spindles (control(RNAi) with auxin), and mini spindles (klp-18(RNAi) with auxin). The compiled data is in the first tab, and raw data for each condition is listed in separate tabs.
- https://cdn.elifesciences.org/articles/72872/elife-72872-fig4-data1-v3.xlsx
Figure 5 with 2 supplements
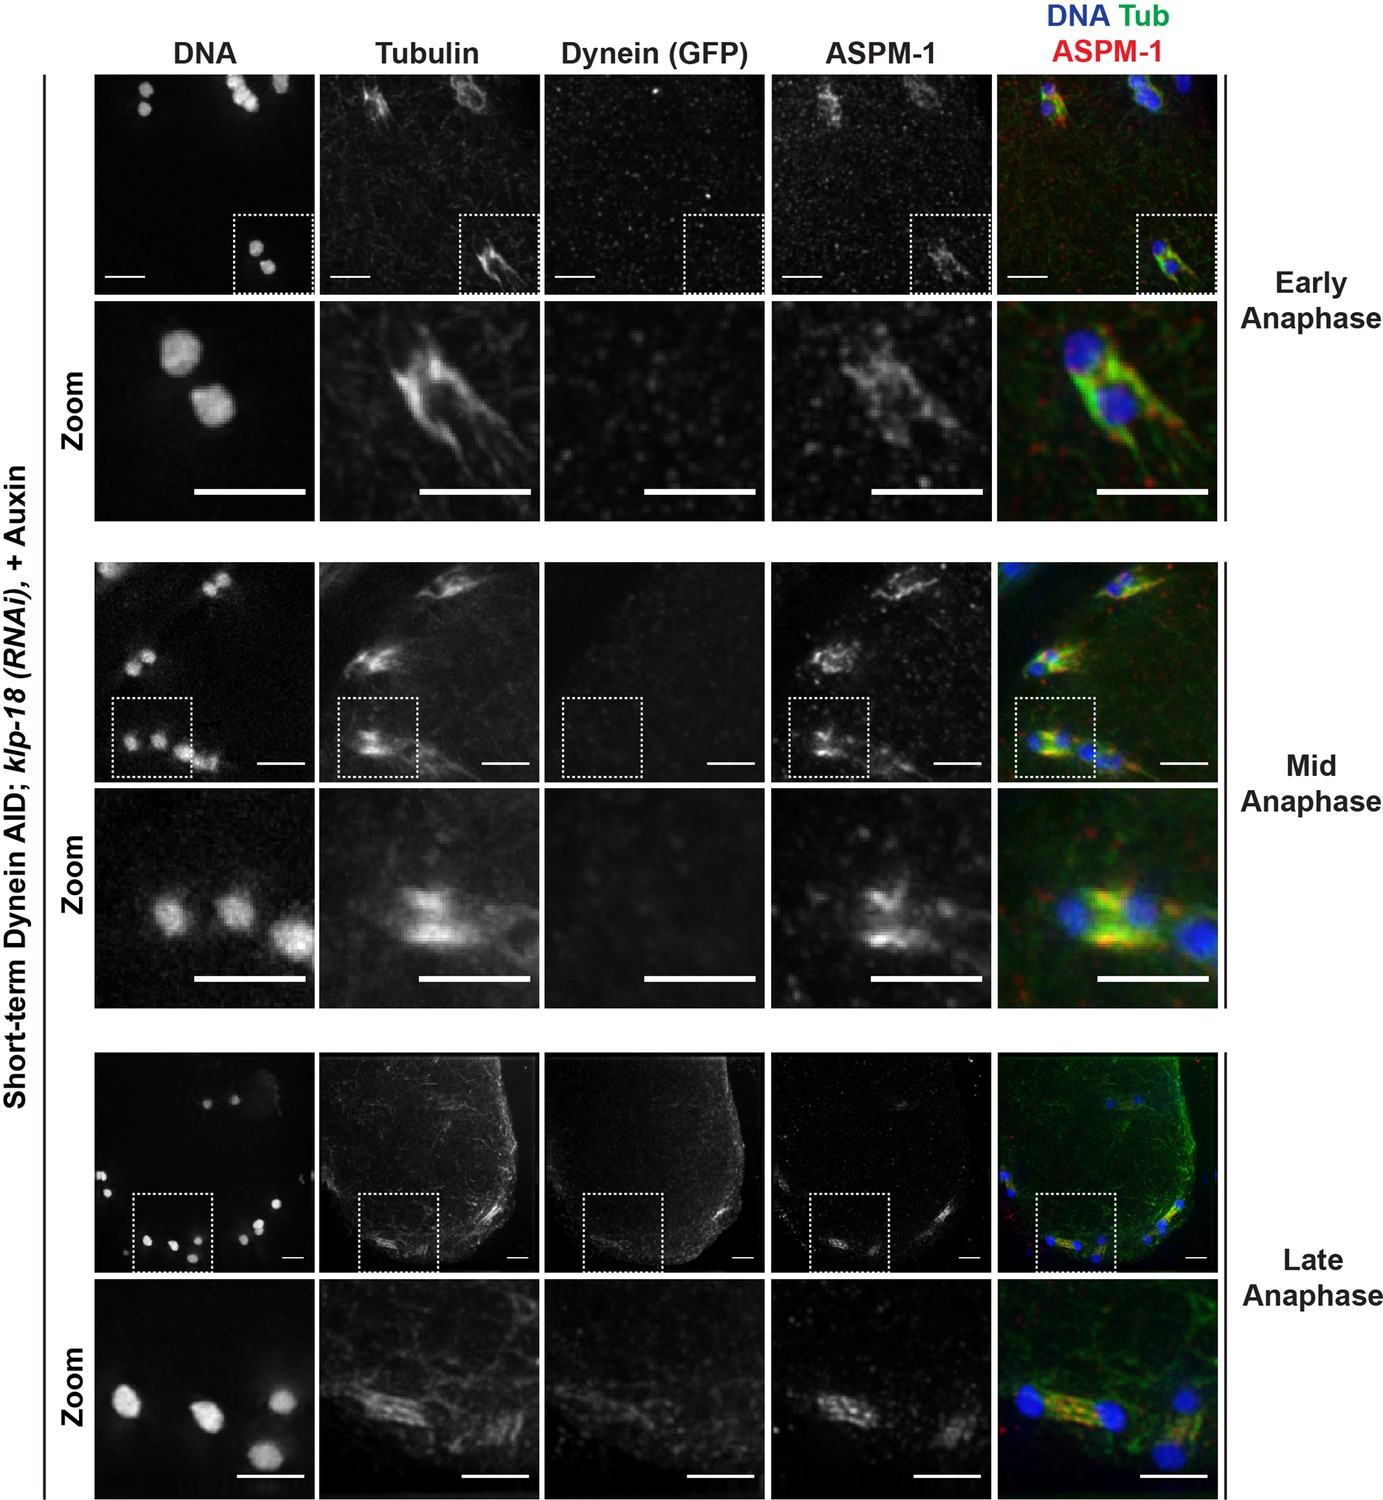
Miniature anaphase spindles recapitulate key features of normal anaphase progression.
Immunofluorescence (IF) imaging of miniature anaphases at multiple chromosome segregation distances, representing various stages of anaphase; shown are tubulin (green), DNA (blue), ASPM-1 (red), and dynein (not shown in merge). For each stage, a zoomed-out view is shown (top row), as well as a zoom of particular mini anaphase spindles (bottom row). Segregation events closely resemble different stages of anaphase A and anaphase B. Scale bars = 2.5 µm. Further characterization of miniature anaphases via localization of SUMO and separase can be found in Figure 5—figure supplement 1 and Figure 5—figure supplement 2, respectively.
Figure 5—figure supplement 1
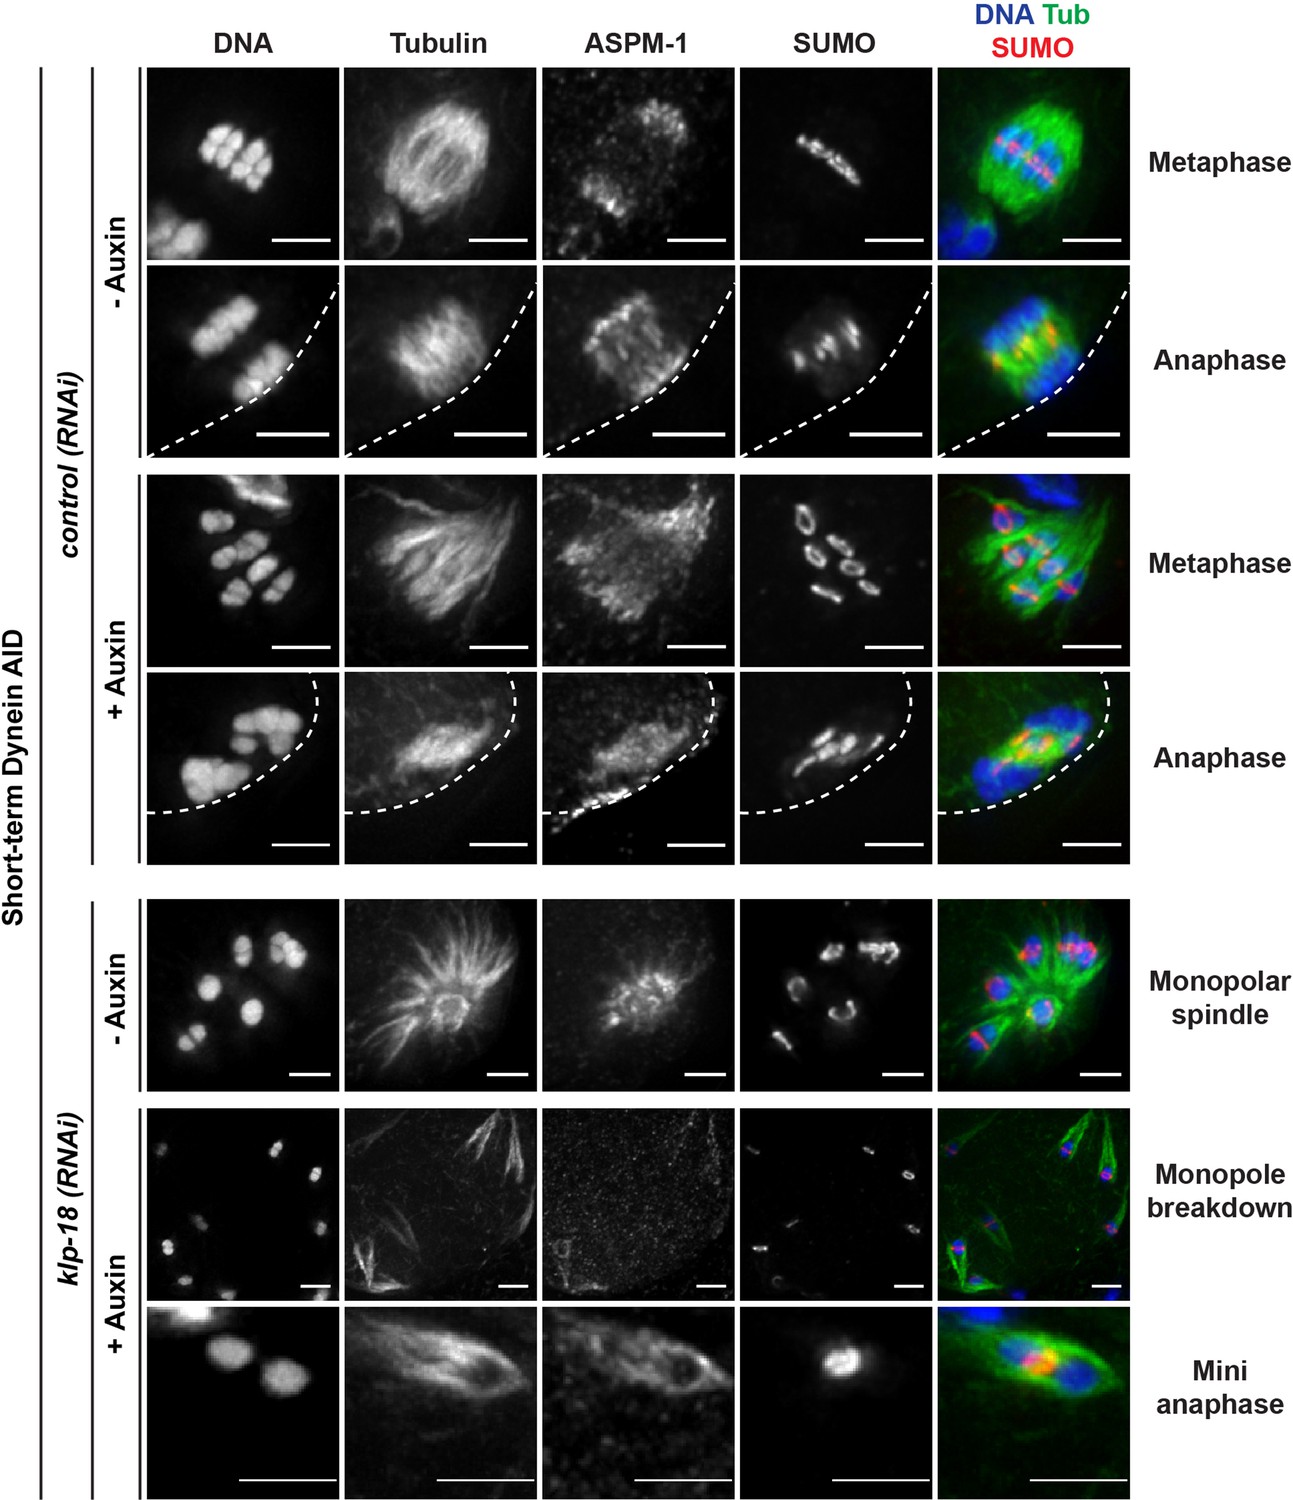
SUMO is localized normally in all dynein depletion conditions.
Immunofluorescence (IF) imaging of oocytes from control and klp-18(RNAi) conditions; shown are tubulin (green), DNA (blue), SUMO (red), and ASPM-1 (not shown in merge). SUMO is localized to a ring complex that forms around chromosomes and then is released from chromosomes in anaphase in the presence or absence of dynein (rows 1–4; 25/25 metaphases, 22/22 anaphases). SUMO remains localized to the ring complex before and after monopole breakdown (rows 5, 6; 18/18 monopoles, 13/13 breakdowns) and can clearly be seen localized between separating chromosomes in miniature anaphases (row 7; 15/15 mini anaphases). Cortex is represented by the dashed line. Scale bars = 2.5 µm.
Figure 5—figure supplement 2
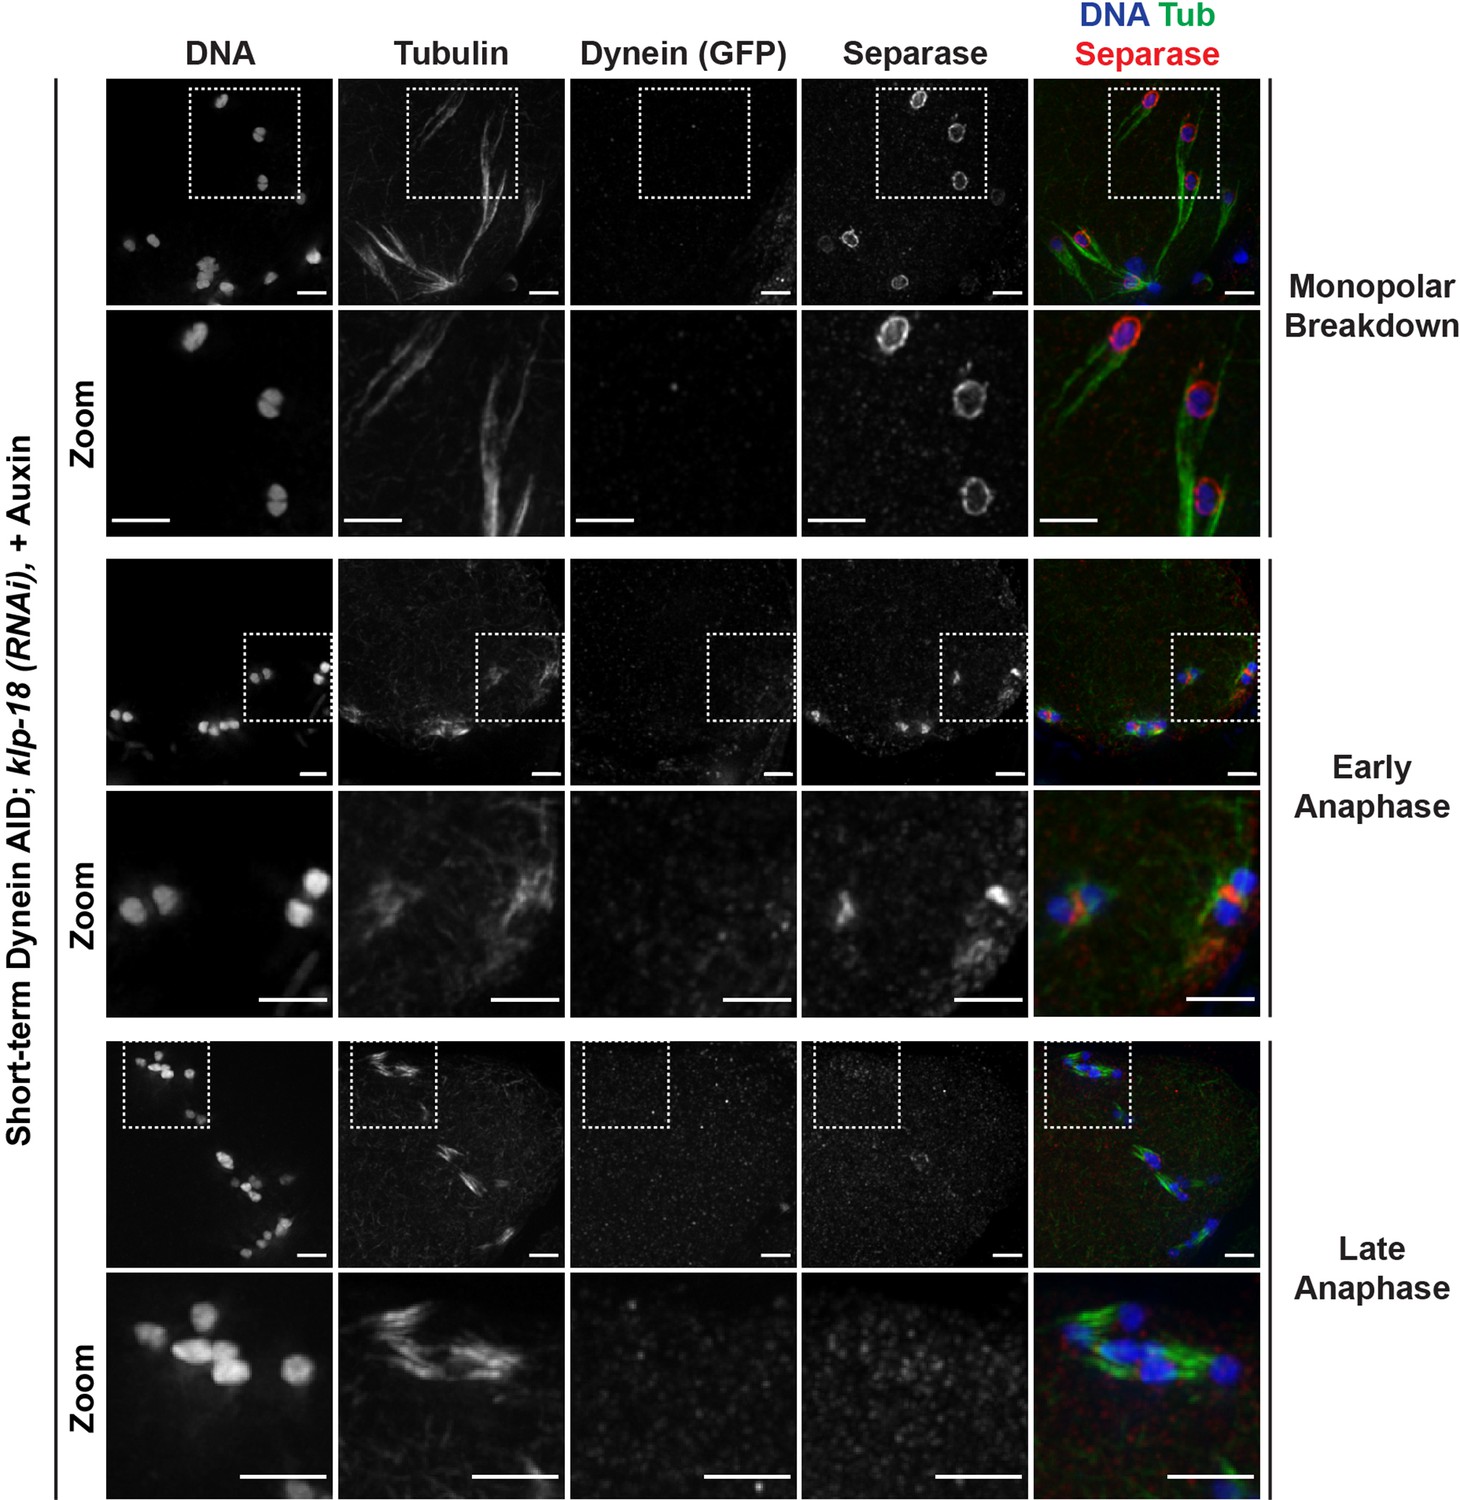
Separase localizes normally to miniature anaphase spindles.
Immunofluorescence (IF) imaging of oocytes in klp-18(RNAi) conditions; shown are tubulin (green), DNA (blue), separase (SEP-1) (red), and dynein (not shown in merge). After monopolar breakdown, separase can be seen localized to kinetochores (rows 1 and 2; 46/46 breakdowns); this localization changes to the ring complex at the initiation of anaphase (rows 3 and 4; 22/22 early anaphases). In later stages of anaphase in these miniature spindles, separase localization is no longer apparent (rows 5 and 6; 13/13 late anaphases). These localization patterns are identical to the localization of separase in metaphase and anaphase of wild-type oocytes. Scale bars = 2.5 µm.
Figure 6
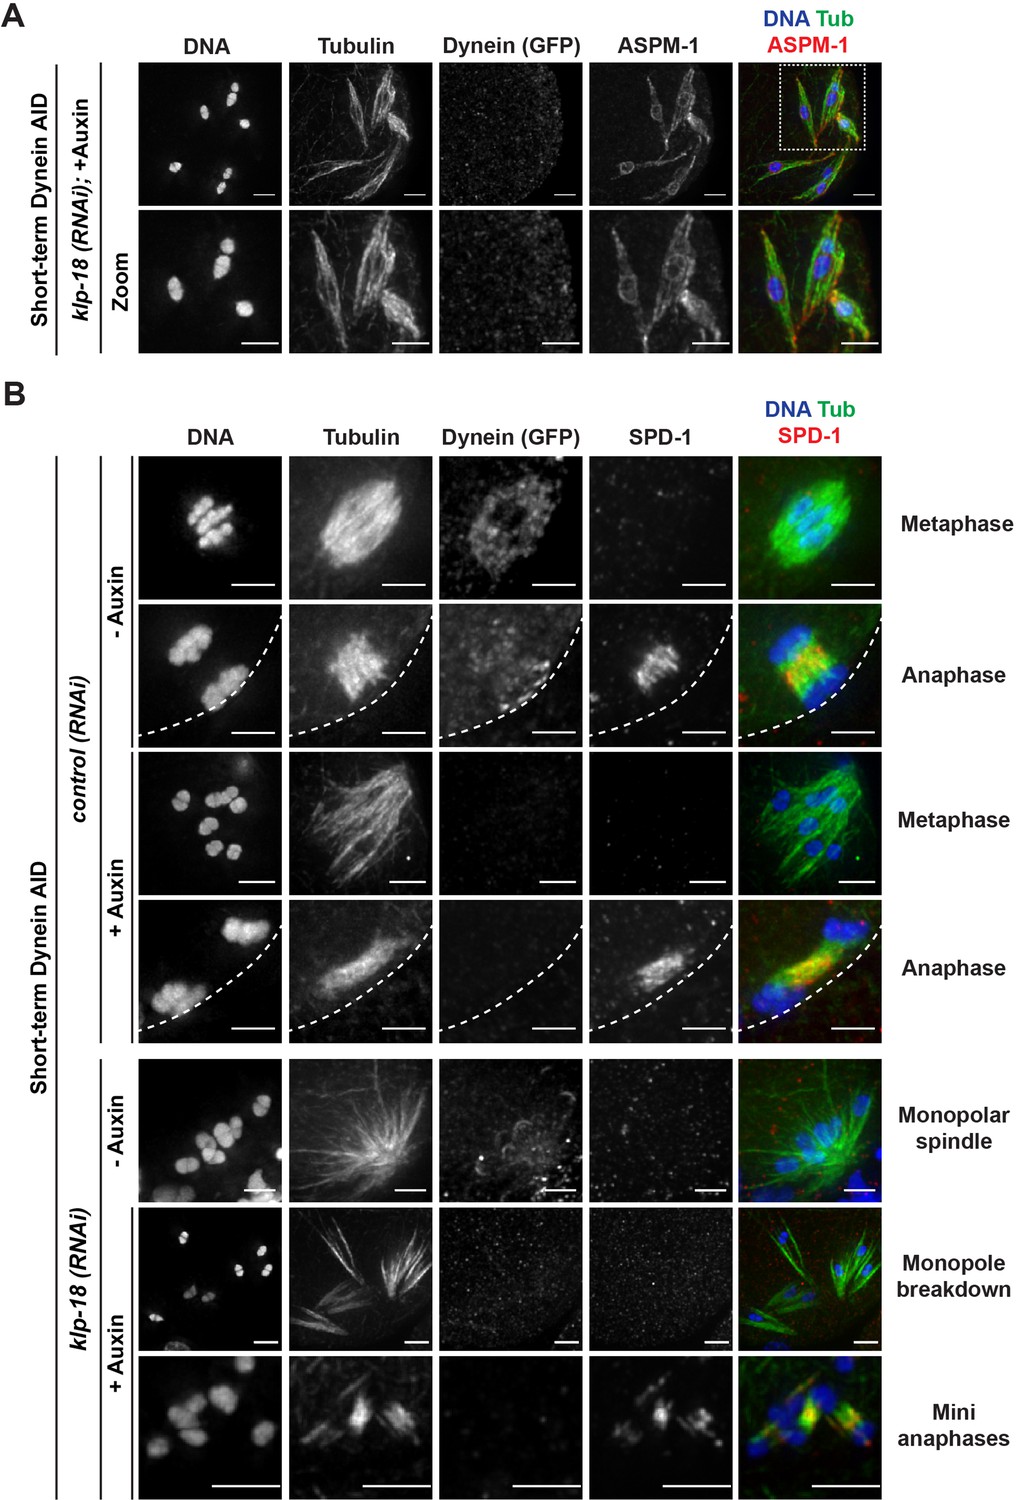
Microtubules reorganize into miniature bipolar spindles that can segregate chromosomes.
(A) Immunofluorescence (IF) imaging of microtubules (green), DNA (blue), ASPM-1 (red), and dynein (not shown in merge) in monopolar spindle breakdown conditions (klp-18(RNAi) + short-term Dynein auxin-inducible degron [AID]). Microtubule bundles appear to reorganize around individual chromosomes, seen through ASPM-1 flanking either side of the chromosome; note that in these images ASPM-1 also appears to be on chromosomes, but that is background staining that sometimes occurs with this antibody (Wignall and Villeneuve, 2009) and is not real signal. (B) IF imaging of SPD-1 localization in the Dynein AID strain in control RNAi conditions (rows 1–4) or following klp-18(RNAi) (rows 5–7); shown are tubulin (green), DNA (blue), SPD-1 (red), and dynein (not shown in merge). SPD-1 does not localize to spindles in metaphase (rows 1, 3; 18/18 metaphases), but localizes to overlapping microtubules in anaphase spindles in the presence or absence of dynein (rows 2, 4; 17/17 anaphases). SPD-1 is not localized to monopolar spindles either before or after monopole breakdown (rows 5, 6; 60/60 monopoles and breakdowns), but can clearly be seen localized to miniature anaphases (row 7; 27/27 mini anaphases). Cortex is represented by the dashed line. All scale bars = 2.5 µm.
Figure 7 with 1 supplement
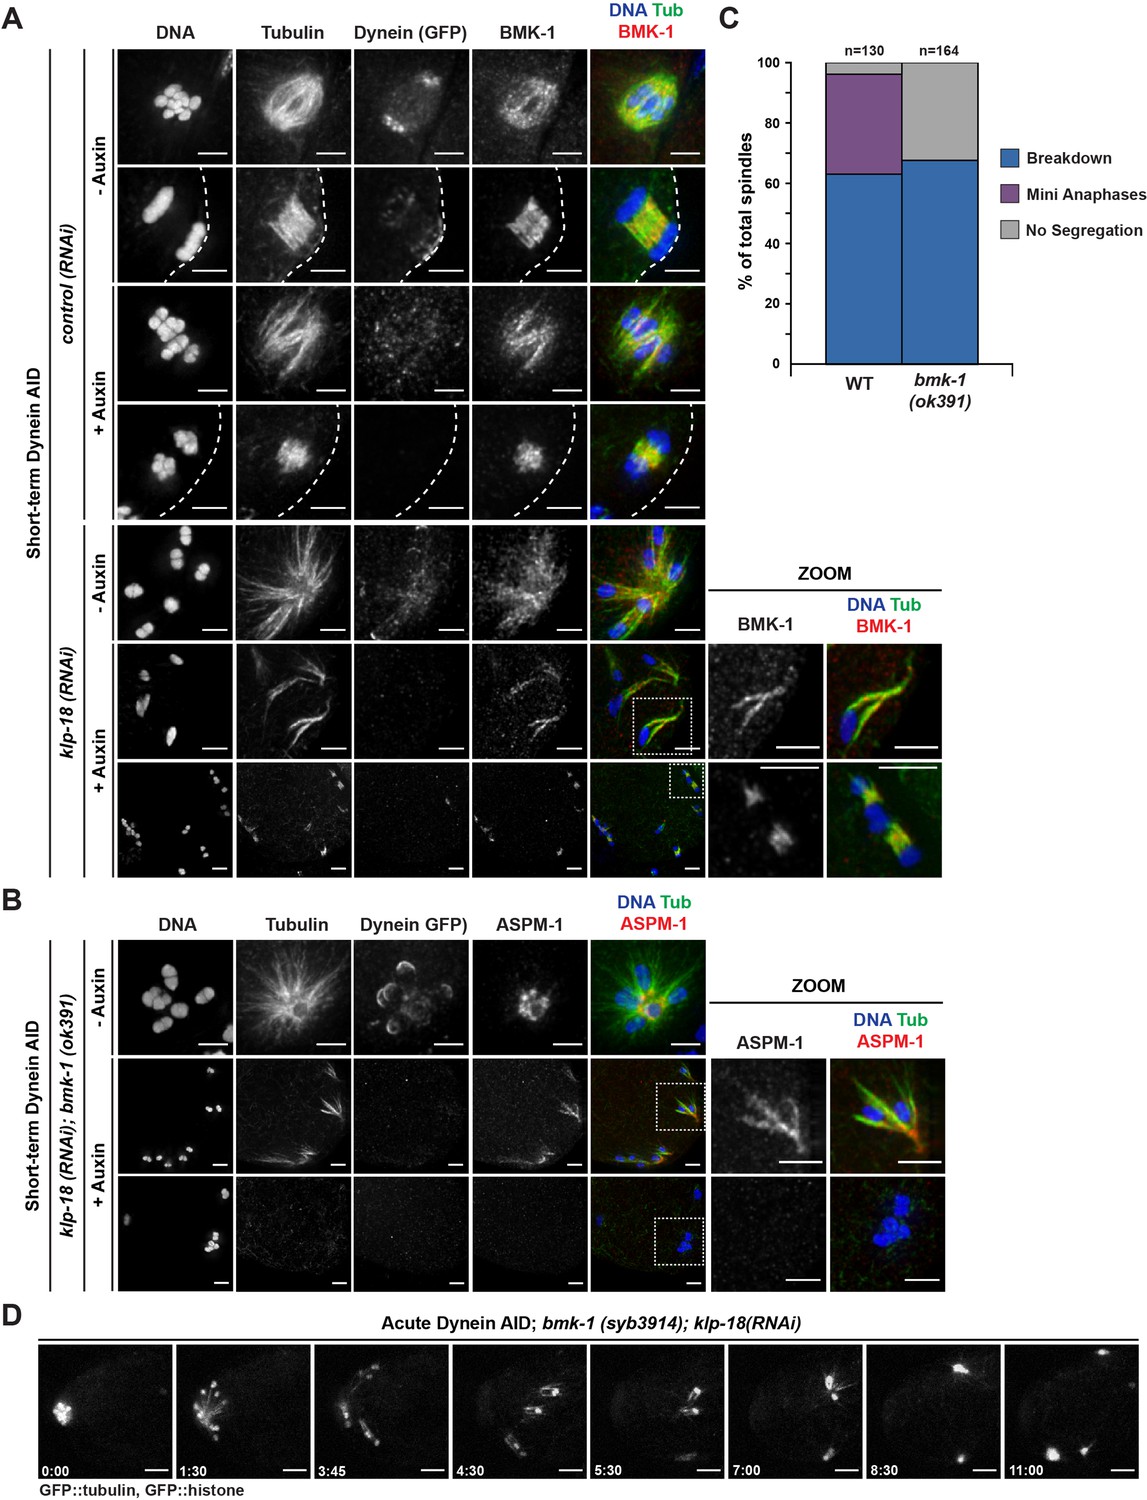
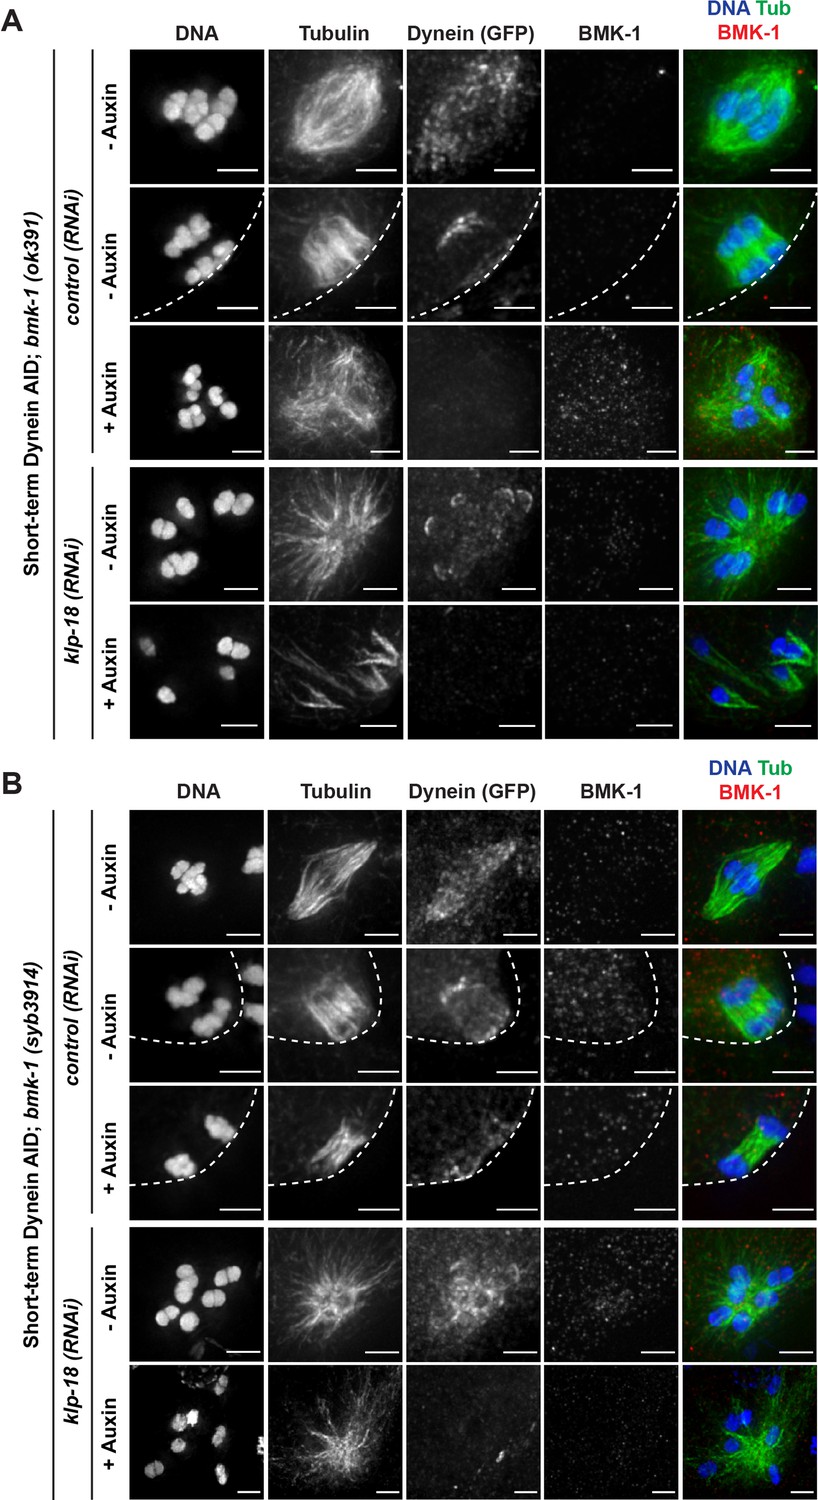
BMK-1 localizes to the meiotic spindle and is required for microtubule reorganization and the formation of miniature anaphases.
(A) Immunofluorescence (IF) imaging of oocytes in either control or klp-18(RNAi) conditions in the Dynein auxin-inducible degron (AID) strain in the presence and absence of short-term auxin treatment; shown are tubulin (green), DNA (blue), BMK-1 (red), and dynein (not shown in merge). BMK-1 is localized to spindle microtubules in all conditions (52/52 metaphases, 43/43 anaphases), including following monopolar spindle breakdown (40/40 monopoles and breakdowns) and in mini anaphases (15/15 mini anaphases). Cortex is represented by the dashed line. Scale bars = 2.5 µm. (B) IF imaging of embryos following klp-18(RNAi) in the Dynein AID strain lacking functional BMK-1 (bmk-1(ok391)); shown are tubulin (green), DNA (blue), ASPM-1 (red), and dynein (not shown in merge). Following monopolar spindle breakdown in the presence of auxin (rows 2, 3), embryos do not contain miniature anaphases and lack chromosome segregation. Scale bars = 2.5 µm. (C) Quantifications of images shown in (B) compared to wild-type (WT) embryos; monopolar spindles still break down, but no miniature anaphases are observed in embryos lacking BMK-1 function. (D) Ex utero live imaging of GFP::tubulin and GFP::histone following acute auxin treatment to remove dynein in klp-18(RNAi); bmk-1(syb3914) conditions; miniature anaphases do not form in the absence of BMK-1. Time elapsed shown in min:s. Scale bars = 5 µm. Validation of bmk-1 mutants via IF imaging can be seen in Figure 7—figure supplement 1.
Figure 7—figure supplement 1
Immunofluorescence (IF) imaging validation of BMK-1 deletion in worm strains.
IF imaging of embryos containing either the bmk-1(ok391) deletion allele (A) or the bmk-1(syb3914) deletion allele (B); shown are tubulin (green), DNA (blue), BMK-1 (red), and dynein (not shown in merge). No BMK-1 localization can be observed in either mutant in control(RNAi) or klp-18(RNAi) conditions in the presence or absence of auxin. Cortex is represented by dashed line. Scale bars = 2.5 μm.
Figure 8
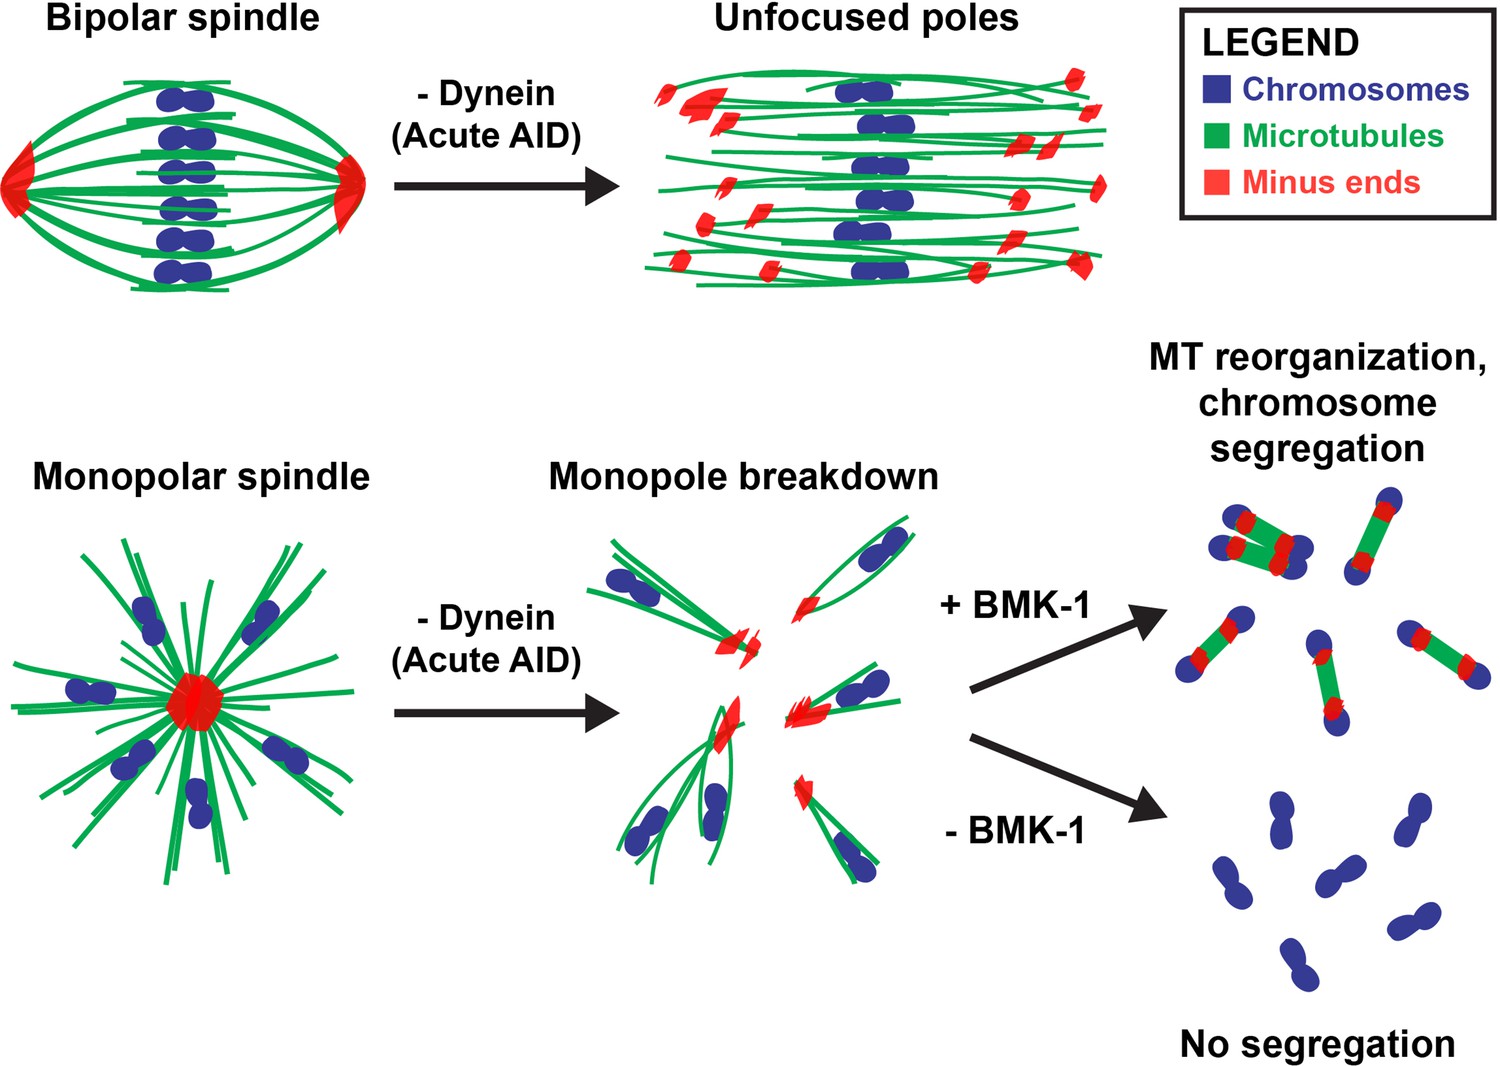
Dynein, KLP-18, and BMK-1 work in concert to establish and maintain spindle bipolarity in C. elegans oocyte meiosis.
Chromosomes (blue), microtubules (green), and microtubule minus ends (red). Dynein is required throughout the meiotic divisions to maintain focused acentrosomal poles. If removed from stable bipolar spindles (top) using short-term depletions, poles rapidly unfocus and splay, leading to the same phenotype as long-term depletions. Dynein depletion from monopolar spindles (bottom) ejects individual chromosomes and associated microtubule bundles into the cytoplasm. BMK-1 is able to provide an outward sorting force in the absence of KLP-18 and dynein, enabling reorganization of microtubules into a miniature anaphase spindle, promoting chromosome segregation. In the absence of BMK-1, these miniature anaphases cannot form and anaphase-like segregations no longer occur.
Author response image 1
Author response image 2
Videos
Video 1
Localization of dynein during oocyte meiosis.
Shows an oocyte expressing mCherry::tubulin, dissected into a control Meiosis Medium solution. DHC-1::degron::GFP localization can be seen at spindle poles during metaphase, alongside faint localization to kinetochores. Localization is consistent across all oocytes filmed (n = 3). Time elapsed shown in min:s. Scale bar = 5 μm.
Video 2
Dynein localizes to spindle poles in the Dynein AID strain in the absence of auxin.
Shows a metaphase-arrested (emb-30(RNAi)) oocyte expressing mCherry::tubulin (top), dissected into control Meiosis Medium solution. DHC-1::degron::GFP (bottom) is clearly localized to spindle poles and faintly seen at kinetochores and spindle morphology does not change during the imaging timeframe in the absence of auxin. Corresponds to Figure 2C. Results are consistent across all oocytes filmed (n = 4). Time elapsed shown in min:s. Scale bar = 5 μm.
Video 3
Auxin treatment of Dynein AID worms rapidly depletes dynein and unfocuses poles.
Shows a metaphase-arrested (emb-30(RNAi)) oocyte expressing mCherry::tubulin (top), dissected into Meiosis Medium containing 100 μM auxin to deplete dynein. Once dissected into auxin solution, rapid depletion of DHC-1::degron::GFP (bottom) is evident within 3 min, at which point spindle poles begin to unfocus and splay apart. Corresponds to Figure 2C. Phenotypes are consistent across all oocytes filmed (n = 4). Time elapsed shown in min:s. Scale bar = 5 μm.
Video 4
Metaphase-arrested spindles in the Dynein AID strain remain stable and maintain chromosome alignment in the absence of auxin.
Shows a metaphase-arrested oocyte expressing GFP::tubulin and GFP::histone in the Dynein AID strain (where DHC-1 is degron-tagged and TIR1 is expressed in the germ line), dissected into control Meiosis Medium solution. No major changes in spindle length or shape occur, and chromosomes are stably aligned in the spindle center. Corresponds to Figure 2D. Phenotypes are consistent across all oocytes filmed (n = 7). Time elapsed shown in min:s. Scale bar = 5 μm.
Video 5
Auxin treatment unfocuses poles, but microtubules largely remain aligned along a single axis.
Shows a metaphase-arrested oocyte expressing GFP::tubulin and GFP::histone in the Dynein AID strain (where DHC-1 is degron-tagged and TIR1 is expressed in the germ line), dissected into Meiosis Medium containing 100 μM auxin to deplete dynein. Upon dissection into auxin solution, rapid and dynamic splaying of acentrosomal poles occurs alongside a notable increase in spindle length, but microtubule bundles and chromosomes stay associated and aligned along a single axis. Corresponds to Figure 2D. Phenotypes are consistent across all oocytes filmed (n = 8). Time elapsed shown in min:s. Scale bar = 5 μm.
Video 6
Metaphase-arrested spindles in the TIR1 control strain are stable and maintain chromosome alignment in the absence of auxin.
Shows a metaphase-arrested oocyte expressing GFP::tubulin and GFP::histone in the TIR1 control strain (that contains TIR1 but lacks a degron tag on DHC-1). Dissection into control Meiosis Medium yields no significant change in spindle length or organization. Notably, the spindle appears identical to those observed in control oocytes containing GFP-tagged DHC-1. Corresponds to Figure 2—figure supplement 2A. Phenotypes are consistent across all oocytes filmed (n = 5). Time elapsed shown in min:s. Scale bar = 5 μm.
Video 7
Addition of auxin to metaphase-arrested oocytes in the TIR1 control strain does not perturb spindle architecture.
Shows a metaphase-arrested oocyte expressing GFP::tubulin and GFP::histone in the TIR1 control strain (that contains TIR1 but lacks a degron tag on DHC-1). Dissection into Meiosis Medium containing 100 μM auxin yields no significant change in spindle length or organization, demonstrating that auxin addition itself is not responsible for phenotypes observed in our acute Dynein auxin-inducible degron (AID) imaging. Corresponds to Figure 2—figure supplement 2A. Phenotypes are consistent across all oocytes filmed (n = 5). Time elapsed shown in min:s. Scale bar = 5 μm.
Video 8
Normal oocytes undergo two rounds of bipolar spindle formation and anaphase segregation.
Shows an unarrested oocyte expressing GFP::tubulin and GFP::histone, dissected into control Meiosis Medium solution. After one round of segregation, a second bipolar spindle is formed, rotates perpendicular to the cortex, and successfully extrudes a second polar body. Corresponds to the movie in row 1 of Figure 2—figure supplement 3. Phenotypes are consistent across all oocytes filmed (n = 8). t = 0 is set to onset of meiosis II. Time elapsed shown in min:s. Scale bar = 5μm.
Video 9
Normal oocytes undergo two rounds of bipolar spindle formation and anaphase segregation.
Another example of an unarrested oocyte expressing GFP::tubulin and GFP::histone, dissected into control Meiosis Medium solution. After one round of segregation, a second bipolar spindle is formed, rotates perpendicular to the cortex, and successfully extrudes a second polar body. Corresponds to the movie in row 2 of Figure 2—figure supplement 3. Phenotypes are consistent across all oocytes filmed (n = 8). t = 0 is set to onset of meiosis II. Time elapsed shown in (min):(sec). Scale bar = 5 μm.
Video 10
Splaying of acentrosomal poles occurs in unarrested oocytes depleted of dynein.
Shows an unarrested oocyte expressing GFP::tubulin and GFP::histone, dissected into Meiosis Medium containing 100μM auxin to deplete dynein. A spindle tries to form in the absence of dynein, leading to dynamic and unfocused poles. Anaphase segregation still occurs, albeit with a failure in spindle rotation. Corresponds to the movie in row 3 of Figure 2—figure supplement 3. Phenotypes are consistent across all oocytes filmed (n = 9). t = 0 is set to onset of meiosis II. Time elapsed shown in min:s. Scale bar = 5μm.
Video 11
Splaying of acentrosomal poles occurs in unarrested oocytes depleted of dynein.
Another example of an unarrested oocyte expressing GFP::tubulin and GFP::histone, dissected into Meiosis Medium containing 100 μM auxin to deplete dynein. A spindle tries to form in the absence of dynein, leading to dynamic and unfocused poles. Anaphase segregation still occurs, albeit with a failure in spindle rotation. Corresponds to the movie in row 4 of Figure 2—figure supplement 3. Phenotypes are consistent across all oocytes filmed (n = 9). t = 0 is set to onset of meiosis II. Time elapsed shown in (min):(sec). Scale bar = 5 μm
Video 12
Monopolar spindles break down and individual chromosomes segregate following dynein depletion.
Shown is an oocyte from the Dynein AID strain expressing GFP::tubulin and GFP::histone following klp-18(RNAi) to generate monopolar spindles, dissected into Meiosis Medium containing 100 μM auxin to deplete dynein. Upon dissection into auxin solution, the monopole quickly dissolves, leading to ejection of individual chromosomes (with laterally associated microtubule bundles) into the cytoplasm, followed by a synchronous anaphase-like segregation event. Corresponds to Figure 4A. Phenotypes are consistent across all oocytes filmed (n = 5). Time elapsed shown in min:s. Scale bar = 5 μm.
Video 13
Monopolar spindles break down and individual chromosomes segregate following dynein depletion.
Another example of a Dynein AID oocyte expressing GFP::tubulin and GFP::histone following klp-18(RNAi), dissected into Meiosis Medium containing 100 μM auxin to deplete dynein. In this example, reorganization of local microtubule bundles around individual chromosomes can be observed after breakdown of the monopolar spindle. Shortly after reorganization of these microtubules, anaphase-like segregation occurs synchronously across all chromosomes. Corresponds to Figure 4B. Phenotypes are consistent across all oocytes filmed (n = 5). Time elapsed shown in min:s. Scale bar = 5 μm.
Video 14
Dynamics of a normal monopolar spindle.
Shows an oocyte expressing GFP::tubulin and GFP::histone following klp-18(RNAi), dissected into a Meiosis Medium control solution. Chromosomes extend outward towards microtubule plus ends forming a monopolar spindle during metaphase, but retract towards the minus ends during anaphase. Corresponds to Figure 4A. Phenotypes are consistent across all oocytes filmed (n = 6). Time elapsed shown in min:s. Scale bar = 5 μm.
Video 15
Monopolar spindle dynamics are normal in the absence of BMK-1.
Shows a Dynein AID; bmk-1(syb3914) oocyte expressing GFP::tubulin and GFP::histone following klp-18(RNAi) to generate monopolar spindles, dissected into control Meiosis Medium solution. Without functional BMK-1 or KLP-18, monopolar spindles can form and monopolar anaphase still occurs, with chromosomes moving outwards in metaphase and back towards the monopole in anaphase. Phenotypes are consistent across all oocytes filmed (n = 4). Time elapsed shown in min:s. Scale bar = 5 μm.
Video 16
Loss of BMK-1 function prevents the formation of miniature anaphases.
Shows a Dynein AID; bmk-1(syb3914) oocyte expressing GFP::tubulin and GFP::histone following klp-18(RNAi) dissected into Meiosis Medium containing 100 μM auxin to deplete dynein. Without functional BMK-1, formation of miniature bipolar anaphases does not occur after the breakdown of the monopolar spindle. Corresponds to Figure 6D. Phenotypes are consistent across all oocytes filmed (n = 3). Time elapsed shown in min:s. Scale bar = 5 μm.
Tables
Table 1
Exact numbers and percentages from germline counting experiment, to assess effects of dynein depletion on oocyte spindle assembly (corresponds to Figure 1D).
| Location | Treatment | MT cage | Unfocused | Focused | Anaphase |
|---|---|---|---|---|---|
| –1 position | No auxin | 60/70 (85.7%) | 10/70 (14.3%) | N/A | N/A |
| With auxin | 47/54 (87.0%) | 7/54 (13.0%) | N/A | N/A | |
| Spermatheca | No auxin | N/A | 54/60 (90.0%) | 6/60 (10.0%) | N/A |
| With auxin | N/A | 63/66 (95.5%) | 3/66 (4.5%) | N/A | |
| + 1 position | No auxin | N/A | 8/160 (5.0%) | 97/160 (60.6%) | 55/160 (34.4%) |
| With auxin | N/A | 84/121 (69.4%) | 8/121 (6.6%) | 29/121 (24.0%) |
Table 2
Exact numbers and percentages from quantification of IF images, to validate the phenotypes observed in germline counting (corresponds to Figure 1F).
| Treatment | Focused poles | Unfocused poles | Anaphases |
|---|---|---|---|
| No Auxin | 35/60 (58.3%) | 3/60 (5.0%) | 22/60 (36.7%) |
| With Auxin | 3/54 (5.6%) | 39/54 (72.2%) | 12/54 (22.2%) |
Table 3
Exact numbers and percentages from germline counting experiment, to assess effects of auxin treatment on oocyte spindle assembly in a strain that does not contain degron-tagged dynein (corresponds to Figure 1—figure supplement 1).
| Location | Treatment | MT cage | Unfocused | Focused | Anaphase |
|---|---|---|---|---|---|
| –1 position | No auxin | 135/146 (92.5%) | 11/146 (7.5%) | N/A | N/A |
| With auxin | 137/152 (90.1%) | 15/152 (9.9%) | N/A | N/A | |
| Spermatheca | No auxin | N/A | 204/222 (91.9%) | 18/222 (8.1%) | N/A |
| With auxin | N/A | 226/245 (92.2%) | 19/245 (7.8%) | N/A | |
| + 1 position | No auxin | N/A | 22/452 (4.9%) | 284/452 (62.8%) | 146/452 (32.3%) |
| With auxin | N/A | 26/435 (6.0%) | 271/435 (62.3%) | 138/435 (31.7%) |
Table 4
Exact numbers and percentages from germline counting experiment, to compare spindle morphologies of lin-5/aspm-1(RNAi) to dynein AID experiments (corresponds to Figure 1—figure supplement 2A).
| Location | Condition | Focused poles | Unfocused poles | Anaphases |
|---|---|---|---|---|
| Spermatheca | control (RNAi) | 7/103 (6.8%) | 96/103 (93.2%) | N/A |
| lin-5 (RNAi) | 7/135 (5.2%) | 128/135 (94.8%) | N/A | |
| aspm-1 (RNAi) | 9/202 (4.5%) | 193/202 (95.5%) | N/A | |
| + 1 position | control (RNAi) | 124/191 (64.9%) | 9/191 (4.7%) | 58/191 (30.4%) |
| lin-5 (RNAi) | 12/261 (4.6%) | 167/261 (64.0%) | 82/261 (31.4%) | |
| aspm-1(RNAi) | 18/521 (3.5%) | 364/521 (69.9%) | 139/521 (26.6%) |
Table 5
Exact numbers and percentages from germline counting experiment, to assess effects of dynein depletion on monopolar spindles (corresponds to Figure 3A).
| Condition | Treatment | Monopolar | Breakdown |
|---|---|---|---|
| klp-18 (RNAi) | No auxin | 119/119 (100.0%) | 0/119 (0.0%) |
| With auxin | 9/125 (7.2%) | 116/125 (92.8%) |
Table 6
Exact numbers and percentages from quantification of IF images, to determine if the removal of functional BMK-1 prevents the formation of miniature anaphases in KLP-18/dynein-depleted oocytes (corresponds to Figure 7C).
| Condition | Treatment | Breakdown | Mini anaphases | No segregation |
|---|---|---|---|---|
| klp-18 (RNAi) | bmk-1 (WT) | 82/130 (63.1%) | 43/130 (33.1%) | 5/130 (3.8%) |
| bmk-1 (ok391) | 111/164 (67.7%) | 0/164 (0.0%) | 53/164 (32.3%) |
Additional files
Download links
A two-part list of links to download the article, or parts of the article, in various formats.
Downloads (link to download the article as PDF)
Open citations (links to open the citations from this article in various online reference manager services)
Cite this article (links to download the citations from this article in formats compatible with various reference manager tools)
Multiple motors cooperate to establish and maintain acentrosomal spindle bipolarity in C. elegans oocyte meiosis
eLife 11:e72872.
https://doi.org/10.7554/eLife.72872


