Double-μPeriscope, a tool for multilayer optical recordings, optogenetic stimulations or both
- Institute of Biology, Humboldt University of Berlin, Germany
- Institute of Computer Science, University of Tartu, Estonia
Figures
Figure 1
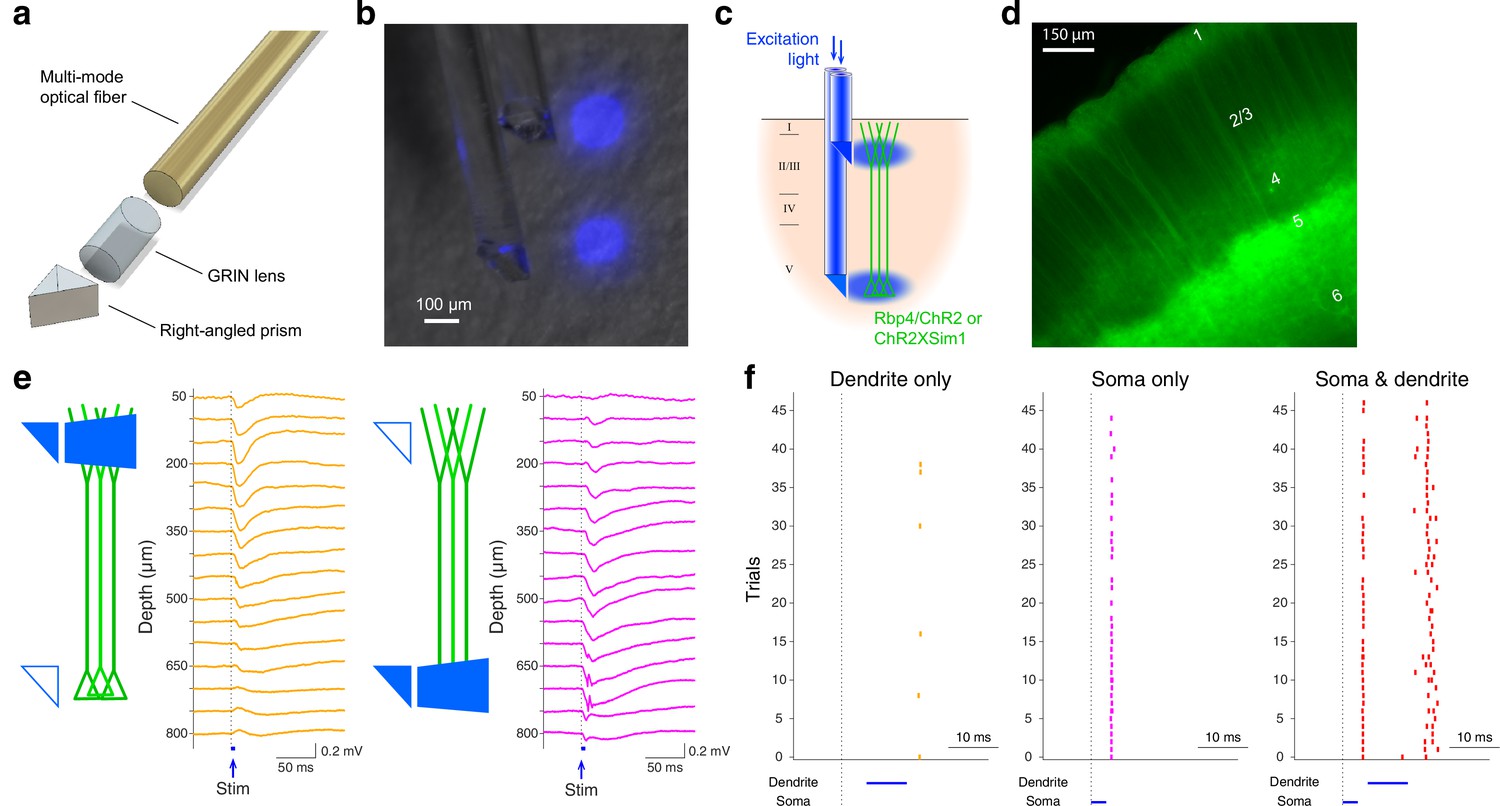
The design and functionality of double-μPeriscope.
(a) An exploded view of an individual μPeriscope. (b) A photomicrograph of the double-μPeriscope with two blue light spots. (c) Schematic diagram of the experiment. Rbp4-Cre mice virally expressing channelrhodopsin 2 (ChR2) or mice in Sim1-Cre line crossed with ChR2 reporter line (Ai32) were used. (d) A photomicrograph of the cortical slice where layer 5 (L5) pyramidal neurons express ChR2 and yellow fluorescent protein (YFP). (e) Evoked potentials by dendritic stimulation (left) versus somatic stimulation (right). (f) Somatic action potentials (APs) evoked by dendritic stimulation only (left), somatic stimulation only (middle) and both (right). Vertical ticks denote APs.
Figure 2

Additional functionalities of double-μPeriscope.
(a) Schematic diagram of the experiment that combines optogenetic stimulation and calcium fluorescence imaging. (b) A photomicrograph of cortical slice where L2/3 pyramidal cells express channelrhodopsin 2 (ChR2) and yellow fluorescent protein (YFP) in the primary motor cortex. (c) Fluorescence change in L5 caused by L2/3 stimulation. The trace is the average over 20 measurements. (d) Summary of data from Rasgrf2-2A-dCre mice where the fluorescence reduction in L5 after optogenetic stimulation of L2/3 was statistically significant (n = 3 mice, 20 measurements in each mouse, all p < 0.05, two-tailed Student’s t-test). (e) Schematic diagram of the experiment where population fluorescence of thalamic axons distributed in cortical layers 1 and 5a was simultaneously measured. (f) A photomicrograph of cortical slice where axonal terminals from POm are densely distributed in cortical layers 1 and 5a. (g) Example traces of simultaneously measured fluorescence in cortical layers 1 (green) and 5a (red). (h) Summary of cross-correlation coefficients obtained from four Gpr26-cre mice. An open circle indicates a pair of simultaneous measurements of axonal activities in layers 1 and 5a. Red line indicates the mean of 20 measurements in each mouse. Ex, excitation; Em, emission.
Tables
Key resources table
| Reagent type (species) or resource | Designation | Source or reference | Identifiers | Additional information |
|---|---|---|---|---|
| Genetic reagent (Mus musculus) | Short: Sim1-KJ18- CreTg(Sim1-cre)KJ18Gsat | Gerfen et al., 2013 | RRID:MMRRC_031742-UCD | |
| Genetic reagent (Mus musculus) | Short: Ai32Ai32(RCL-ChR2(H134R)/EYFP) | Madisen et al., 2012 | RRID:Addgene_34880 | |
| Genetic reagent (Mus musculus) | Short: Rasgrf2-2A-dCreB6;129S-Rasgrf2tm1(cre/folA)Hze/J | Harris et al., 2014 | RRID:JAX 022864 | |
| Genetic reagent (Mus musculus) | Short: Gpr26-CreTg(Gpr26-cre) KO250Gsat/Mmucd | Gong et al., 2007 | RRID:MMRRC_033032-UCD | |
| Recombinant DNA reagent | AAV9.CaMKII. Flex.hChR2(H134R)-YFP.WPRE3 | Charité vector core | n/a | |
| Recombinant DNA reagent | AAV1.Syn.Flex. GCaMP6s. WPRE.SV40 | Addgene | RRID:Addgene_100845 | |
| Chemical compound, drug | Cal-590 AM | AAT Bioquest | 20,510 | |
| Chemical compound, drug | Trimethoprim | Sigma-Aldrich | T7883 | |
| Software, algorithm | Matlab | Mathworks | RRID:SCR_001622 |
Additional files
Download links
A two-part list of links to download the article, or parts of the article, in various formats.
Downloads (link to download the article as PDF)
Open citations (links to open the citations from this article in various online reference manager services)
Cite this article (links to download the citations from this article in formats compatible with various reference manager tools)
Double-μPeriscope, a tool for multilayer optical recordings, optogenetic stimulations or both
eLife 10:e72894.
https://doi.org/10.7554/eLife.72894


