Respiratory alkalosis provokes spike-wave discharges in seizure-prone rats
- Department of Pharmacology, University of Virginia, United States
- Neuroscience Graduate Program, University of Virginia, United States
Figures
Figure 1
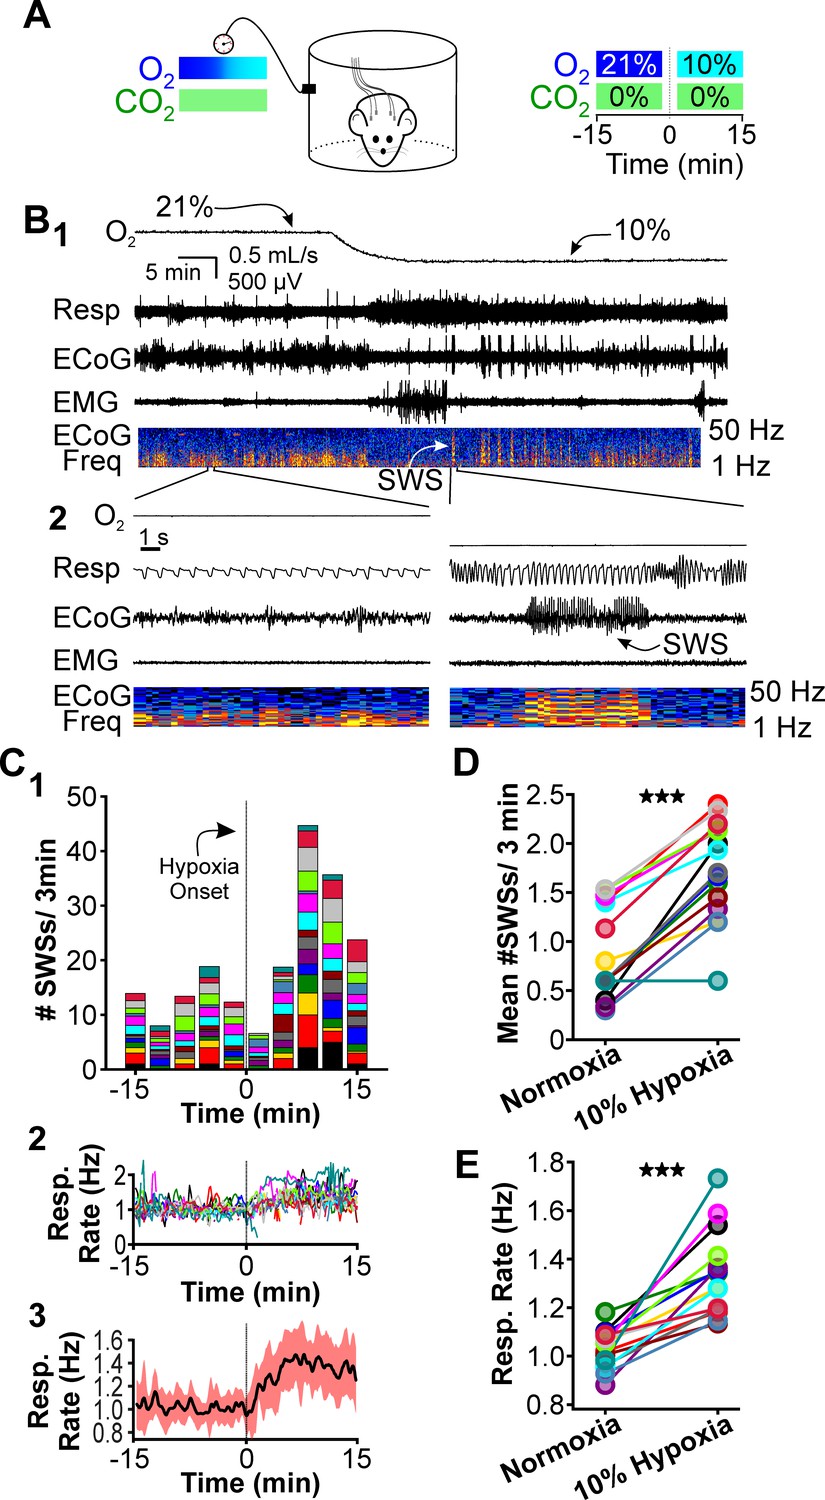
Hypoxia provokes hyperventilation-associated spike-wave seizures (SWS) in WAG/Rij rats.
(A) Experimental approach. Left: plethysmography chambers recorded ventilation and electrocorticography/electromyography (ECoG/EMG) signals in rats exposed to normoxia (i.e. 21% O2) and hypoxia (i.e. 10% O2). Right: example gas exchange protocol used to generate the peristimulus time histogram in panel C. SWS count was measured during the 15 min before and after gas exchange at t = 0 min. (B) Representative recordings during transition from normoxia to hypoxia. (1) From top to bottom: chamber O2, respiration, ECoG, EMG, and ECoG power spectrogram. White arrow points to SWS. (2) Bottom: expanded view B1. Spectrogram reveals 5–8 Hz frequency harmonics associated with SWS. (C) SWS and respiration quantification. (1) Stacked histogram illustrating SWS count for each animal before and after the onset of hypoxia; each color is a different rat. Arrow points to gas exchange at t = 0 min. (2) Corresponding respiratory rate for each animal shown in panel C1. (3) Mean respiratory rate for all animals. (D) Mean SWS count per bin and (E) respiratory rate before and after gas exchange. See for Tables 1–4 detailed statistics. ***p < 0.001.
Figure 2
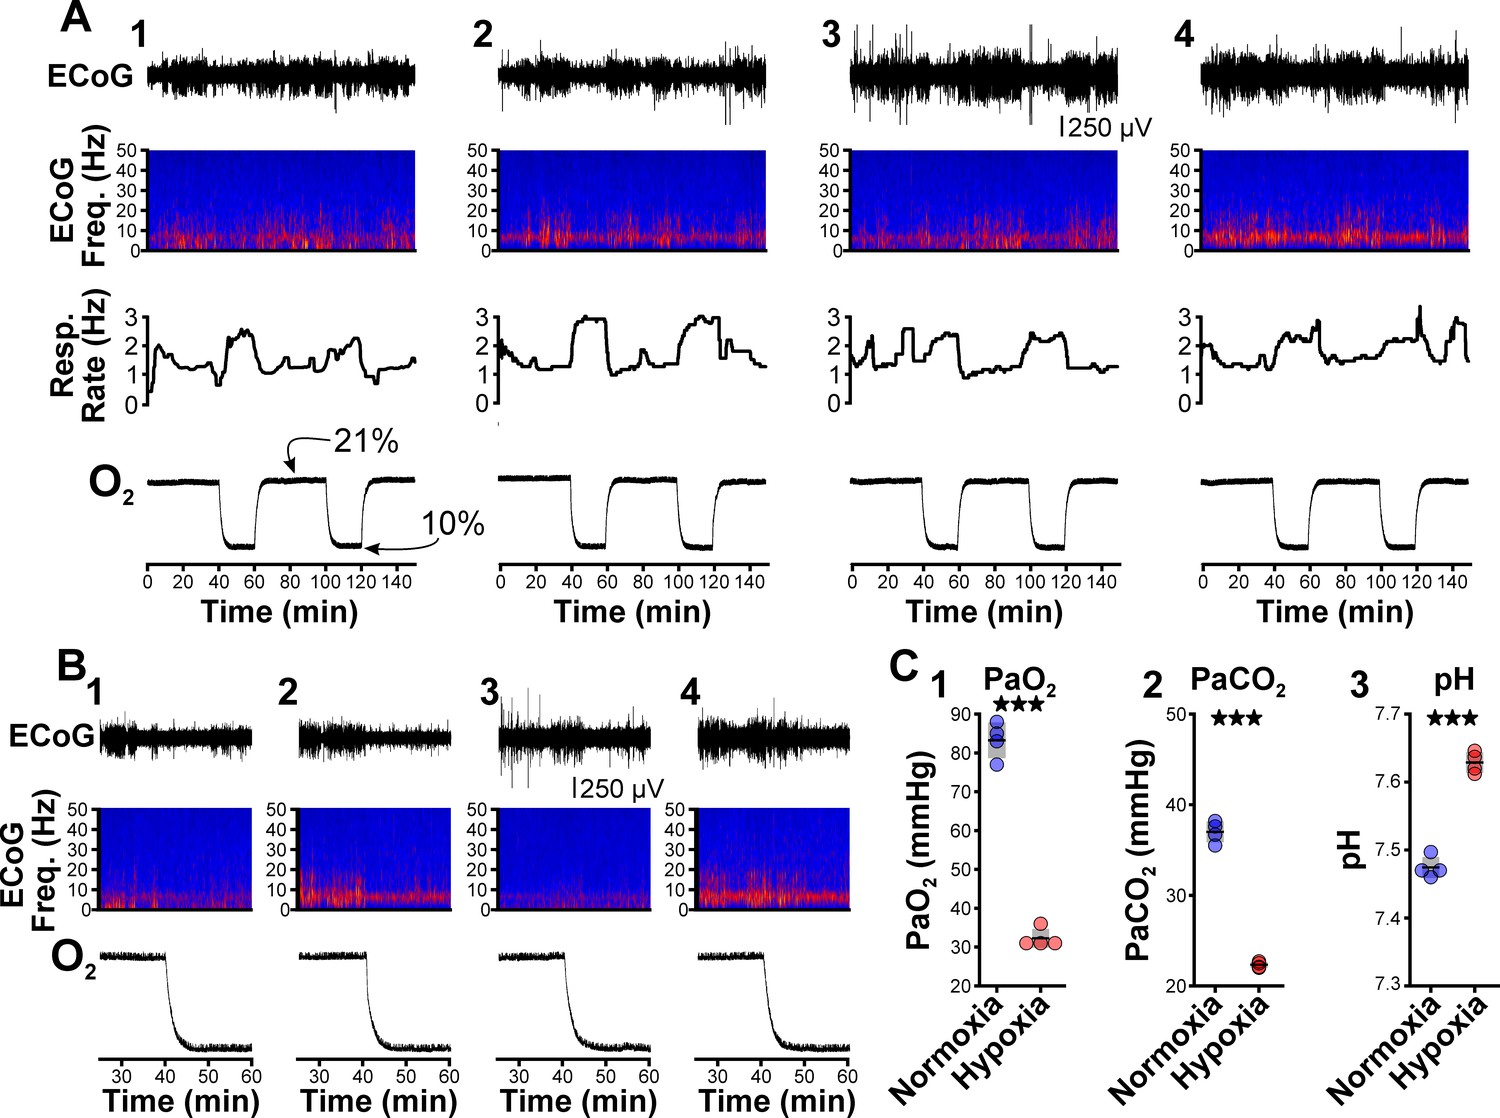
Hypoxia does not provoke hyperventilation-associated spike-wave seizures (SWS) in Wistar rats.
(A) Plethysmography chambers recorded ventilation and electrocorticography/electromyography (ECoG/EMG) signals in four Wistar rats exposed to normoxia (i.e. 21% O2) and hypoxia (i.e. 10% O2). Panels 1–4 include responses from four Wistar rats, respectively, and show from top to bottom: ECoG, ECoG power spectrogram, respiratory rate, and chamber O2. During the 2.5 hr recording session, rats were challenged twice with hypoxia. No SWS were observed during either normoxia or hypoxia. (B) Expanded views of the first transition from normoxia to hypoxia shown in panel A. Increased low frequency power during normoxia in some rats (e.g. panel B2) represents sleep. Hypoxia in Wistar rats generally increased arousal. (C) Arterial measurements in the same rats show that hypoxia challenges produced a predictable drop in arterial (1) O2 and (2) CO2, as well as (3) alkalosis. See Table 5 for detailed statistics. ***p < 0.001.
Figure 3
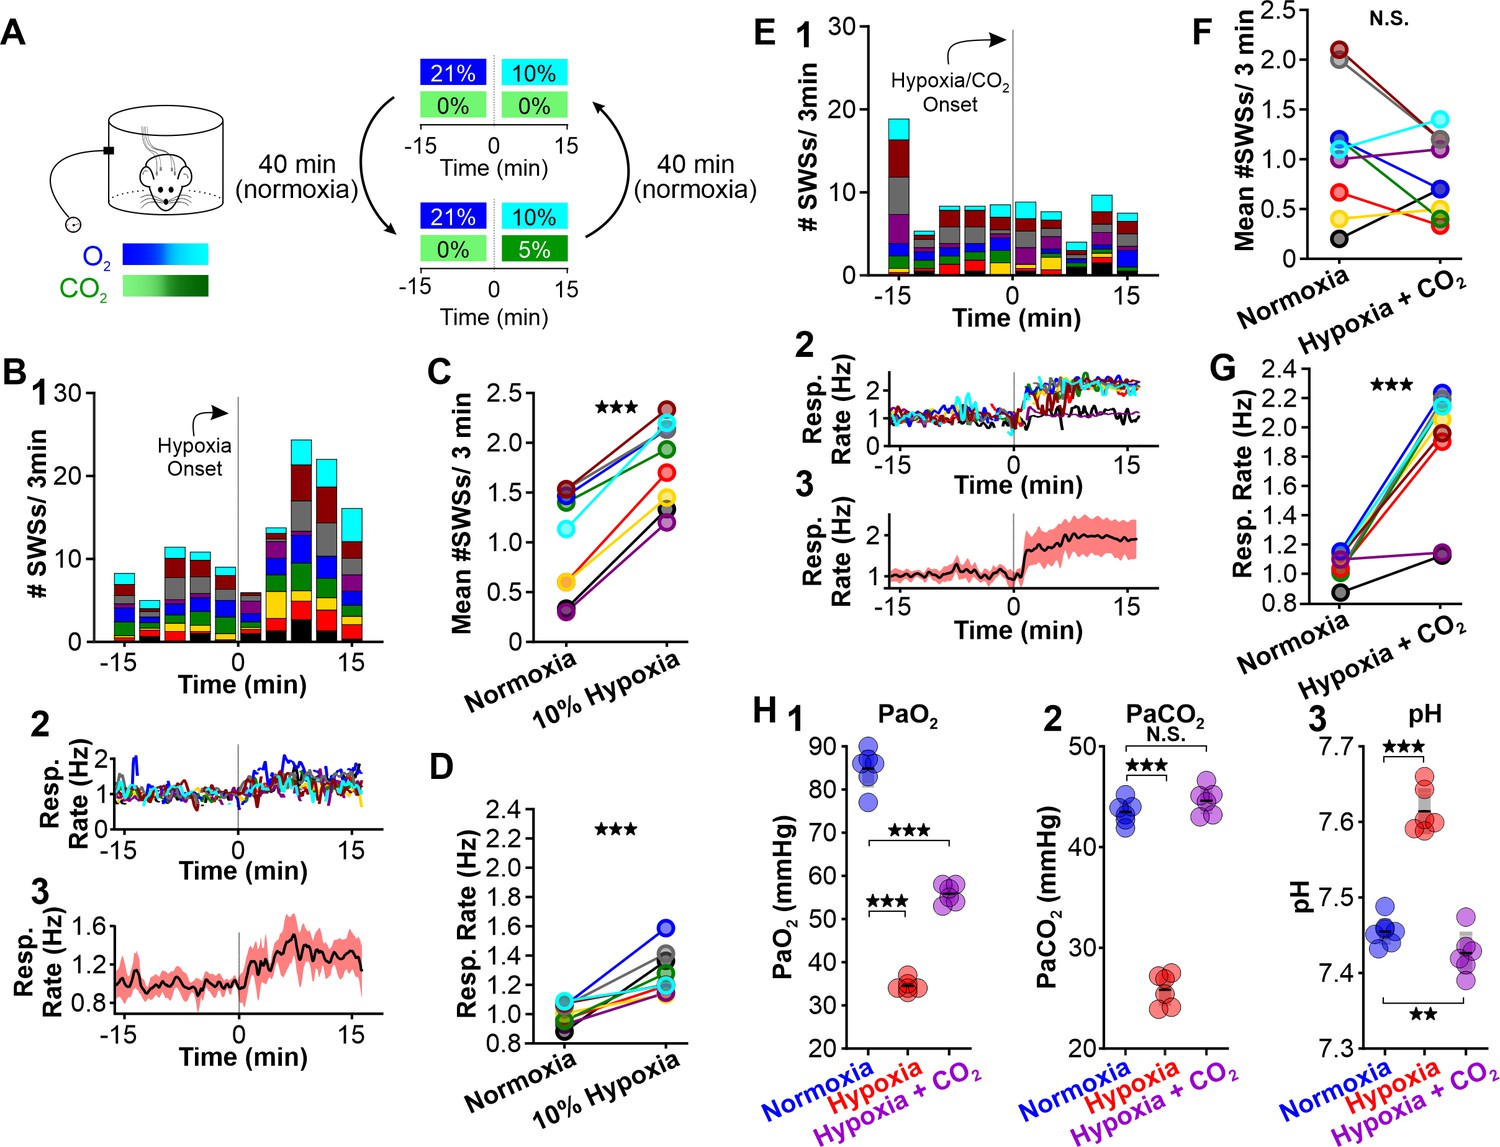
CO2 suppresses hypoxia-provoked spike-wave seizures (SWS).
(A) Experimental approach. Plethysmography chambers recorded ventilation and ECoG/EMG signals in WAG/Rij rats exposed to normoxia (i.e. 21% O2) and then alternately challenged with hypoxia (i.e. 10% O2) or hypoxia + CO2 (i.e. 10% O2, 5% CO2). (B–D) Hypoxia challenge. (B) SWS and respiration quantification. (1) Stacked histogram illustrating SWS count for each animal before and after the onset of hypoxia. (2) Corresponding respiratory rate for each animal shown in panel B1. (3) Mean respiratory rate for all animals. (C) Mean SWS count per bin and (D) respiratory rate before and after hypoxia exchange. (E–G) Hypoxia + CO2 challenge. (E) SWS and respiration quantification. (1) Stacked histogram illustrating SWS count for each animal before and after the onset of hypoxia + CO2. (2) Corresponding respiratory rate for each animal shown in panel E1. (3) Mean respiratory rate for all animals. (F) MeanSWS count per bin and (G) respiratory rate before and after hypoxia + CO2 exchange. (H) Arterial measurements show that hypoxia produced a predictable drop in arterial (1) O2 and (2) CO2, as well as (3) respiratory alkalosis (as in Wistar rats). Supplementing the chamber with 5% CO2 normalizes arterial CO2 and pH. Elevated arterial O2 during hypoxia + CO2 relative to hypoxia reflects a powerful inhalation response during the former condition (c.f. panels D and G). See Tables 1, 2 and 6 for detailed statistics. **p < 0.01, ***p < 0.001.
Figure 4
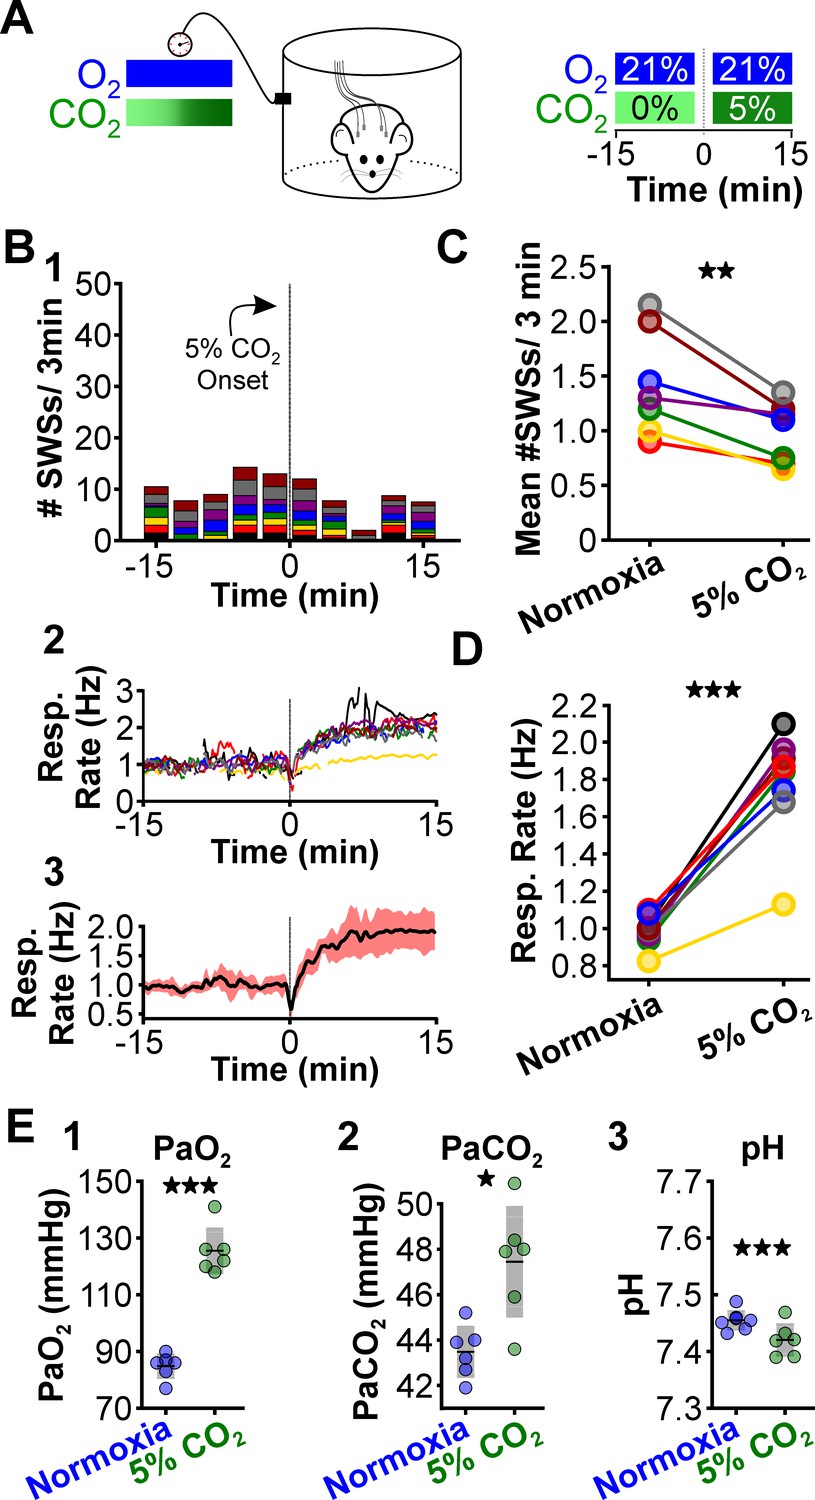
CO2 suppresses spontaneous spike-wave seizures (SWS).
(A) Experimental approach. Plethysmography chambers recorded ventilation and electrocorticography/electromyography signals in WAG/Rij rats exposed to normoxia (i.e. 21% O2) and hypercapnia (i.e. 21% O2, 5% CO2). (B) SWS and respiratory quantification. (1) Stacked histogram illustrating SWS count for each animal before and after the onset of hypercapnia. (2) Corresponding respiratory rate for each animal shown in panel B1. (3) Mean respiratory rate for all animals. (C) Mean SWS count per bin and (D) respiratory rate before and after hypercapnia exchange. (E) Arterial measurements in the same rats show that hypercapnia produced a predictable increase in arterial (1) O2 and (2) CO2, as well as (3) respiratory acidosis. Increase arterial O2 reflects robust ventilatory response during hypercapnia. See Tables 1, 2 and 6 for detailed statistics. *p < 0.05, **p < 0.01, ***p < 0.001.
Figure 5
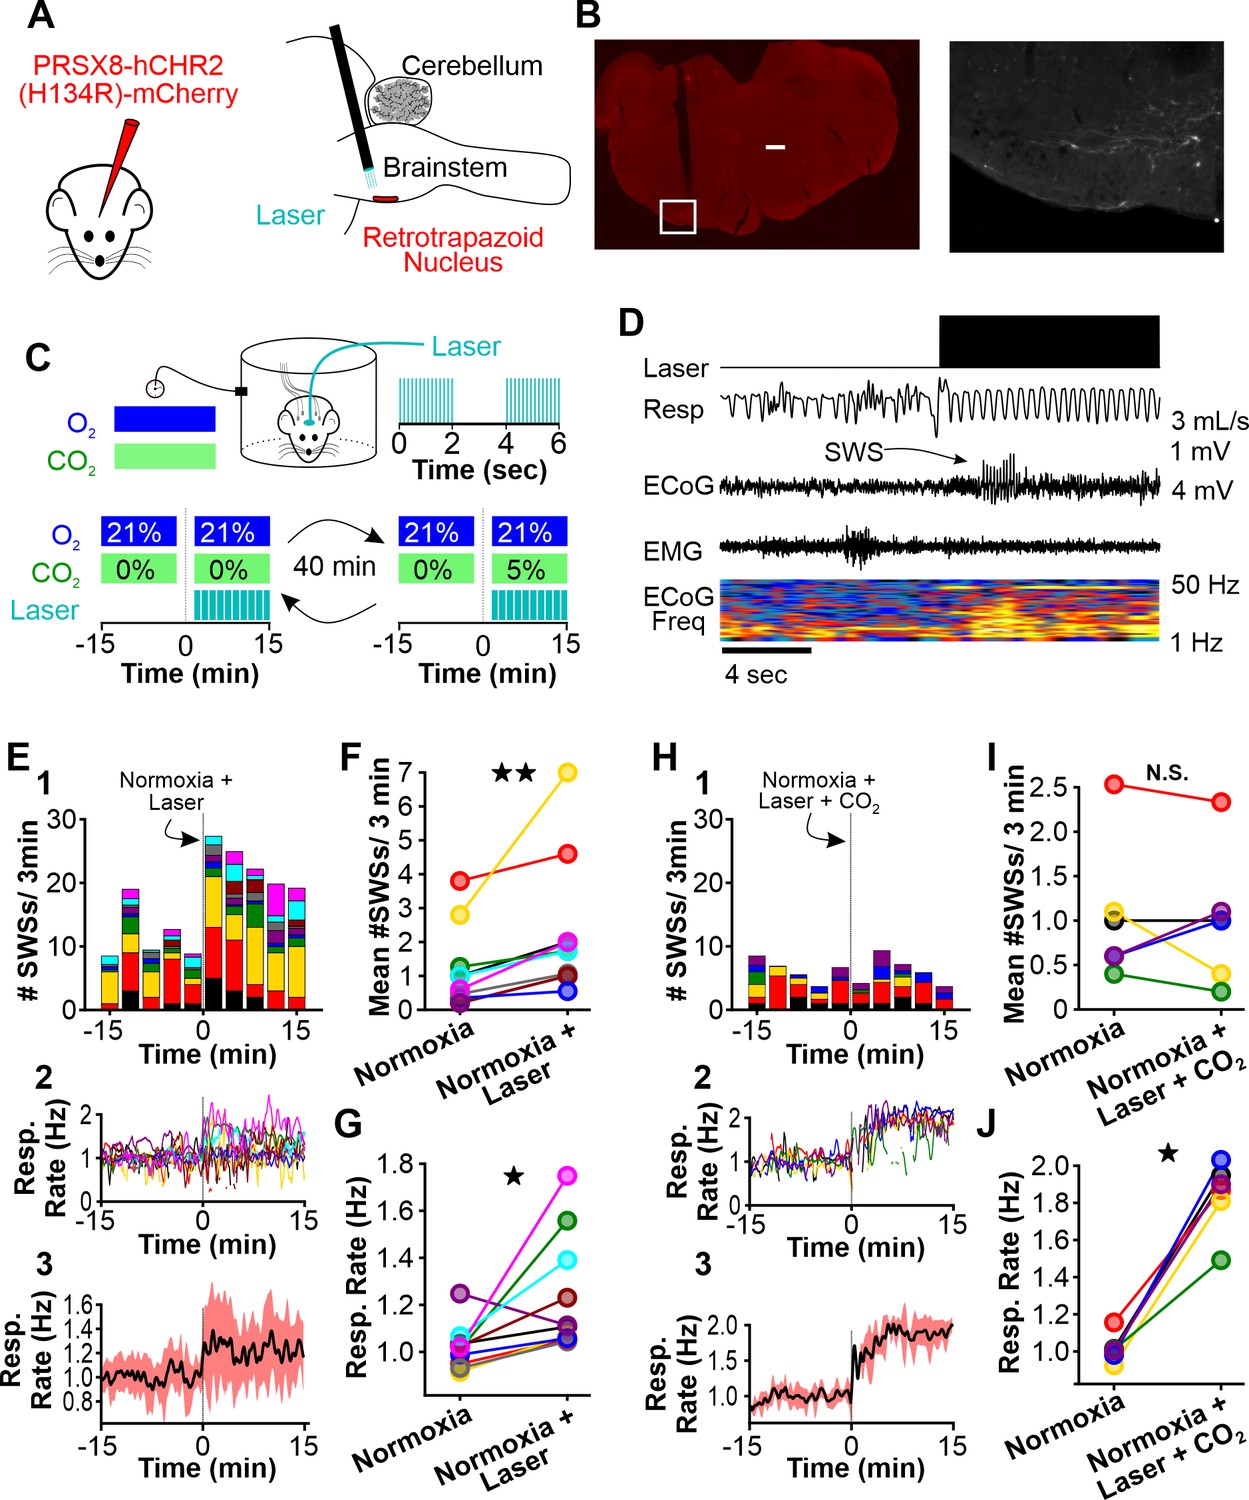
Normoxic hyperventilation provokes CO2-sensitive spike-wave seizures (SWS).
(A) Channelrhodopsin was virally delivered to the retrotrapezoid nucleus (RTN). The fiber optic cable was implanted during the surgery. After 3 weeks, photostimulation of the RTN induced hyperventilation. (B) After experimentation, opsin expression and fiber optic placement was verified. Representative image of mCherry-positive cells in the RTN. Large notch in slice is from optical fiber. Box on left image is enlarged on right image. Scale bar = 500 µm. (C) Experimental approach. Plethysmography chambers recorded ventilation and electrocorticography/electromyography signals in WAG/Rij rats exposed to normoxia (i.e. 21% O2) and normoxia + CO2 (i.e. 10% O2, 5% CO2). Channelrhodopsin-mediated photostimulation of the RTN was used to increase ventilation. (D) Example of ventilatory response and SWS during normoxic RTN photostimulation. (E–G) RTN photostimulation during normoxia. (E) SWS and respiration quantification. (1) Stacked histogram illustrating SWS count for each animal before and after normoxia photostimulation onset. (2) Corresponding respiratory rate for each animal shown in panel C1. (3) Mean respiratory rate for all animals. (F) Mean SWS count per bin and (G) respiration rate before and after normoxia photostimulation onset. (H–J) RTN photostimulation during hypercapnia (i.e. 21% O2, 5% CO2). (H) SWS and respiratory quantification. (1) Stacked histogram illustrating SWS count for each animal before and after hypercapnic photostimulation onset. (2) Corresponding respiratory rate for each animal shown in panel F1. (3) Mean respiratory rate for all animals. (I) Mean SWS count per bin and (J) respiratory rate before and after hypercapnic photostimulation onset. See Tables 1, 2 and 6 for detailed statistics. *p < 0.05, **p < 0.01, not significant (n.s.).
Figure 6

Hypoxia-induced hyperventilation activates intralaminar thalamic neurons.
(A) cFos immunohistochemistry in horizontal sections of the WAG/Rij rat. Dashed lines highlight the medial region of the thalamus containing the intralaminar nuclei. Solid lines demarcate regions containing elevated cFos expression and are expanded on right. Top images are collected from a rat exposed to 30 min of normoxia. Middle images are collected from a rat exposed to 30 min of hypoxia. Bottom images are taken from Paxinos and Watson, 2007 and show the structural landmarks in the top and middle images. The central median nucleus (intralaminar thalamus) and ventrobasal complex (VB, first-order thalamus) are labeled. (B) cFos density plots show immunoreactivity in each of four rats exposed to either normoxia, hypoxia, or hypoxia + CO2. Each black dot represents a cFos-positive cell, as identified with ImageJ (see Methods). Plots are aligned to expanded views in panel A. (C) Quantification of cFos labeled cells at different ImageJ thresholding values. (D) GCaMP7 was stereotaxically delivered to the intralaminar nuclei. Later, fluorescence changes were measured during extracellular alkaline challenges in acute slices containing the intralaminar nuclei. Individual ROIs show fluorescence changes during alkalosis (black traces). Mean responses from two animals are shown in green. The lag in response reflects the duration required for a complete solution exchange. (E) pH sensitivity of intralaminar neurons was also evaluated using electrophysiological measurements in acute brain slices. (F) Voltage-clamped intralaminar neurons (Vhold = –50 mV) were exposed to control (pH 7.3), alkaline (pH 8.0), and acidic (pH 7.0) conditions. Inward currents were evoked during alkaline conditions. (G) Population intralaminar neuron response to alkaline conditions (n = 5). (H) Alkaline-evoked inward currents were largest in the intralaminar neurons (−146 ± 41.1 pA, n = 5), relative to similar measurements in neurons of the somatosensory cortex (S1, −59.1 ± 7.3 pA, n = 5) or thalamus (VB, ventrobasal nucleus, −68.1 ± 3.5 pA, n = 4). Inward currents during alkaline conditions (pH 8.0) in both intralaminar and S1 neurons were significantly larger, relative to their respective currents measured at a baseline pH of 7.3. Currents are presented as baseline-subtracted. **p < 0.01, ***p < 0.001. See Table 7 for detailed statistics. Scale bars are 500 µm (left) and 100 µm (right).
Figure 7
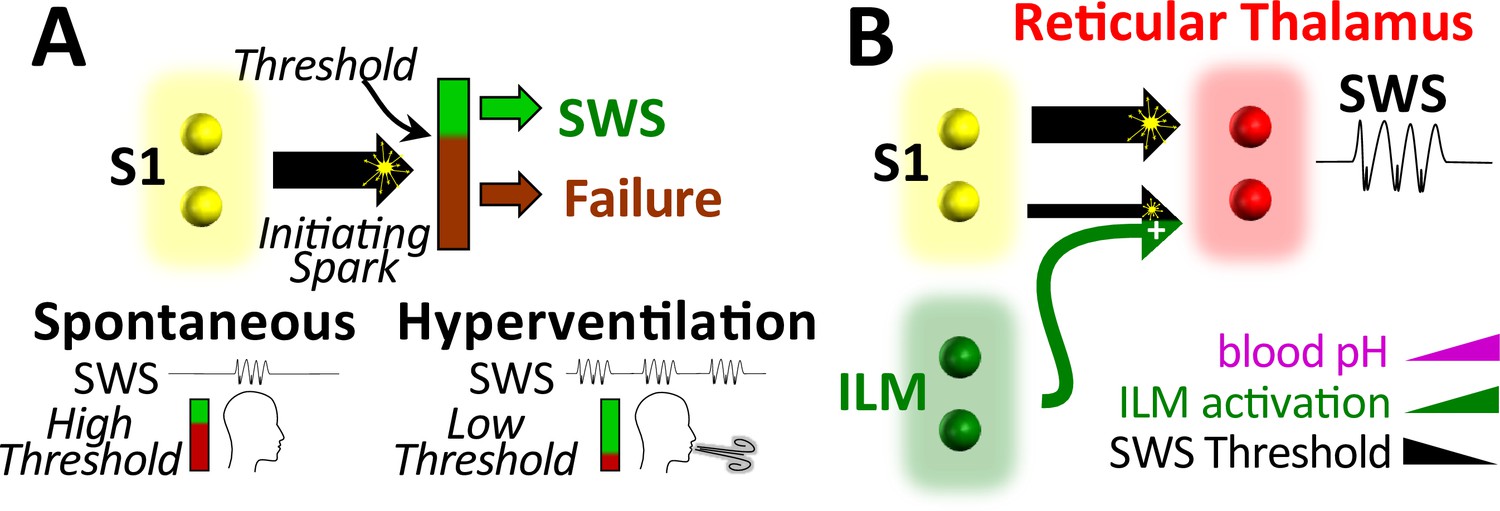
Working model.
(A) Spike-wave seizures (SWS) only occur if initiating activity from S1 somatosensory cortex successfully overcomes a threshold, consistent with the cortical focus theory (Meeren et al., 2002). Hyperventilation-associated alkalosis reduces SWS threshold. (B) S1 initiating activity is proposed to overcome a seizure node formed by circuits in reticular thalamus to generate an SWS (Paz and Huguenard, 2015). We propose that hyperventilation-evoked respiratory alkalosis activates the intralaminar nuclei to reduce the threshold for S1 activity required to evoke an SWS. Thalamic pH sensitivity.
Author response image 1
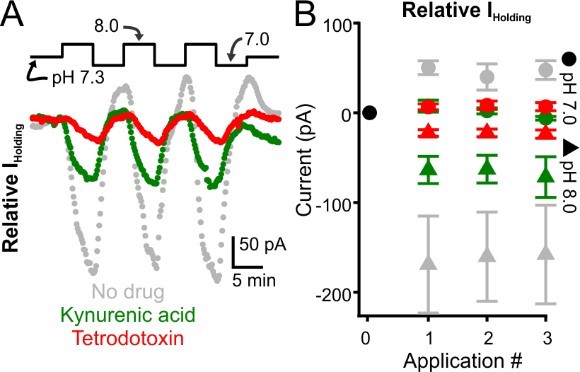
Glutamate receptor blockade reduces alkalization-induced inward currents evoked in intralaminar neurons.
A. Representative voltage-clamp recordings of intralaminar neuron during bath application of control (pH 7.3) and alkaline (pH 8.0) conditions. The gray symbols represent a control neuron. Green symbols represent a neuron undergoing pH manipulations during application of kynurenic acid, a glutamate receptor blocker. The red symbols represent a neuron undergoing pH manipulations during application of TTX. B. Population response. Control, n = 4. Kynurenic acid, n = 4. TTX, n = 5.
Author response image 2
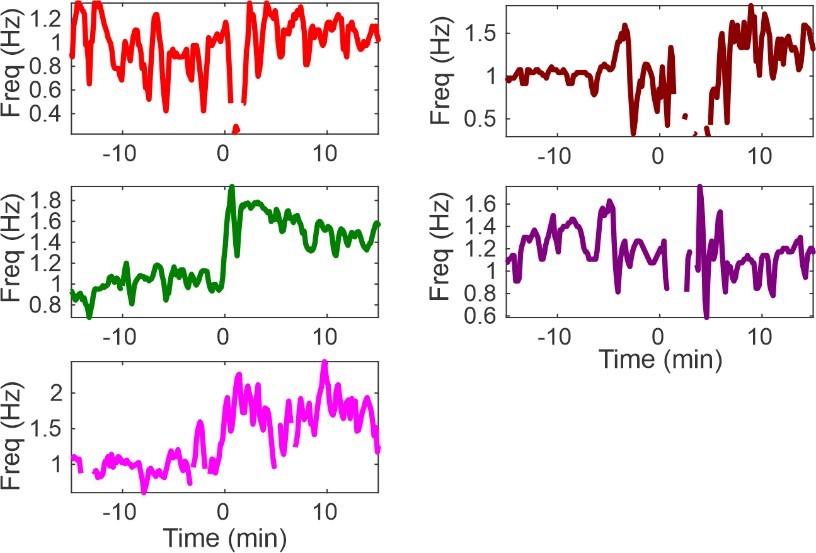
Respiratory measurements in a subset of animals shown in Figure 5G.
In all but one animal (purple), optogenetic stimulation clearly increased respiration rate. Unfortunately, an unsteady baseline rate can explain the apparent decrease in rate in the purple animal.
Tables
Table 1
Spike-wave seizure count.
| Figure | Comparison | Bin count(mean ± S.E.) | n | p Value |
|---|---|---|---|---|
| 1D | Normoxia | 0.89 ± 0.12 | 15 | 4.5 × 10⁻⁷ |
| Hypoxia | 1.73 ± 0.13 | |||
| 3C | Normoxia | 0.99 ± 0.18 | 9 | 1.76 × 10⁻⁶ |
| Hypoxia | 1.82 ± 0.14 | |||
| 3F | Normoxia | 1.09 ± 0.22 | 9 | 0.18 |
| Hypoxia + CO2 | 0.84 ± 0.13 | |||
| 4C | Normoxia | 1.36 ± 0.17 | 8 | 0.0028 |
| Normoxia + CO2 | 0.95 ± 0.10 | |||
| 5D | Normoxia | 1.17 ± 0.38 | 10 | 0.002 |
| Normoxia + Photostim. | 2.27 ± 0.63 | |||
| 5G | Normoxia | 1.04 ± 0.32 | 6 | 0.86 |
| Normoxia + Photostim.+ CO2 | 1.01 ± 0.30 |
Table 2
Respiratory rate.
| Figure | Comparison | Resp. rate (Hz)(mean ± S.E.) | n | p Value |
|---|---|---|---|---|
| 1E | Normoxia | 1.03 ± 0.02 | 15 | 1.67 × 10⁻⁵ |
| Hypoxia | 1.33 ± 0.05 | |||
| 3D | Normoxia | 1.00 ± 0.02 | 9 | 6.59 × 10⁻⁴ |
| Hypoxia | 1.28 ± 0.05 | |||
| 3G | Normoxia | 1.06 ± 0.03 | 9 | 2.71 × 10⁻⁴ |
| Hypoxia + CO2 | 1.88 ± 0.15 | |||
| 4D | Normoxia | 0.99 ± 0.03 | 9 | 3.78 × 10⁻⁵ |
| Normoxia + CO2 | 1.78 ± 0.10 | |||
| 5E | Normoxia | 1.02 ± 0.03 | 10 | 0.019 |
| Normoxia + Photostim. | 1.24 ± 0.08 | |||
| 5H | Normoxia | 1.01 ± 0.03 | 6 | 0.031 |
| Normoxia + Photostim.+ CO2 | 1.84 ± 0.08 |
Table 3
Spike-wave seizure duration.
| Figure | Comparison | Duration (s)(mean ± S.E.) | n | p Value |
|---|---|---|---|---|
| 1D | Normoxia | 5.3 ± 0.4 | 15 | 0.56 |
| Hypoxia | 5.8 ± 0.4 | |||
| 3C | Normoxia | 5.5 ± 0.5 | 9 | 0.26 |
| Hypoxia | 6.3 ± 0.5 | |||
| 3F | Normoxia | 5.5 ± 0.6 | 9 | 0.006 |
| Hypoxia + CO2 | 7.5 ± 1.0 | |||
| 4C | Normoxia | 5.6 ± 0.4 | 8 | 0.22 |
| Normoxia + CO2 | 6.2 ± 0.4 | |||
| 5D | Normoxia | 4.3 ± 0.6 | 10 | 0.51 |
| Normoxia + Photostim. | 4.6 ± 0.5 | |||
| 5G | Normoxia | 6.8 ± 1.0 | 6 | 0.88 |
| Normoxia + Photostim.+ CO2 | 6.9 ± 1.0 |
Table 4
Spike-wave seizure frequency.
| Figure | Comparison | Frequency (Hz)(mean ± S.E.) | n | p Value |
|---|---|---|---|---|
| 1D | Normoxia | 7.6 ± 0.1 | 15 | 4.7 × 10⁻⁵ |
| Hypoxia | 5.8 ± 0.4 | |||
| 3C | Normoxia | 7.7 ± 0.2 | 9 | 0.014 |
| Hypoxia | 6.3 ± 0.5 | |||
| 3F | Normoxia | 7.8 ± 0.1 | 9 | 0.18 |
| Hypoxia + CO2 | 7.5 ± 1.0 | |||
| 4C | Normoxia | 6.1 ± 1.0 | 8 | 0.28 |
| Normoxia + CO2 | 6.2 ± 0.0 | |||
| 5D | Normoxia | 7.5 ± 0.2 | 10 | 2.2 × 10⁻⁴ |
| Normoxia + Photostim. | 4.6 ± 0.5 | |||
| 5G | Normoxia | 7.9 ± 0.2 | 6 | 0.33 |
| Normoxia + Photostim.+ CO2 | 6.9 ± 1.0 |
Table 5
Arterial measurements in Wistar rats.
| Figure | Parameter | Comparison | Value | n | p Value |
|---|---|---|---|---|---|
| 2C1 | PaO2 | Normoxia | 83.25 ± 2.32 | 4 | 0.0002 |
| Hypoxia | 32.25 ± 1.25 | ||||
| 2C2 | PaCO2 | Normoxia | 37.0 ± 0.59 | 4 | 6.6 × 10⁻⁵ |
| Hypoxia | 22.33 ± 0.16 | ||||
| 2C3 | pH | Normoxia | 7.47 ± 0.01 | 4 | 4.5 × 10⁻⁵ |
| Hypoxia | 7.63 ± 0.01 |
Table 6
Arterial measurements in WAG/Rij rats.
| Figure | Parameter | Comparison | Value | n | p Value |
|---|---|---|---|---|---|
| 3H1 | PaO2 | Normoxia | 84.93 ± 1.82 | 6 | 6.0 × 10⁻⁶ |
| Hypoxia | 34.50 ± 0.56 | ||||
| Normoxia | 84.93 ± 0.02 | 6 | 0.000134 | ||
| Hypoxia +CO2 | 55.83 ± 0.87 | ||||
| 3H2 | PaCO2 | Normoxia | 43.48 ± 0.47 | 6 | 2.1 × 10⁻⁶ |
| Hypoxia | 25.83 ± 0.65 | ||||
| NormoxiaHypoxia +CO2 | 43.48 ± 0.47 | 6 | 0.42 | ||
| 44.60 ± 0.55 | |||||
| 3H3 | pH | Normoxia | 7.45 ± 0.01 | 6 | 7.0 × 10⁻⁶ |
| Hypoxia | 7.61 ± 0.01 | ||||
| Normoxia | 7.45 ± 0.01 | 6 | 0.008 | ||
| Hypoxia +CO2 | 7.43 ± 0.01 | ||||
| 4E1 | PaO2 | Normoxia | 84.93 ± 1.82 | 6 | 0.00019 |
| 5% CO2 | 34.50 ± 0.56 | ||||
| 4E2 | PaCO2 | Normoxia | 43.48 ± 0.47 | 6 | 0.022 |
| 5% CO2 | 25.83 ± 0.65 | ||||
| 4E3 | pH | Normoxia | 7.45 ± 0.01 | 6 | 0.00063 |
| 5% CO2 | 7.42 ± 0.01 |
Table 7
cFos-positive cells in WAG/Rij rats.
| Figure | Threshold | Comparison | Counts(mean ± S.E.) | n | p Value |
|---|---|---|---|---|---|
| 6C | 3 | Normoxia | 282 ± 148.2 | 4 | 1.5 × 10⁻⁷ |
| Hypoxia | 1370 ± 137 | ||||
| Normoxia | 282 ± 148.2 | 4 | 0.55 | ||
| Hypoxia+ CO2 | 385.5 ± 78.7 | ||||
| HypoxiaHypoxia+ CO2 | 1370 ± 137385.5 ± 78.7 | 4 | 4.3 × 10⁻⁷ | ||
| 5 | Normoxia | 112.3 ± 57.1 | 4 | 0.0005 | |
| Hypoxia | 595.3 ± 85.0 | ||||
| Normoxia | 112.3 ± 57.1 | 4 | 0.045 | ||
| Hypoxia+ CO2 | 348 ± 68.9 | ||||
| HypoxiaHypoxia+ CO2 | 595.3 ± 85.0348 ± 68.9 | 4 | 0.061 | ||
| 7 | Normoxia | 57.3 ± 29.2 | 4 | 0.021 | |
| Hypoxia | 349 ± 75.0 | ||||
| Normoxia | 57.3 ± 29.2 | 4 | 0.036 | ||
| Hypoxia+ CO2 | 319.5 ± 63.1 | ||||
| HypoxiaHypoxia+ CO2 | 349 ± 75.0319.5 ± 63.1 | 4 | 0.95 | ||
| Holding currents (pA) | N | P value | |||
| 6H | Intra | Baseline pH 7.3pH 8.0 | 9.9 ± 11.1–136.6 ± 17.5 | 5 | 0.016 |
| S1 | Baseline pH 7.3pH 8.0 | 4.2 ± 5.363.3 ± 8.4 | 5 | 0.008 | |
| VB | Baseline pH 7.3pH 8.0 | 6.5 ± 19.4–61.6 ± 27.4 | 4 | 0.057 |
Additional files
Download links
A two-part list of links to download the article, or parts of the article, in various formats.
Downloads (link to download the article as PDF)
Open citations (links to open the citations from this article in various online reference manager services)
Cite this article (links to download the citations from this article in formats compatible with various reference manager tools)
Respiratory alkalosis provokes spike-wave discharges in seizure-prone rats
eLife 11:e72898.
https://doi.org/10.7554/eLife.72898


