Association of egg consumption, metabolic markers, and risk of cardiovascular diseases: A nested case-control study
- Department of Epidemiology and Biostatistics, Peking University, China
- Peking University Center for Public Health and Epidemic Preparedness & Response, China
- Key Laboratory of Molecular Cardiovascular Sciences (Peking University), Ministry of Education, China
- Fuwai Hospital Chinese Academy of Medical Sciences, National Center for Cardiovascular Diseases, China
- Chinese Academy of Medical Sciences, China
- Medical Research Council Population Health Research Unit at the University of Oxford, United Kingdom
- Clinical Trial Service Unit & Epidemiological Studies Unit (CTSU), Nuffield Department of Population Health, University of Oxford, United Kingdom
- NCDs Prevention and Control Department, Zhejiang CDC, China
- China National Center for Food Safety Risk Assessment, China
Figures
Figure 1
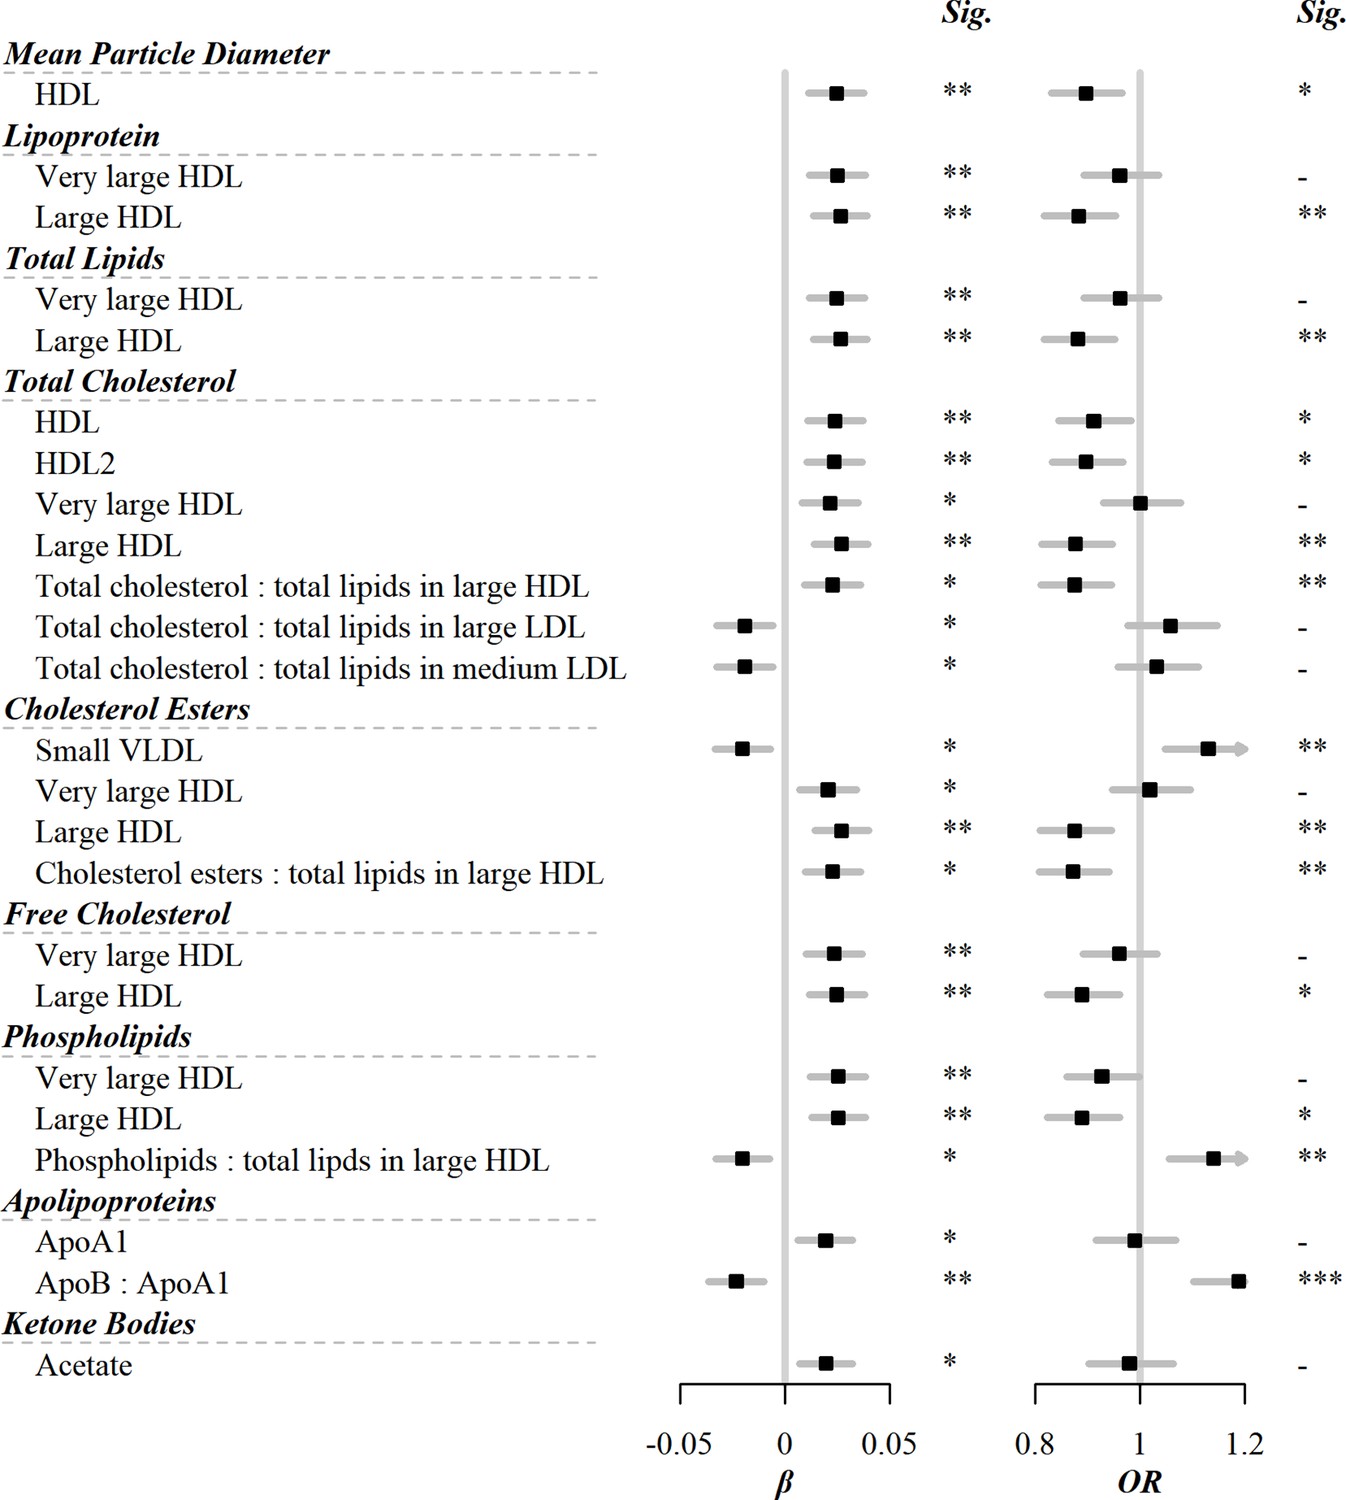
Significant associations of egg consumption and metabolic markers, and associations of these markers with risks of CVD.
Models were adjusted for age, sex, region, education, household income, occupation, marital status, tea-drinking habit, smoking status, alcohol intake, physical activity, self-rated health, fasting time, and frequency of other 11 food groups. Black squares represented coefficients or ORs, while gray horizontal lines represented 95% CI. Significance (Sig.): *p<0.05, **p<0.01, ***p<0.001 (FDR-adjusted p using the Benjamini-Hochberg method). The source data can be found in .
-
Figure 1—source data 1
Significant associations of egg consumption and metabolic markers, and associations of these markers with risks of CVD.
- https://cdn.elifesciences.org/articles/72909/elife-72909-fig1-data1-v1.xlsx
Figure 2
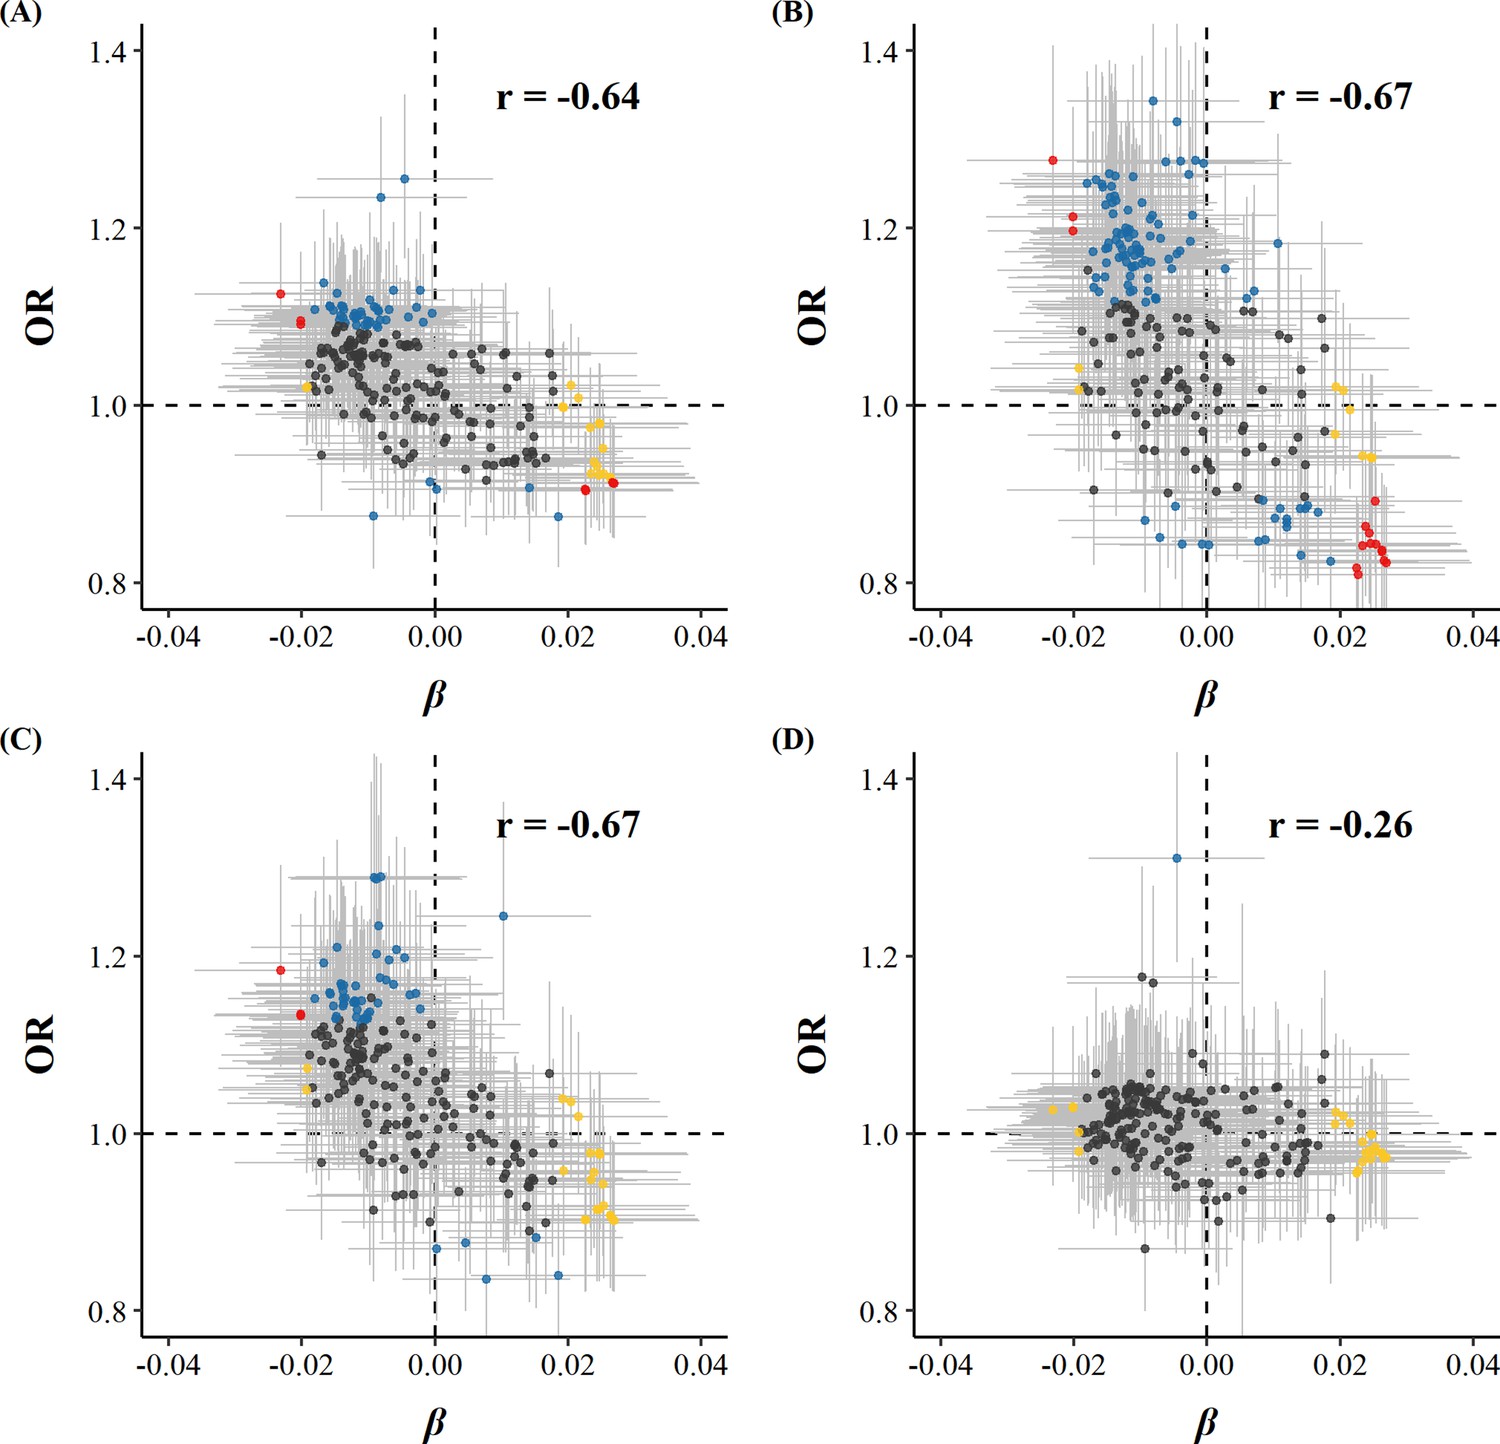
Global comparison of SD differences of 225 log-transformed metabolic markers associated with weekly days of egg consumption vs.ORs for (A) CVD, (B) MI, (C) IS, and (D) ICH associated with SD higher log-transformed metabolic markers.
Yellow dots represented markers that were associated with egg consumption but not with the risk of diseases. Blue dots represented markers associated with the risk of diseases but not with egg consumption. Red dots represented markers associated with both egg consumption and risk of diseases, with overlapping dots darker in color. The gray horizontal and vertical lines represented 95% CI of coefficients and ORs, respectively. Pearson correlations of coefficients and ORs were annotated in the upper right corner. The source data can be found in Figure 2—source data 1.
-
Figure 2—source data 1
Global comparison of SD differences of 225 log-transformed metabolic markers associated with weekly days of egg consumption and CVD risks.
- https://cdn.elifesciences.org/articles/72909/elife-72909-fig2-data1-v1.xlsx
Figure 3
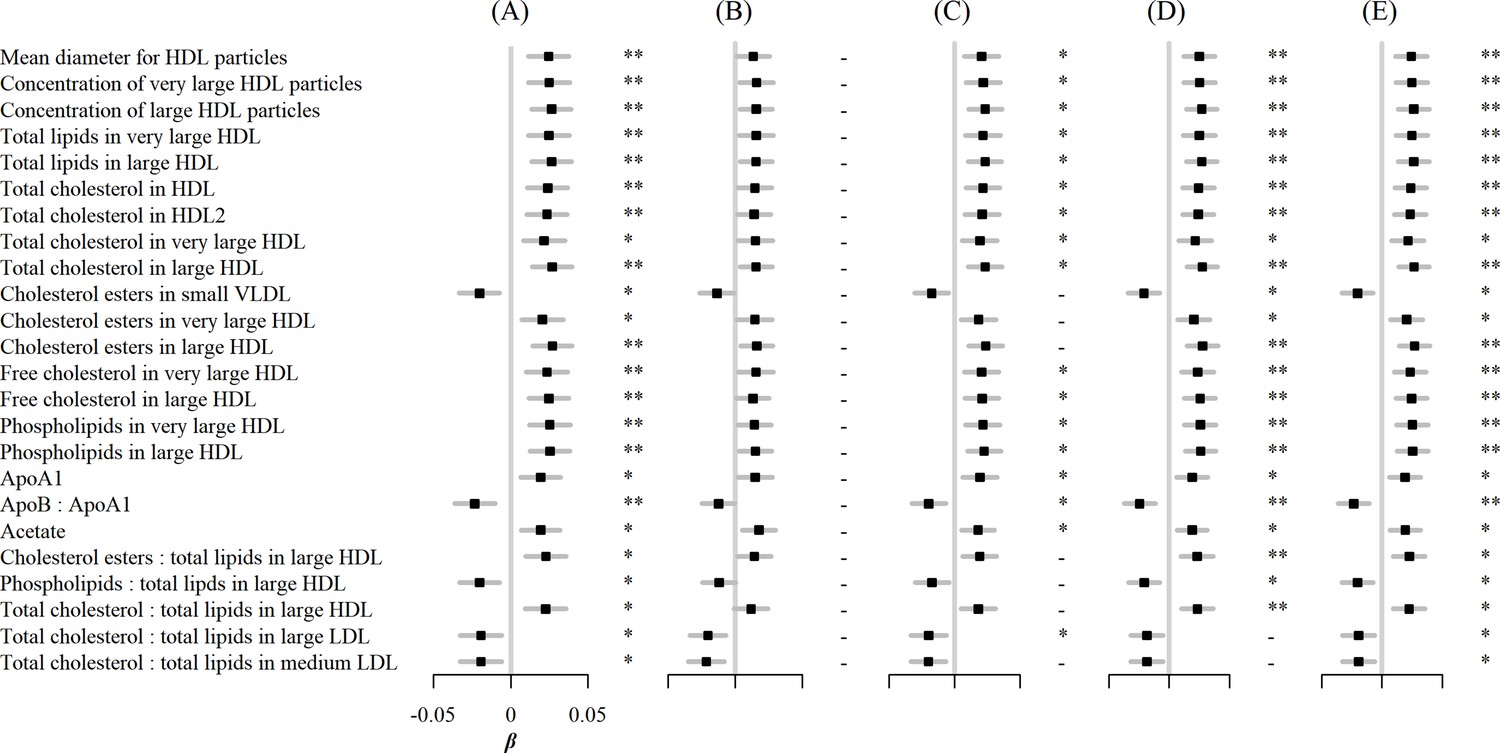
Associations of egg consumption and log-transformed metabolic markers.
(A) In basic models, additionally adjusted for (B) BMI, (C) hypertension, (D) diabetes, and (E) family history of diabetes, heart attack or stroke. Significance: * p<0.05, ** p<0.01 (FDR-adjusted p using the Benjamini-Hochberg method).
Figure 4
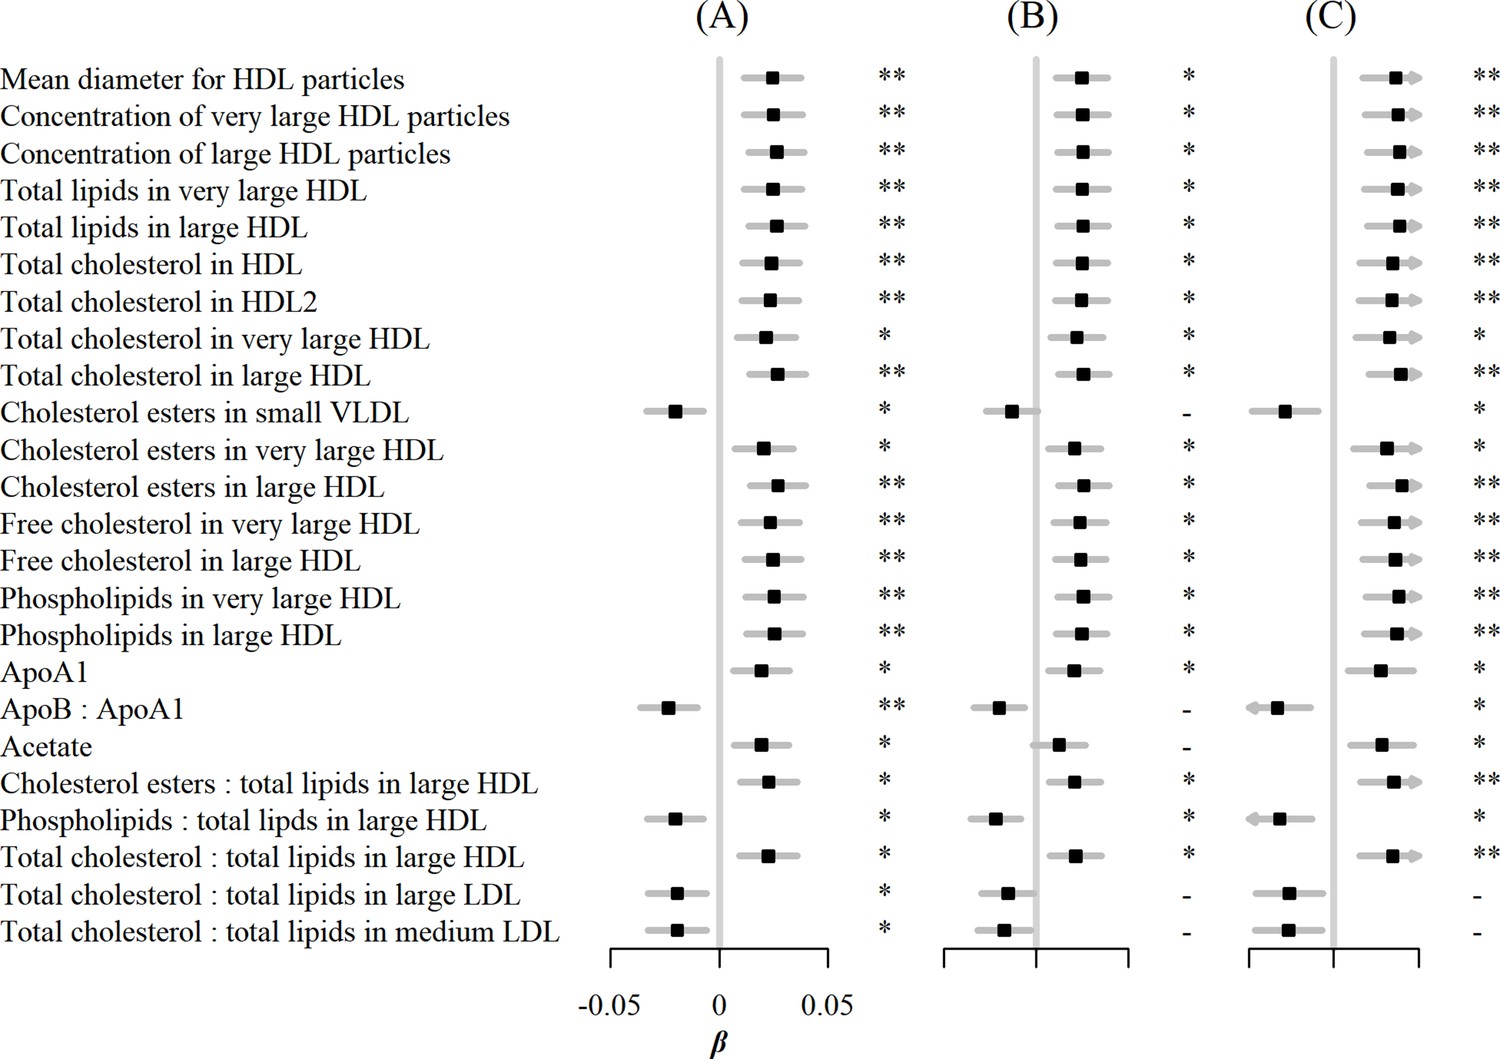
Associations of egg consumption and log-transformed metabolic markers.
(A) In basic models, when (B) restricting the analyses to participants without any metabolic markers below the detection limit or rejected by the quality control (n=4251), and (C) using weekly amount of egg consumption as continuous independent variable instead of its frequency. Significance: * p<0.05, ** p<0.01 (FDR-adjusted p using the Benjamini-Hochberg method).
Tables
Table 1
Baseline characteristics among 4,778 participants.
| Controls | MI cases | IS cases | ICH cases | |
|---|---|---|---|---|
| N | 1,377 | 946 | 1217 | 1238 |
| Age, y | 46.87 (0.20) | 52.42 (0.24) | 42.51 (0.22) | 47.38 (0.21) |
| Female, % | 50.26 | 40.40 | 55.87 | 51.54 |
| Urban residents, % | 27.13 | 28.90 | 36.88 | 23.37 |
| Middle school or above, % | 56.97 | 53.84 | 53.70 | 56.36 |
| Income ≥35,000 Yuan/year, % | 9.98 | 12.84 | 12.89 | 10.60 |
| Manual worker, % | 69.88 | 68.39 | 69.12 | 71.50 |
| BMI, kg/m2 | 23.56 (0.09) | 24.03 (0.12) | 24.27 (0.10) | 24.20 (0.10) |
| SBP, mmHg | 127.94 (0.64) | 136.96 (0.82) | 136.46 (0.72) | 149.76 (0.68) |
| DBP, mmHg | 76.97 (0.36) | 82.05 (0.47) | 82.57 (0.41) | 89.35 (0.39) |
| RBG, mmol/L | 5.63 (0.08) | 6.47 (0.10) | 6.19 (0.08) | 6.31 (0.08) |
| Ever regular smoking, % | 34.60 | 40.79 | 38.32 | 36.10 |
| Weekly drinking, % | 18.11 | 15.27 | 18.77 | 20.68 |
| Physical activity, MET-h/d | 23.20 (0.36) | 22.08 (0.46) | 22.72 (0.40) | 23.26 (0.38) |
| Eggs consumption, d/w | 2.69 (0.06) | 2.44 (0.07) | 2.62 (0.07) | 2.52 (0.06) |
| Red meat consumption, d/w | 3.26 (0.06) | 3.23 (0.07) | 3.35 (0.06) | 3.31 (0.06) |
| Fresh fruits consumption, d/w | 2.32 (0.05) | 1.91 (0.07) | 2.08 (0.06) | 2.04 (0.06) |
| ≥8 h of fasting, % | 13.65 | 15.04 | 16.69 | 14.86 |
| Poor self-rated health, % | 9.60 | 14.00 | 14.11 | 13.49 |
| Diabetes, % | 5.27 | 10.86 | 8.74 | 8.21 |
| Hypertension, % | 27.06 | 44.47 | 45.00 | 64.66 |
| Family history of diabetes, % | 7.22 | 9.02 | 9.11 | 7.98 |
| Family history of CVD, % | 23.68 | 27.55 | 26.71 | 31.04 |
-
Results were standardized by age, sex, and region where appropriate. Values are means (standard errors, SE) or %. Abbreviations: BMI, body mass index; SBP, systolic blood pressure; DBP, diastolic blood pressure; RBG, random blood glucose; MET, metabolic equivalent; CVD, cardiovascular disease; MI, myocardial infarction; IS, ischemic stroke; ICH, intracerebral hemorrhage.
Additional files
-
Supplementary file 1
Detailed association of egg consumption, metabolic markers, and CVD risk.
(a) Associations (95% CI) of egg consumption with all 225 log-transformed metabolic markers or devided traits, and of these markers with CVD risk. (b). ORs (95% CI) for MI, IS, and ICH per SD higher log-transformed metabolic markers.
- https://cdn.elifesciences.org/articles/72909/elife-72909-supp1-v1.xlsx
-
Supplementary file 2
Members of the China Kadoorie Biobank collaborative group.
- https://cdn.elifesciences.org/articles/72909/elife-72909-supp2-v1.xlsx
-
Transparent reporting form
- https://cdn.elifesciences.org/articles/72909/elife-72909-transrepform1-v1.docx
-
Source code 1
Analysis code based on Stata software.
- https://cdn.elifesciences.org/articles/72909/elife-72909-code1-v1.zip
Download links
A two-part list of links to download the article, or parts of the article, in various formats.
Downloads (link to download the article as PDF)
Open citations (links to open the citations from this article in various online reference manager services)
Cite this article (links to download the citations from this article in formats compatible with various reference manager tools)
Association of egg consumption, metabolic markers, and risk of cardiovascular diseases: A nested case-control study
eLife 11:e72909.
https://doi.org/10.7554/eLife.72909


