IL-4 and helminth infection downregulate MINCLE-dependent macrophage response to mycobacteria and Th17 adjuvanticity
- Institut für Klinische Mikrobiologie, Immunologie und Hygiene, Universitätsklinikum Erlangen, Friedrich-Alexander Universität Erlangen-Nürnberg, Germany
- Institut für Medizinische Mikrobiologie, Immunologie und Hygiene, Center for Global Health, Technische Universität München, Germany
- Center for Global Health, Technical University Munich, Germany
- Infektionsbiologische Abteilung, Universitätsklinikum Erlangen, Friedrich-Alexander Universität Erlangen-Nürnberg, Germany
- Adjuvant Research, Department of Infectious Disease Immunology, Statens Serum Institut, Denmark
- Cellular Microbiology, Forschungszentrum Borstel, Leibniz Lung Center Borstel, Germany
- Medizinische Klinik 1, Universitätsklinikum Erlangen, Friedrich-Alexander Universität Erlangen-Nürnberg, Germany
Figures
Figure 1
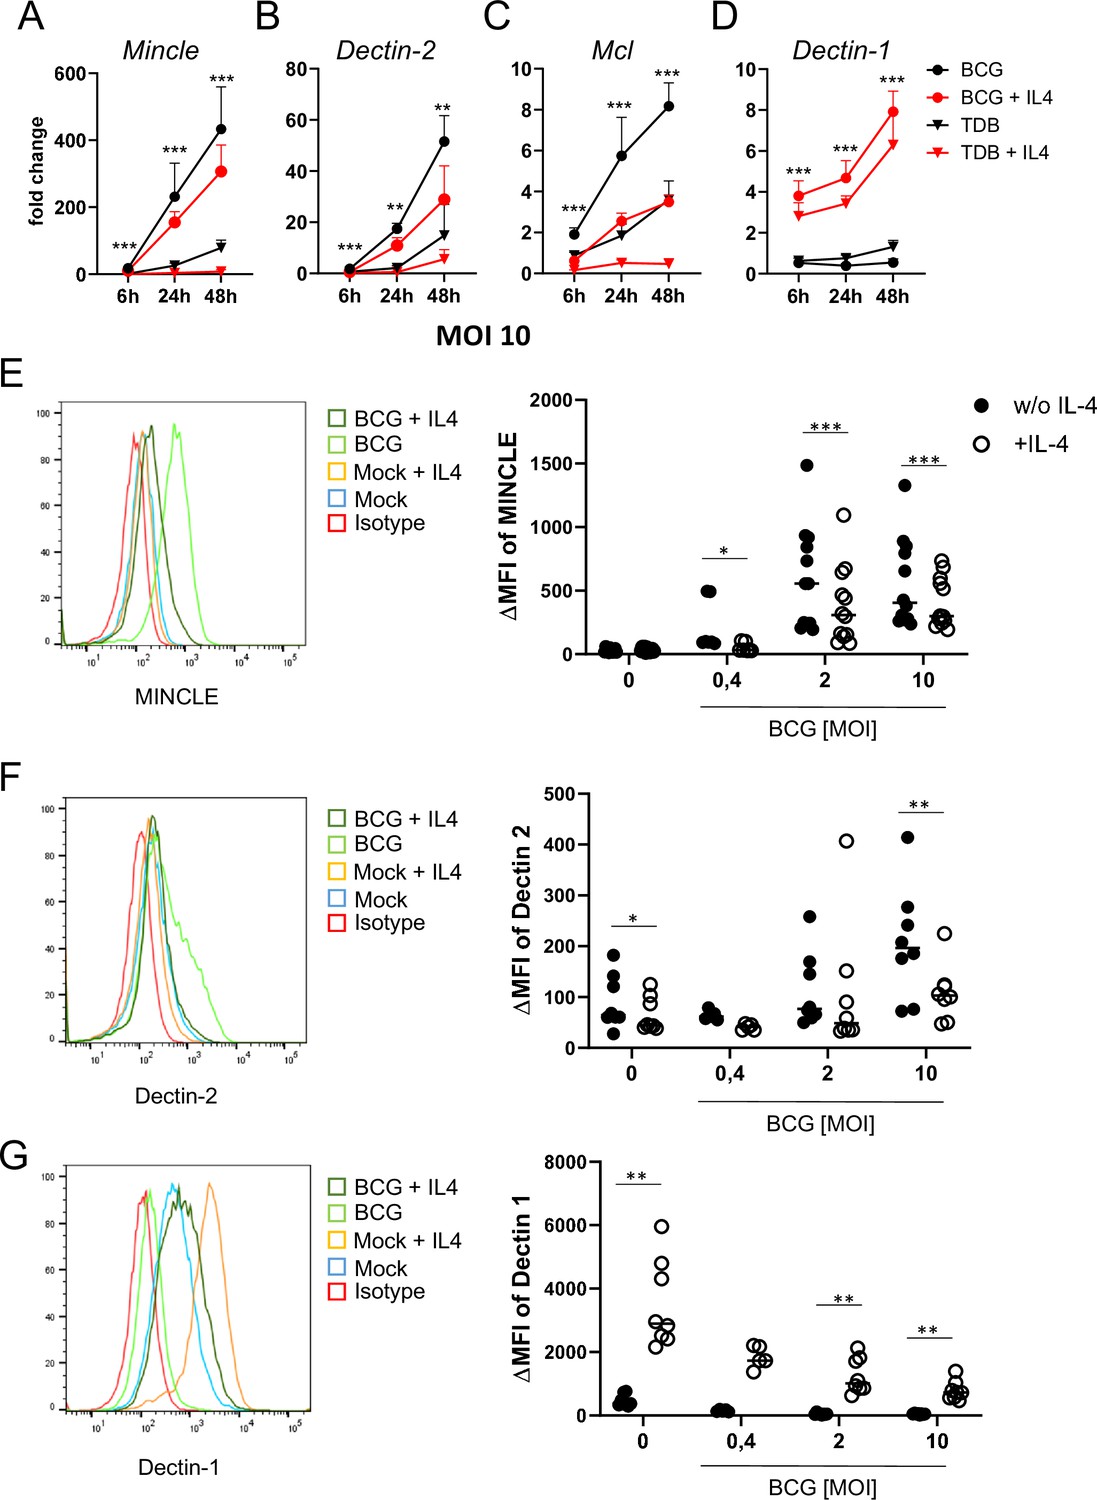
IL-4 impairs upregulation of MINCLE and other DECTIN-2 family C-type lectin receptor (CLR) in macrophages stimulated with bacille Calmette-Guerin (BCG).
(A–D) C57BL/6 bone marrow-derived macrophages (BMM) were stimulated as indicated in presence or absence of IL-4 for 6, 24, or 48 hr. BCG was used at MOI 10. MINCLE (A), DECTIN-2 (B), MCL (C), and DECTIN-1 (D) mRNA expression was determined by quantitative real-time PCR (qRT-PCR) shown as fold change calibrated to unstimulated control. Data are depicted as mean + SD from two independent experiments performed in biological duplicates. (E–G) BMM were stimulated with BCG at the indicated MOI in the presence or absence of IL-4 for 24 hr, followed by staining for MINCLE (E), DECTIN-2 (F), or DECTIN-1 (G) expression. Representative stainings are shown as histogram overlay (left panel), for quantification (right panel) the median fluorescence intensity of the isotype control staining was subtracted from the respective CLR signal to obtain the ΔMFI. Each point represents one mouse, pooled from at least two independent experiments. *p<0.05, **p<0.01, ***p<0.001 in Wilcoxon signed rank test.
-
Figure 1—source data 1
Source data Figure 1 (qRT-PCR and flow cytometry analysis of CLR in macrophages).
- https://cdn.elifesciences.org/articles/72923/elife-72923-fig1-data1-v1.xlsx
Figure 2

IL-4 does not affect phagocytosis of bacille Calmette-Guerin (BCG) but inhibits cytokine production.
(A) C57BL/6 bone marrow-derived macrophages (BMMs) were infected with different MOI of fluorescent BCG-Dsred co-treated with IL-4 or not as indicated. Phagocytic uptake was measured via flow cytometry. (A) Representative histograms show phagocytosis of BCG by detection of fluorescent DsRed signal in BMMs. Quantitative analysis of phagocytosis based on percentage of BCG-positive cells at 6 and 24 hr post infection. Data is depicted from two to three independent experiments performed in biological duplicates. (B) C57BL/6 (WT), MINCLE knockout (Clec4e-/-), and FcRγ (Fcer1g-/-) BMM were stimulated with BCG for 24 hr. Production of G-CSF and TNF was measured from cell culture supernatants via ELISA. No significant cytokine production was detected from non-stimulated BMM. Data is depicted from three independent experiments performed in biological duplicates. (C) Phagocytosis of fluorescent BCG is unaltered in BMM deficient in MINCLE (Clec4e-/-) or FcRγ (Fcer1g-/-). Mean percentages of one representative experiment out of two (Fcer1g-/-) and three (Clec4e-/-) performed. *p<0.05, **p<0.01, ***p<0.001.
-
Figure 2—source data 1
Source data Figure 2 (phagocytosis and cytokine production).
- https://cdn.elifesciences.org/articles/72923/elife-72923-fig2-data1-v1.xlsx
Figure 3
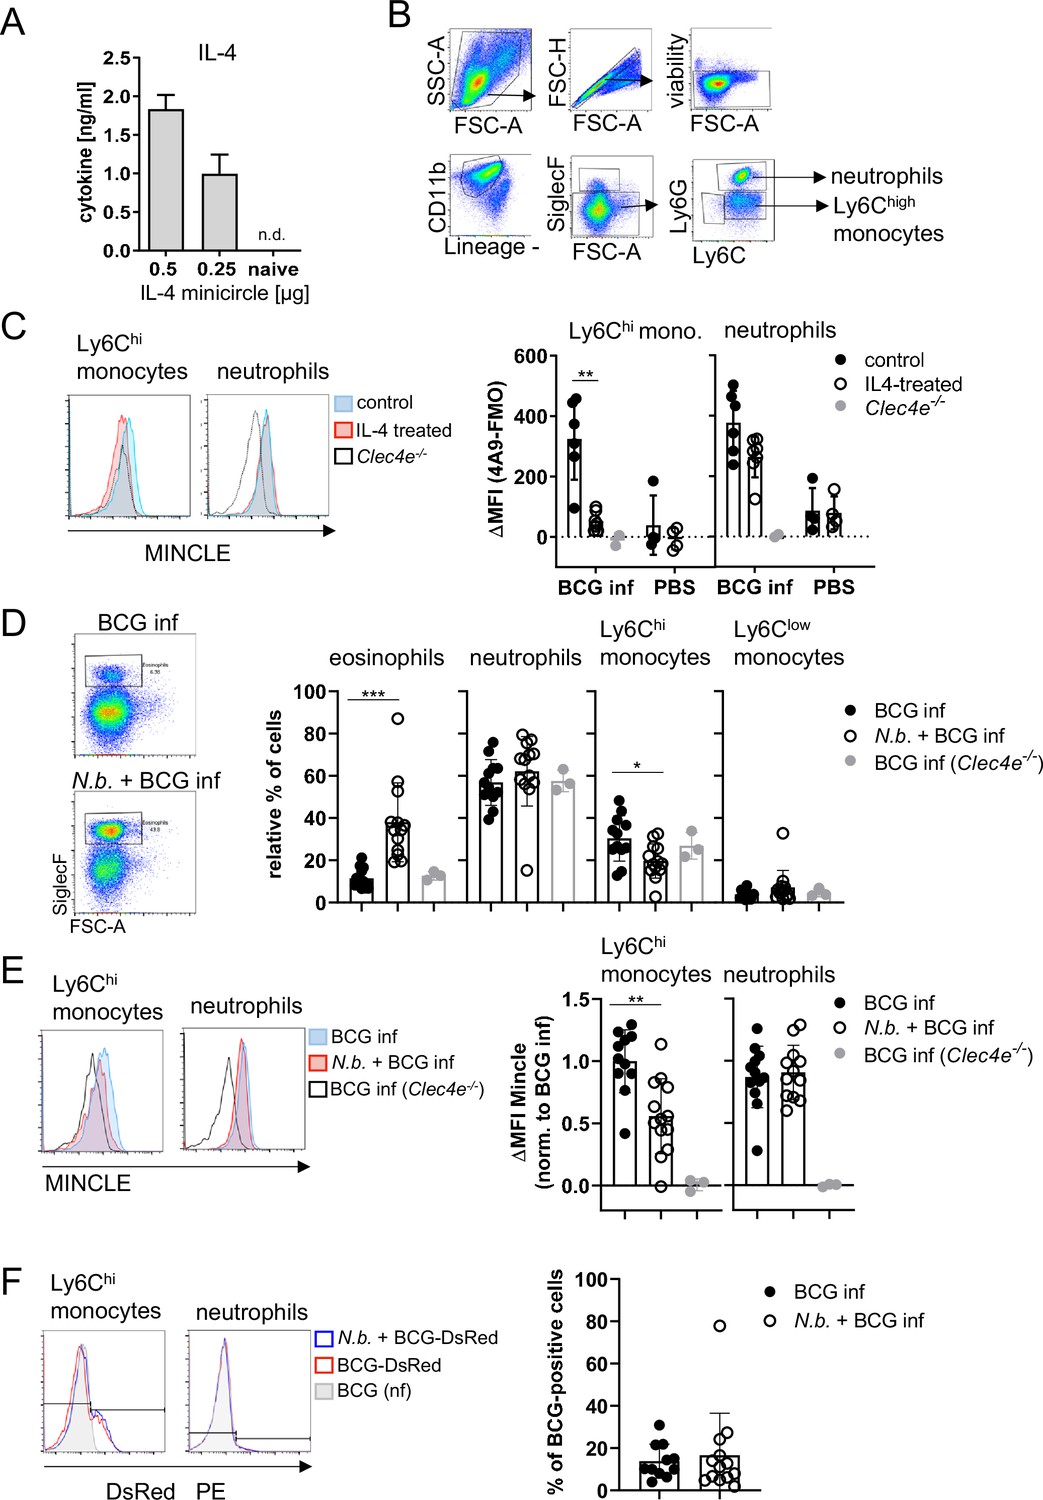
Overexpression of IL-4 or co-infection with Nippostrongylus brasiliensis impair MINCLE upregulation on peritoneal monocytes but does not reduce phagocytosis upon bacille Calmette-Guerin (BCG) infection.
(A) IL-4 concentration in serum of mice injected with IL-4 minicircle. C57BL/6 mice were hydrodynamically injected with 0.25 or 0.5 µg of IL-4 plasmid (i.v.) or Ringer solution. Five days (0.5 µg) or 7 days later (0.25 µg) mice were sacrificed and serum IL-4 levels were determined via ELISA (n=5–6 mice per group). n.d.=not detectable. (B, C) 0.25 µg of IL-4 plasmid or Ringer solution was hydrodynamically injected into C57BL/6 wildtype mice. Two days later mice were infected i.p. with 40×106 CFU of Mycobacterium bovis BCG. (B) Generic gating strategy for flow cytometry data. Monocytes were characterized as lineage-CD11b+SiglecF-Ly6C+ cells. Neutrophils were characterized as lineage-CD11b+SiglecF-Ly6G+ cells. Lineage marker: CD3, CD19, NK1.1. (C) Histograms depict MINCLE surface expression on Ly6Chi monocytes and neutrophils 24 hr p.i. analysed via flow cytometry. Quantitative analysis of MINCLE surface expression shown as median fluorescence intensity (MFI). Fluorescence minus one control (FMO) was substracted. Infected MINCLE-/- mice were used as staining controls to exclude unspecific binding of 4A9 antibody. Data is depicted from two independent experiments (2–7 mice per group in total, each dot corresponding to one mouse). **p0.01; ns = not significant. (D–E) C57BL/6 mice were s.c. infected with N. brasiliensis or left uninfected followed by M. bovis BCG-Dsred infection (40×106 CFU/mouse) on day 10 p.i. Twenty-four hr later mice were sacrificed. (D) Representative histograms of eosinophil population of BCG-infected and N. brasiliensis co-infected mouse. Bar graphs show relative percentage of myeloid cell populations as indicated. (E) MINCLE surface expression was analysed on peritoneal Ly6Chi monocytes and neutrophils via flow cytometry. Quantitative analysis of MINCLE surface expression shown as MFI normalized to BCG-infected mice. FMO was substracted. Data is depicted from three independent experiments (11–13 mice per group in total). *p<0.05, ** p<0.01, ***p<0.001. (F) C57BL/6 mice were s.c. infected with N. brasiliensis followed by M. bovis BCG-Dsred infection (40×106 CFU/mouse) or non-fluorescent BCG (nf) on day 10 p.i. Twenty-four hr after BCG infection, phagocytosis was measured by detection of PE signal in monocytes or neutrophils. Quantitative analysis of the percentage of BCG-positive monocytes.
-
Figure 3—source data 1
Source data Figure 3 (cytokine and flow cytometry data).
- https://cdn.elifesciences.org/articles/72923/elife-72923-fig3-data1-v1.xlsx
Figure 4
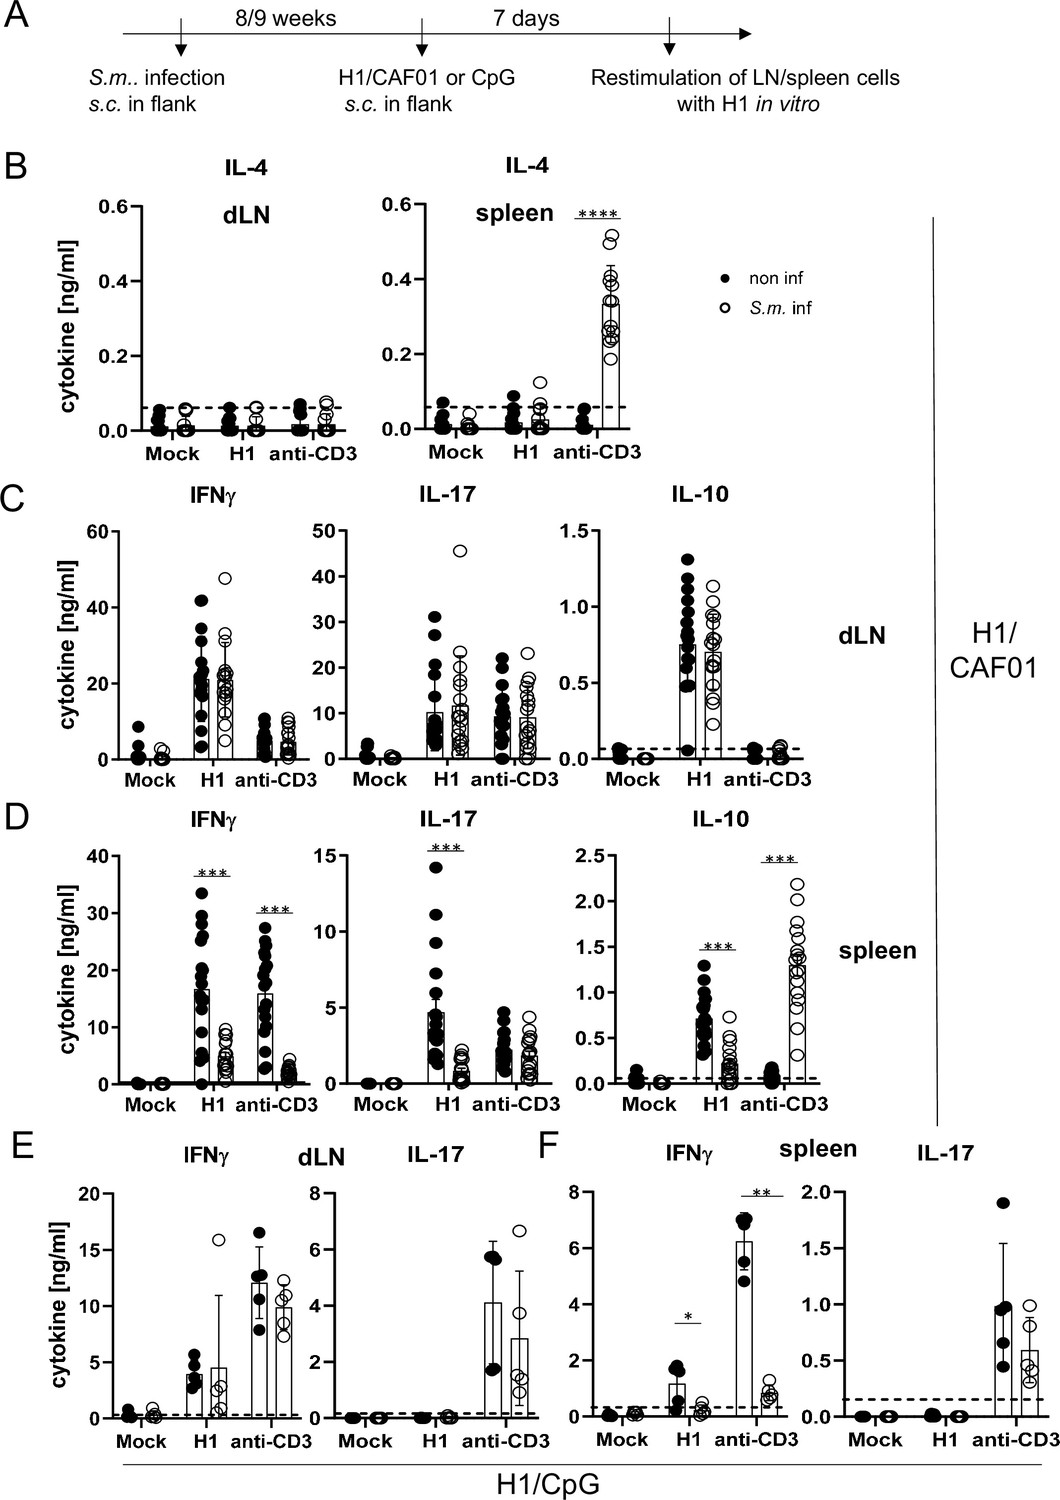
Co-infection with Schistosoma mansoni (S.m.) suppresses Th1/Th17 induction by a MINCLE-dependent adjuvant in the spleen but not in the draining lymph node.
(A) Scheme of experimental procedure. Cercariae of S.m. were injected s.c. into C57BL/6 mice. Eight to 9 weeks p.i. mice were immunized with CAF01 (B, C, D) or CpG ODN (E, F). Seven days after immunization, mice were sacrificed and inguinal lymph node cells and spleen cells were re-stimulated with H1 in vitro. Draining inguinal lymph node cells or splenocytes were re-stimulated with H1 or anti-CD3 for 96 hr. IL-17, IFNγ, IL-10, and IL-4 production was measured from cell culture supernatants by ELISA. Data is shown from three independent experiments (n=18 mice per group in total) for IFNγ, IL-17, and IL-10 (C, D) and from two independent experiments (n=13 mice) for IL-4 (B). (E, F) Data is shown from one experiment (n=5 mice per group in total). *p<0.05, **p<0.01, ***p<0.001. Dashed horizontal lines indicate the limit of detection for each cytokine.
-
Figure 4—source data 1
Source data Figure 4 (cytokine results).
- https://cdn.elifesciences.org/articles/72923/elife-72923-fig4-data1-v1.xlsx
Figure 5
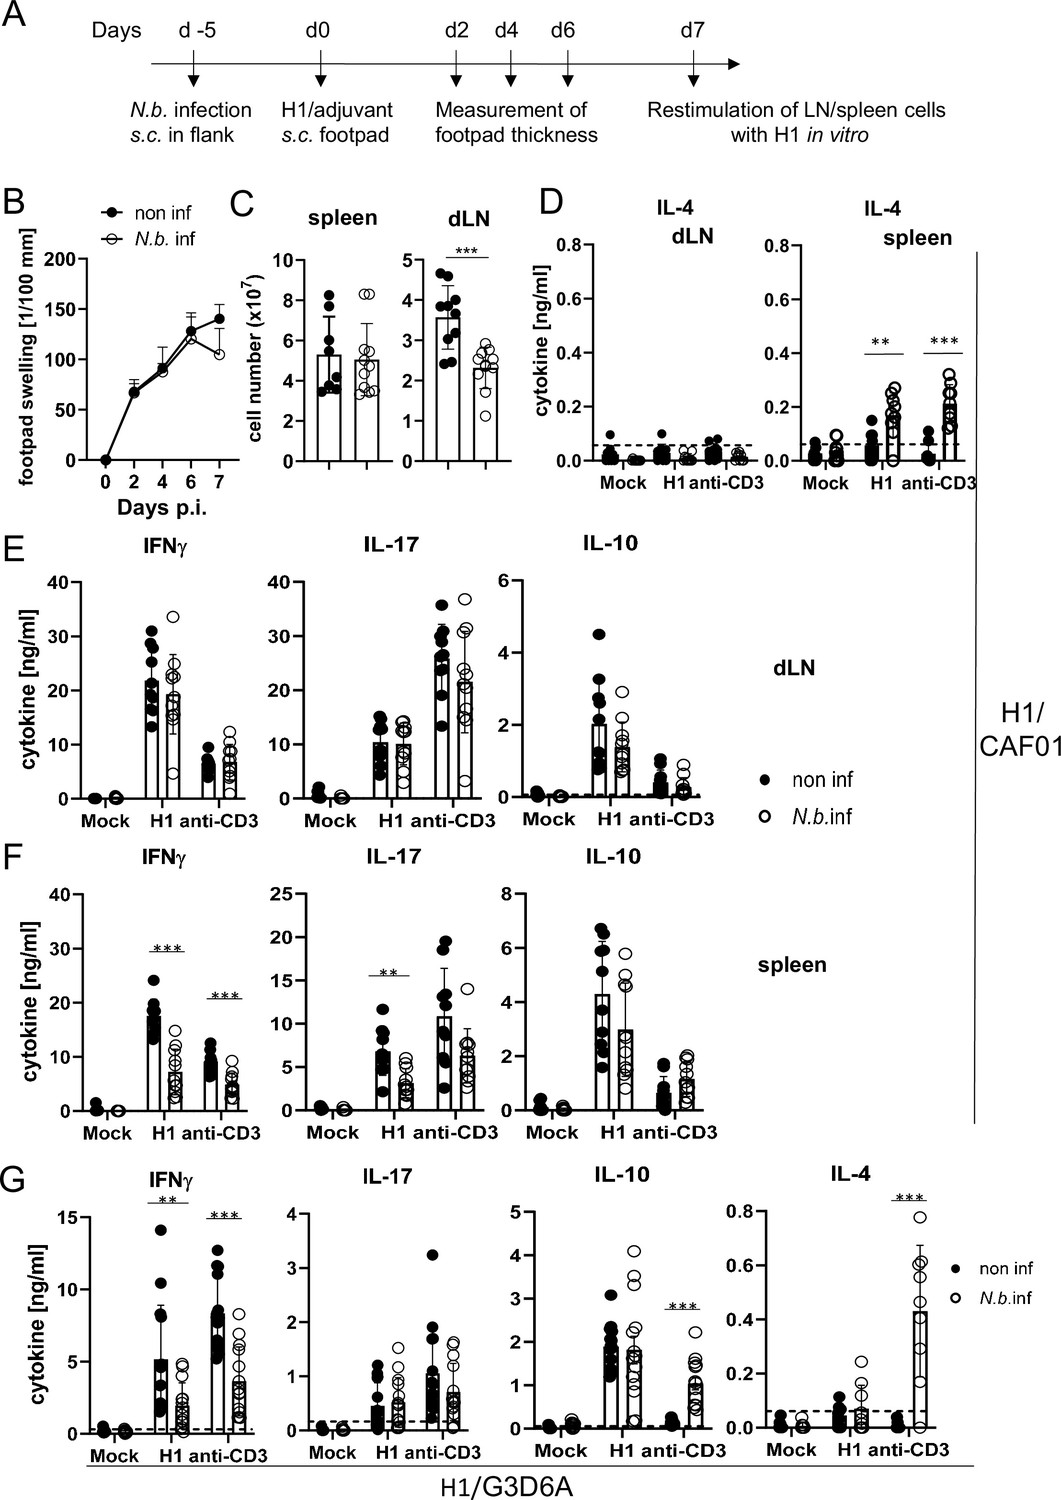
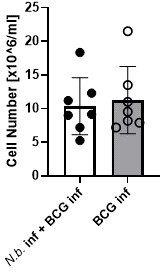
Co-infection with Nippostrongylus brasiliensis suppresses Th1/Th17 induction by a MINCLE-dependent adjuvant in the spleen but not in the draining lymph node.
(A) Scheme of experimental procedure. C57BL/6 mice were infected subcutaneously in the flank with 500 L3 larvae of N. brasiliensis in 200 µl PBS. Five days p.i. mice were immunized with H1/CAF01 (B–F) or H1/G3D6A (G). Seven days after immunization, mice were sacrificed, and inguinal and popliteal lymph node cells and spleen cells were re-stimulated with H1 in vitro. (B) Footpad swelling was measured over a period of 1 week after immunization with H1/CAF01 until mice were sacrificed (day 7 after immunization). The increase in footpad swelling is shown as mean + SD for the indicated time points (n=10–11 mice for each data point). (C) Absolute cell number of draining inguinal and popliteal lymph node cells (LN) and spleen on day 7 after H1/CAF01. (D–G) Draining inguinal and popliteal lymph node cells or splenocytes were re-stimulated with H1, anti-CD3, or left untreated (mock) for 96 hr, followed by cytokine determination by ELISA. (D) IL-4 levels produced by draining lymph node cells (left) or splenocytes (right). (E, F) IL-17, IFNγ, and IL-10 cytokine production by draining lymph node cells (E) and splenocytes (F). (G) Immunization of C57BL/6 mice with H1 in G3D6A adjuvant. Seven days after immunization mice were sacrificed and splenocytes were treated as described in (D, E). All data is shown from two (B–F) or three (G) independent experiments (n=9–14 mice per group in total). p<0.05, **p<0.01, ***p<0.001. Dashed horizontal lines indicate the limit of detection for each cytokine.
-
Figure 5—source data 1
Soruce data Figure 5 (cytokine results).
- https://cdn.elifesciences.org/articles/72923/elife-72923-fig5-data1-v1.xlsx
Figure 6

Inhibition of Th1/Th17 induction in Nippostrongylus brasiliensis infection depends on IL-4 or IL-13.
C57BL/6 or of Il4-/-Il13-/- mice were infected with N. brasiliensis or not as indicated and immunized s.c. with H1/CAF01 5 days later. On day 7 after immunization, mice were sacrificed and splenocytes were re-stimulated with H1 or anti-CD3 for 96 hr. Cytokines were measured by ELISA. (A) IFNγ, (B) IL-17, (C) IL-10, (D) IL-4. Data shown is pooled from four independent experiments (n=15–17 mice per group in total). p<0.05, **p<0.01, ***p<0.001. Dashed horizontal lines indicate the limit of detection for each cytokine.
-
Figure 6—source data 1
Soruce data Figure 6 (cytokine results).
- https://cdn.elifesciences.org/articles/72923/elife-72923-fig6-data1-v1.xlsx
Author response image 1
Author response image 2

Tables
Key resources table
| Reagent type (species) or resource | Designation | Source or reference | Identifiers | Additional information |
|---|---|---|---|---|
| Strain, strain background (Mus musculus) | C57BL/6 mice | Charles River or Preclinical Experimental Animal Center University Hospital Erlangen | ||
| Strain, strain background (Mus musculus) | MINCLE knockout mice | Consortium for Functional Glycomics | Clec4e-/- | Wells C et al. 2007J Immunol PMID:18490740 |
| Strain, strain background (Mus musculus) | FcRγ knockout mice | Prof. Dr Falk Nimmerjahn, Erlangen, Germany | Fcer1g-/- | Takai T et al. 1994Cell PMID:8313472 |
| Strain, strain background (Mus musculus) | 4-13ko mice | Prof. AN McKenzie, Cambridge, UK | Il4-/- Il13-/- | McKenzie et al., 1999 J Exp Med PMID:10330435 |
| Antibody | Rat monoclonal anti- mouse Mincle (# 4A9) Unlabeled | MBL | MBL-D292-3 | 1:200 dilution |
| Antibody | Rat monoclonal IgG1 Isotype unlabeled | eBioscience | 17-4812-82 | 1:200 dilution |
| Antibody | Rat monoclonal anti- mouse CD3-APC-eF780 | eBioscience | 47-0031-82 | 1:100 dilution |
| Antibody | Rat monoclonal anti- mouse CD19-APC-eF780 | eBioscience | 47-0193-82 | 1:100 dilution |
| Antibody | Rat monoclonal anti- mouse NK1.1-APC-eF780 | eBioscience | 47-5941-82 | 1:100 dilution |
| Antibody | Rat monoclonal anti- mouse CD11b-FITC | Biolegend | 101206 | 1:100 dilution |
| Antibody | Rat monoclonal anti- mouse SiglecF-BV421 | BD | 562681 | 1:400 dilution |
| Antibody | Rat monoclonal anti- mouse Ly6C-PerCP-Cy5.5 | Biolegend | 128012 | 1:200 dilution |
| Antibody | Rat monoclonal anti- mouse Ly6G-PE-Cy7 | Biolegend | 127618 | 1:400 dilution |
| Antibody | Human monoclonal anti-mouse Dectin1-APC | Miltenyi | 130-102-250 | 1:50 dilution |
| Antibody | Human monoclonal anti-mouse Dectin2-APC | Miltenyi | 130-116-911 | 1:50 dilution |
| Antibody | Human IgG1 APC (Isotype for Dectin2, Dectin1) | Miltenyi | 130-113-446 | 1:50 dilution |
| Chemical compound, drug | Mouse Fixable viability dye eF506 | eBioscience | 65-0866-18 | 1:1000 dilution |
| Antibody | Rat IgG1 APC | eBioscience | 17-4301-81 | 1:200 dilution |
| Antibody | Rat IgG1 APC Iso k | eBioscience | 14-4301-82 | 1:200 dilution |
| Sequence- based reagent | Mincle Primer (qRT-PCR) | Metabion | For: gctcacctggtggttatcg Rev: aggttttgtgcgaaaaagga | |
| Sequence- based reagent | Mcl Primer (qRT-PCR) | Metabion | For: agtaacgtgcatccgagagg Rev: taacaggacagcaggtccaa | |
| Sequence- based reagent | Dectin2 Primer (qRT-PCR) | Metabion | For: cagtgaagggactatggtgtca Rev: ggagccaaatgacttccagt | |
| Sequence- based reagent | Dectin1 Primer (qRT-PCR) | Metabion | For: atggttctgggaggatggat Rev: atggttctgggaggatggat | |
| Sequence- based reagent | Hprt Primer (qRT-PCR) | Metabion | For: tcctcctcagaccgctttt Rev: cctggttcatcatcgctaatc | |
| Sequence- based reagent | Mincle Probe | Roche | Roche Universal Probe Library (UPL) | #15 |
| Sequence- based reagent | Mcl Probe | Roche | Roche UPL | #1 |
| Sequence- based reagent | Dectin2 Probe | Roche | Roche UPL | #89 |
| Sequence- based reagent | Dectin1 Probe | Roche | Roche UPL | #60 |
| Sequence- based reagent | Hprt Probe | Roche | Roche UPL | #95 |
| Recombinant DNA reagent | Minicircle DNA encoding IL-4 | Dr Stefan Wirtz, Erlangen, Germany | ||
| Strain, strain background (bacteria) | Mycobacterium bovis BCG DsRed Danish | Dr Anca Dorhoi, Friedrich Löffler Institute, Greifswald, Germany | ||
| Strain, strain background (helminth) | Nippostrongylus brasiliensis | Dr David Vöhringer, Erlangen, Germany | 500 L3 larvae per mouse s.c. | |
| Strain, strain background (helminth) | Schistosoma mansoni | Dr Clarissa Prazeres da Costa, Munich, Germany | NMRI strain | 100 cercariae per mouse s.c. |
| Other | CpG ODN1826 | TIB MOLBIOL | 180000237 | 0.5 μM (in vitro); 10 nmol per mouse in vivo |
| Other | CAF01 (TDB+DDA liposomes) | Dr Dennis Christensen, Statens Serum Institute, Copenhagen, Denmark | Adjuvant, 50 µl injected s.c. together with H1 protein | |
| Other | G3D6A liposomal formulation | Dr Christian Alexander, Research Center Borstel | Adjuvant, 50 µl injected s.c. together with H1 protein | |
| Peptide, Recombinant protein | H1 Mycobacterial antigen | Dr Dennis Christensen, Statens Serum Institute, Copenhagen, Denmark | H1 is a fusion protein of Ag85B and ESAT-6. 2 µg H1 in 100 μl CAF01 for immunization and 1 μg/ml for re-stimulation | |
| Peptide, Recombinant protein | Recombinant murine IL-4 | PeproTech | 214–14 B | 10 μg/ml for in vitro stimulation |
| Peptide, Recombinant protein | Purified anti-CD3 e | Biolegend | 100302 | 0.5 μg/ml re-stimulation |
Additional files
Download links
A two-part list of links to download the article, or parts of the article, in various formats.
Downloads (link to download the article as PDF)
Open citations (links to open the citations from this article in various online reference manager services)
Cite this article (links to download the citations from this article in formats compatible with various reference manager tools)
IL-4 and helminth infection downregulate MINCLE-dependent macrophage response to mycobacteria and Th17 adjuvanticity
eLife 12:e72923.
https://doi.org/10.7554/eLife.72923


