Lipid droplets and ferritin heavy chain: a devilish liaison in human cancer cell radioresistance
- Biomedical Physics in Radiation Oncology, German Cancer Research Center (DKFZ), Im Neuenheimer Feld, Germany
- Experimental and Clinical Medicine Department, University Magna Graecia of Catanzaro, Italy
- Department of Physics and Astronomy, Heidelberg University, Im Neuenheimer Feld, Germany
- Centro de Ciências e Tecnologias Nucleares, Instituto Superior Técnico, Universidade de Lisboa, Portugal
Figures
Figure 1 with 3 supplements
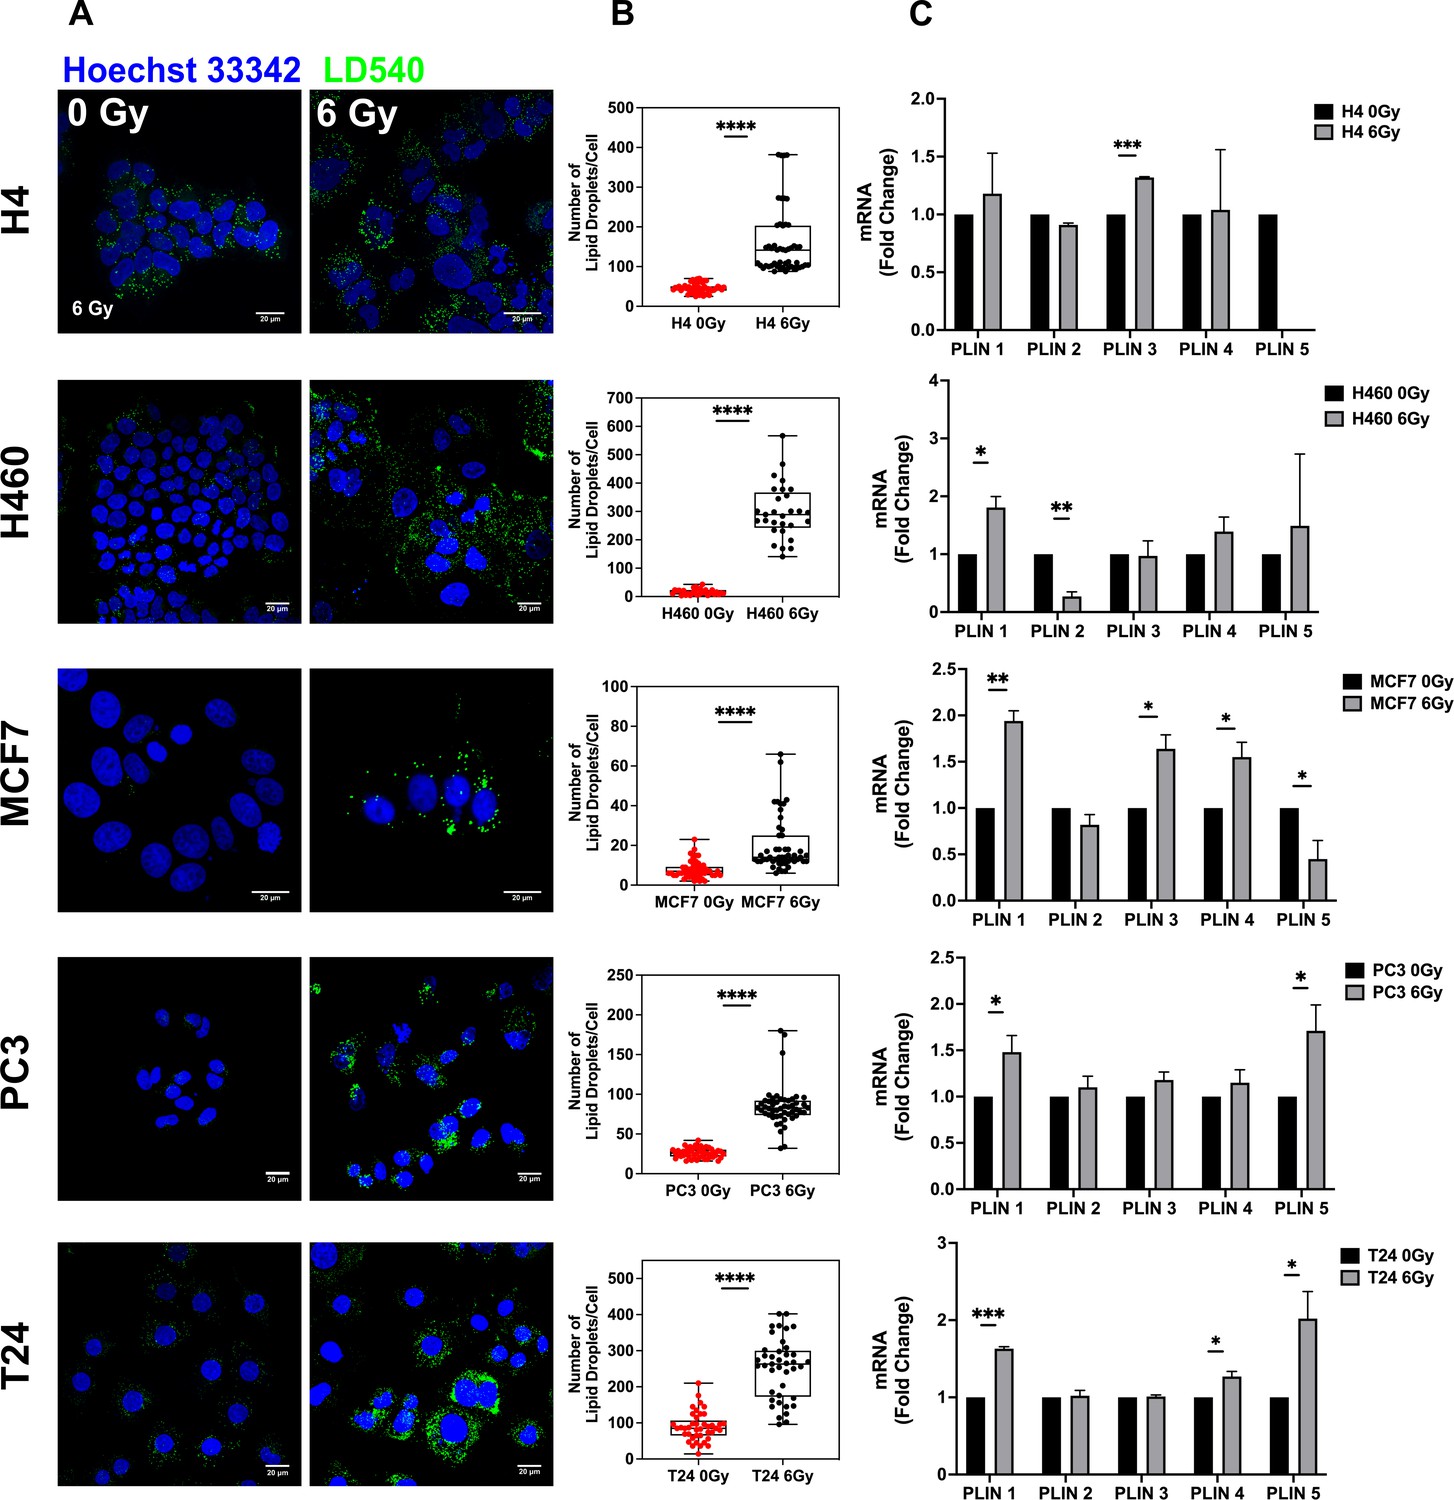
Lipid droplet detection in neuroglioma (H4), lung (H460), breast (MCF7), prostate (PC3), and bladder (T24) 6 Gy X-ray-resistant cancer cells.
Cancer cells have been irradiated with 6 Gy X-ray and left in culture for 72 hrs. Afterwards, surviving and untreated cells have been stained with LD540 and imaged at the fluorescence confocal microscope. Z-projection of the z-stack acquisitions for untreated and 6 Gy treated cells are reported in column (A) (Scale bar, 20 μM). (B) For each cell line, 50 cells have been randomly imaged, and their LD number counted by using FiJi software. (C) qPCR analysis of the PLIN genes in the indicated cell lines. PLIN5 in the H4 6 Gy treated cells is not reported in the graph because it was not expressed. Error bars represent the means ± SD from three independent experiments. *≤0.05; **≤0.01; ***≤0.001, and ****≤0.0001.
Figure 1—figure supplement 1
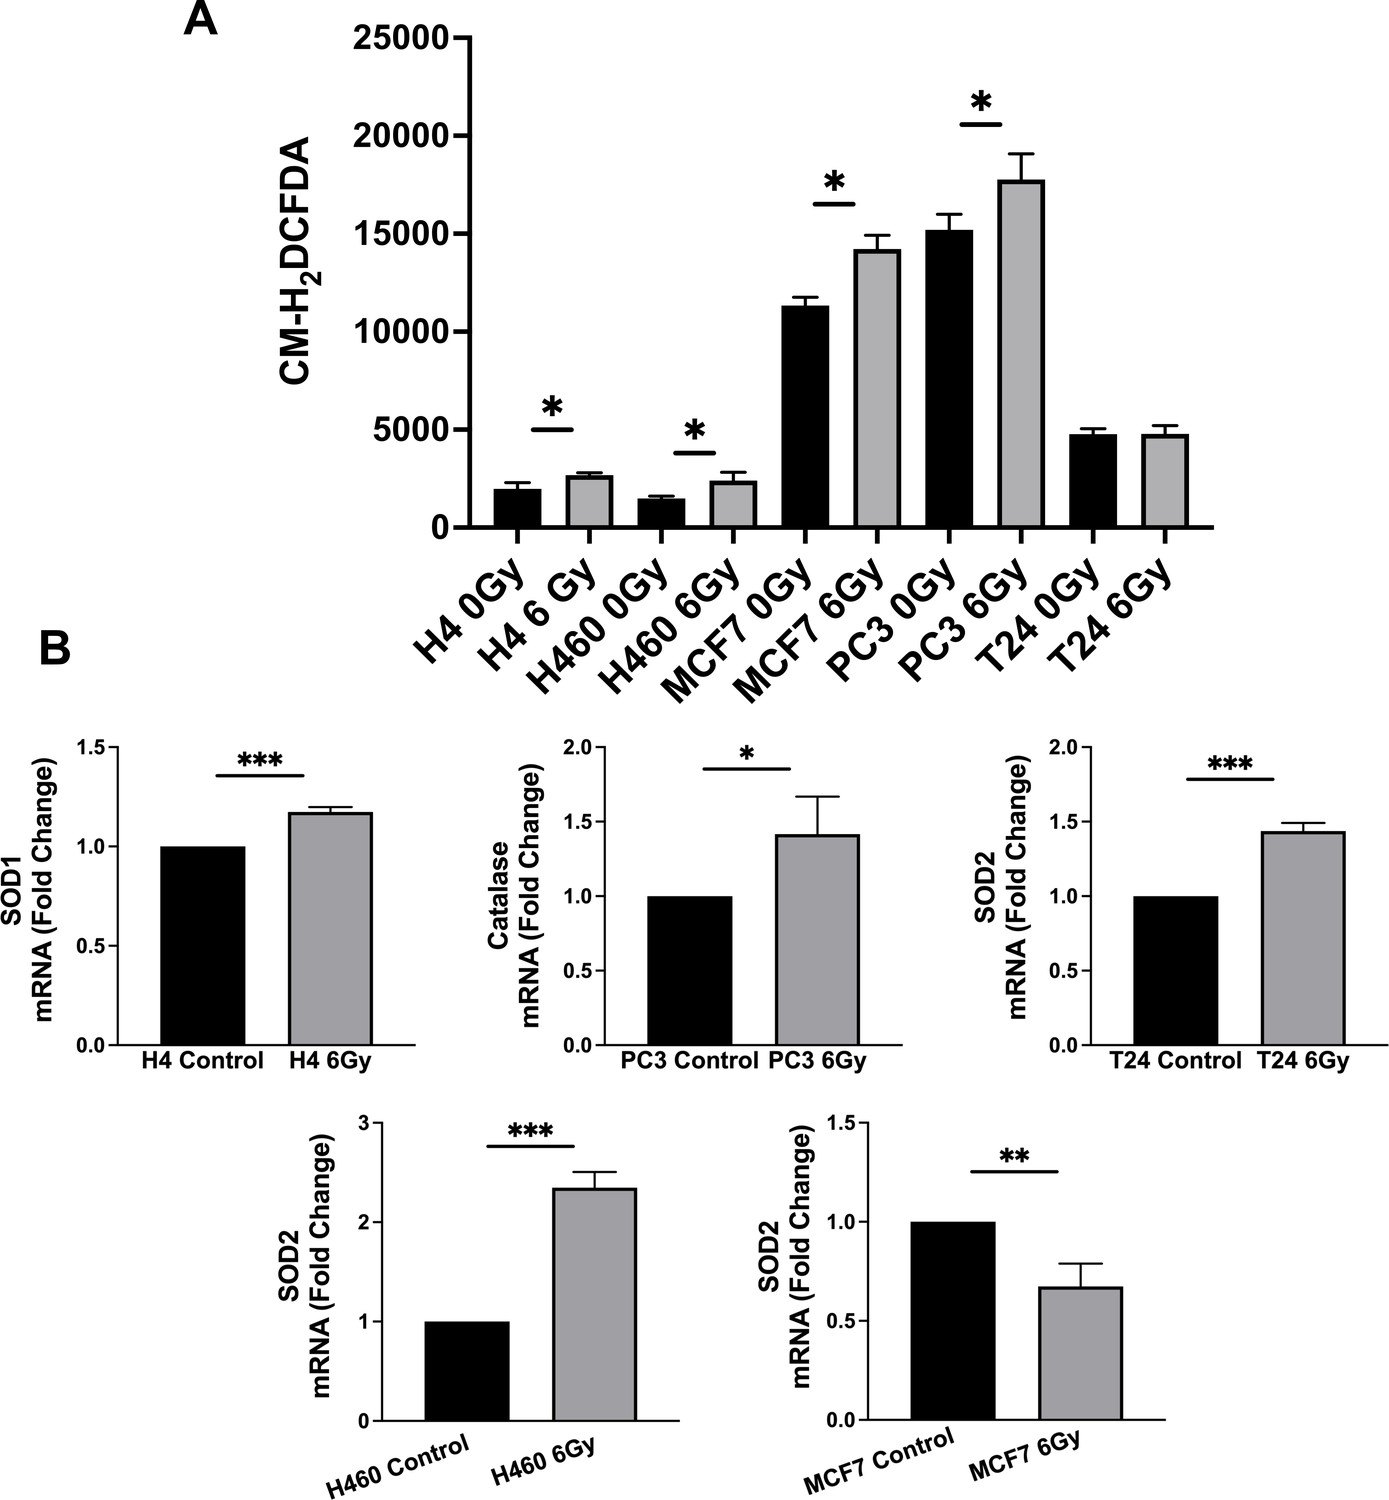
ROS evaluation in 6 Gy radioresistant cancer cells.
Figure 1—figure supplement 2
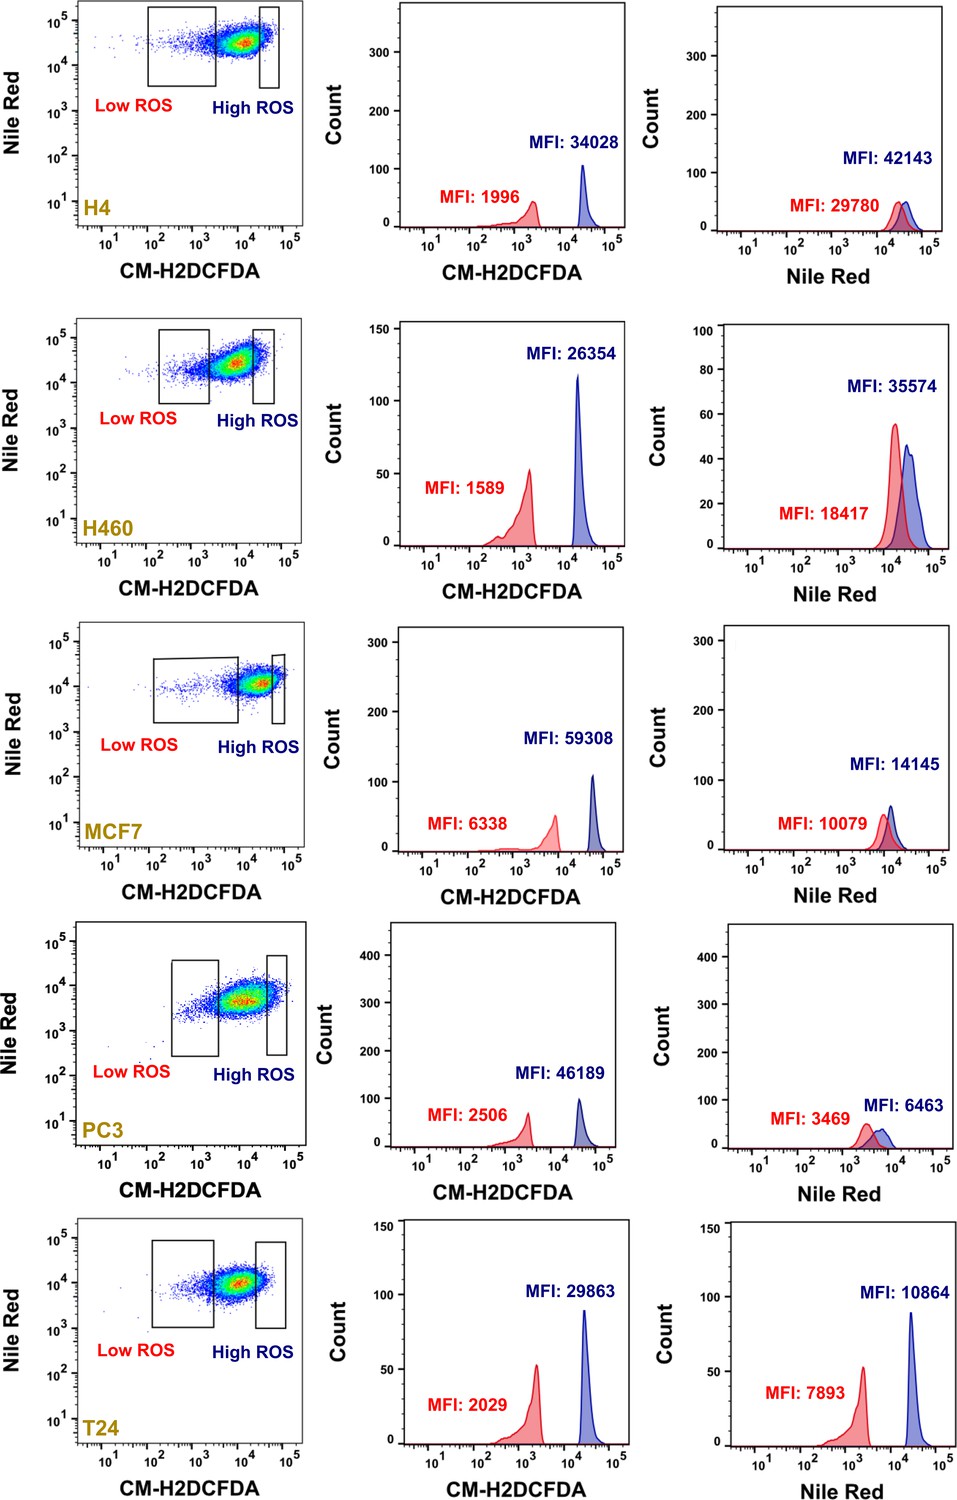
ROS and Lipid Droplet Double Staining in Different Cancer Cell Lines.
Figure 1—figure supplement 3
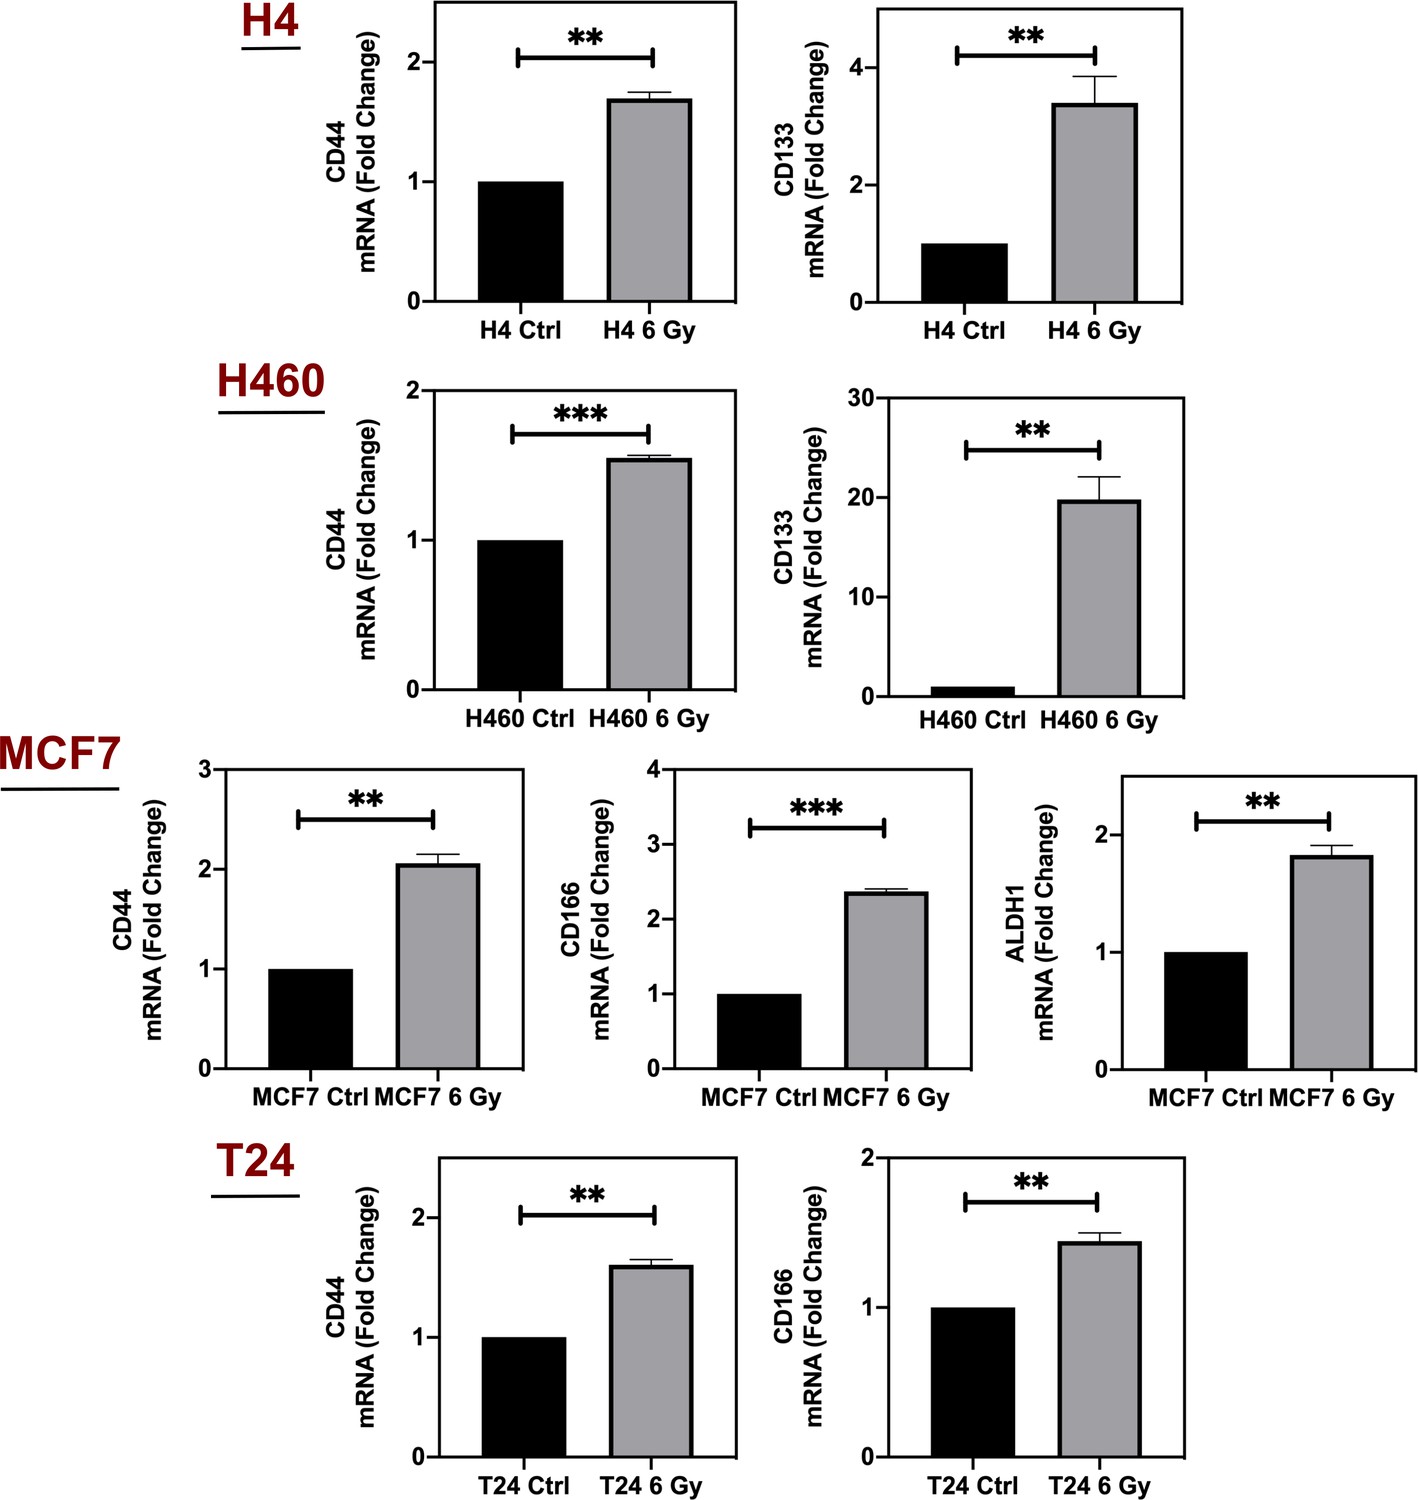
CSC Marker Evaluation in 6 Gy Radioresistant Cells.
Figure 2
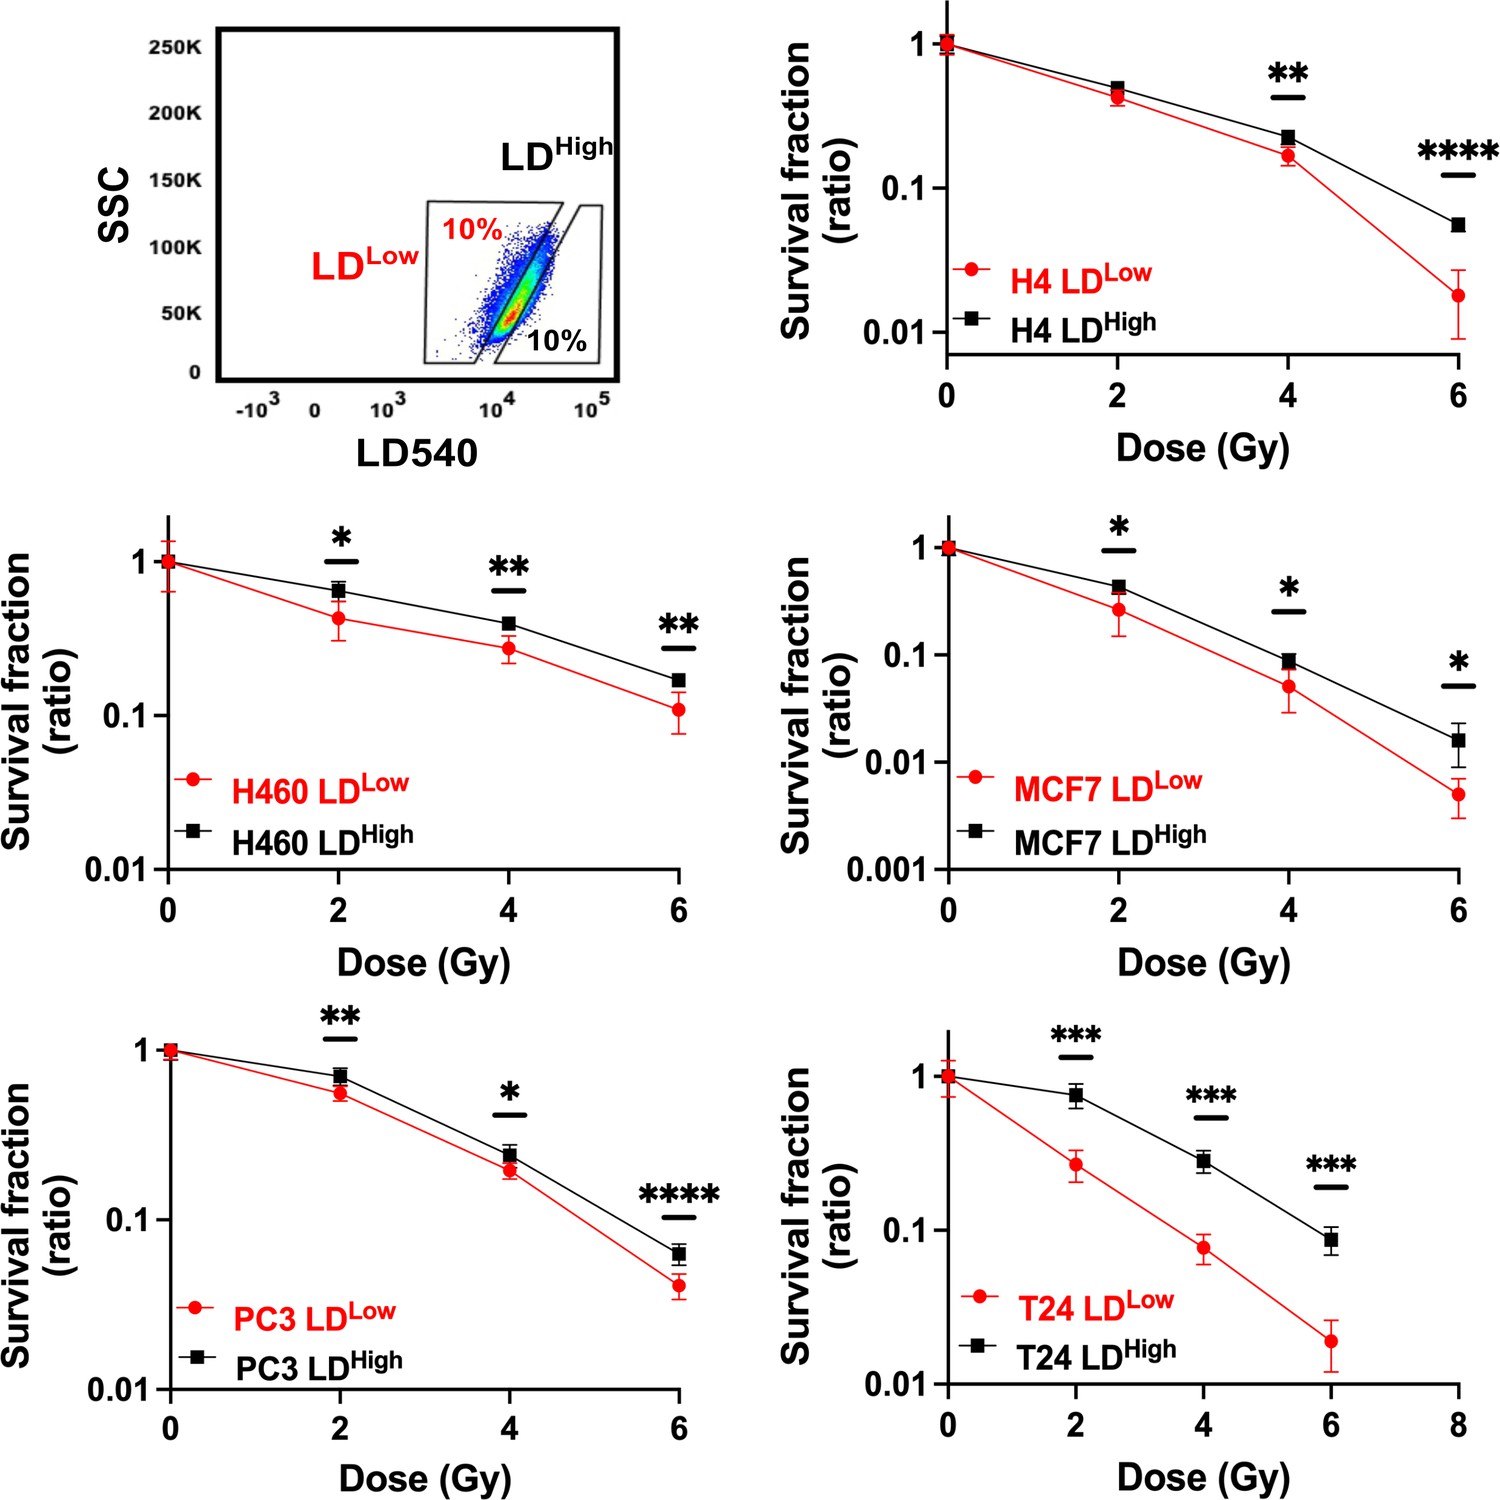
Cell survival curves for H4, H460, MCF7, PC3, and T24 cancer cell lines.
All cancer cell lines were stained with LD540 and then sorted in the 10% highest and lowest LD-containing cells (box up-left). For each cell line, the two LD sub-populations were irradiated at 2, 4, and 6 Gy X-ray and their survival fraction calculated. Survival fractions are reported in log-linear scale. Error bar represents the means ± SD from three independent experiments. *≤0.05; **≤0.01; ***≤0.001, and ****≤0.0001.
Figure 3 with 1 supplement
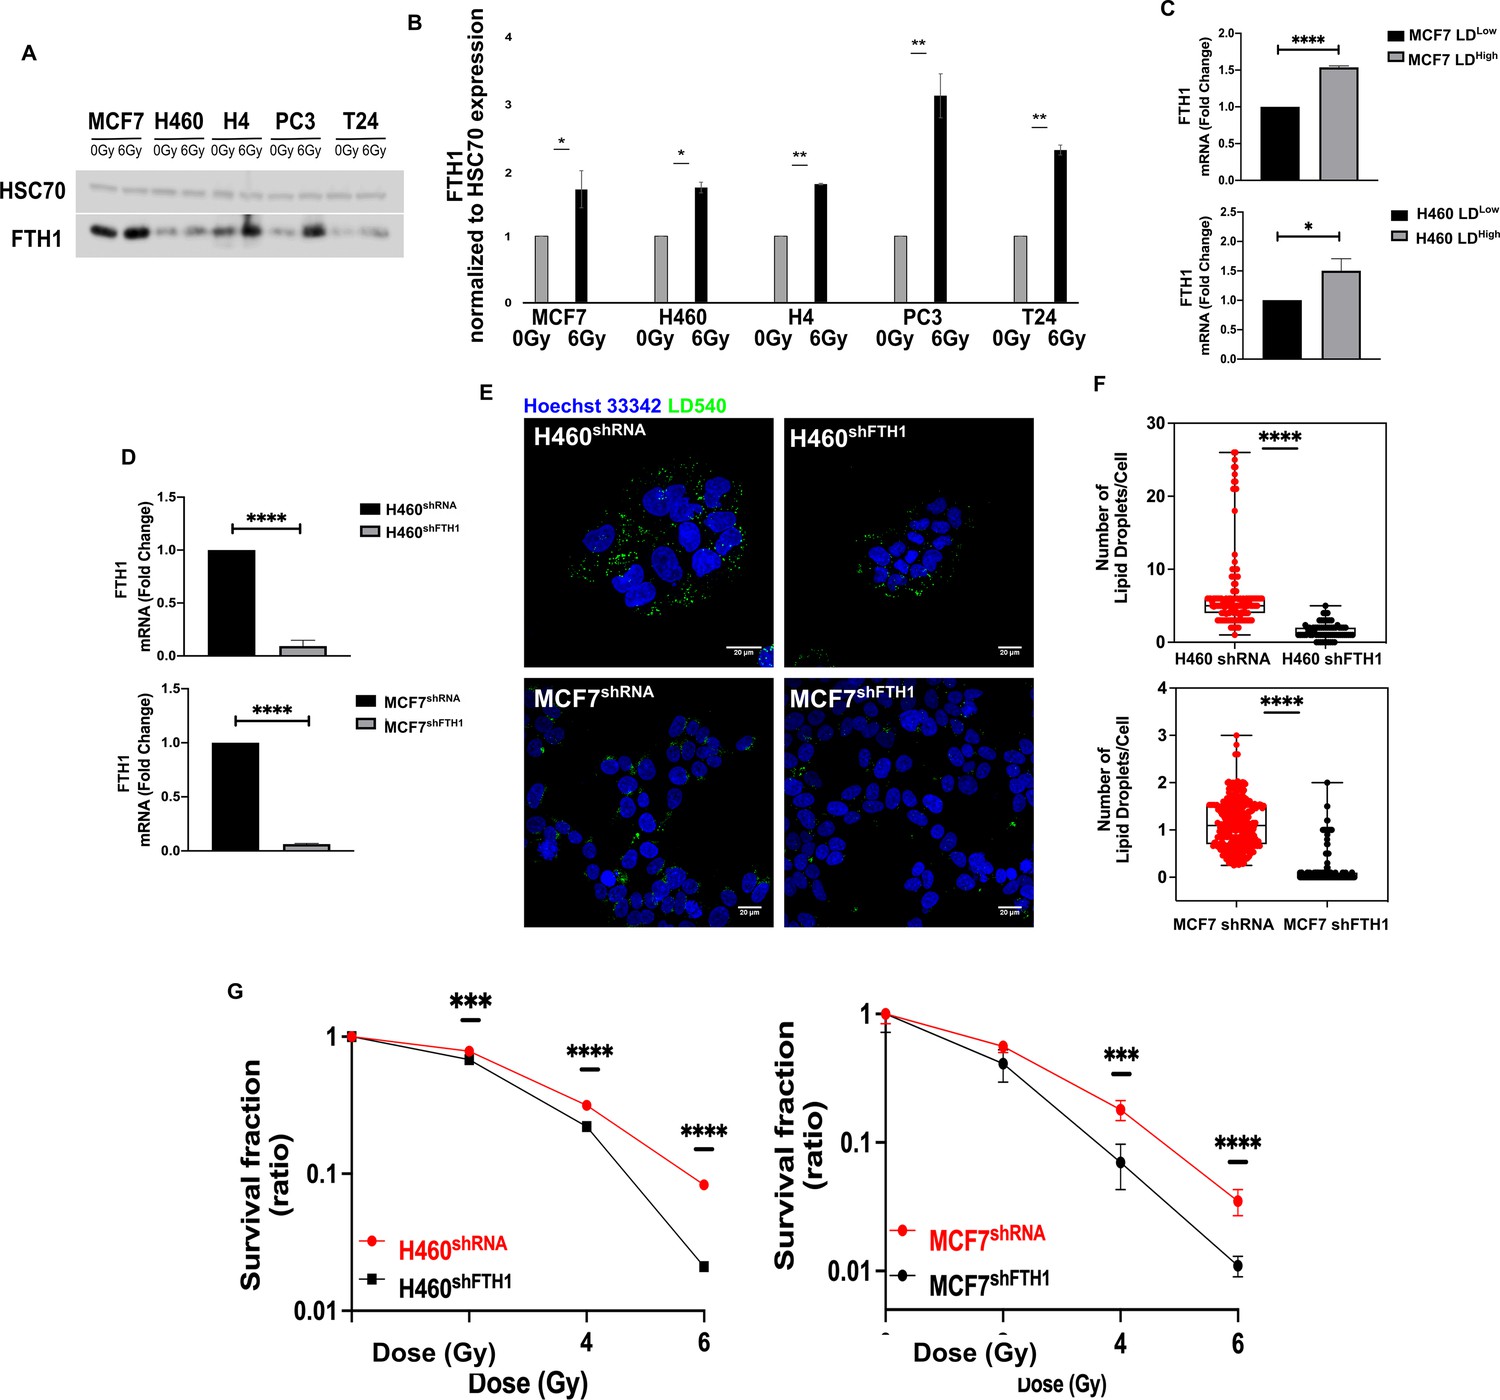
FTH1 silencing downregulates lipid droplets affecting cancer radioresistance.
(A, B) Wester blotting analysis and quantification of FTH1 expression in MCF7−, H460−, H4−, PC3−, T24- 0 Gy vs 6 Gy X-ray-treated cells. HSC70 was used as a loading control. (C) H460 and MCF7 were sorted in the 10% Highest (H460 LDHigh and MCF7 LDHigh) and Lowest (H460 LDLow and MCF7 LDLow) LD-containing cells and then FTH1 mRNA expression measured by qRT-PCR in all four sub-populations. Primer sequences are listed in Key resource table. (D) H460 and MCF7 were silenced for FTH1 by lentiviral-driven shRNA strategy. PCR results showed that in H460 shFTH1 and MCF shFTH1 there was a clear FTH1 mRNA reduction compared with their relative controls. (E, F) LD content was measured and quantified in H460 shFTH1 and MCF7 shFTH1 by confocal microscopy. LD540 staining revealed that the FTH1 gene silencing caused a LD decrease in both cell systems. (Scale bars 20 μM). (G) Cellular irradiation response in H460 and MCF7 silenced for FTH1 was investigated by radiobiological clonogenic assay and compared with H460 shRNA and MCF7 shRNA, respectively. Survival fraction (in log-linear scale) is reported in (G). Error bar represents the means ± SD from three independent experiments. *≤0.05; **≤0.01; ***≤0.001, and ****≤0.0001.
Figure 3—figure supplement 1
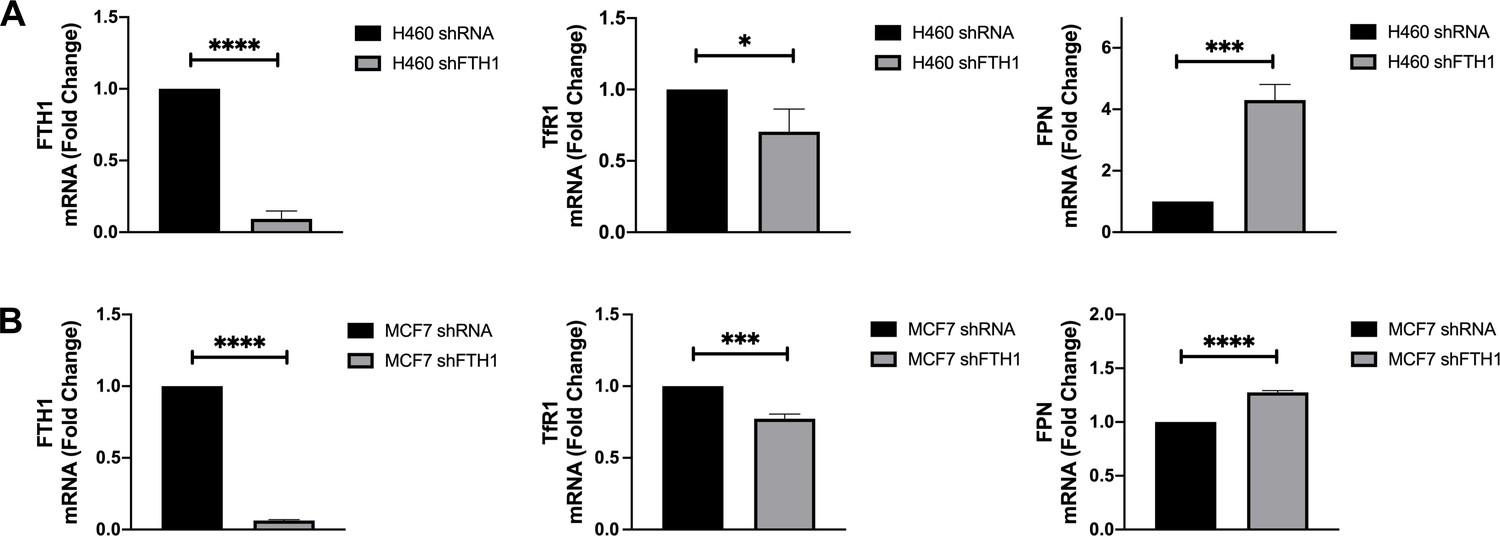
TfR1 downregulation and FPN upregulation in FTH1-silenced H460 and MCF7 cells.
Figure 4
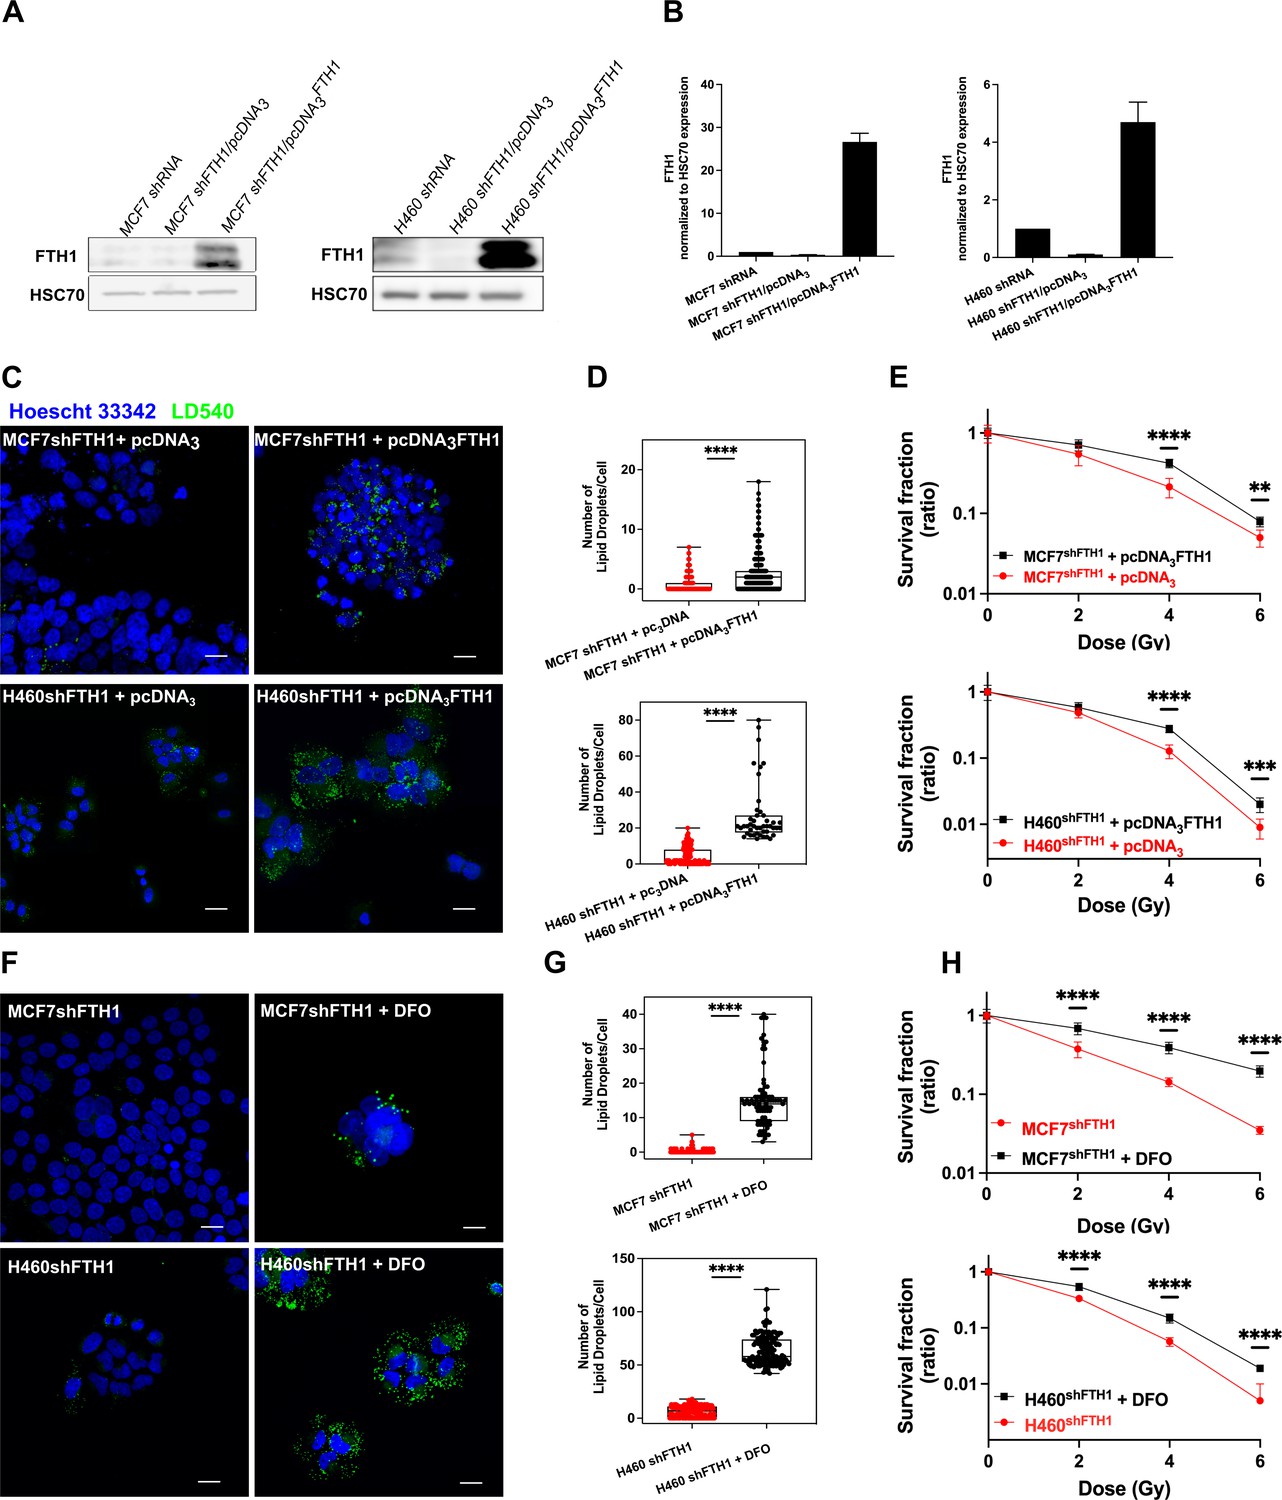
FTH1 reconstitution as well as DFO treatment restore the LD content re-establishing cancer radioresistance.
(A-B) Western Blotting analysis and quantification of FTH1 expression in MCF7 shFTH1/pcDNA3FTH1 and H460 shFTH1/pcDNA3FTH1. HSC70 was used as loading control. (C) Z-stack representative confocal fluorescence images of LD detection and quantification (D) in MCF7 shFTH1/pcDNA3FTH1 and H460 shFTH1/pcDNA3FTH1 cells and their H460 shFTH1/pcDNA3 and MCF7 shFTH1/pcDNA3 controls. (Scale bars 20 mM). (E) Survival fractions (in log-linear scale) after FTH1 reconstitution in MCF7- and H460- shFTH1 cells. (F) Z-stack representative confocal fluorescence images of LD detection and quantification (G) in MCF7 shFTH1 and H460 shFTH1 treated with DFO (Scale bar 20 mM). (H) Survival curves (in log-linear scale) of FTH1-silenced MCF7 and H460 cells after DFO treatment. F. Error bar represents the means ± SD from three independent experiments. *£ 0.05; **£ 0.01; ***£ 0.001 and ****£ 0.0001.
-
Figure 4—source data 1
Uncropped blots for Figure 4A.
- https://cdn.elifesciences.org/articles/72943/elife-72943-fig4-data1-v3.pptx
Figure 5 with 1 supplement

Schematic representation of a putative model at the basis of the cancer radioresistance (Created withBioRender.com).
Figure 5—figure supplement 1

Keplan-Meier curves showing the Survival Probability related to the PLIN1-5, FTH1, TFR1 and FPN gene expression.
Tables
Key resources table
| Reagent type (species) or resource | Designation | Source or reference | Identifiers | Additional information |
|---|---|---|---|---|
| Cell line (Homo sapiens) | MCF-7 | ATCC | Cat# HTB-22 RRID:CVCL_0031 | |
| Cell line (Homo sapiens) | H4 | ATCC | Cat# HTB-148 RRID:CVCL_1239 | |
| Cell line (Homo sapiens) | H460 | ATCC | Cat# HTB-177 RRID:CVCL_0459 | |
| Cell line (Homo sapiens) | T24 | ATCC | Cat# HTB-4 RRID:CVCL_0554 | |
| Cell line (Homo sapiens) | PC3 | ATCC | Cat# CRL-1435 RRID:CVCL_0035 | |
| Antibody | (Goat polyclonal) anti-human FTH1 | Santa Cruz Biotechnology | Cat# sc-14416 RRID:AB_2107172 | WB(1:200) |
| Antibody | (Goat polyclonal) anti-human HSC70 | Santa Cruz Biotechnology | Cat# sc-1059 RRID:AB_2120291 | WB (1:2000) |
| Antibody | (Goat polyclonal) anti-mouse IgG-HRP | Santa Cruz Biotechnology | Cat# sc-20550 RRID:AB_631738 | WB (1:2000) |
| Recombinant DNA reagent | pLKO.1 | Addgene (gift from F.S. Costanzo) Di Sanzo et al., 2011 | ||
| Recombinant DNA reagent | pcDNA3 | Addgene (gift from F.S. Costanzo) Aversa et al., 2017 | ||
| Chemical compound, drug | CM-H2DCFDA | Thermo Fisher Scientific | Cat# C6827 | |
| Chemical compound, drug | Nile Red | Thermo Fisher Scientific | Cat# N1142 | |
| Chemical compound, drug | Deferoxaminemesylate | Sigma-Aldrich | Cat# D9533 | |
| Chemical compound, drug | Puromycin dihydrochloride | Acros organics | Cat# BP2965 | |
| Chemical compound, drug | Power SYBR Green PCR Master mix | Thermo Fisher Scientific | Cat# 4367659 | |
| Chemical compound, drug | LD540 | Synthetised by Enamine | ||
| Commercial assay or kit | Pierce BCA Protein Assay Kit | Thermo Fisher Scientific | Cat# 23,225 | |
| Commercial assay or kit | High Pure isolation RNA kit | Roche | Cat# 11828665001 | |
| Commercial assay or kit | RT2 First strand Kit (50) | Qiagen | Cat# 330,404 | |
| Commercial assay or kit | Lipofectamine 3000 Transfection Reagent | Thermo Fisher Scientific | Cat# L3000075 | |
| Sequence-based reagent | Custom-made qPCR primers – GAPDH | Sigma-Aldrich | Forward – 5'-GCATCCTGGGCTACACTGAG-3' Reverse – 5'-AAAGTGGTCGTTGAGGGCA-3' | |
| Sequence-based reagent | Custom-made qPCR primers – FTH1 | Sigma-Aldrich | Forward – 5′-CATCAACCGCCAGATCAAC-3 Reverse –5′-GATGGCTTTCACCTGCTCAT-3′ | |
| Sequence-based reagent | Custom-made qPCR primers – TfR1 | Sigma-Aldrich | Forward – 5'-CTGGTAAACTGGTCCATGCT-3' Reverse – 5'-GTGATTTTCCCTGCTCTGAC-3' | |
| Sequence-based reagent | Custom-made qPCR primers – FPN | Sigma-Aldrich | Forward – 5'-GGTGTCTGTGTTTCTGGT-3' Reverse – 5'-GTCTAGCATTCTTGTCCAC-3' | |
| Sequence-based reagent | Custom-made qPCR primers – CD24 | Sigma-Aldrich | Forward – 5’-CCTGTCAGAGCTGTGTGGAC-3’ Reverse – 5’-GCTGGGTAGAGTGGTGTGT-3’ | |
| Sequence-based reagent | Custom-made qPCR primers – CD44 | Sigma-Aldrich | Forward – 5’-GGGTTCATAGAAGGGCACGT-3’ Reverse – 5’-GGGAGGTGTTGGATGTGAGG-3’ | |
| Sequence-based reagent | Custom-made qPCR primers – CD133 | Sigma-Aldrich | Forward – 5’-AAGCATTGGCATCTTCTATGG-3’ Reverse – 5‘-AGAGAGTTCGCAAGTCCTTG-3’ | |
| Sequence-based reagent | Custom-made qPCR primers – CD166 | Sigma-Aldrich | Forward – 5‘-CGATGAGGCAGACGAGATAAG-3’ Reverse – 5‘-TAGACGACACCAGCAACAAG-3’ | |
| Sequence-based reagent | Custom-made qPCR primers – ALDH1 | Sigma-Aldrich | Forward – 5’-AACTGGAATGTGGAGGAGGC-3’ Reverse – 5’-ATGATTTGCTGCACTGGTCC-3’ | |
| Sequence-based reagent | Custom-made qPCR primers – PLIN1 | Sigma-Aldrich | Forward – 5'-GACAAGGAAGAGTCAGCCCC-3' Reverse – 5'-GAGAGGGTGTTGGTCAGAGC-3' | |
| Sequence-based reagent | Custom-made qPCR primers – PLIN2 | Sigma-Aldrich | Forward – 5'-ACAGGGGTGATGGACAAGAC-3' Reverse – 5'-ATCATCCGACTCCCCAAGAC-3' | |
| Sequence-based reagent | Custom-made qPCR primers – PLIN3 | Sigma-Aldrich | Forward – 5'-CACCATGTTCCGGGACATTG-3' Reverse – 5'-GCACCTGGTCCTTCACATTG-3' | |
| Sequence-based reagent | Custom-made qPCR primers – PLIN4 | Sigma-Aldrich | Forward – 5’- GTTCCAGGACCACAGACA-3’ Reverse – 5’CCTACACTGAGCACATCC-3’ | |
| Sequence-based reagent | Custom-made qPCR primers – PLIN5 | Sigma-Aldrich | Forward – 5'-GATCACTTCCTGCCCATGAC-3' Reverse – 5'-GCTGTCTCCTCTGATCCTCC-3' | |
| Sequence-based reagent | Custom-made qPCR primers – SOD1 | Sigma-Aldrich | Forward – 5'-GCAGATGACTTGGGCAAAGG-3' Reverse – 5'-TGGGCGATCCCAATTACACC-3' | |
| Sequence-based reagent | Custom-made qPCR primers – SOD2 | Sigma-Aldrich | Forward – 5'-CTGGAACCTCACATCAACGC-3' Reverse – 5'-CCTGGTACTTCTCCTCGGTG-3' | |
| Sequence-based reagent | Custom-made qPCR primers – GPX1 | Sigma-Aldrich | Forward – 5’-CCCAAGCTCATCACCTGGTC-3’ Reverse – 5’-TGTCAATGGTCTGGAAGCGG-3’ | |
| Sequence-based reagent | Custom-made qPCR primers – Catalase | Sigma-Aldrich | Forward – 5'-CGTGCTGAATGAGGAACAG-3' Reverse – 5'-GACCGCTTTCTTCTGGATG-3' |
Additional files
-
Transparent reporting form
- https://cdn.elifesciences.org/articles/72943/elife-72943-transrepform1-v3.docx
-
Source data 1
- https://cdn.elifesciences.org/articles/72943/elife-72943-supp1-v3.zip
Download links
A two-part list of links to download the article, or parts of the article, in various formats.
Downloads (link to download the article as PDF)
Open citations (links to open the citations from this article in various online reference manager services)
Cite this article (links to download the citations from this article in formats compatible with various reference manager tools)
Lipid droplets and ferritin heavy chain: a devilish liaison in human cancer cell radioresistance
eLife 10:e72943.
https://doi.org/10.7554/eLife.72943


