Temporal derivative computation in the dorsal raphe network revealed by an experimentally driven augmented integrate-and-fire modeling framework
- Brain and Mind Research Institute, Centre for Neural Dynamics, Department of Cellular and Molecular Medicine, University of Ottawa, Canada
- Department of Physics, University of Ottawa, Canada
Figures
Figure 1 with 7 supplements
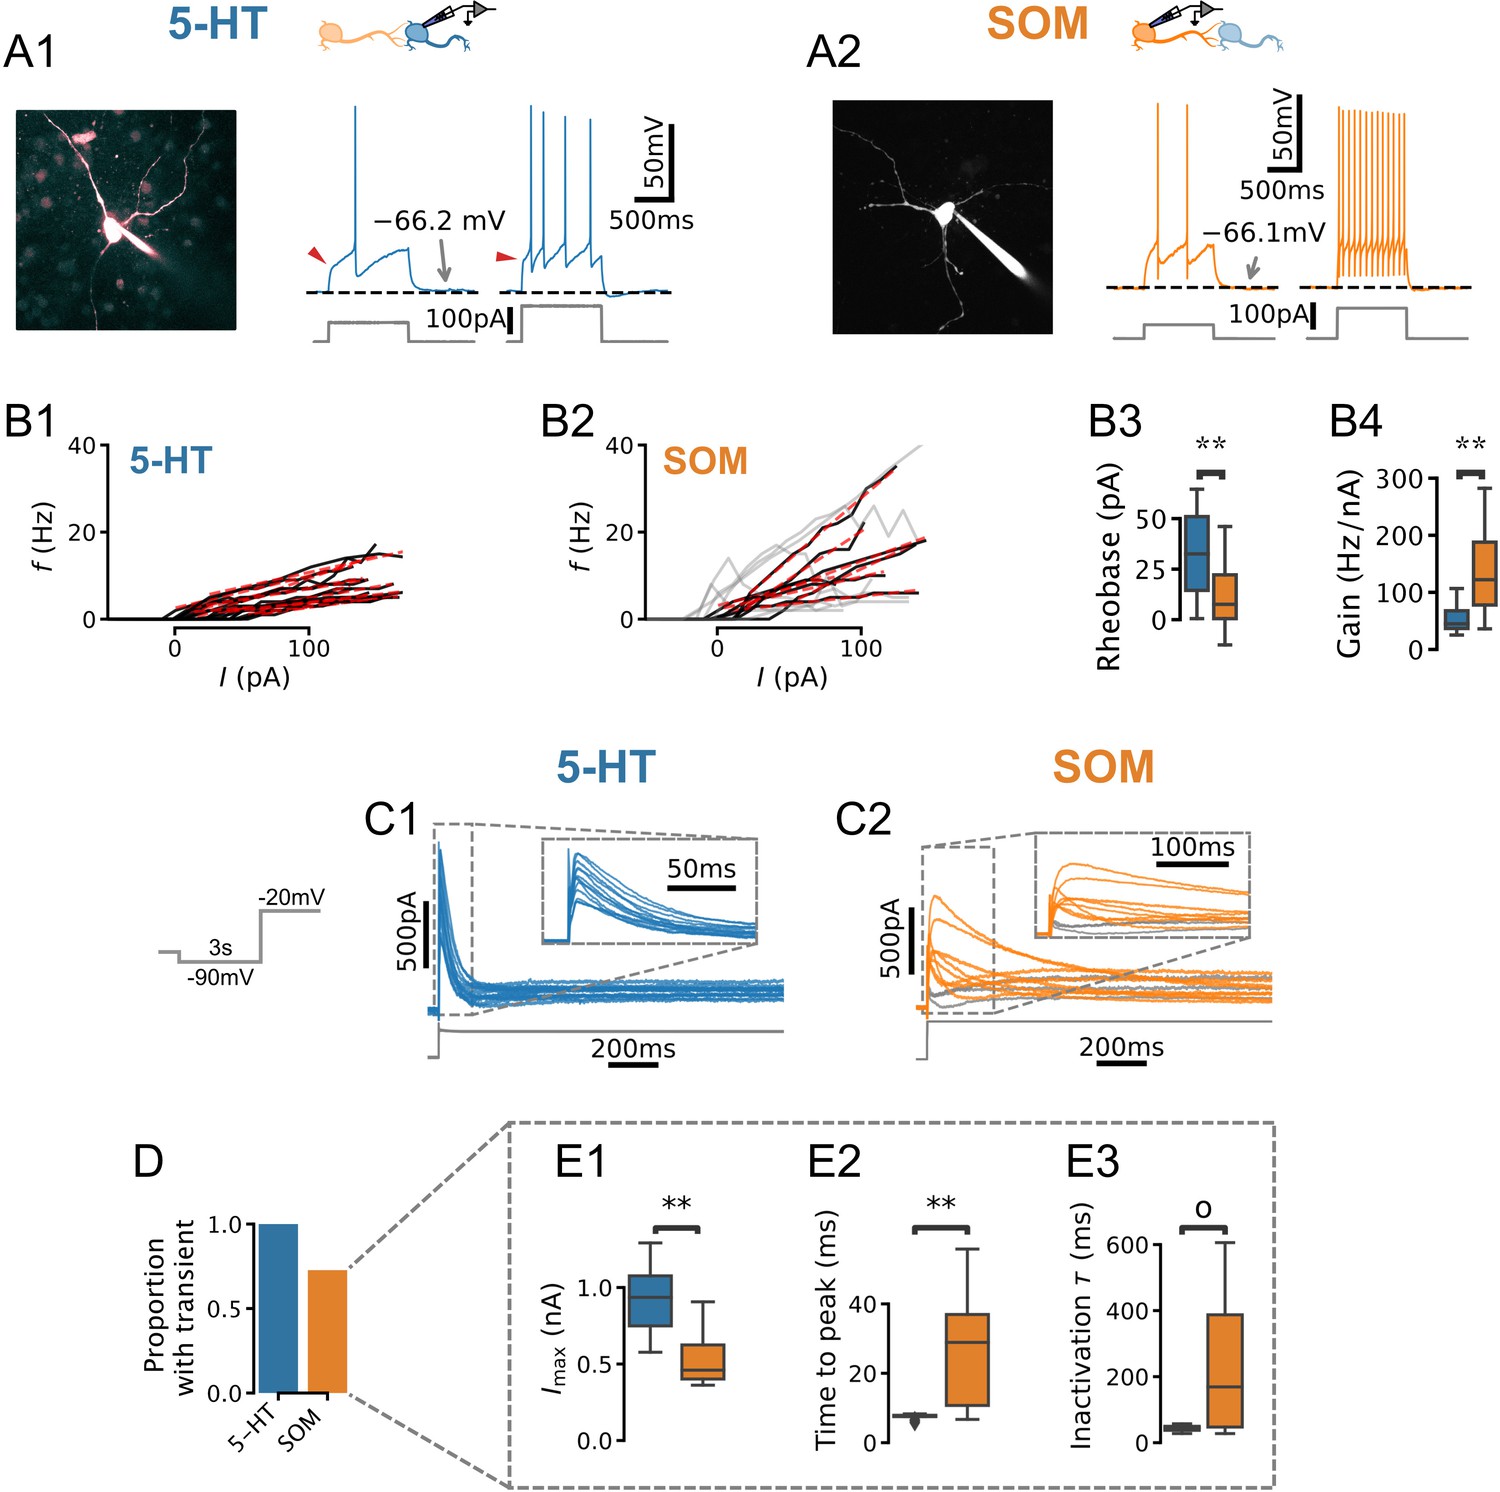
Physiology of dorsal raphe nucleus (DRN) neurons.
(A, B) Morphology, current steps (A), and spike frequency vs. input () curves (B) of genetically identified DRN neurons. Non-monotonically increasing curves (gray) and linear fits to monotonically increasing curves (red dashed) for serotonin (5-HT) (B1) and somatostatin (SOM) (B2) neurons. (B3) Rheobase of 33.8 ± 21.0 pA in 5-HT neurons vs. 11.3 ± 16.0 pA in SOM neurons. (B4) Gain of 52.2 ± 22.2 Hz/nA in 5-HT neurons vs. 87.2 ± 33.0 Hz/nA in SOM neurons with monotonically increasing curves. (C) Leak-subtracted whole-cell currents evoked by a depolarizing step. Each trace is one cell; 5-HT and SOM cells. Traces without a transient outward current are shown in gray. (D) Proportion of neurons with a transient outward current by cell type. (E) Quantification of transient outward currents in each cell type. SOM cells without a transient outward current were excluded from analysis, leaving 5-HT and SOM neurons. Annotations reflect Mann-Whitney U-tests. Non-parametric Brown-Forsythe equality of variance tests indicated significantly more variable time to peak (p=1.11e-4; E2) and inactivation time constant (p=1.97e-4; E3) in SOM cells.
Figure 1—figure supplement 1
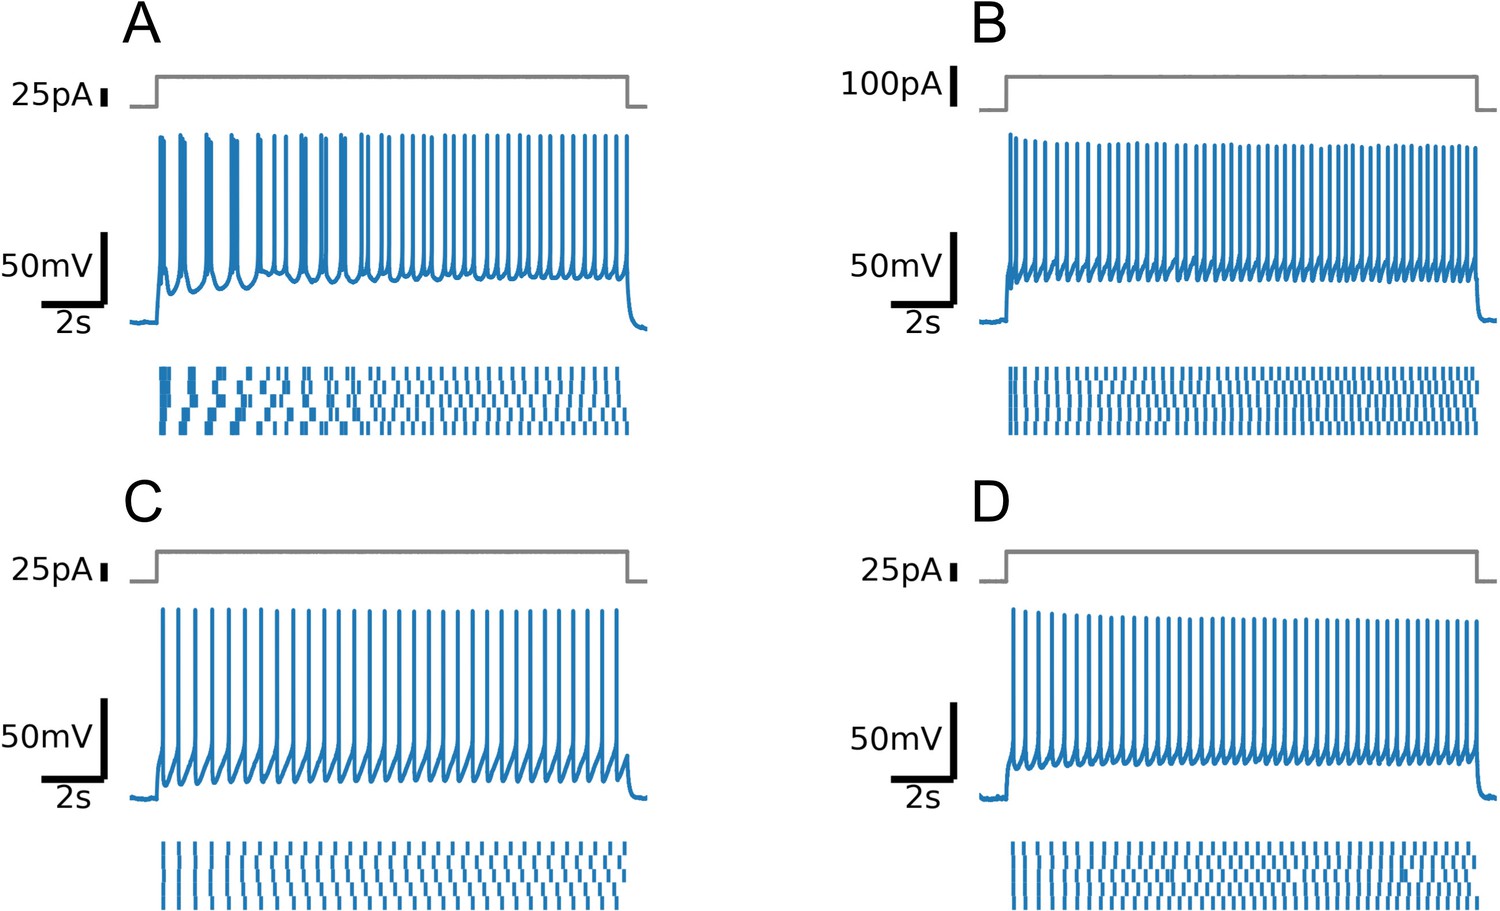
Firing patterns of four positively identified serotonin (5-HT) neurons (A-D).
Note intermittent bursting in the first cell (A).
Figure 1—figure supplement 2
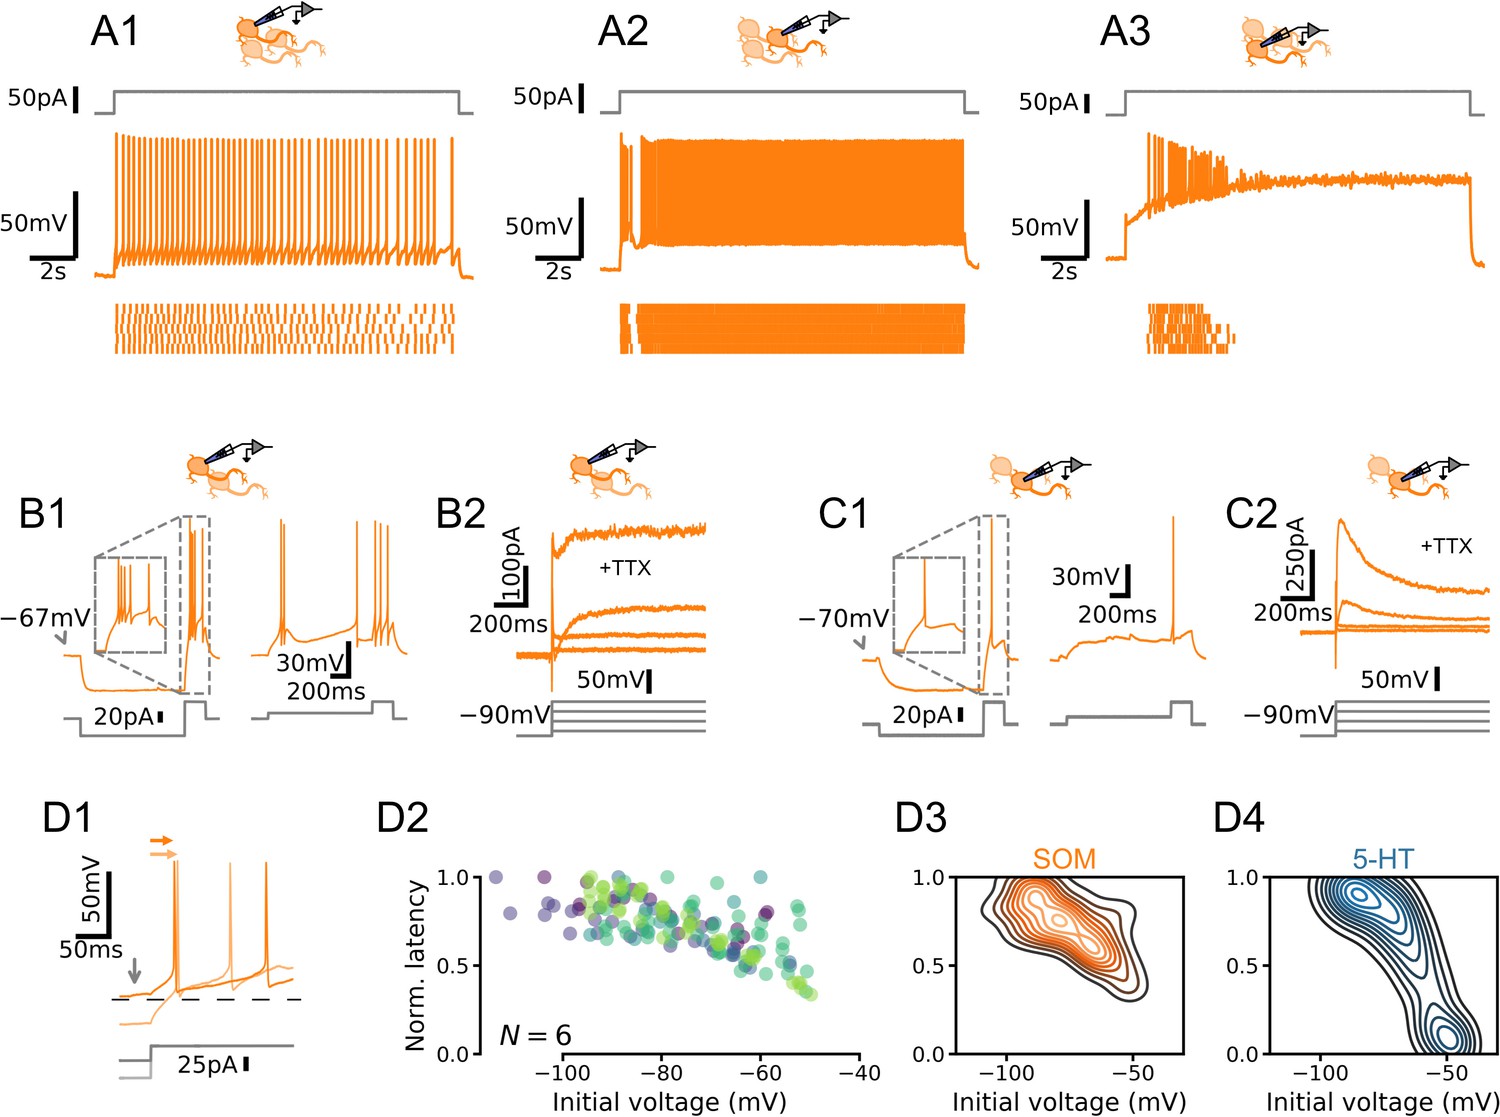
Dorsal raphe nucleus (DRN) somatostatin (SOM) neurons are not homogenous.
(A) Qualitatively different firing patterns in three SOM neurons. (B) A burst-firing (B1) SOM neuron with a transient depolarizing current (B2). (C) A SOM neuron that does not fire bursts (C1) with a pronounced hyperpolarizing current (C2). (D) Heterogenous relationships between voltage history and spike timing across cells. Experiment is the same as in Figure 2. (D1) Representative experiment. Arrows indicate spike latency and initial voltage. (D2) Normalized spike latency for N = 6 SOM neurons. (D3) Gaussian kernel density estimate of data shown in D2. (D4) Gaussian kernel density estimate of data shown in Figure 2F for comparison.
Figure 1—figure supplement 3
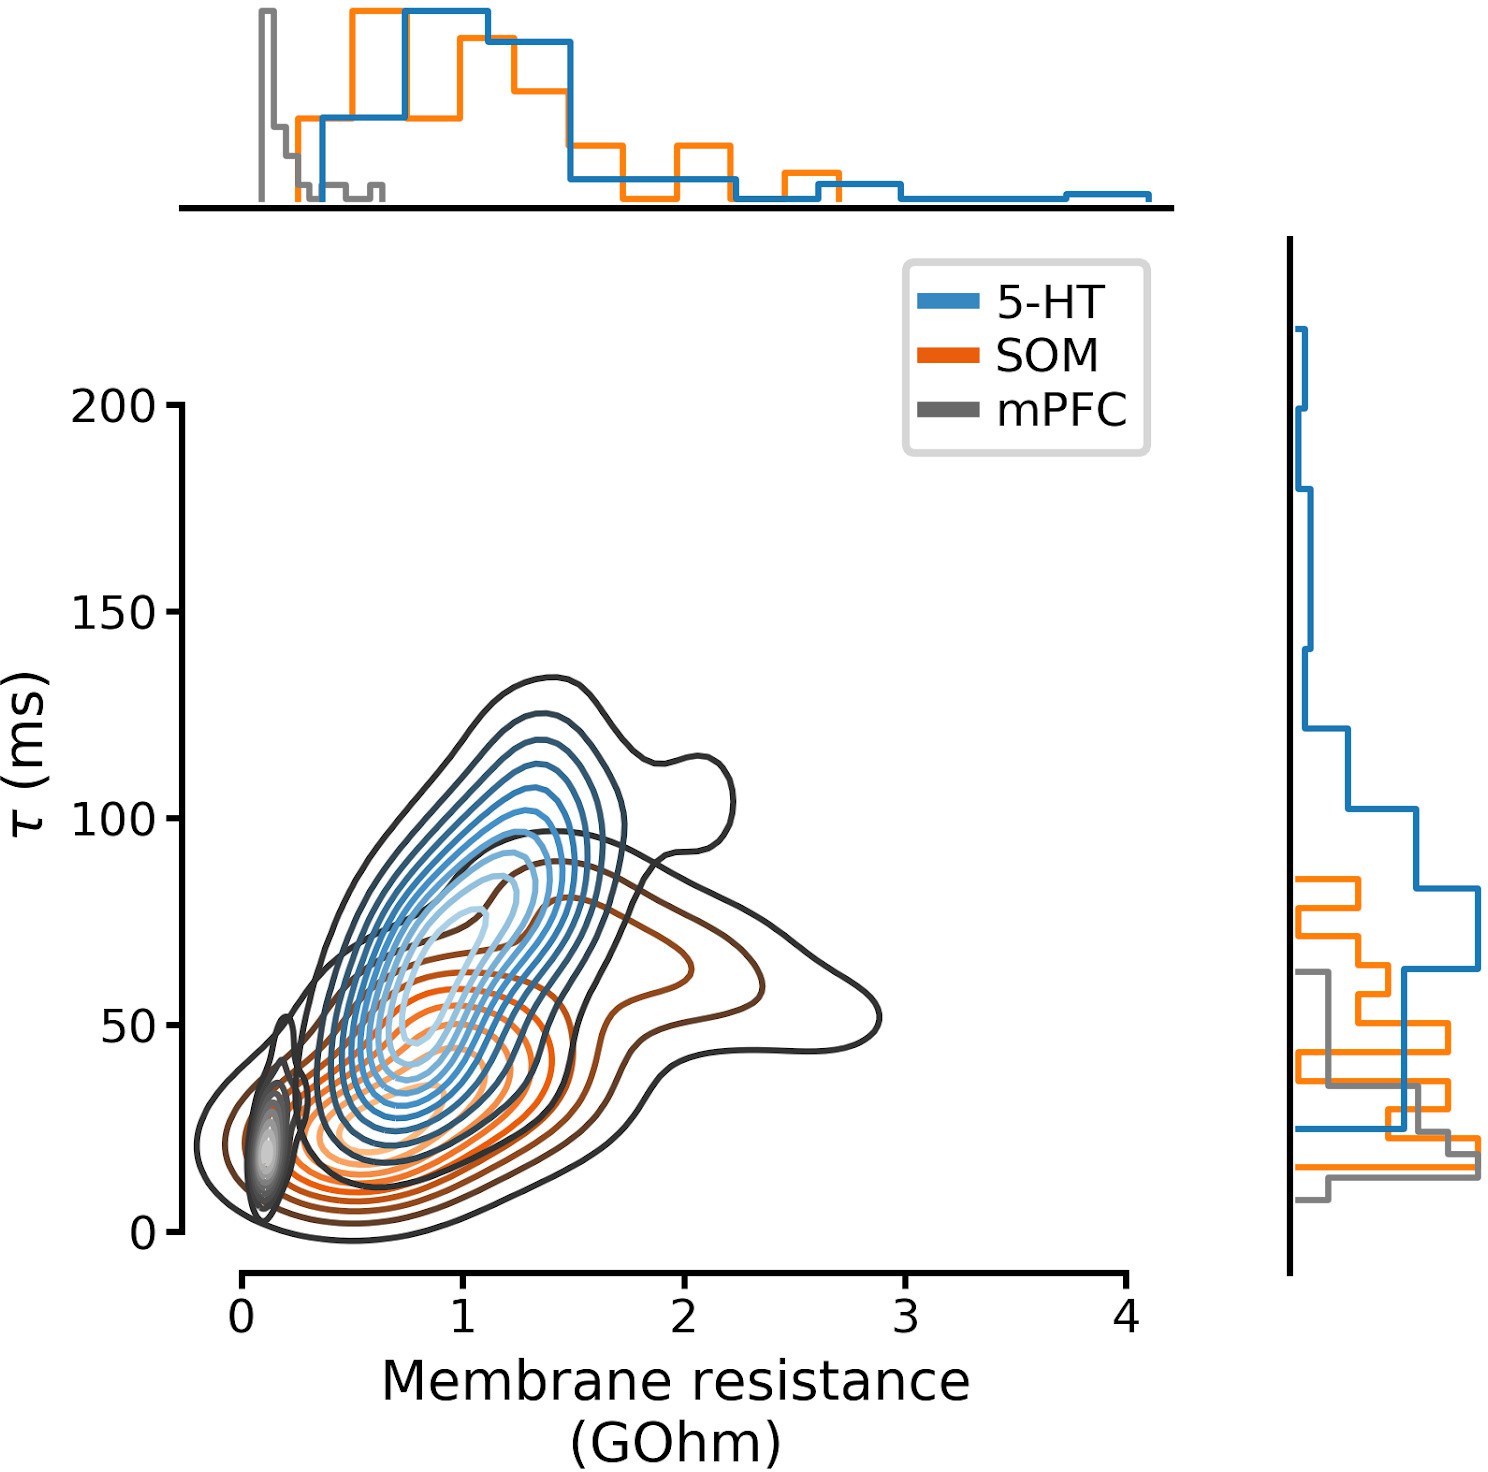
Full distributions of membrane parameters listed in Table 1.
Curves on the main set of axes are Gaussian kernel density estimates. N=96 serotonin neurons, N=28 SOM neurons, and N=25 mpFC neurons. 5-HT, serotonin; SOM, somatostatin; mPFC, medial prefrontal cortex.
Figure 1—figure supplement 4
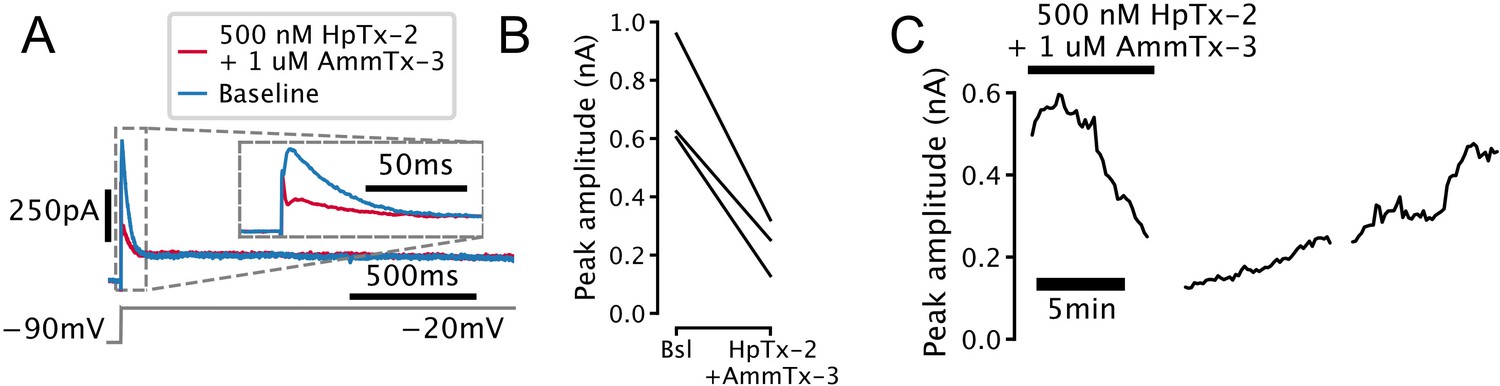
Transient outward current found in serotonin (5-HT) cells (IA) is sensitive to potassium channel blockers.
(A) Representative voltage-clamp trace showing attenuation of transient outward current in a 5-HT neuron by the selective Kv4-channel blockers heteropodatoxin-2 (HpTx-2) and AmmTx-3. Currents are leak-subtracted. (B) Attenuation of transient outward current in N = 3 5-HT neurons. (C) Time-course of attenuation of transient outward current in a representative 5-HT neuron.
Figure 1—figure supplement 5
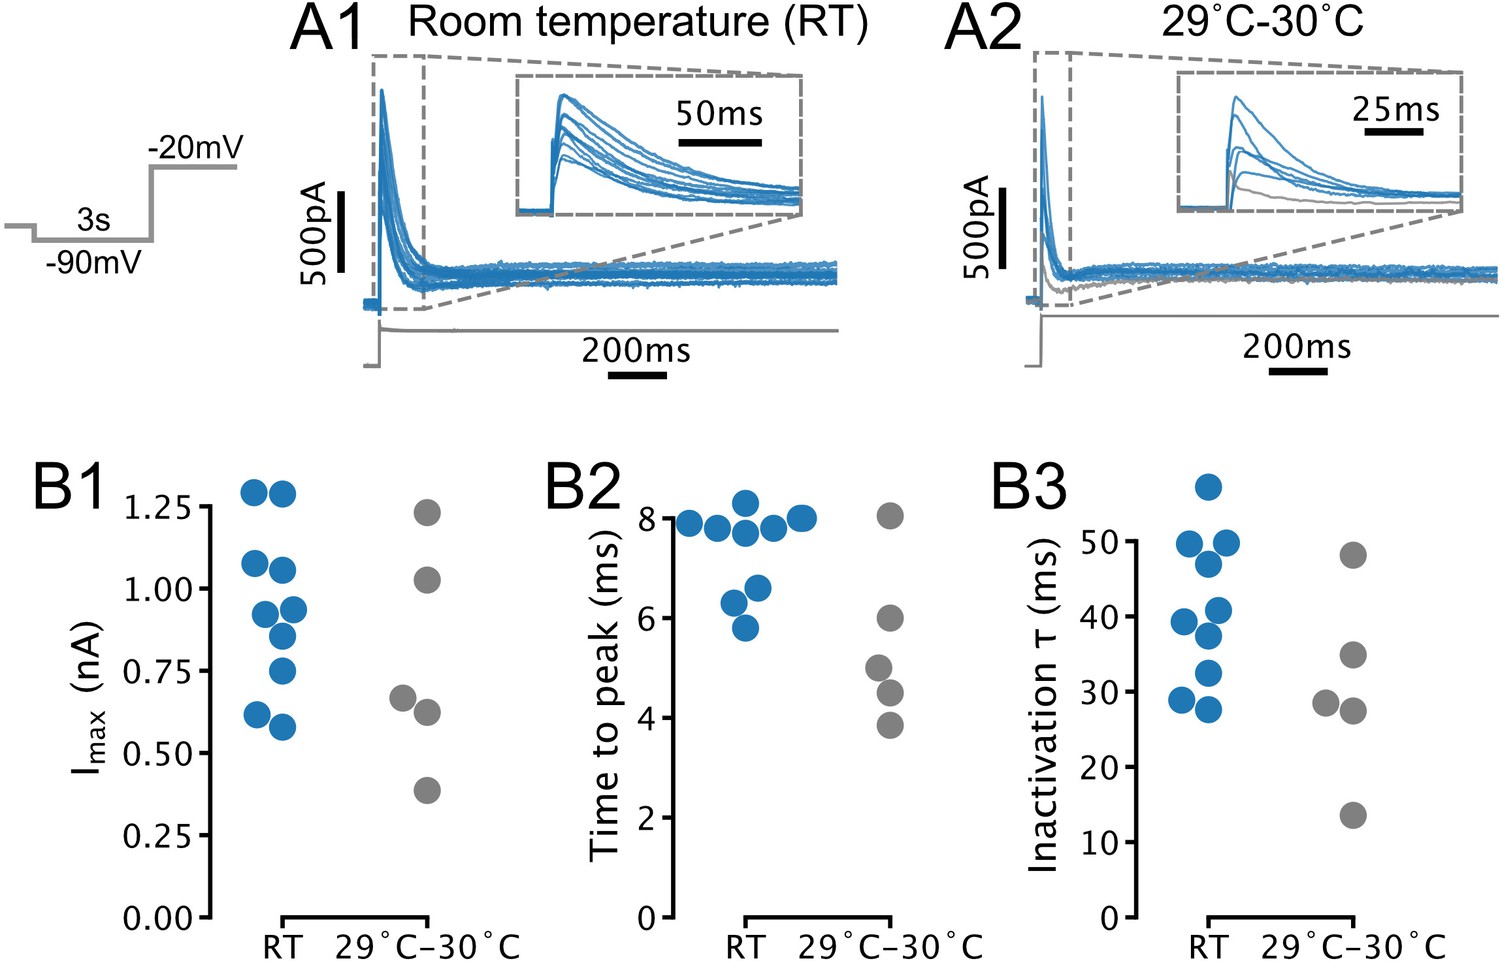
Temperature-dependence of IA amplitude and kinetics in serotonin (5-HT) neurons.
(A) Transient currents evoked by depolarizing steps in 5-HT neurons recorded at room temperature (RT; N = 10) and 29–30°C (N = 5). Each trace is from one neuron. Traces in A1 are also presented in Figure 1C1. Gray trace in A2 was excluded from further analysis due to lack of a clearly defined transient current (based on same criteria as in Figure 1D). (B) Comparison of amplitude and kinetic parameters extracted from traces in A. Each point is one neuron. RT (blue) data are also presented in Figure 1D. Recordings with access resistance >20 MOhm were excluded (included RT recordings had access resistance of 12.1 MOhm ± 4.0 MOhm, 29–30°C recordings had access resistance of 13.2 MOhm ± 5.2 MOhm; mean ± SD).
Figure 1—figure supplement 6
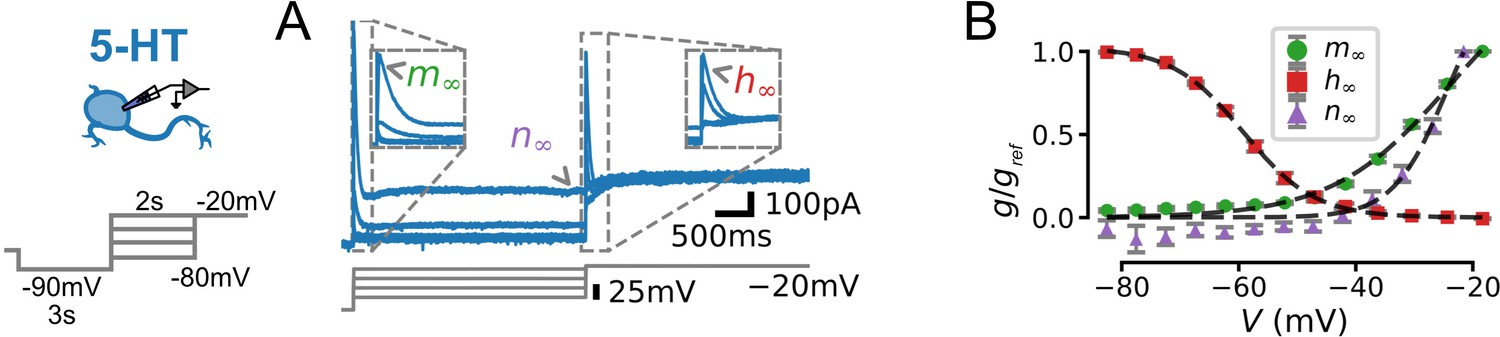
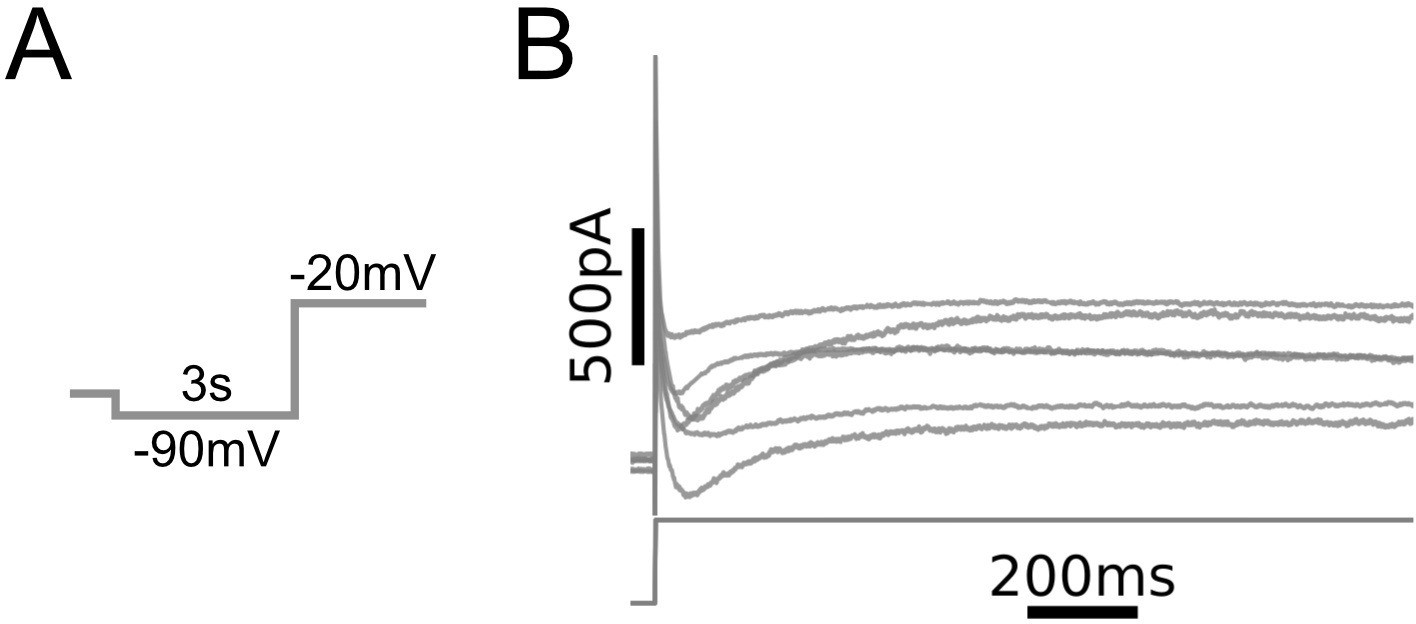
Characterization of voltage-dependence of IA in serotonin (5-HT) neurons.
(A) Experimental protocol. Voltage command designed to reveal voltage-dependent activation and inactivation of IA (left) and representative leak-subtracted and capacitance-corrected current trace (blue, top right) aligned to voltage command (gray, bottom right). Parts of the voltage trace used to fit the activation (), inactivation (), and non-inactivating () gates (see Methods) are indicated. (B) Gating curves extracted from N = 13 neurons. is the maximal conductance observed for each cell (i.e. the conductance at V = –20 mV for and , and at –80 mV for ). Dashed lines indicate Boltzmann functions with parameters given in Table 2.
Figure 1—figure supplement 7
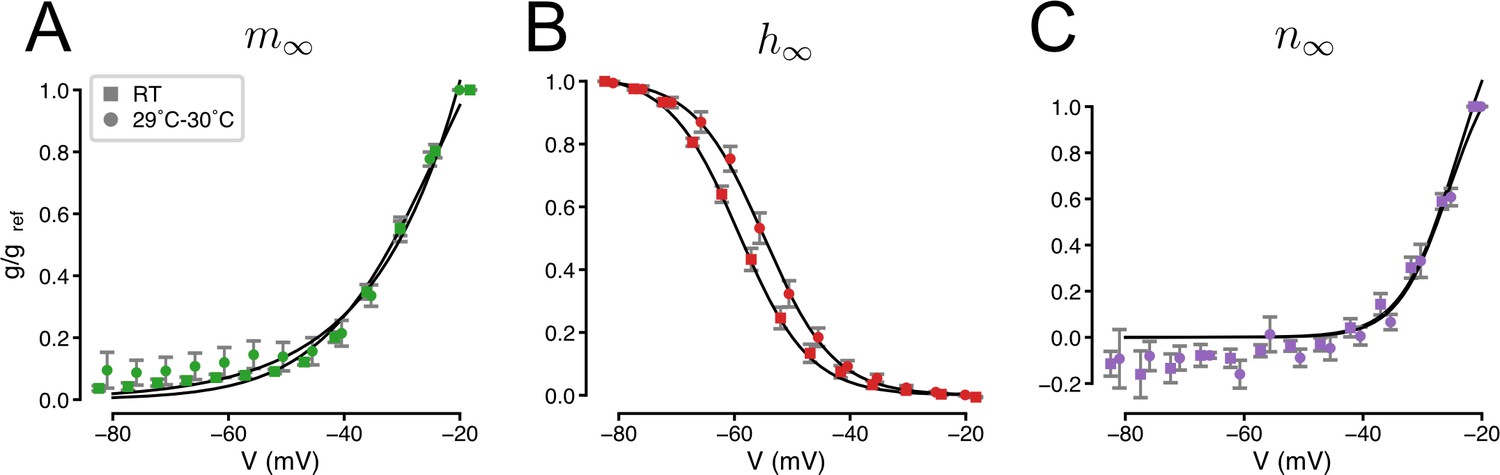
Temperature-dependence of the gating of IA.
Squares indicate data collected at room temperature (RT) reproduced from Figure 2—figure supplement 1. Circles indicate recordings at 29–30°C (N = 13 5-HT neurons). Solid lines indicate Boltzmann functions. Activation (A), inactivation (B), and non-inactivating (C) gates (see Methods and Figure 1—figure supplement 6).
Figure 2 with 1 supplement
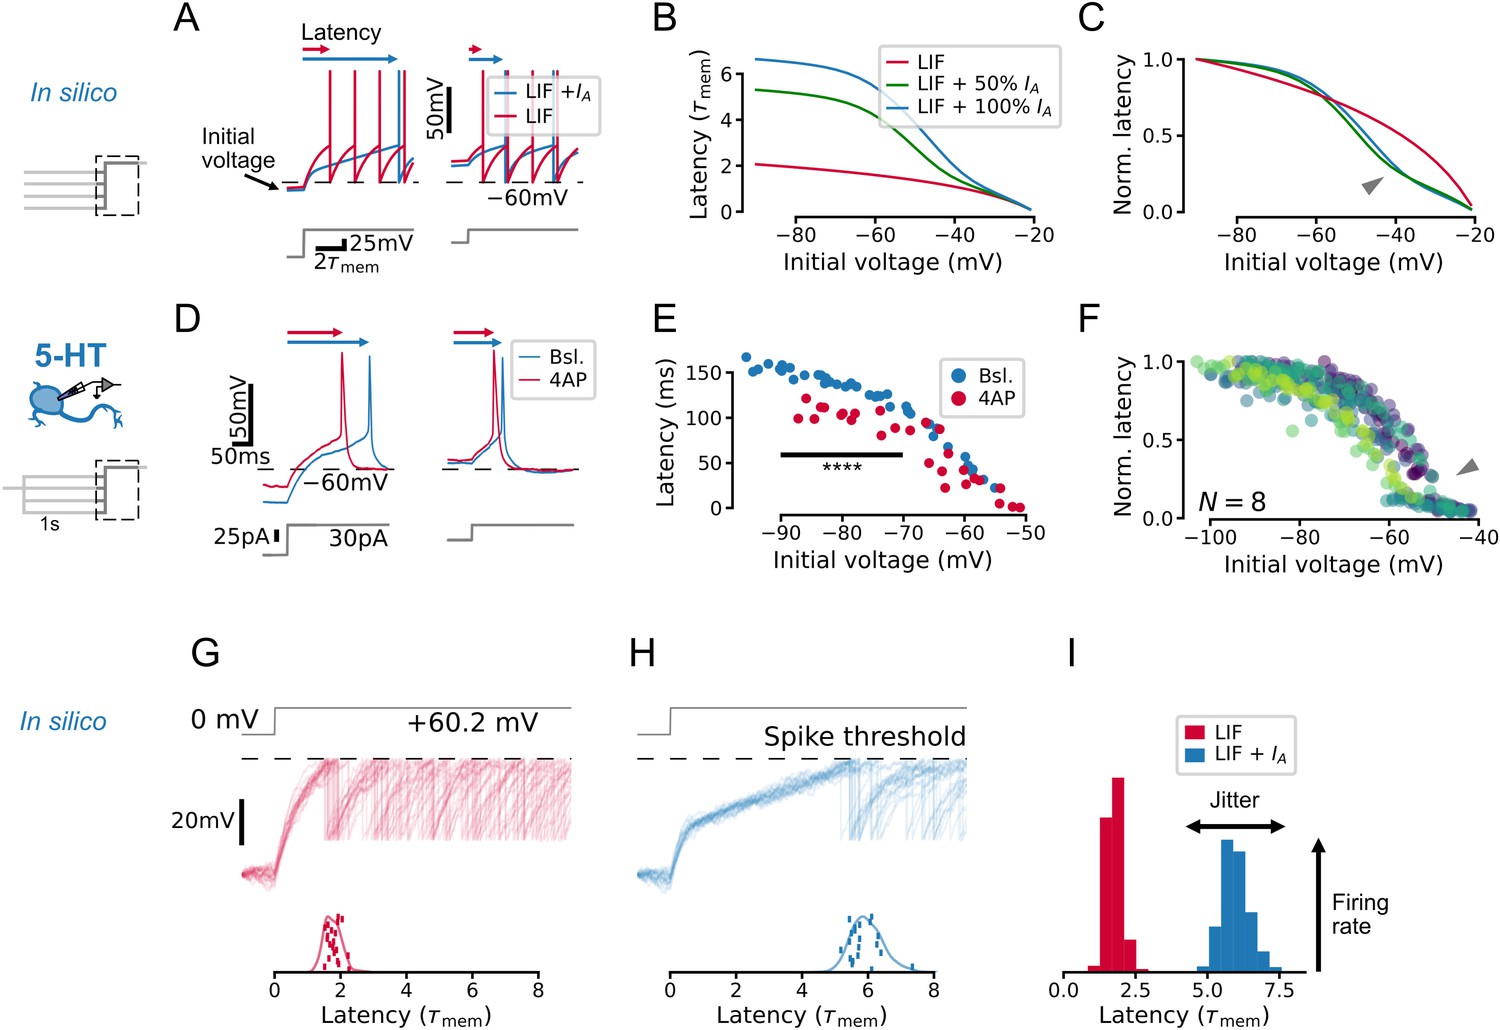
IA qualitatively alters the relationship between initial voltage and spike timing.
(A–C) A toy leaky integrate-and-fire (LIF) model neuron with IA predicts a non-linear effect of voltage history on spike timing in a simple experiment. (D–F) Experiments in serotonin (5-HT) neurons fulfill predictions of the toy model. (F) Latency curves for 5-HT neurons, normalized to the maximum latency for each cell. Each color is one cell. (G–I) IA causes an increase in spike latency and jitter in the presence of noise. Models and input are the same as in A–C. Spike latency histograms for populations of 600 toy neurons are shown in I. The width of the histogram reflects jitter in the timing of the first spike, while the height of the histogram approximates the peak instantaneous firing rate. Note that as jitter increases, the height of the histogram decreases. The toy model with 100% IA has an effective IA conductance and effective inactivation time constant .
Figure 2—figure supplement 1
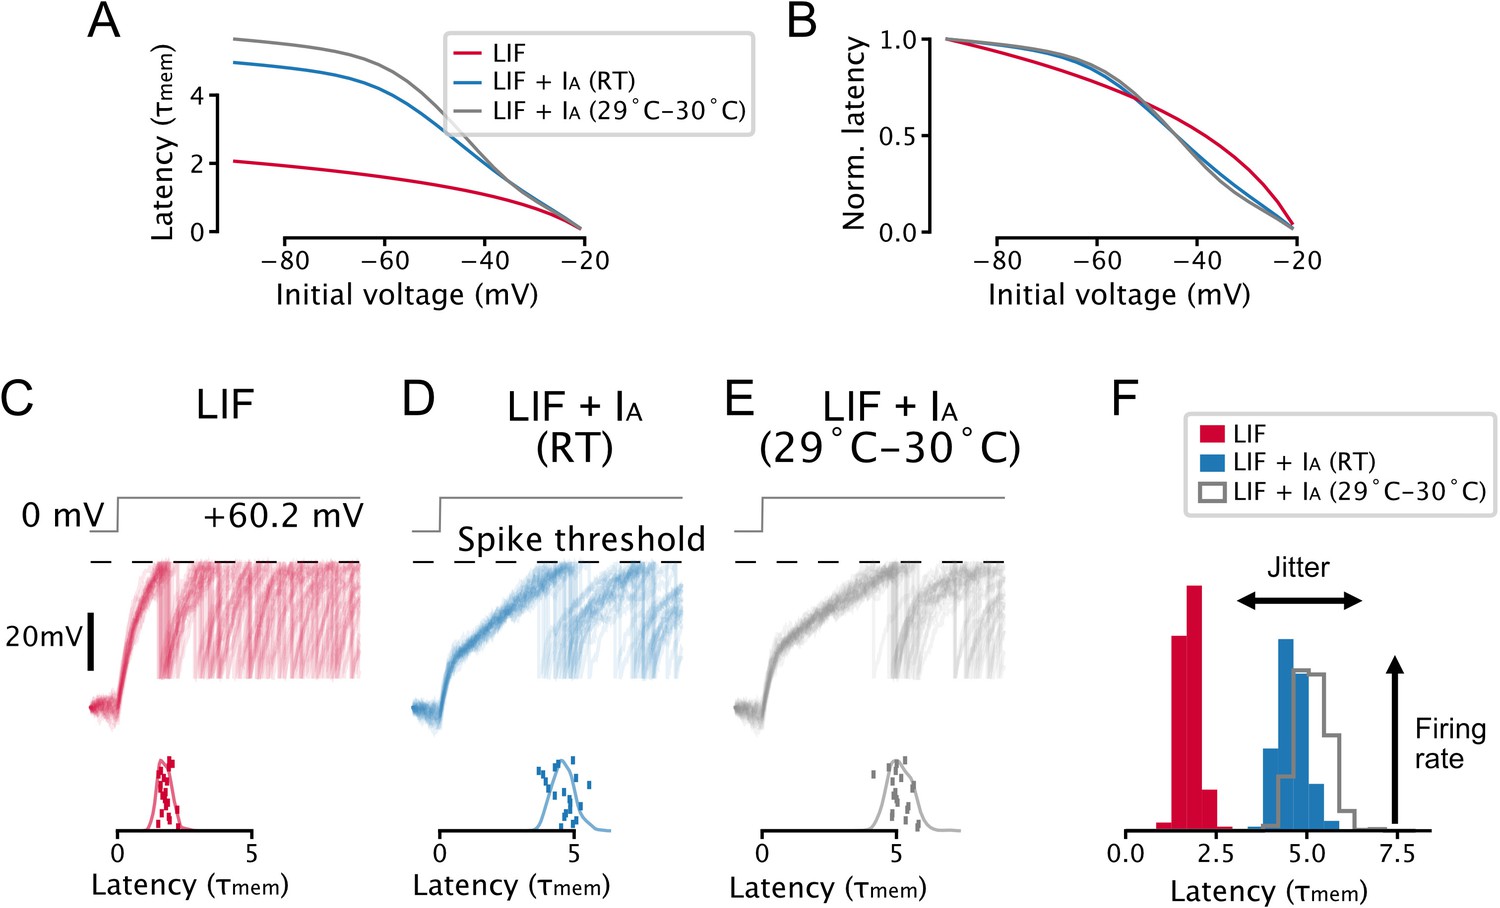
Parameter and temperature-dependence of the effect of IA on spike-timing.
(A, B) A toy leaky integrate-and-fire (LIF) model neuron with IA predicts a non-linear relationship between voltage-history and latency to the first spike evoked by a step input. Setup is the same as in Figure 2A–C. (C–F) IA causes an increase in spike latency and jitter in the presence of noise. Models are the same as in A and B, setup is the same as in Figure 2G–I. Effective IA conductance and inactivation time constants were chosen to match experimentally determined values for 5-HT neurons: the toy model with IA at room temperature (RT) has an effective IA conductance and effective inactivation time constant , the toy model with IA at 29–30°C has an effective IA conductance and effective inactivation time constant . Gating parameters are taken from Figure 1—figure supplement 7.
Figure 3 with 3 supplements

Single neuron models accurately predict the subthreshold voltage and spike times of dorsal raphe nucleus neurons.
(A) Components of candidate single neuron models: intensity of stochastic spike-generating process; spike-triggered current (positive values indicate a hyperpolarizing current); spike-triggered threshold movement. (B) Generalized integrate-and-fire (GIF) model extensions. (C) Representative experiment used to train and validate neuron models. Training set consists of repetitions of 60 s of frozen Ornstein-Uhlenbeck (OU) noise, and the validation set consists of repetitions of a different frozen OU noise stimulus lasting 10 s (only one repetition is shown). (D) Representative validation data and model predictions for each cell type. OU noise input current (top), recorded and predicted voltage traces (middle), and recorded and predicted spike times across all repetitions of the validation stimulus. Stimulus parameters were adjusted for each cell type, see Figure 3—figure supplement 1. (E–G) Quantification of model performance in terms of on the training subthreshold voltage derivative and on the validation spike-train similarity metric . GIF and inactivation GIF (iGIF) models have the same subthreshold performance because the subthreshold components of these models are identical (see Methods). Benchmarks are for models fitted to serotonin (5-HT), somatostatin (SOM), and medial prefrontal cortex (mPFC) neurons. aGIF, augmented GIF.
Figure 3—figure supplement 1
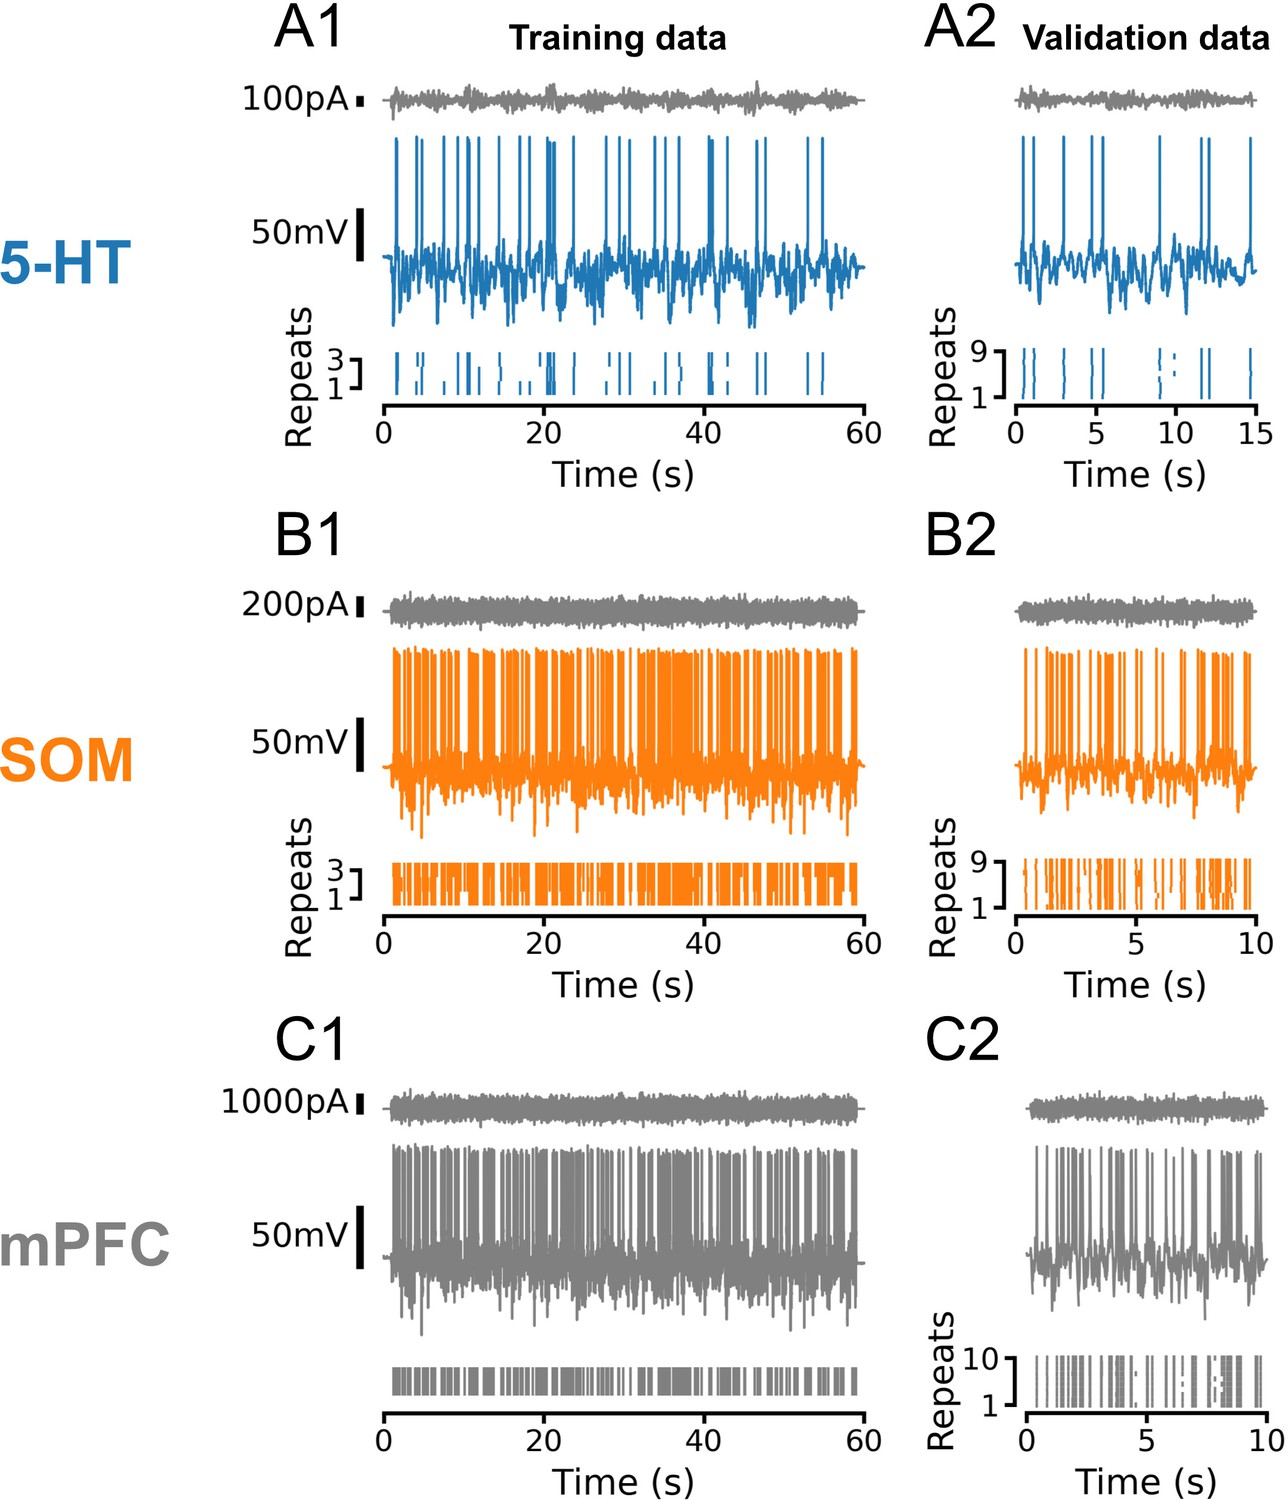
Representative training and validation sets for all cell types.
In all cases, training and validation sets consisted of frozen Ornstein-Uhlenbeck (OU) noise with a sinusoidally modulated variance. Noise was rescaled to evoke subthreshold fluctuations of approximately equal amplitude across individual neurons and cell types. (A) Representative dataset from a serotonin (5-HT) neuron using OU noise with a time constant τ = 50 ms and variance modulations with a period of 5 s. (B, C) Representative datasets from somatostatin (SOM) and medial prefrontal cortex (mPFC) neurons using OU noise with a time constant of τ = 3 ms and variance modulations with a period of 100 ms. Note that the number and duration of sweeps in the training and test sets varied between cell types, as shown. In 5-HT and SOM neurons, training and validation sweeps were interleaved such that each training sweep would be followed by three of the nine validation sweeps. In all cases, active electrode compensation (see Pozzorini et al., 2015) was applied based on a single 10 s sweep of frozen OU noise with τ = 3 ms before fitting and validating generalized integrate-and-fire models.
Figure 3—figure supplement 2
Whole-cell currents observed in medial prefrontal cortex (mPFC) neurons.
(A) Voltage clamp protocol. Same as in Figure 1C. (B) Leak-subtracted whole-cell currents from N = 6 L5 mPFC pyramidal neurons (top) and voltage command (bottom). Recordings were carried out in the presence of bath-applied tetrodotoxin.
Figure 3—figure supplement 3
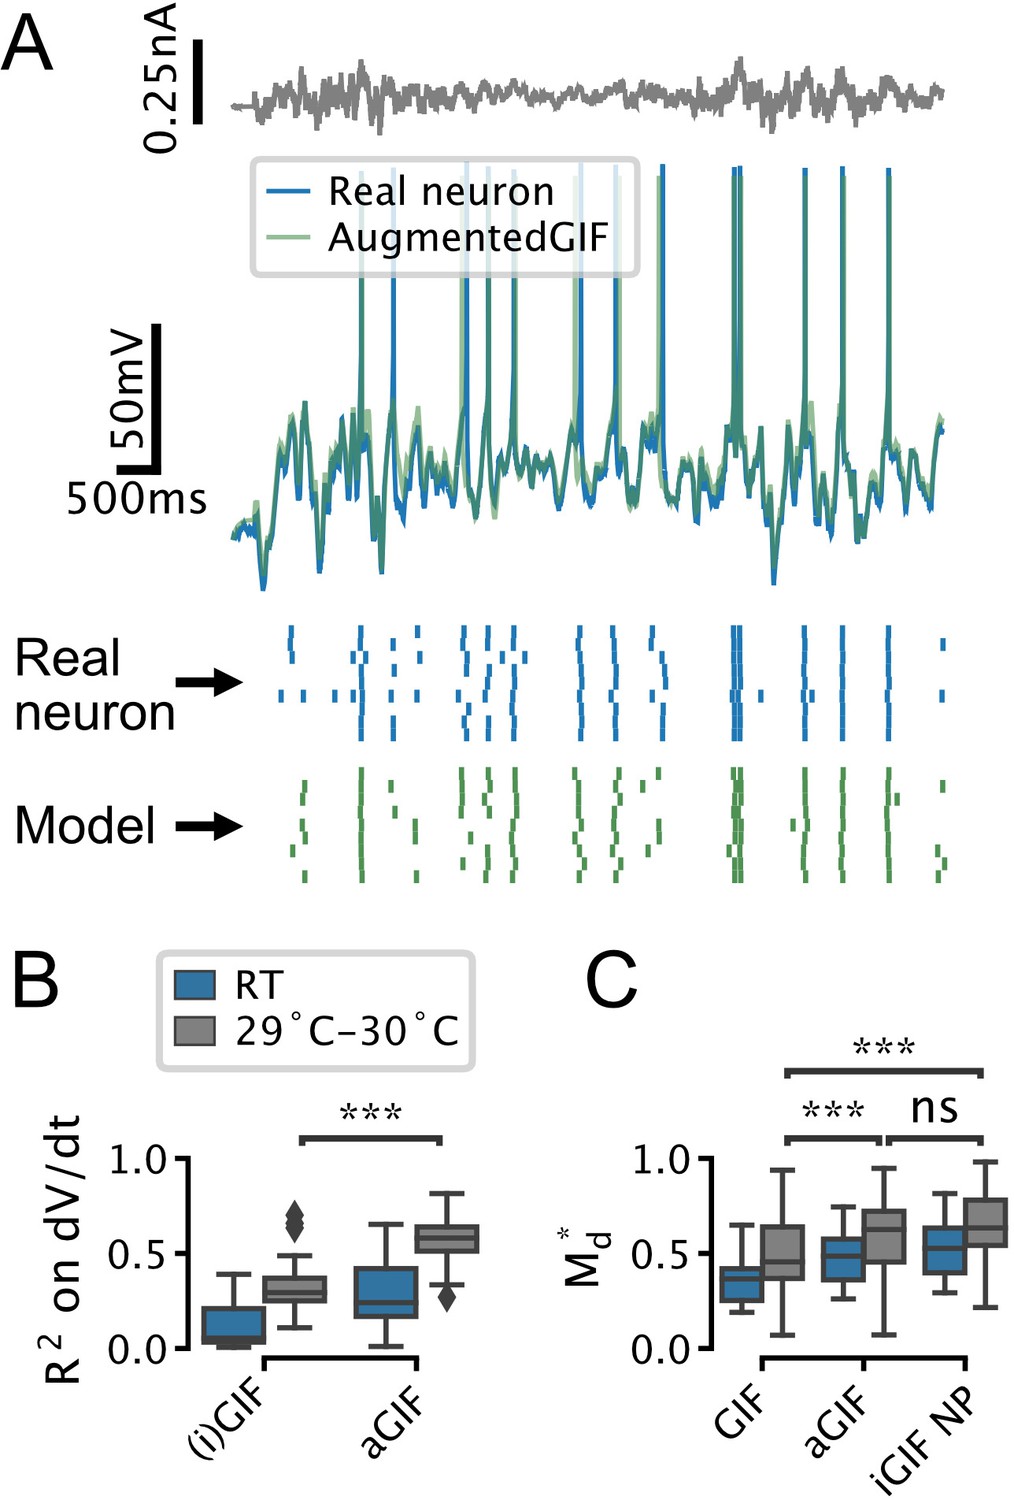
The augmented generalized integrate-and-fire (aGIF) model accurately predicts the subthreshold voltage and firing patterns of serotonin (5-HT) neurons recorded at room temperature (RT) and 29–30°C.
(A) Representative validation data and aGIF model predictions for a 5-HT neuron recorded at 29–30°C. Compare with Figure 3D2. (B, C) Quantification of model performance in terms of on the training subthreshold voltage derivative and on the validation spike-train similarity metric . RT data from Figure 3F are presented for comparison, but note that differences across experimental conditions (i.e. RT vs. 29–30°C) in B may be due to confounds such as recording noise. RT N = 18, 29–30°C N = 18.
Figure 4 with 2 supplements
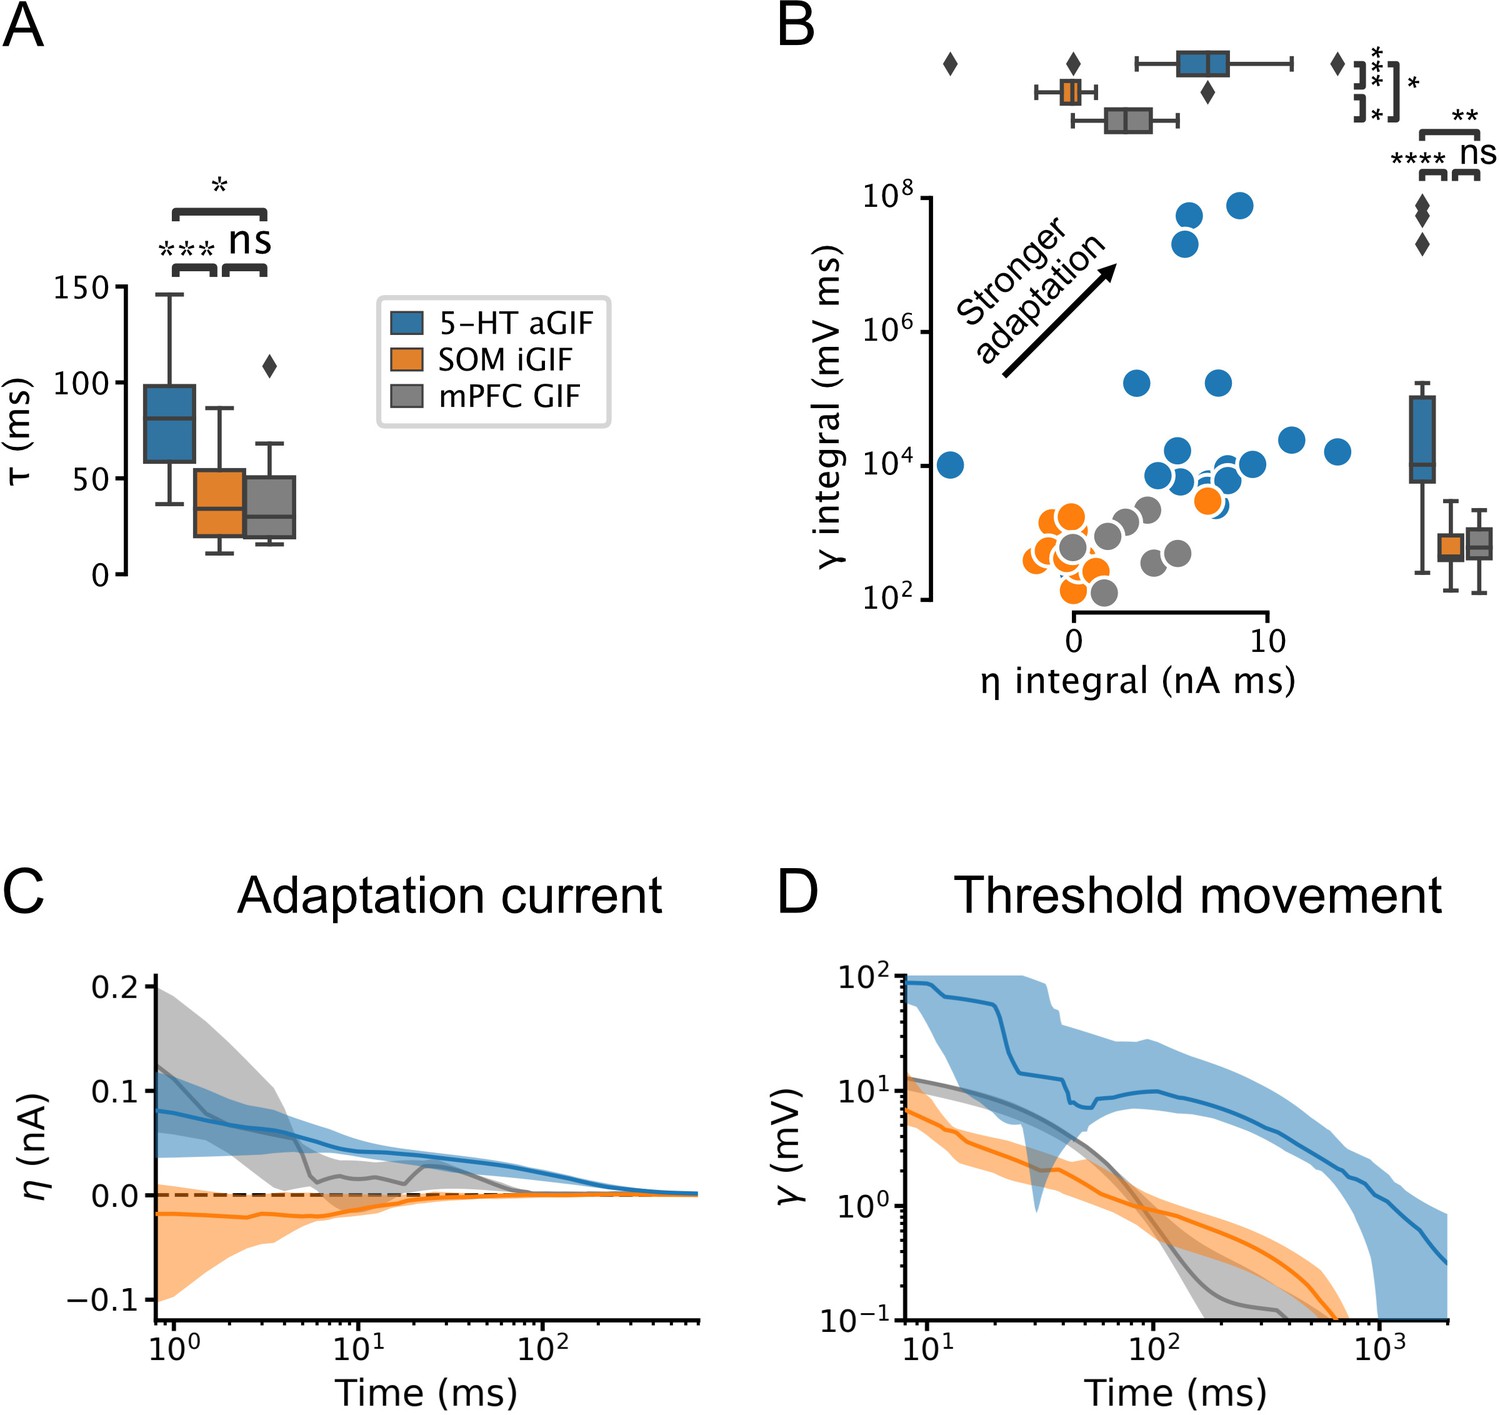
Serotonin (5-HT) neurons are distinguished by slow membrane time constants and potent adaptation.
(A) Using the features from the best performing generalized integrate-and-fire (GIF) model variant for each cell type (legend), passive membrane time constant. (B) Spike adaptation features: potency of after-hyperpolarization potential (AHP)-mediated (spike-triggered current integral) and AHP-independent (spike-triggered threshold movement integral) adaptation. (C, D) Comparison of model filters. Presented as median (lines) and interquartile range (bands). Note the long-lasting adaptation currents (C; positive values indicate hyperpolarizing current) and threshold movements (D) of 5-HT neurons. Parameters are from models fitted to 5-HT, somatostatin (SOM), and medial prefrontal cortex (mPFC) neurons.
Figure 4—figure supplement 1
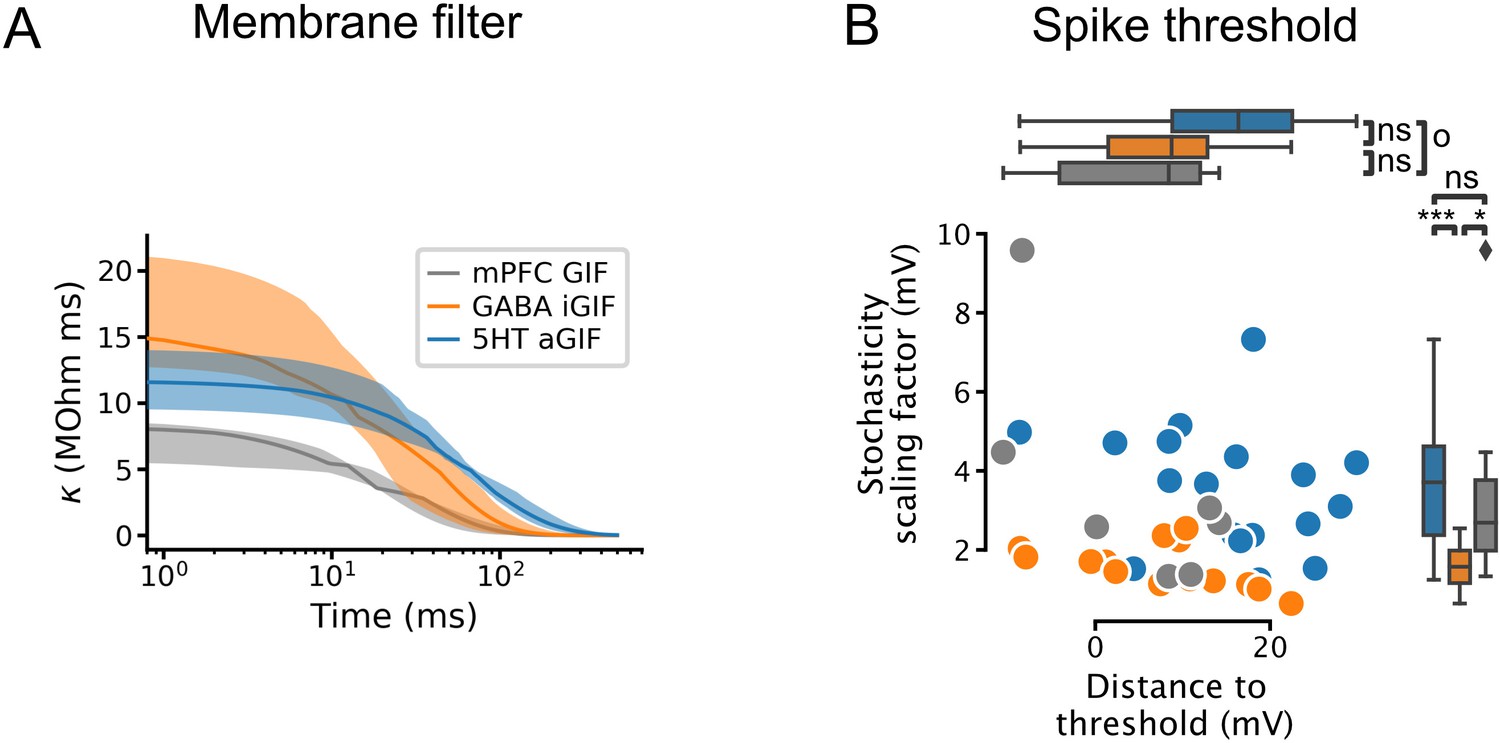
Additional features extracted from single neuron models.
(A) Passive membrane filter. Presented as median and interquartile range, as in Figure 4C and D. (B) Spike threshold features: stochasticity scaling factor (, also known as the threshold width; larger values indicate greater stochasticity) and distance to threshold (). 5-HT, serotonin, GIF, generalized integrate-and-fire; aGIF, augmented GIF; iGIF, inactivation GIF; mPFC, medial prefrontal cortex.
Figure 4—figure supplement 2
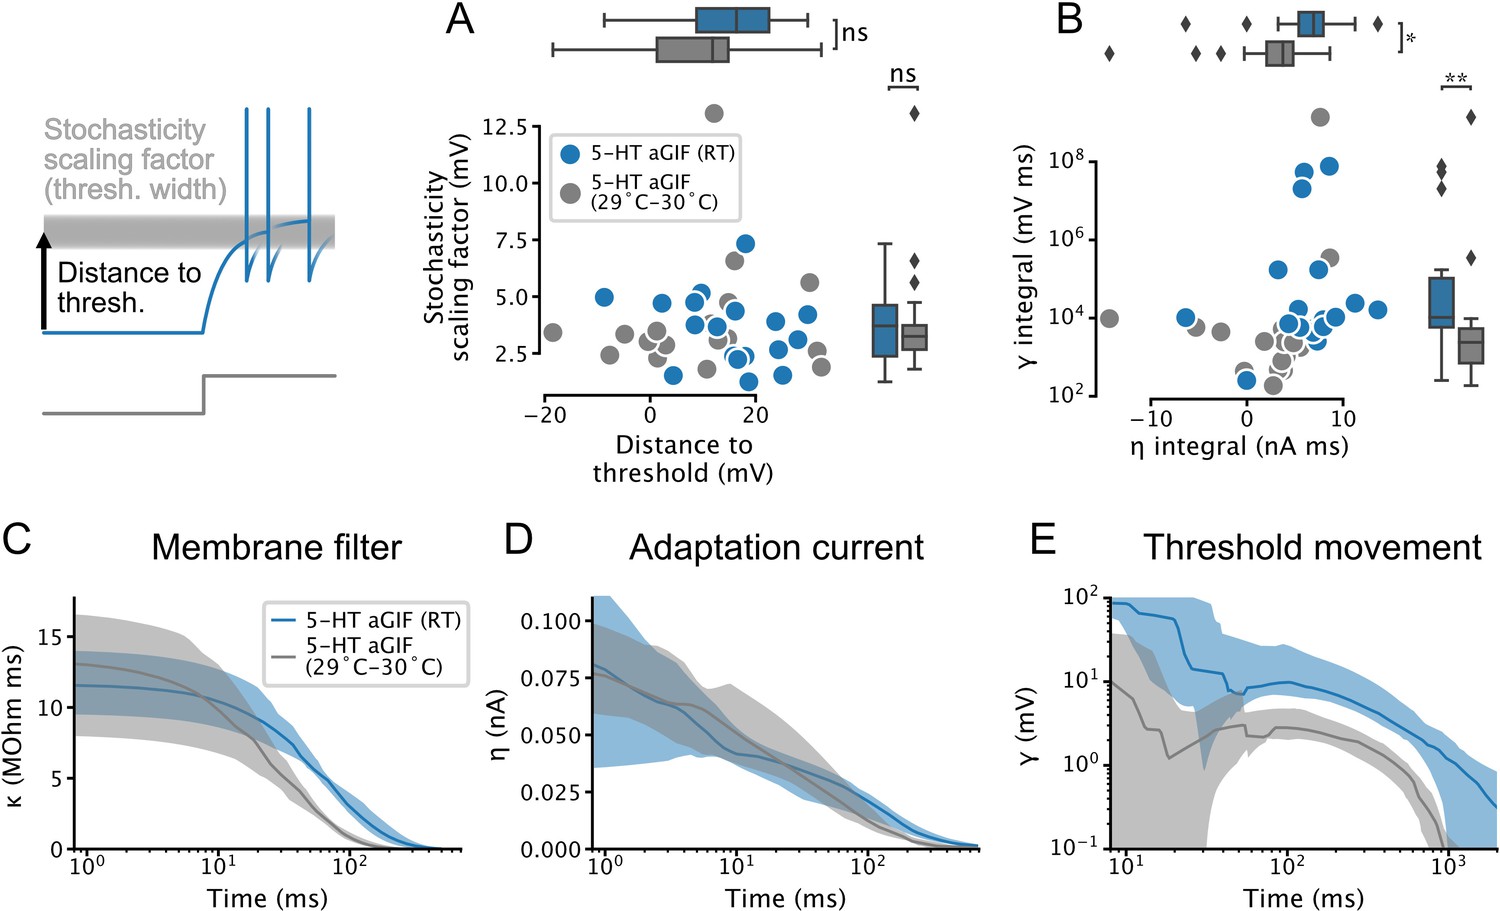
Temperature dependence of features extracted from augmented generalized integrate-and-fire (aGIF) models fitted to serotonin (5-HT) neurons.
(A) Spike threshold features. (B) Adaptation strength. Two aGIFs fitted to data collected at 29–30°C with integral ≤0 are not shown for clarity but are used in statistical tests. (C–E) Passive membrane (C), spike-triggered current (D), and spike-triggered threshold movement (E) model filters. Data are presented as median and interquartile range, as in Figure 4, Figure 4—figure supplement 1. Data from Figure 4, Figure 4—figure supplement 1 are shown in blue for comparison. N = 18 models fitted to data collected at room temperature (RT), N = 18 models fitted to data collected at 29–30°C.
Figure 5 with 5 supplements
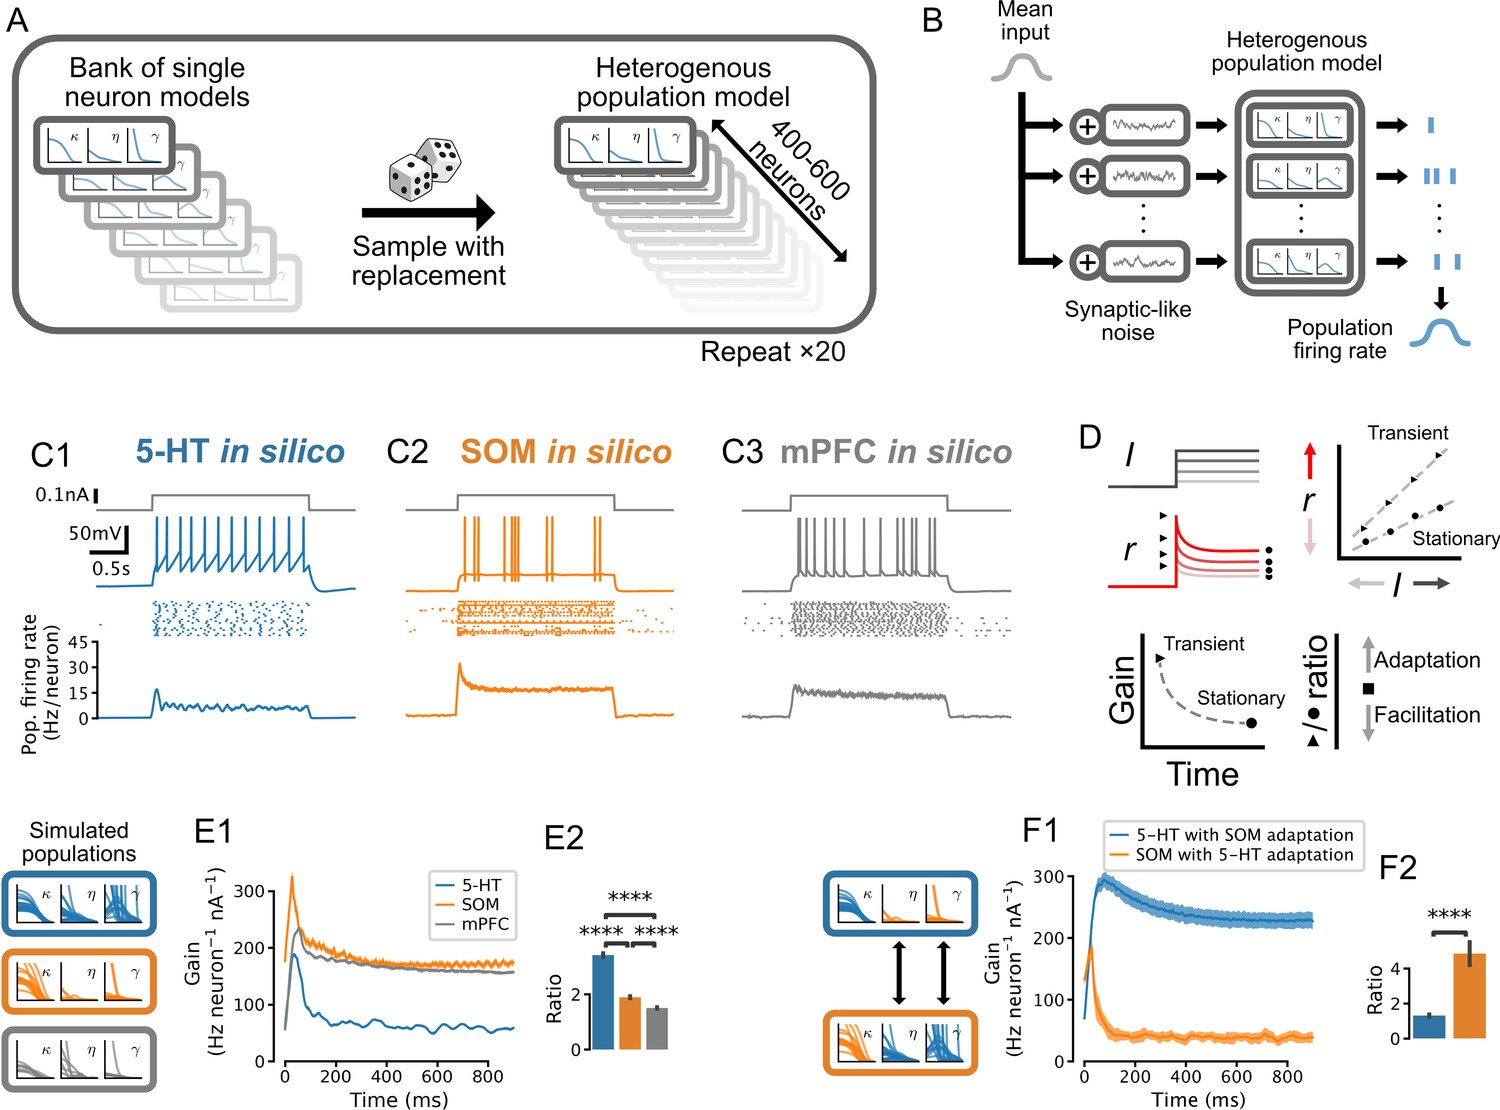
Adaptation mechanisms cause a higher gain of the transient vs stationary population response.
(A) Generation of heterogeneous population models from experimentally constrained single neuron models. (B) Schematic of population simulations. Spikes from individual neuron models in the simulated population are added together to produce a population firing rate. (C) Population responses to input step. From top in each column: stimulus (gray); sample voltage trace; spike raster of first 20 neurons; mean population firing rate across 20 independent simulations. (D) Schematic for quantifying the time-varying population input-output function for both the transient and the stationary components of the response. An input-output function is calculated for the population response at each time point after the input step. The slope of each input-output function (gain) is then plotted as a function of time since the step onset. The ratio of the maximum gain to the minimum gain is a measure of the relative amount of population adaptation. (E) Time-resolved gain of step input responses across cell types following the approach shown in D. (F) Time-resolved gain of serotonin (5-HT) populations with the adaptation parameters of somatostatin (SOM) neurons (blue) and of SOM populations with adaptation parameters of 5-HT neurons (orange). Data are presented as mean ± SD in E1 and F1. mPFC, medial prefrontal cortex.
Figure 5—figure supplement 1
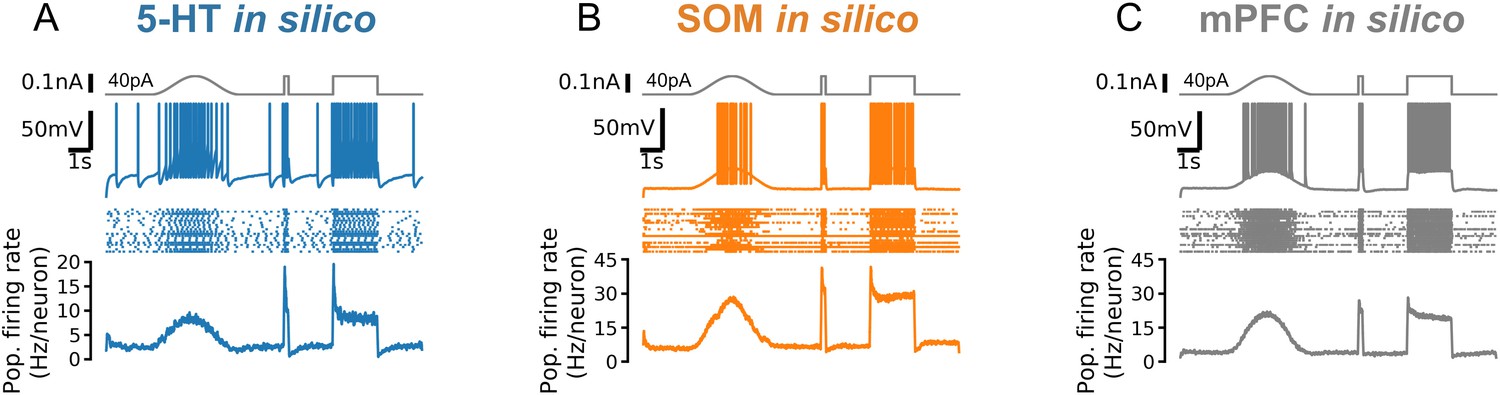
Responses to fast and slow inputs are robust to increases in input baseline.
Responses to a cosine bump, short square pulse, and long square step are shown for simulated serotonin (5-HT; A), somatostatin (SOM; B), and mPFC neuron populations (C). Square step is the same as Figure 5C but with 40 pA background input. Note strongly adapting population firing rate in serotonin (5-HT) neurons (A). mPFC, medial prefrontal cortex.
Figure 5—figure supplement 2
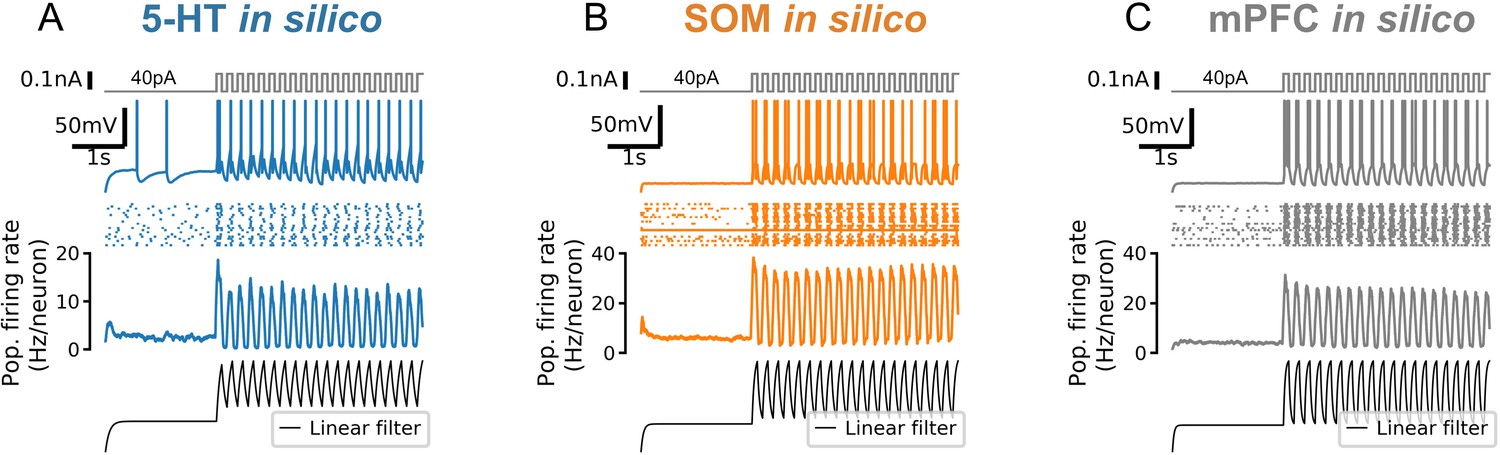
Strong responses of neuron populations to sudden inputs are due to a non-linear filtering effect.
A 5-Hz square wave on top of a constant 40 pA input is applied to simulated 5-HT (serotonin; A), SOM (somatostatin; B), and mPFC (C) neuron populations. Population firing rate shows the mean of N = 20 independent simulations. Bottom row shows the population firing rate (in arbitrary units) predicted by a linear population coding model (a monoexponential filter with a time constant equal to the mean membrane time constant of the corresponding cell type applied to the input signal). Note that the start of the square wave component of the stimulus is amplified by the simulated neuron populations (second row from bottom) but not by the linear model (bottom row).
Figure 5—figure supplement 3
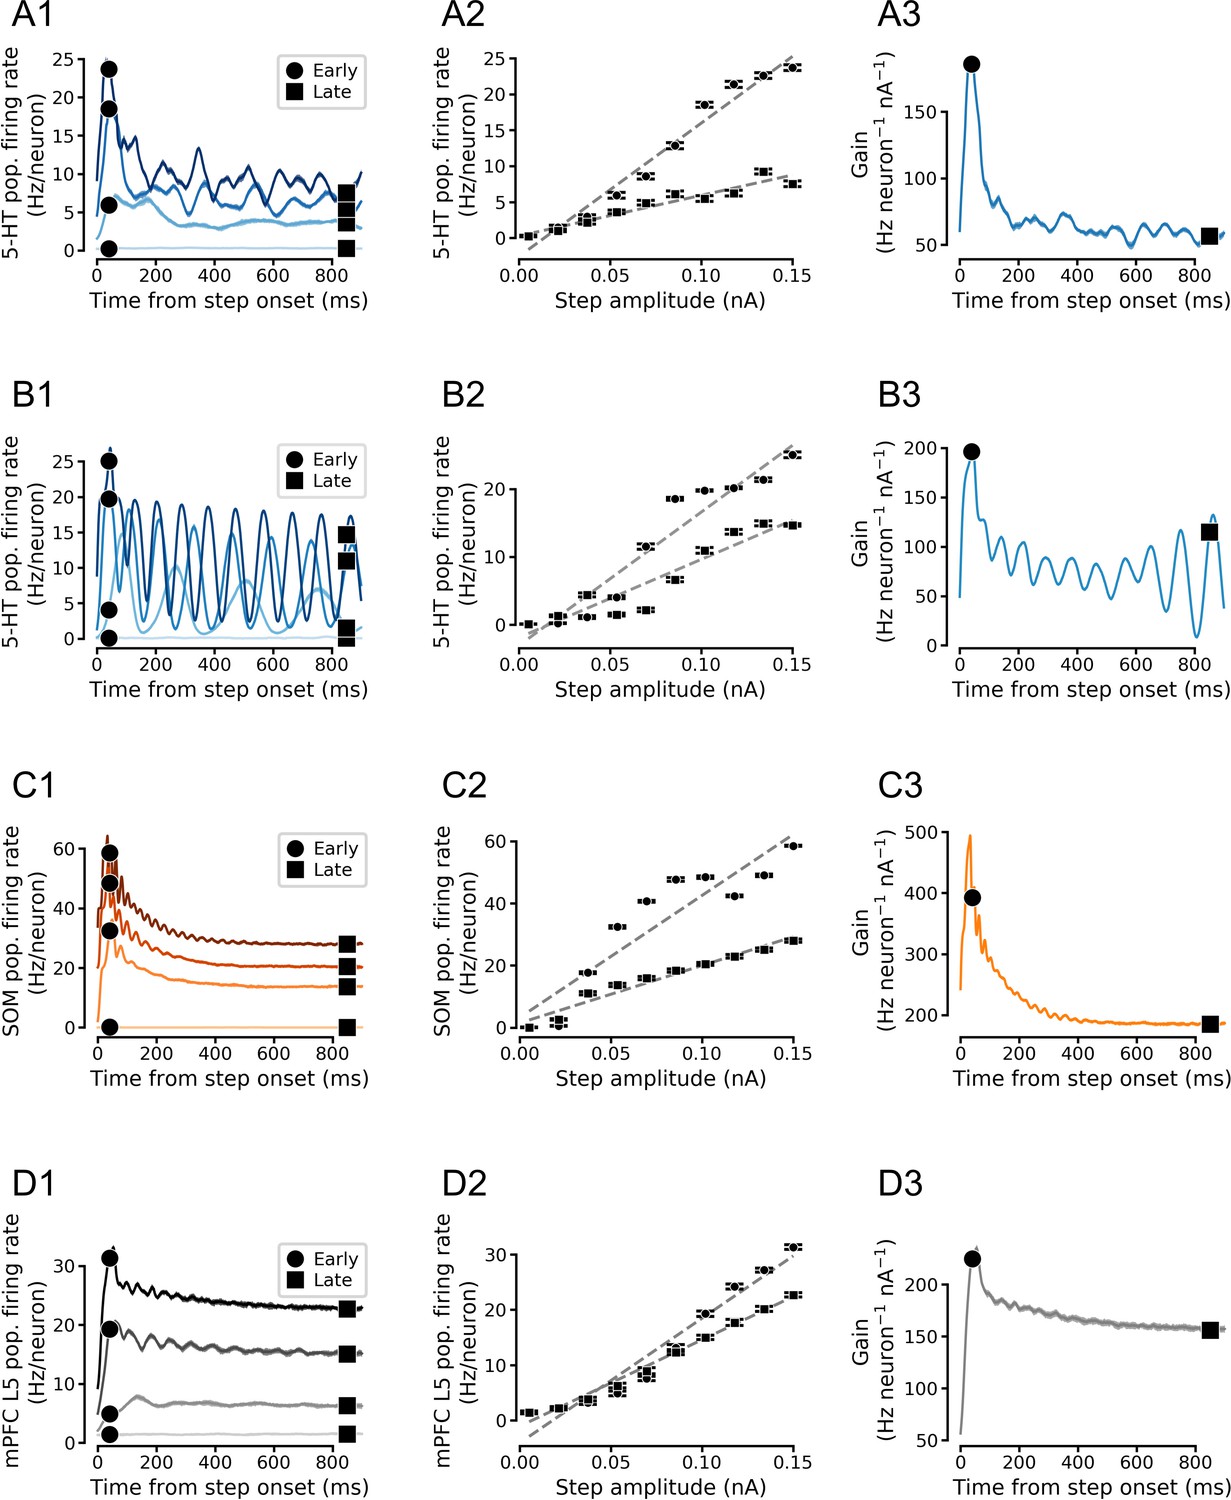
Simulated population input-output functions across cell types.
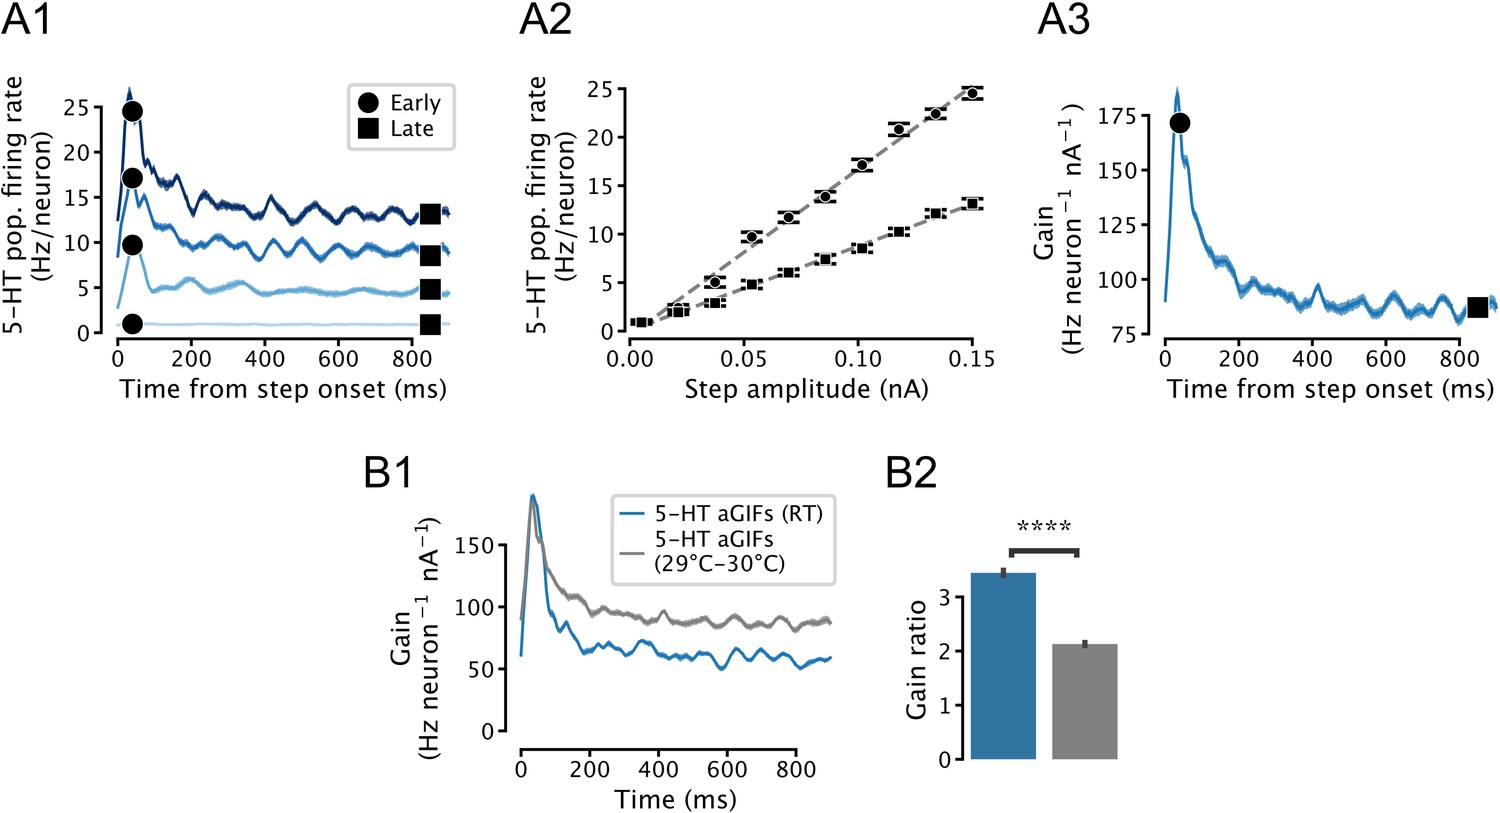
(A) Simulated serotonin (5-HT) neuron population. (B) Simulated homogenous population of 5-HT neurons. 5-HT neuron models were homogenized by setting each parameter to its median value across all augmented generalized integrate-and-fire models fitted to 5-HT neurons. Note oscillations. (C) Simulated somatostatin (SOM) neuron population. (D) Simulated medial prefrontal cortex (mPFC) neuron population. Note that the f/I curves of (heterogenous) 5-HT and SOM neuron populations are approximately linear in the simulated input range (A and C). Left column shows population firing rates at four different stimulus intensities (A1-D1), middle column shows f/I curves fitted to early and late components of the population firing rates (A2-D2), and right column shows time-dependent gain (slope of of the f/I curve; A3-D3). See Figure 5D for a schematized version of this figure.
Figure 5—figure supplement 4
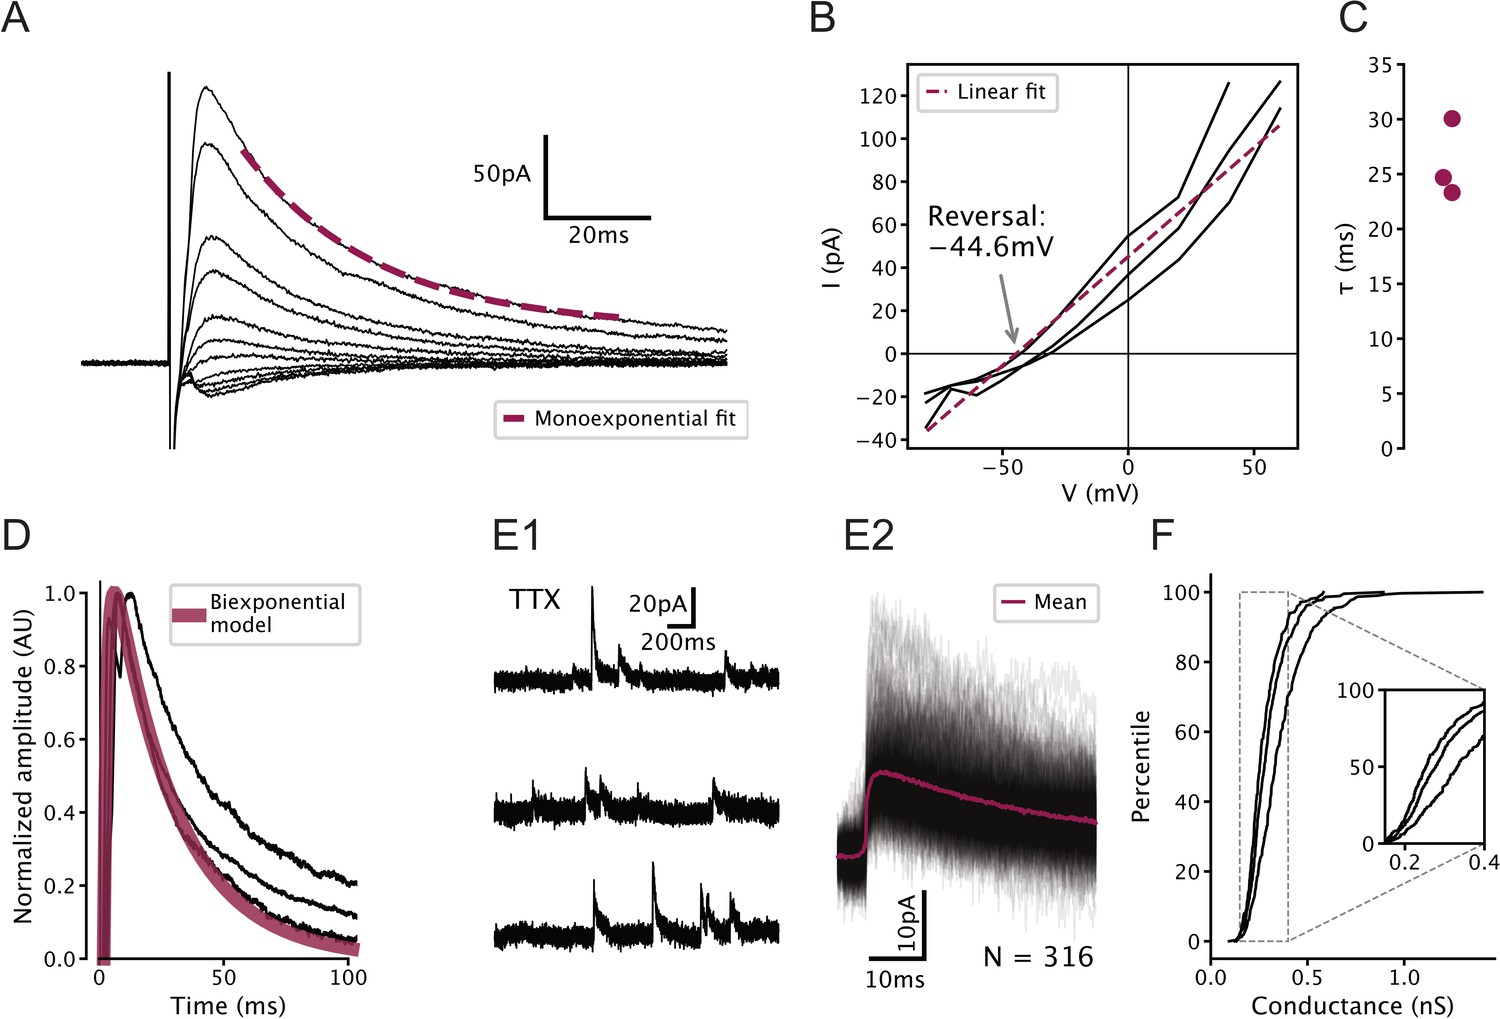
Characterization of GABAergic synapses on serotonin (5-HT) neurons used to constrain network model.
All recordings were carried out in 100 µM (2 R)-amino-5-phosphonovaleric acid (APV) and 5 µM 2,3-dioxo-6-nitro-1,2,3,4-tetrahydrobenzo[f]quinoxaline-7-sulfonamide (NBQX) to block glutamatergic synapses. (A) Representative electrically evoked inhibitory post-synaptic currents (eIPSCs) recorded from a 5-HT neuron. Stimulus artifact can be seen just before the start of the synaptic current. (B) Voltage dependence of eIPSC amplitude in N = 3 5-HT neurons. Observed reversal potential is –44.6 mV, consistent with a GABAA receptor-mediated chloride current under our recording conditions. (C) Fitted decay time constants of eIPSCs from N = 3 5-HT neurons held at 60 mV. (D) Biexponential GABA synapse model used in dorsal raphe nucleus network models overlaid on eIPSCs from N = 3 5-HT neurons. Model uses ms, ms, and conductance 0.3 nS (see F). (E) Representative unitary IPSCs recorded in a 5-HT neuron held at 20 mV. (F) Distribution of unitary GABA synaptic conductance in 5-HT neurons extracted from unitary IPSCs. Each curve represents N = 308–448 unitary IPSCs from a single neuron. IPSC amplitude was converted to units of conductance using , where is the synaptic conductance, is the IPSC amplitude, mV is the holding potential, and mV is the reversal potential of the synaptic current (see B).
Figure 5—figure supplement 5
Temperature-dependence of simulated serotonin (5-HT) neuron population gain.
(A) Input-output function of a simulated population of 5-HT neurons composed of augmented generalized integrate-and-fire (aGIF) models fitted to data collected at 29–30°C. Note that the population f/I curves are approximately linear (A2), and that adaptation is apparent in the time-dependent gain curve (A3). Compare with Figure 5—figure supplement 3A. (B) Temperature-dependence of time-dependent gain. Data from Figure 5E is shown in blue for comparison. N = 20 independent simulations.
Figure 6
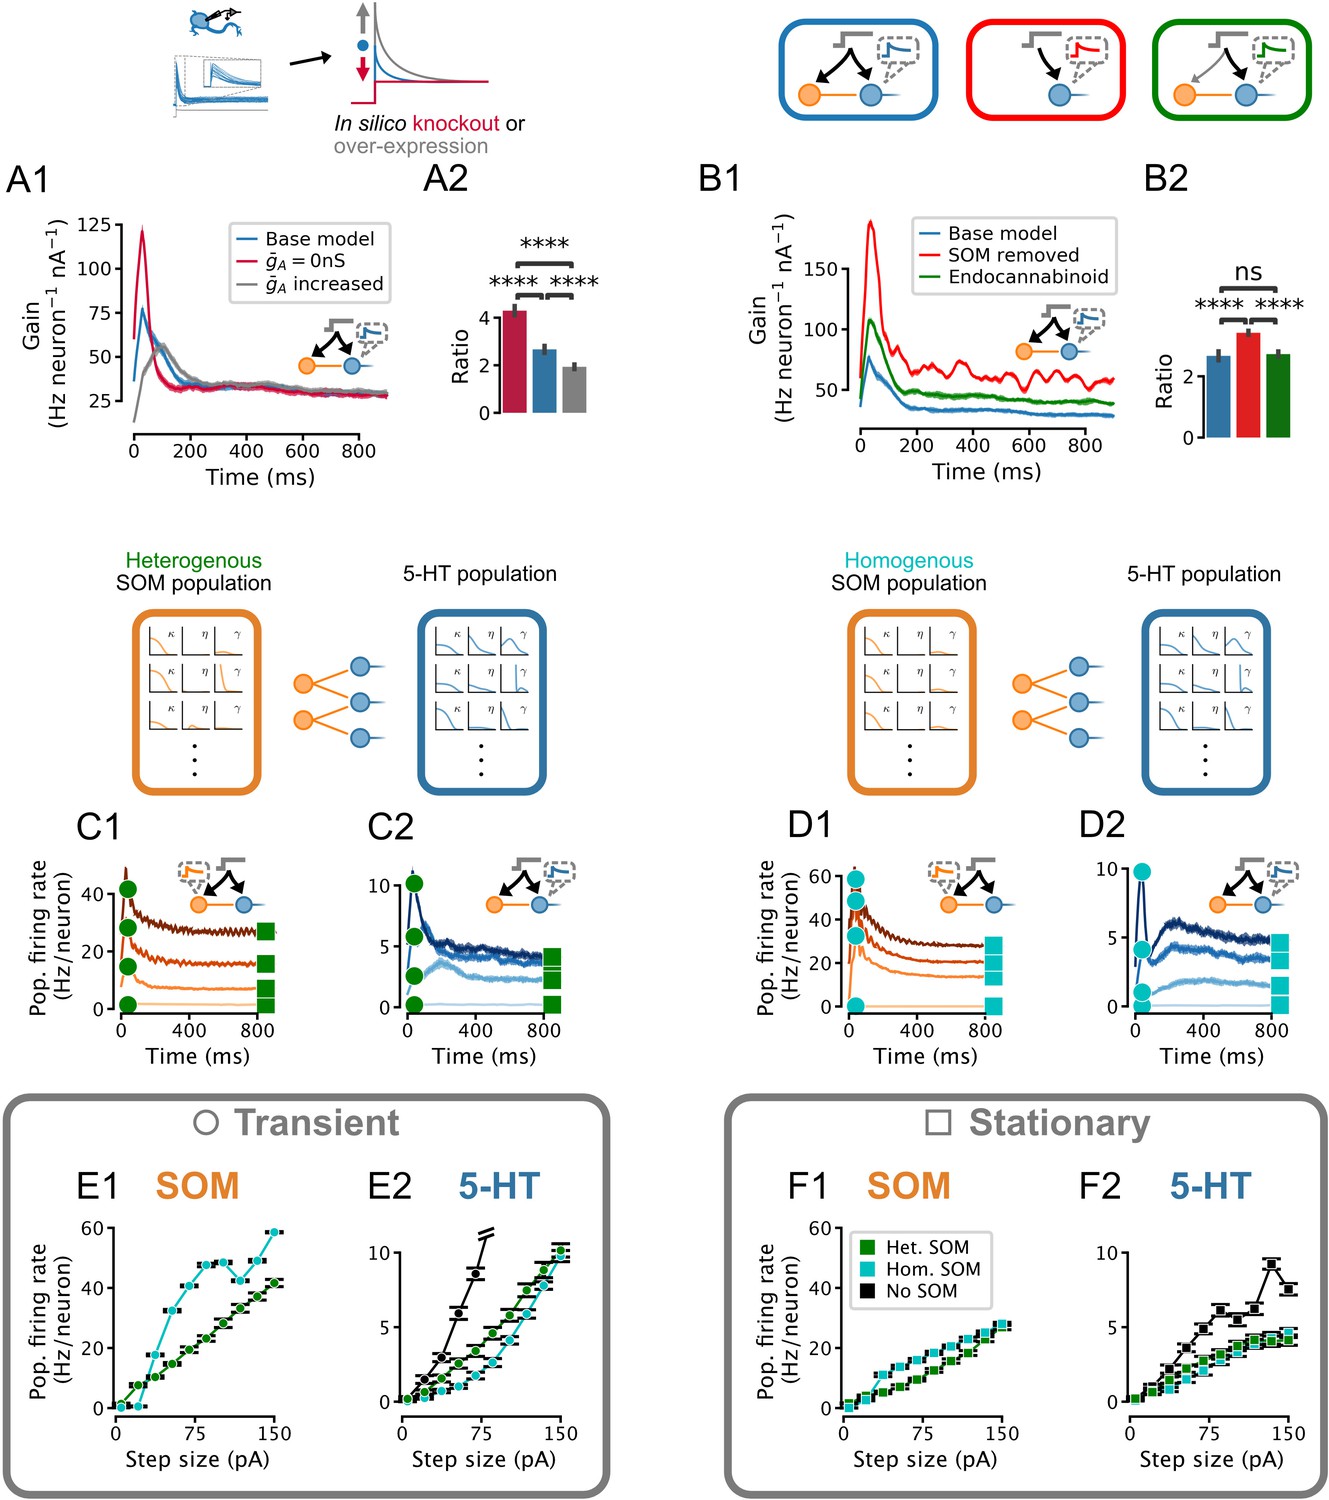
Effect of IA density, feedforward inhibition, and heterogeneity of somatostatin (SOM) neurons on the serotonin (5-HT) neuron population response.
Network input is the same set of step stimuli as in Figure 5D–F. (A) Increasing IA reduces adaptation by selectively suppressing the early part of the response to sudden inputs, and vice-versa. (B) Gain curves with normal feedforward inhibition (blue), with reduced input strength onto the inhibitory population (green), or without inhibition (red). Reduced input strength onto the inhibitory population (green) simulates the effect of endocannabinoid input (Geddes et al., 2016). (A2,B2) Ratio of peak to steady-state gain. Data are presented as mean ± SD. (C) Population firing rates of SOM and 5-HT neurons in a network in which both populations are heterogenous. (D) Population firing rates of SOM and 5-HT neurons in a network in which all SOM neurons are identical. Effects of homogeneous (cyan) or heterogeneous (green) SOM populations on the population input-output functions for the transient (E) and stationary (F) components of the response (see square and circle markers in C and D). Note that the input-output function of the heterogenous SOM population is approximately linear, whereas that of the homogenous population is not (E1, F1). Relative to the input-output functions of a 5-HT population receiving no feed-forward inhibition, the effect of the heterogenous SOM population is divisive, but the effect of the homogenous SOM population on the transient part of the 5-HT population input-output function includes a strong subtractive component (E2).
Figure 7 with 2 supplements
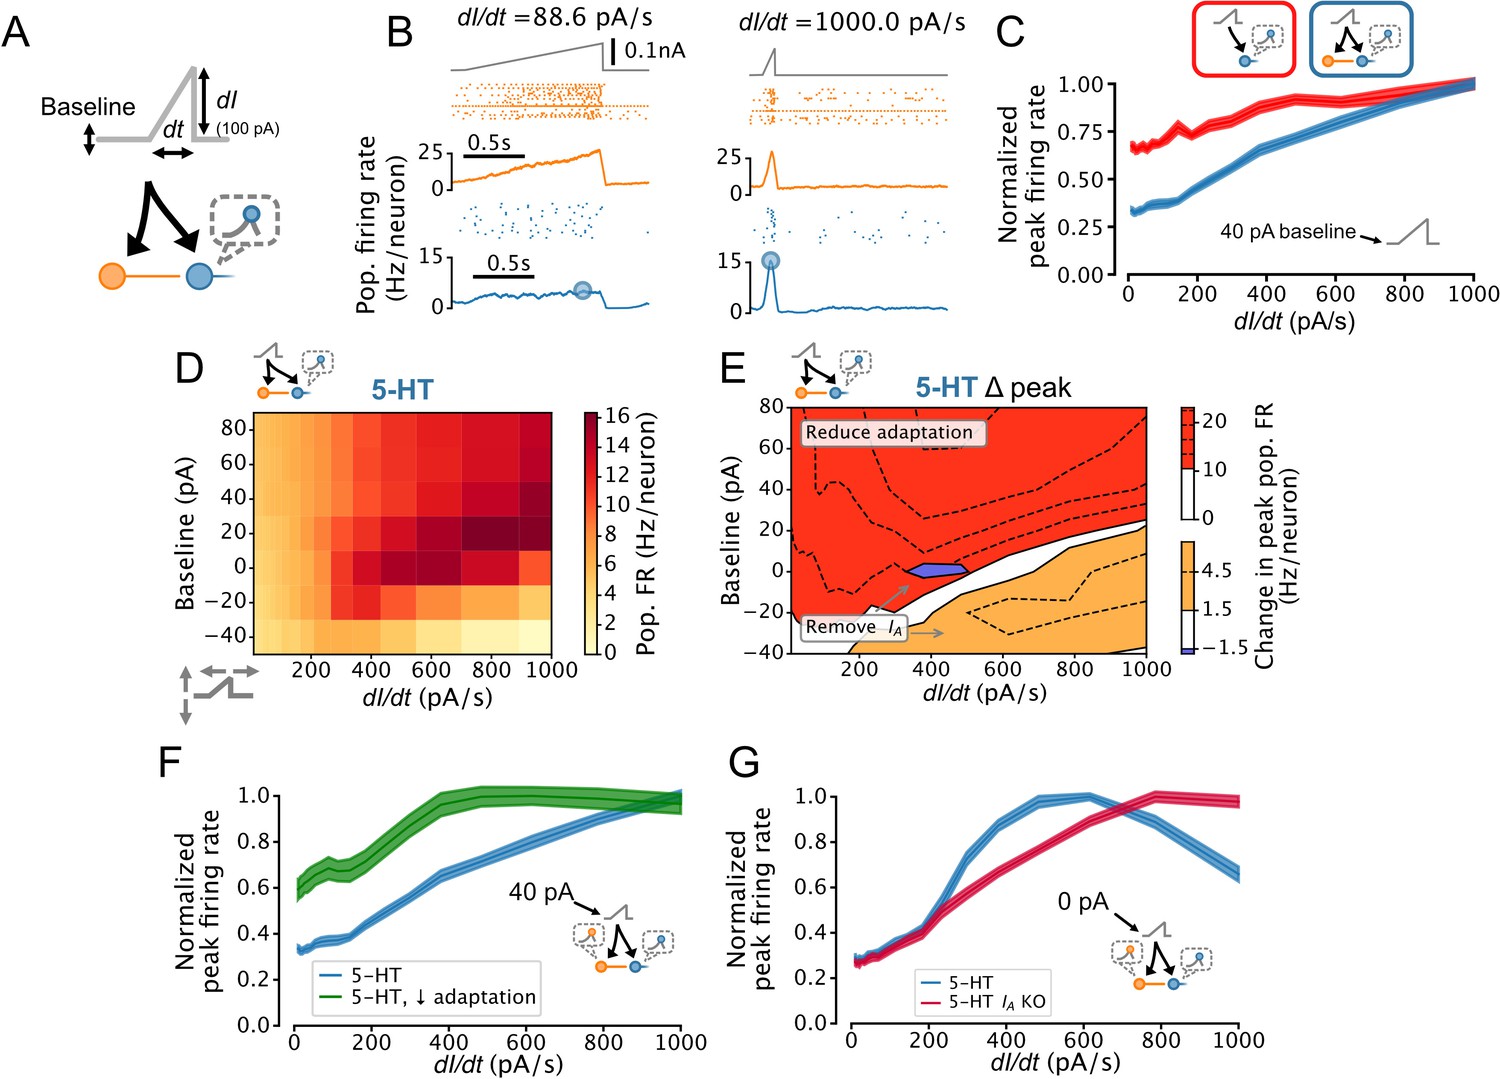
Dorsal raphe nucleus (DRN) serotonin (5-HT) neuron population output conditionally encodes the temporal derivative of its input.
(A) Design of simulations. A ramp stimulus with an adjustable baseline and slope (derivative) is applied to the same network models as in Figures 5 and 6, and the peak firing rate (FR) of the 5-HT neuron population is extracted. (B) Representative simulated input (top), somatostatin (SOM) neuron population activity (middle), and 5-HT neuron population output (bottom). (C) With a baseline input of 40 pA, peak 5-HT neuron population output is approximately linearly related to the derivative of the ramp input, and feed-forward inhibition by SOM neurons enhances this feature. (D) Peak FRs of 5-HT neuron populations depend on interacting effects of input baseline and slope. Panel C shows normalized data from the 40 pA row in blue. (E) 5-HT neuron adaptation and IA dominate the DRN input-output function under different input regimes. Effect of reducing 5-HT neuron adaptation (following the approach from Figure 5F) is the most pronounced for higher levels of background input and more slowly changing inputs (red), while the effect of removing IA (following the approach of Figure 6A) is the most pronounced for low background input and fast changing inputs (orange, blue). (F) Effect of reducing adaptation in 5-HT neuron models visualized at a 40 pA baseline. Note that 5-HT output no longer linearly encodes dI/dt when adaptation is reduced. (G) Effect of removing IA from 5-HT neuron models visualized at a 0 pA baseline. Note that 5-HT output approximately linearly encodes dI/dt when IA is removed.
Figure 7—figure supplement 1
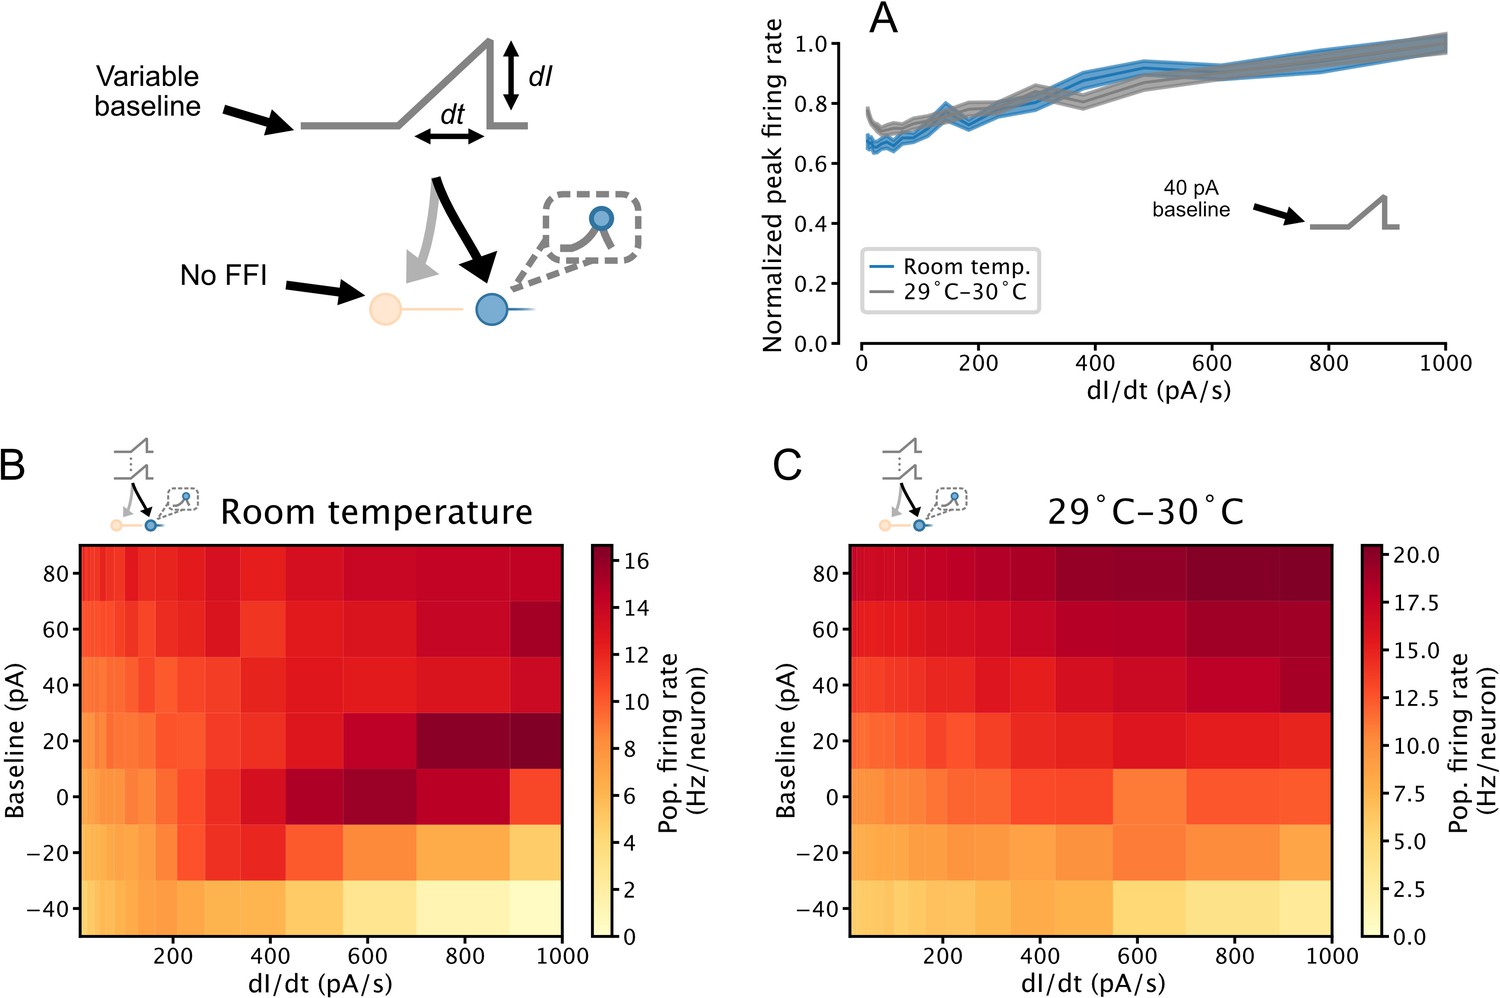
Temperature-dependence of temporal derivative encoding by simulated serotonin (5-HT) neuron populations.
(A) When a depolarizing background input is applied, the peak firing rates of simulated 5-HT neuron populations composed of augmented generalized integrate-and-fire models fitted to data collected at room temperature and 29–30°C linearly encode the slope of a ramp input. Simulation setup is the same as in Figure 7. Data from Figure 7C is presented in blue for comparison. (B, C) Relationship between peak population firing rate and ramp stimulus slope across a range of input baselines. Data from the 0 pA and 40 pA rows are presented in A1 and A2, respectively. Darkening color from left to right across a row indicates a positive relationship between the temporal derivative of the input and population firing rate (a phenomenon we refer to as derivative encoding). FFI, feedforward inhibition.
Figure 7—figure supplement 2
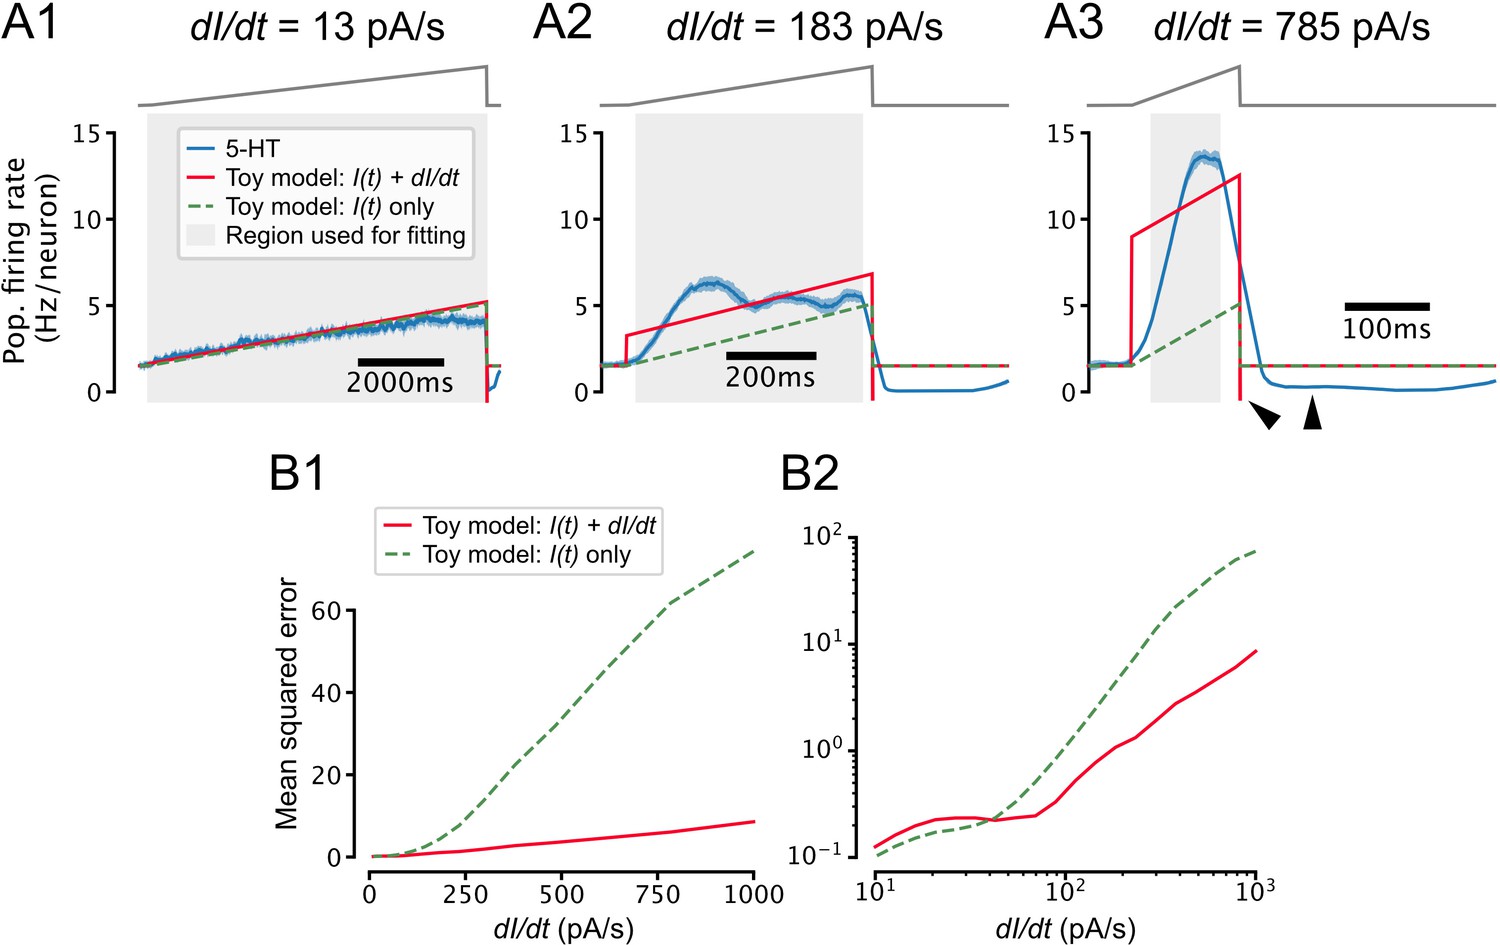
Toy model of temporal derivative encoding by the dorsal raphe nucleus (DRN).
(A) Toy models that predict the serotonin (5-HT) population firing rate (blue) as a function of both the intensity of the applied stimulus and its temporal derivative (red) or the intensity of the stimulus alone (dashed green) make similar predictions for slowly changing inputs (A1) but very different predictions when the input is increasing quickly (A2, A3). Note that when the input decreases quickly at the end of the ramp (), the population firing rate drops to approximately the 0 Hz/neuron boundary while the toy model that accounts for the derivative of the input predicts a very negative firing rate, and the toy model that ignores the derivative predicts a return to the baseline firing rate (A3, black wedges). (B) Toy models that do and do not account for the temporal derivative of the input predict the 5-HT population firing rate with similar accuracy for slowly increasing inputs (0 pA/s pA/s), but the model that accounts for the temporal derivative makes more accurate predictions for inputs with a larger positive temporal derivative. Note that the performance of both models degrades at larger values of , possibly reflecting sensitivity to higher moments of the stimulus or passive membrane filtering not accounted for by our toy models. The toy models are defined as , where Hz/neuron and Hz neuron –1 pA –1. is set to 0.0095 Hz neuron –1 s pA –1 in the toy model that accounts for the temporal derivative of the input (red) and 0 in the model that does not (dashed green). Coefficients were estimated via a weighted least-squares fit to data from simulations shown in Figure 7 using a stimulus baseline of 40 pA and DRN network models that included feedforward inhibition. Only data from the ramp portion of the stimulus (excluding 25 ms at the start and end of the ramp to account for smoothing artifacts) was used for fitting and performance evaluation, but the traces in A show that the toy models also accurately predict the baseline firing rate. Weights were set such that all ramps contributed equally to coefficient estimates.
Tables
Table 1
Membrane parameters of DRN neurons.
Parameters obtained from recordings from mPFC L5 pyramidal neurons used to fit GIF models as a point of comparison are also shown. Data are presented as mean ± SD. Distributions are shown in Figure 1—figure supplement 3.
| Cell type | R (GΩ) | C (pF) | τ (ms) | N |
|---|---|---|---|---|
| 5-HT | 1.16±0.55 | 67.0±17.1 | 75.2±33.8 | 96 |
| SOM | 1.07±0.58 | 43.5±15.5 | 42.2±19.8 | 28 |
| mPFC | 0.188±0.130 | 160.6±48.2 | 27.4±13.2 | 25 |
-
DRN, dorsal raphe nucleus; PFC, prefrontal cortex; GIF, generalized integrate-and-fire model; 5-HT, serotonin; SOM, somatostatin; mPFC, medial prefrontal cortex; R, memrane resistance; C, membrane capacitance; τ, membrane time constant.
Table 2
5-HT IA current gating parameters.
Gating curves shown in Figure 1—figure supplement 6B were fitted with the scaled Boltzmann function . Values are based on experiments from N=13 cells.
| Gate | ||||
|---|---|---|---|---|
| –20 | 1.61 | 0.0985 | –23.7 | |
| –80 | 1.03 | –0.165 | –59.2 | |
| –20 | 1.55 | 0.216 | –24.3 |
-
5-HT, serotonin.
Author response table 1
| Parameter | Original estimate | Updated estimate |
|---|---|---|
| Amplitude (pA) | 929±69 | 937±79 |
| Time to peak (ms) | 7.46±0.21 | 7.42±0.27 |
| Time constant (ms) | 42.9±2.6 | 41.0±3.1 |
Additional files
Download links
A two-part list of links to download the article, or parts of the article, in various formats.
Downloads (link to download the article as PDF)
Open citations (links to open the citations from this article in various online reference manager services)
Cite this article (links to download the citations from this article in formats compatible with various reference manager tools)
Temporal derivative computation in the dorsal raphe network revealed by an experimentally driven augmented integrate-and-fire modeling framework
eLife 12:e72951.
https://doi.org/10.7554/eLife.72951


