Regeneration of the larval sea star nervous system by wounding induced respecification to the Sox2 lineage
- Department of Biological Sciences, Carnegie Mellon University, United States
Figures
Figure 1 with 2 supplements

Regeneration of the sea star larval nervous system.
(A) A schematic of a 7-day old Patiria miniata larva. (B-B”) Immunostaining with anti-synaptotagmin B (SynB; red) and anti-serotonin (5-HT; green) shows the larval nervous system organisation. Serotonergic neurons are distributed along the pre-oral ciliary band, post-oral ciliary bands and around the mouth. Larvae are bisected beneath the lip of the mouth shown by the dotted line (B’’ and C’). (C-C’’) A latero-ventral view of regenerated larva at 7 days post bisection, the nervous system stained with Syn B. As bisection was performed at the site represented with the white dashed line. Above the dashed line in (C’) is the regenerated anterior tissue with reformed pre-oral ciliary band and the mouth. (D–I) Schematics of larvae at the normal (uncut) and regenerated stages corresponding to immunostaining with 5-HT images in (D’-I’) and (d-i). (d-i). The expanded view of the region highlighted with the dashed-line box in (D’-I’). (D’) The serotonergic neurons are located bilaterally in uncut larvae, on the dorsal side as shown in lateral view in (E’). (d-e). Neural bodies are embedded in the ectoderm, and project long axonal processes typical of this neural type. (F’-f) Bisection removes the serotonergic neurons. (G’) By 5 dpb, serotonergic neurons are detected at the regeneration leading edge with emerging neural morphology as shown in (g). (H’) By 7 dpb, regenerated serotonergic neurons with mature neural morphology (h) are located at the lateral side of the regenerated anterior. (I’-i). Regenerated serotonergic neurons are bilaterally located to reform the dorsal ganglia by 21 dpb. Arrowheads highlight the serotonergic neurons. Dpf: day-post fertilization; dpb: day-post bisection. DV: dorsal view. LV: lateral view. Scale bar: 50 µm. The numbers shown in the lower right corner of each image indicate the number of larvae showing a positive IHC signal among the larvae examined.
Figure 1—figure supplement 1
Bright-field micrograph showing sea star larvae undergo whole-body regeneration (WBR).
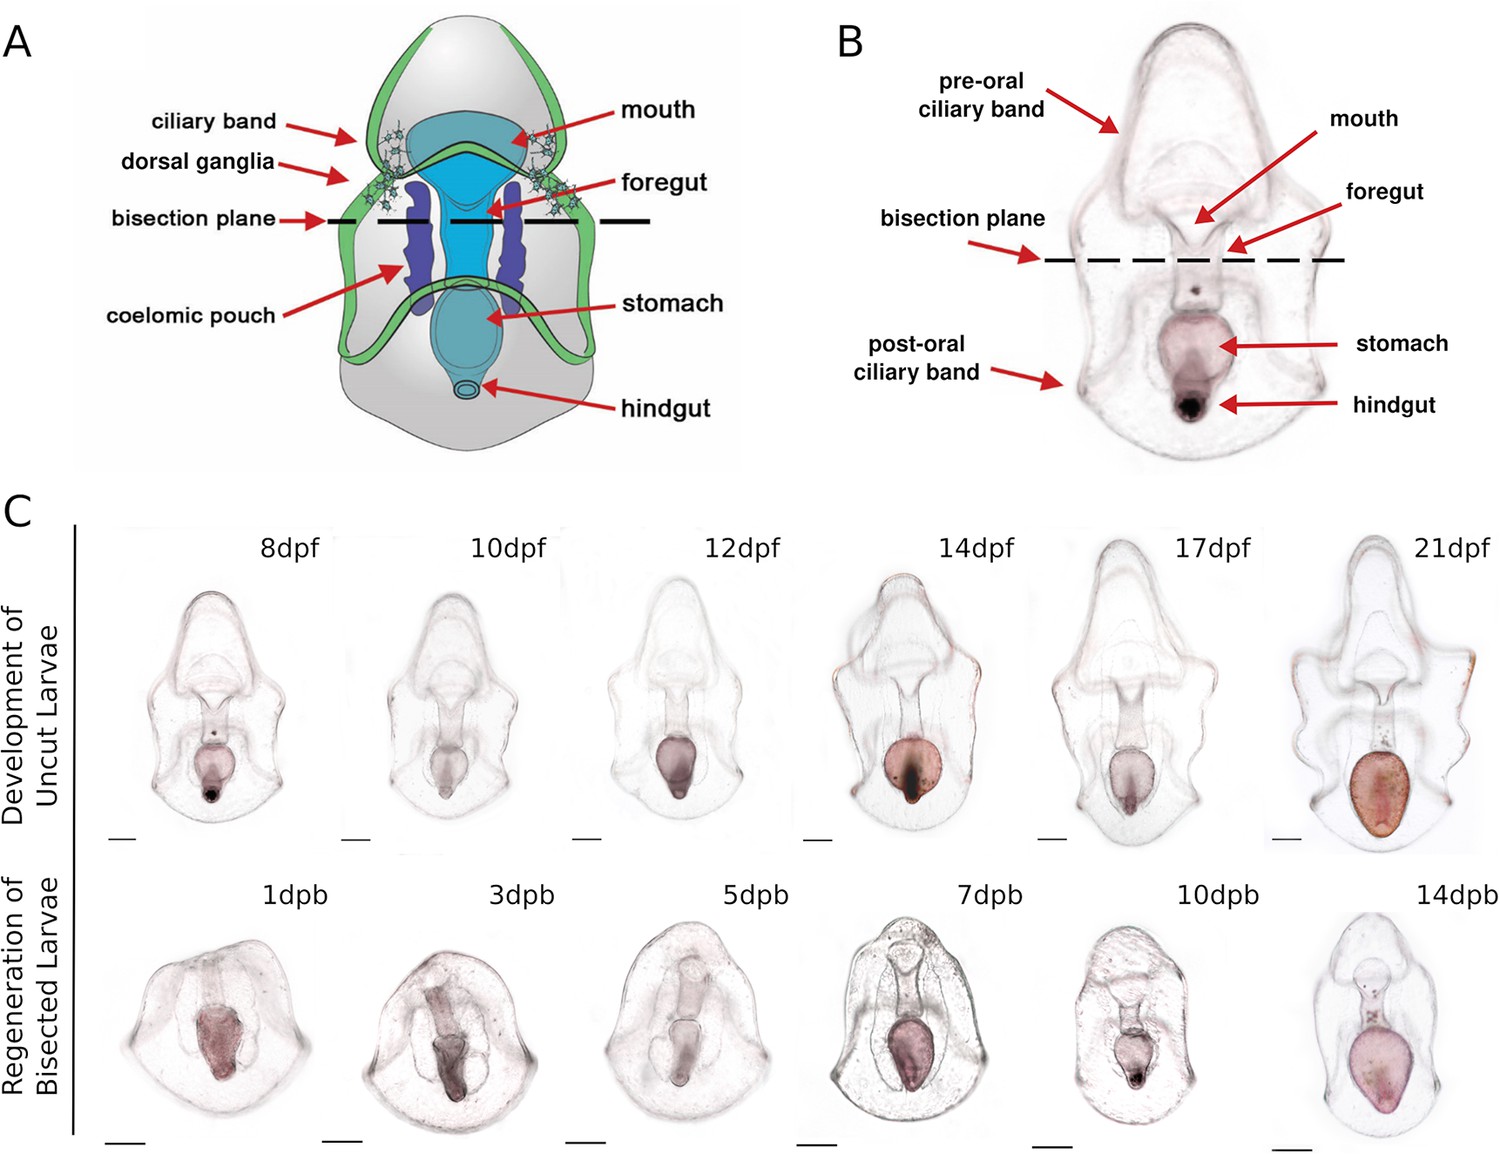
(A–B) A schematic (A) and bright-field micrograph (B) of a 7 day post-fertilization (dpf) Patiria miniata sea star larva. Bisection is performed at the midline along the anterior-posterior (AP) body axis beneath the lip of the mouth and through the foregut as indicated by the dotted line. (C) Morphology of posterior sea star regeneration. The panel on top is the morphology of uncut control larvae at corresponding time points. These larvae continue to feed and develop towards a brachiolaria larva. The panel on the bottom is the morphology of regenerating posterior larvae. By 3 days post bisection (dpb), the wound is sealed and the mouth is reformed. In larvae from 3 to 5 dpb, a pre-oral regeneration leading edge is formed at the anterior. By 7dpb, a primitive anterior structure, the pre-oral ciliary band is formed. The posterior regenerant larvae appear morphologically fully reformed by about 14 days. Scale bar: 100 µm. dpf: day-post-fertilization; dpb: day-post-bisection.
Figure 1—figure supplement 2
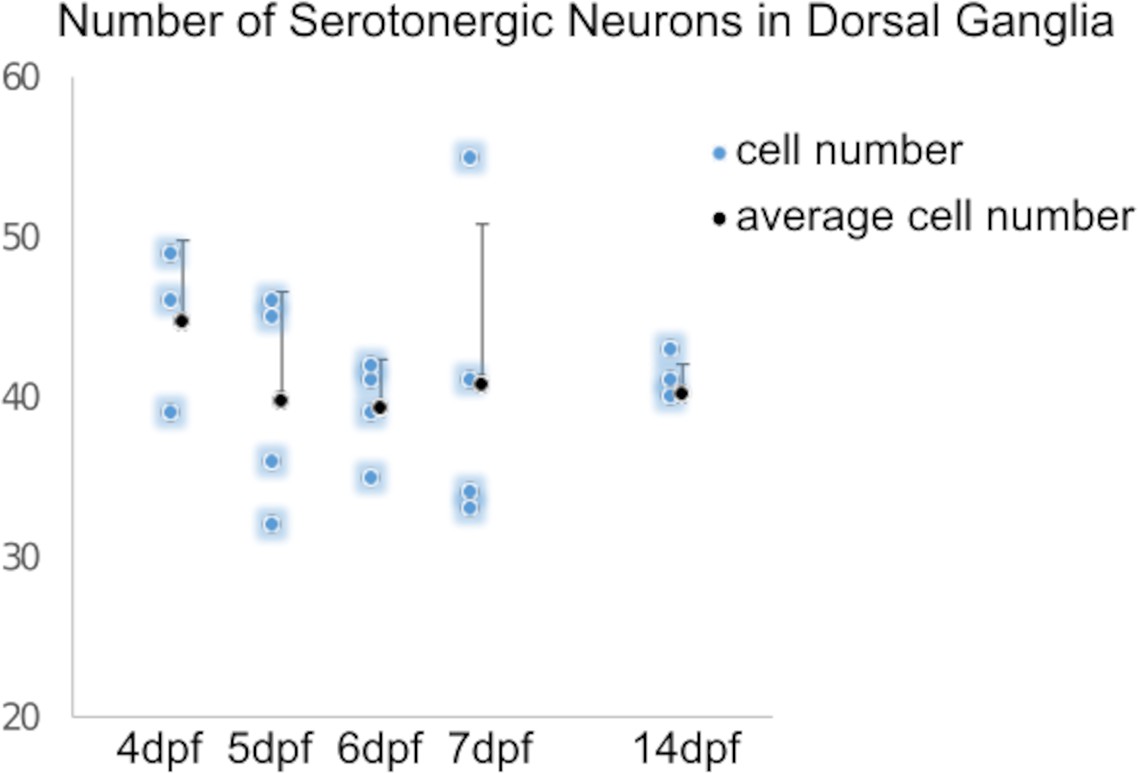
Quantification of serotonergic neurons in larvae shows a stable number of serotonergic neurons over time.
Serotonergic neurons were counted manually in Z-stack images of 5-HT immunostaining of larvae at different time points using Fiji image processing software.
Figure 2 with 2 supplements
Recapitulation of embryonic neural gene expression during regeneration.
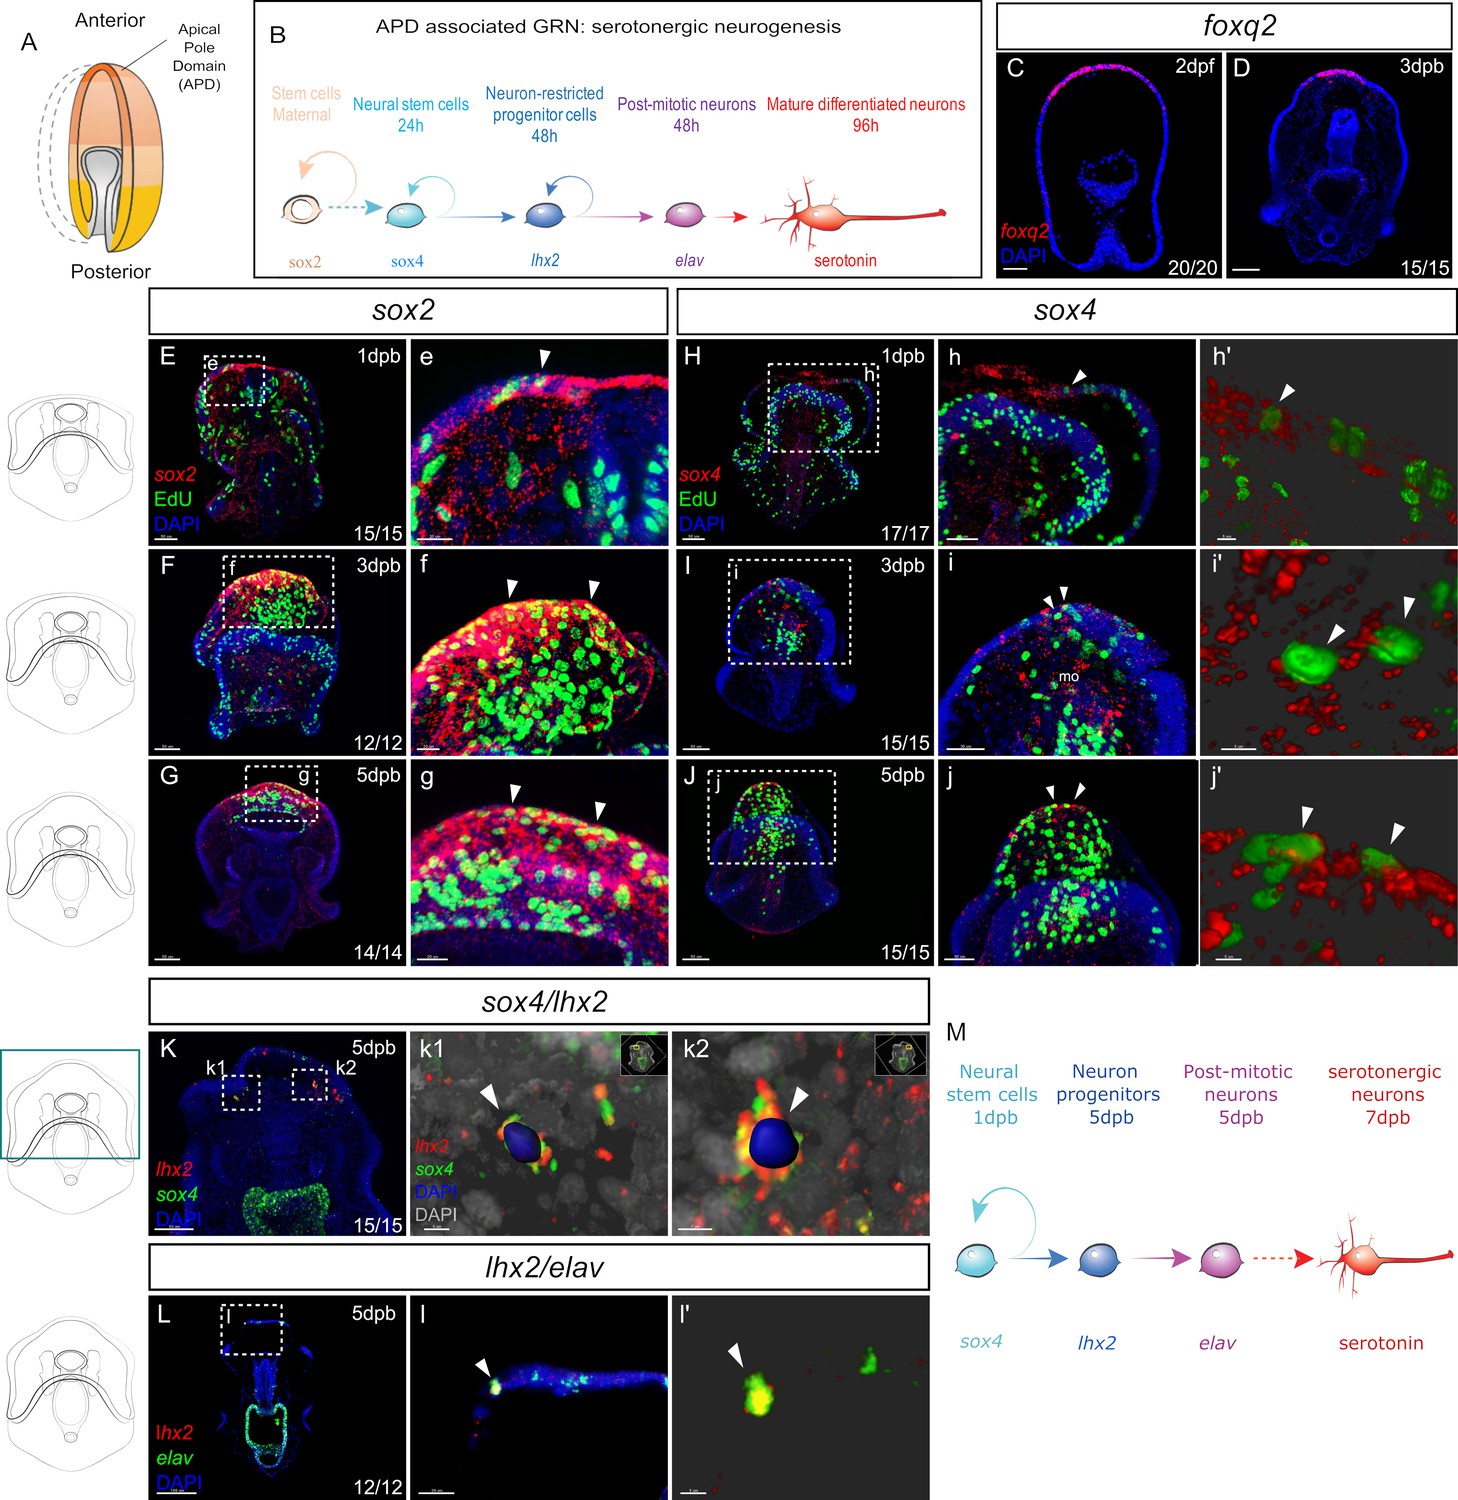
(A) In normal development, the embryonic apical pole domain (APD) gives rise to serotonergic neurons via the APD-associated neurogenesis pathway illustrated in (B). (C–D) Fluorescent in situ hybridization (FISH) of APD marker gene foxq2 in embryos (C) and in the leading edge of the regenerating larvae at three dpb (D). (E-j’) EdU labeled and FISH (EdU-FISH) results show that sox2 and sox4 are expressed in proliferative cells at the regeneration leading edge. (E–G) EdU-FISH of gene sox2. (e–g). Expanded view of the boxed area in (E–G). (E) Upon bisection, sox2+ cells are highly concentrated at the wound site and later in (F–G) at the regeneration leading edge. Throughout the time-course, sox2+ cells constantly undergo cell cycling (e–g). (H–J) EdU-FISH of sox4. (h–j). Expanded view of the boxed area in (H–J). (H). Upon bisection, sox4+ cells are detected at the regeneration leading edge and later in (I–J) expanded to the mouth. Throughout the time-course, sox4+ cells constantly undergo cell division (h–j). (h’-j’) 3D visualization of EdU + sox4+ cells using Imaris software, highlighted in (h–j), indicated by white arrowheads. This shows clear double detection of EdU and sox4: the EdU + nucleus is surrounded by sox4 signal. (K-i’) Double fluorescent in situ hybridization (FISH) shows the recapitulation of APD gene expression trajectory. (K) In 5dpb larvae, sox4 and lhx2 are co-expressed in cells at the lateral regeneration leading edge. (k1’-k2’) show the Imaris 3D reconstructed view of boxed areas k1 and k2. In the highlighted cells (arrowheads), nucleus labeled with DAPI is surrounded by both lhx2 and sox4 signals, indicating co-expression in the same cell. Scale bar in (c1): 5 µm; (c2): 7 µm. (L) In 5 dpb larvae, lhx2 and elav are co-expressed in cells at the lateral regeneration leading edge, scale bar: 100 µm. This is amplified in (l). (l’) shows the 3D reconstructed view of the cell marked by arrowheads in (l). (M) A proposed Model for the regeneration of neurons in sea star larvae. Dpb: day-post-bisection. Scale bar in (E–K): 50 µm; (L): 100 µm; (e–i,l): 20 µm; (j): 30 µm; (h’-j’,k1 and l’): 5 µm; (k2): 7 µm. Dpf: day-post fertilization; dpb: day-post bisection; mo, mouth. The numbers shown in the lower right corner of each image indicate the number of larvae showing a positive FISH signal among the larvae examined.
Figure 2—figure supplement 1

Whole-mount in situ hybridization (WMISH) results show the reconstruction of the AP body axis.
(A–D) WMISH of foxq2 which is normally expressed in the apical pole domain of the embryo. (A) Foxq2 expression is undetectable by WMISH in intact larvae (some nonspecific background staining is present in the stomach). Upon decapitation, (B) foxq2 is first expressed in the anterior-most regeneration leading edge at 3dpb. (C) Foxq2 expression remains concentrated at the regeneration leading edge by 5dpb. (D) Is a lateral view of a regenerating larva. The expression of foxq2 is detected in the anterior. (E–H) WMISH of six3 which is normally expressed in the anterior ectoderm of developing embryos. (E) Six3 is expressed at the bilaterally located coeloms in uncut 7dpf larvae. Upon decapitation, (F) Six3 expression is detected at the wound ectoderm and the regenerating coeloms in 1 dpb larva. (G–H) Six3 expression extends to the entire regenerated anterior. (I–K) WMISH of wnt3 which is normally expressed in the posterior ectoderm of embryos. (I) In intact larvae, wnt3 is expressed in the ciliary bands, marked by black arrowheads. It is also expressed in the mouth ectoderm indicated by the black arrow. Upon decapitation, (J) wnt3 is expressed in the posterior domain by 1dpb. (K) The expression extends to the entire foxq2-free posterior domain by 3dpb. Gene expression is highlighted in circles with black dashed line. Scale bar: 100 µm. RL, regeneration leading edge; co, coeloms; mo, mouth; CB, ciliary band; D, dorsal; V, ventral. About 30–50 larvae from two separate matings were analyzed in each in situs.
Figure 2—figure supplement 2
WMISH of embryonic neurogenic pathway genes during regeneration.
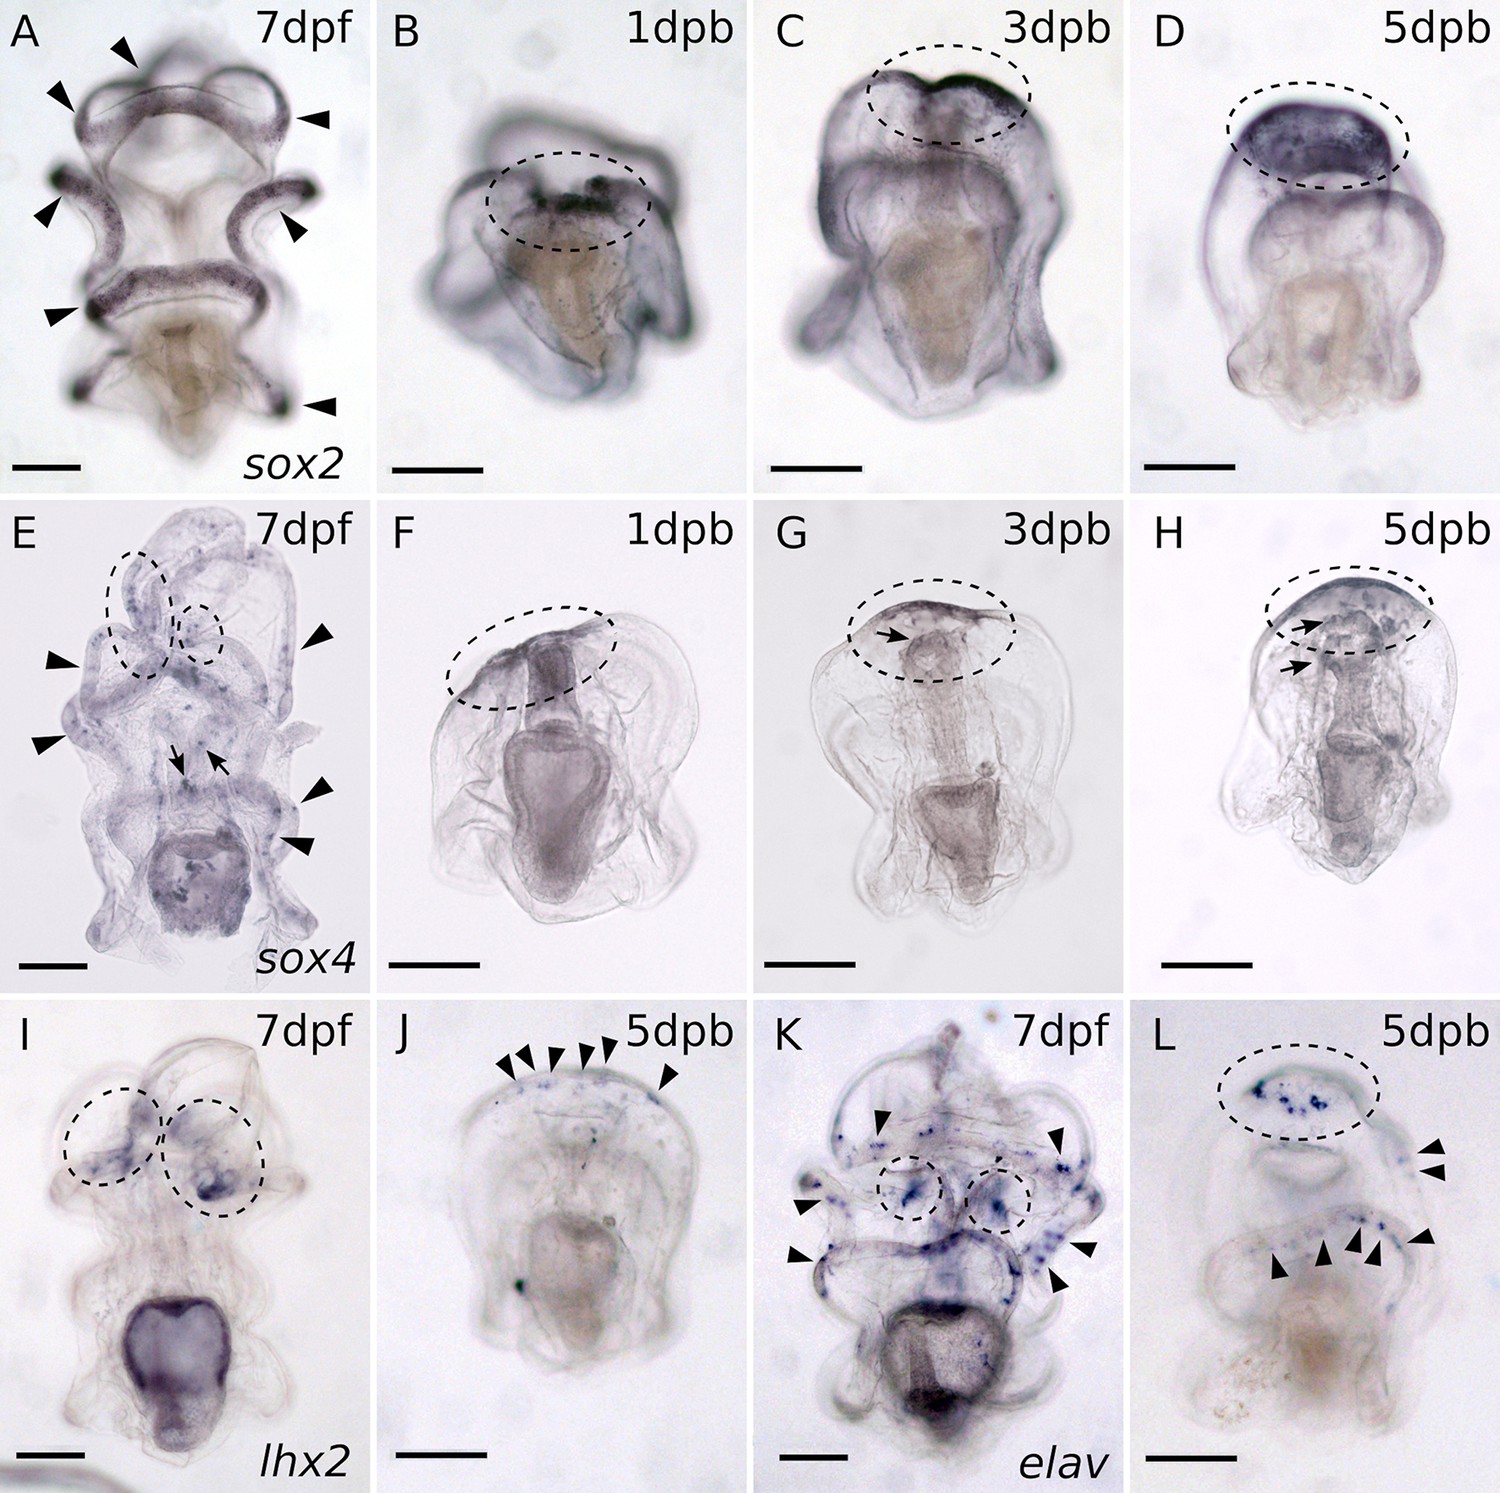
(A–D) WMISH of sox2. (A) In intact larvae, sox2 expression is detected in the ciliary band, indicated by the black arrowheads. (B) Upon bisection, sox2 is expressed at the wound site and then at the regeneration leading edge as shown in (C–D). (E–H) WMISH of sox4. (E) In intact larvae, sox4 expression is detected in the ciliary band, indicated by the black arrowheads, and in the mouth and foregut, marked by the arrows. Sox4 is also expressed in the dorsal ganglia, highlighted with black circles. (F) Upon bisection, sox4 expression is detected at the wound site and then in (G–H) at the regeneration leading edge, indicated by circles. In regenerating larvae, sox4 is also expressed in the oral cells, arrows in (G–H). (I–J) WMISH of lhx2. (I) Lhx2 is expressed at the dorsal ganglia in larvae. (J) In regenerating larvae, lhx2 expression is first detected at five dpb at the regeneration leading edge. (K–L) WMISH of gene elav. (K) Post-mitotic neuron marker elav is expressed along the ciliary bands (black arrowheads) and the dorsal ganglia (circles). (L) In 5 dpb regenerated larvae, elav expression is detected at the regenerated (circle) and remains in the post-oral ciliary band (arrowheads). Scale bar: 100 µm. Dpf: day-post fertilization; dpb: day-post bisection. About 30–50 larvae from two separate matings were analyzed in each in situs.
Figure 3 with 1 supplement
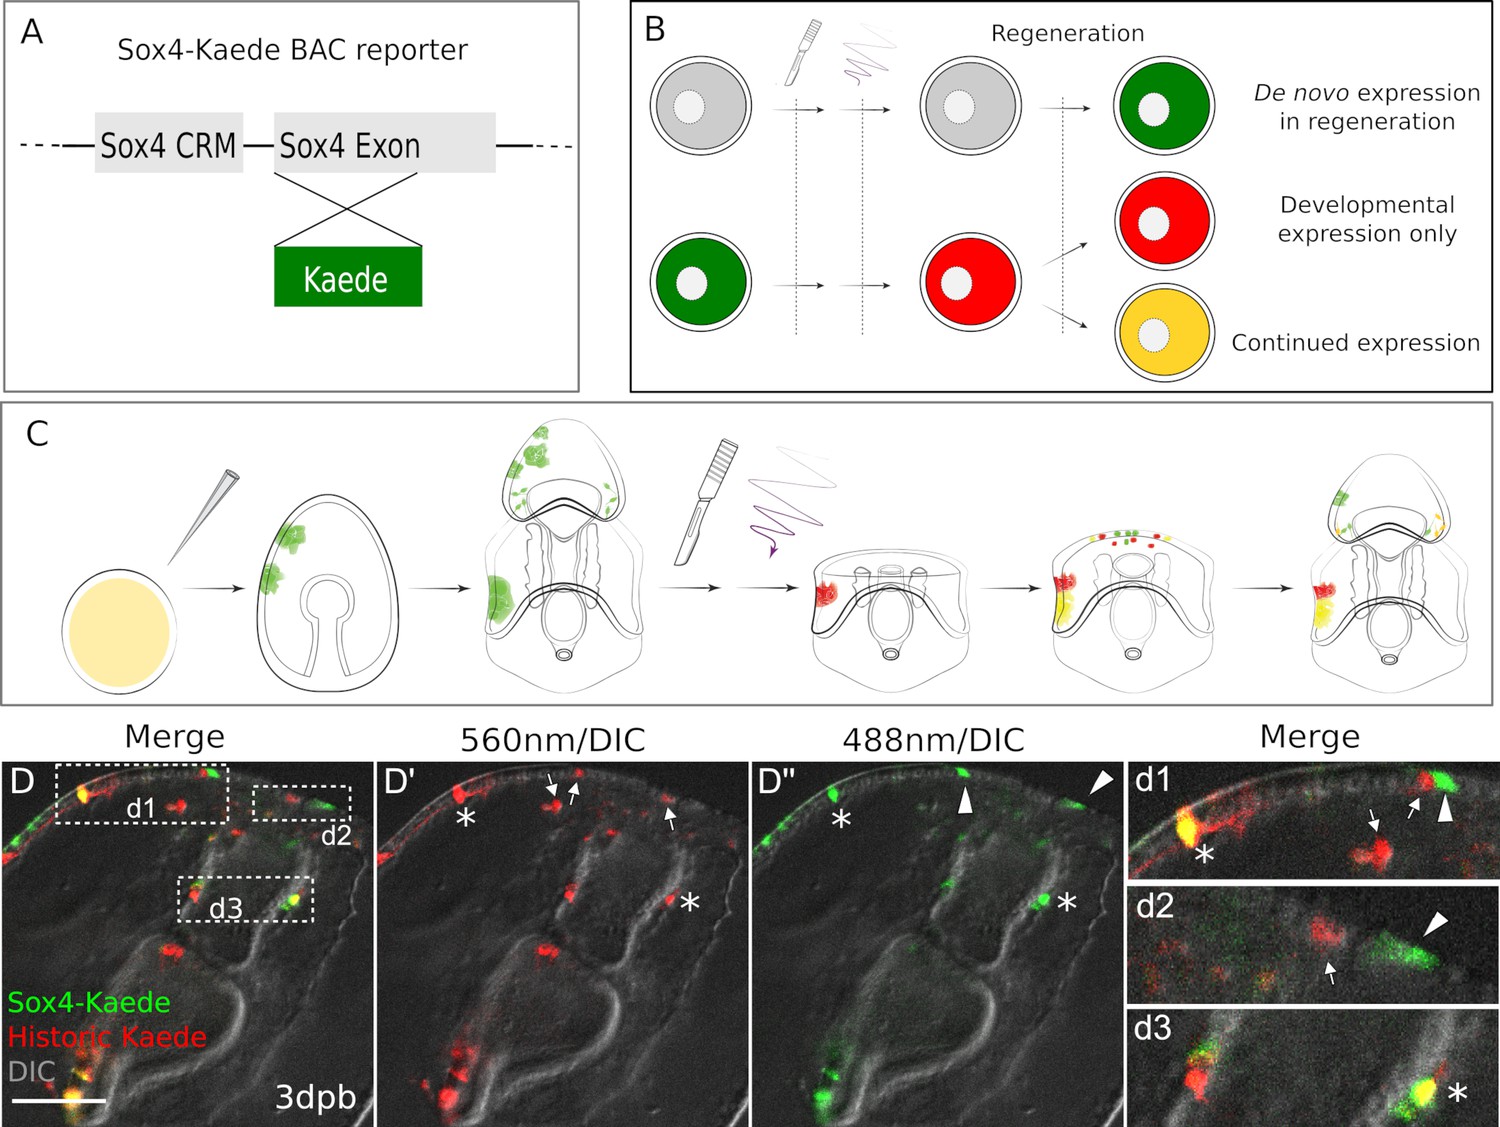
Existing and de novo Sox4+ lineages regenerate serotonergic neurons.
(A) The design of Sox4:Kaede BAC construct. (B–C) Design of photo-conversion experiment. Sea star zygotes are injected with the Sox4-Kaede BAC. Injected embryos are incubated till larvae for bisection. Photo-conversion is immediately performed on bisected posterior segments. After regenerating for periods of time as shown (dpb), larvae are observed to examine the Sox4+ lineages. (D) In Sox4-Kaede transgenic regenerating larvae, there are multiple sources of Sox4+ cells at the regeneration leading edge. Some Sox4+ cells are derived from the yellow, existing Sox4 lineage (marked by asterisks). Some Sox4+ cells are differentiated cells that no longer express Kaede (arrows). There are also green Sox4+ cells that are newly specified upon decapitation (arrowheads). The boxed areas in the regeneration leading edge are amplified in (d1), (d2) and (d3). Scale bar in (D): 50 µm. At least 30 regenerating larvae in two independent batches were examined.
-
Figure 3—source data 1
Quantification of Kaede colors and protein stability.
- https://cdn.elifesciences.org/articles/72983/elife-72983-fig3-data1-v2.xlsx
Figure 3—figure supplement 1

Stability of Kaede protein in P.miniata during development.
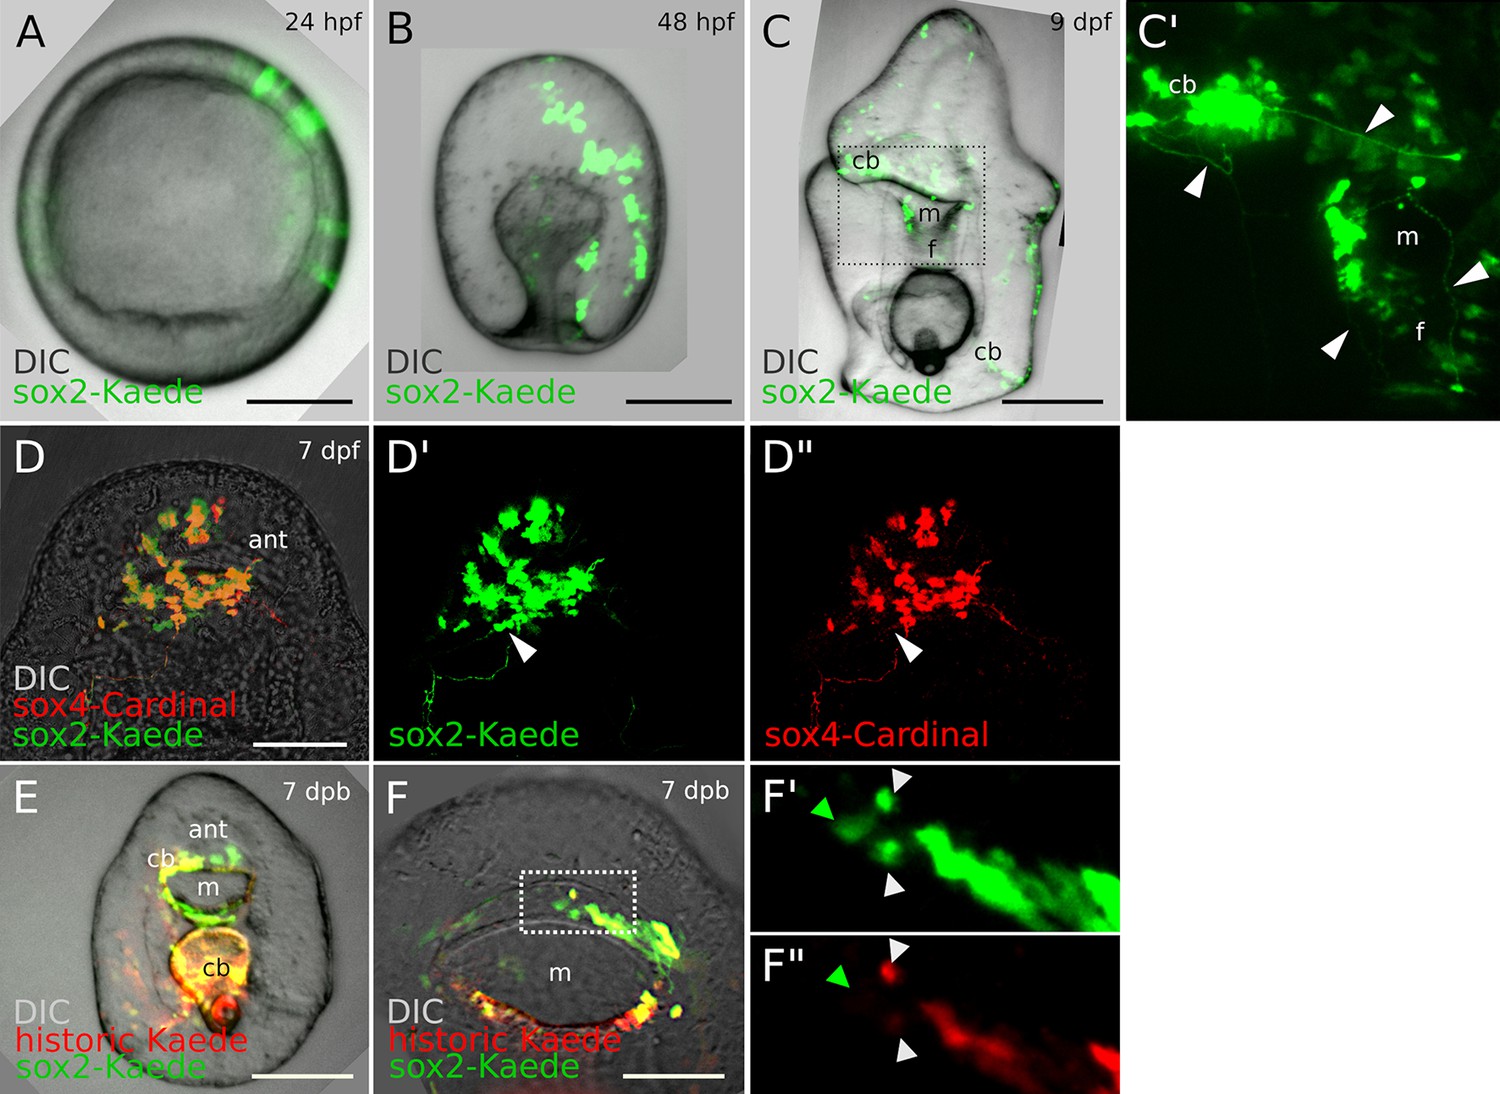
(A–E) Dynamics of photoconversion of Kaede protein. Kaede mRNAs were injected into fertilized eggs where they are endogenously translated by the embryos. Then we photoconverted the Kaede in injected embryos at 24 hpf. The embryos were imaged every 10 s during photoconversion, and then incubated in sea water for at least one week and were imaged again at larval stages. This experiment shows that Kaede proteins unconverted (green) and converted (red) are stably detected above background autofluorescence for at least one week after photoconversion. (A) Shows the fluorescent intensity (FI) of the green and red protein. (B) Photoconversion rate of Kaede protein. This rate is the ratio of the FI (red) over the FI (green). The 560 nm FI gradually increases as the 488 nm FI is progressively reducing with a converging point at ~50 s. (C) FI of Kaede protein at different time points. The 488 nm fluorescent intensity rises dramatically at two dpf, likely due to the continuous translation of kaede mRNA. Red and green proteins in the embryos remain confidently detectable above background in the larvae until at least seven dpf. Therefore, we conclude that the Kaede proteins can be effectively detected for 7 days. (D) Confocal images of the embryos during the photoconversion. (E) Detection of Kaede in larvae injected with kaede mRNA. This shows that Kaede can be stably detected for 7 days. (F-F”) Then we generated a sox4-Kaede BAC to trace the expression of sox4 at larval stages. The expression pattern of sox4-Kaede BAC recapitulates the sox4 mRNA expression data (SP. Figure 3), (E) Some of the sox4+ cells have clear neural phenotypes. Scale bar in (F): 100 μm; (F’-F”): 50 μm. Cb, ciliary band; cp, coelomic pouch; f, foregut; m, mouth; dpf, day post fertilization.
Figure 4
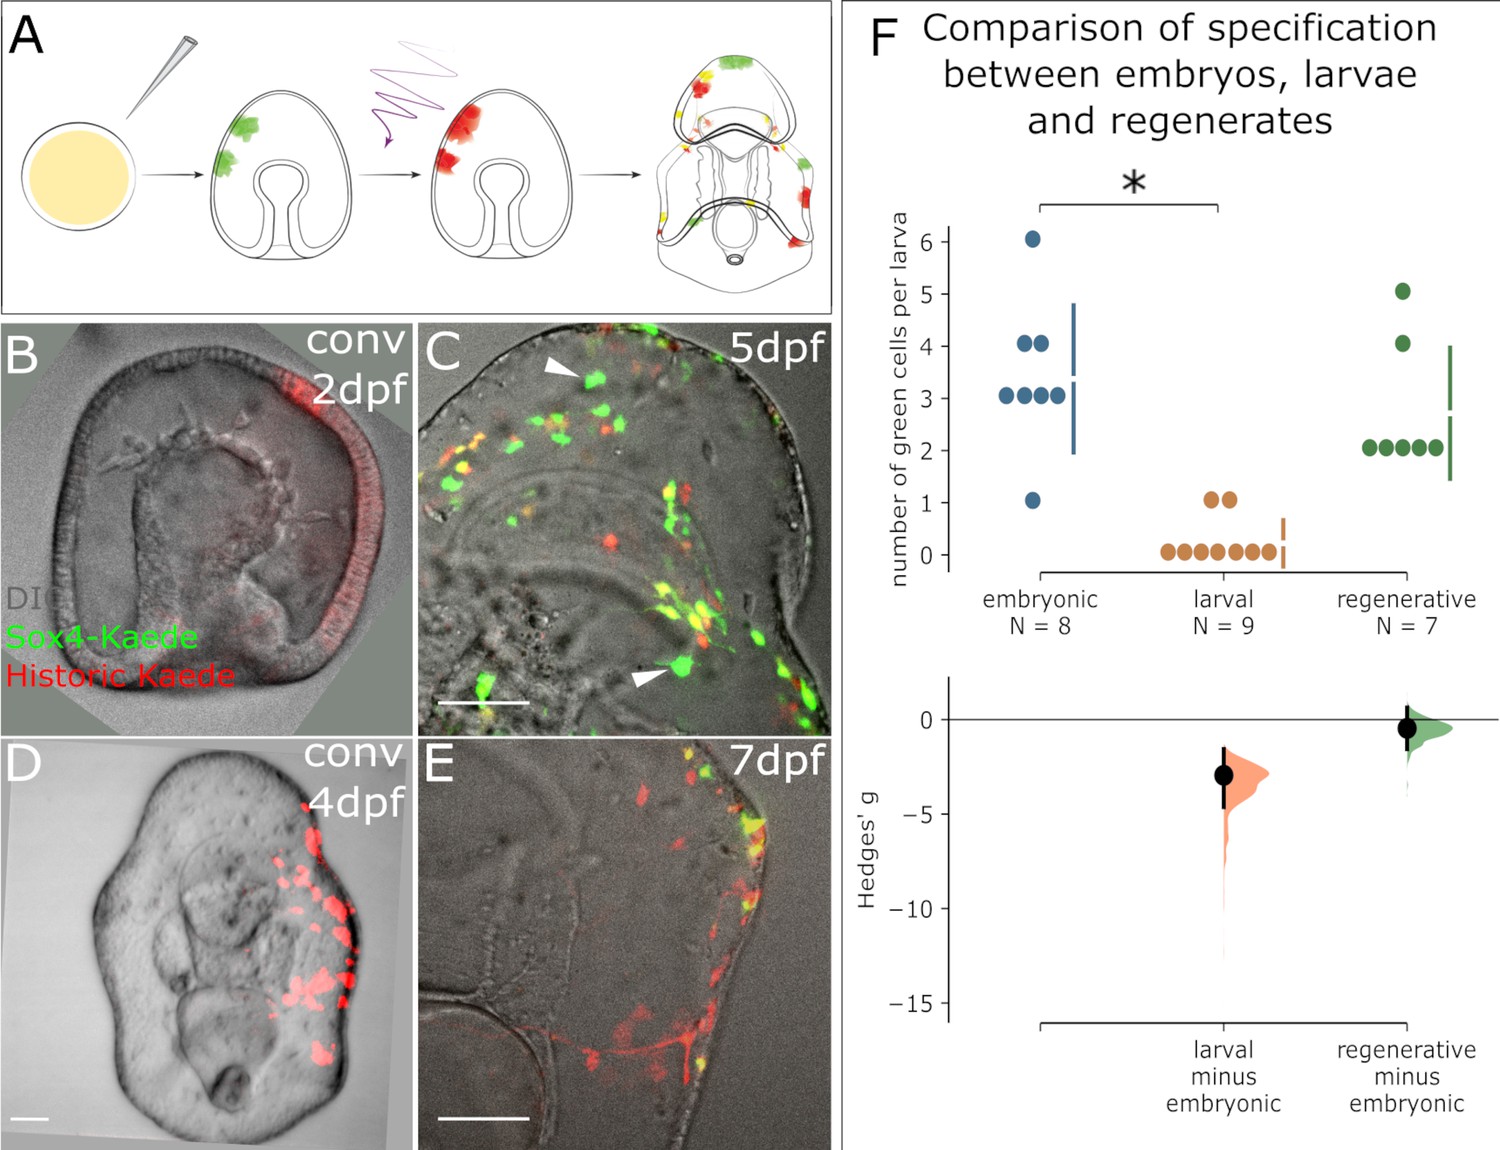
Appearance of new Sox4+ cells ends at the larval stage but resumes in regeneration.
(A) A schematic for the experimental plan to determine the source of normal larval Sox4+ cell lineage. Sox4:Kaede transgenic embryos were photoconverted at either embryonic stage or larval stage. Sox4 expression was examined three days later. (B) Embryo injected with Sox4-Kaede BAC is converted at 2dpf. Red Kaede localization therefore marks all labeled Sox4+ cells. (C) By 5dpf there are several newly specified, green Sox4+ cells indicated by arrowheads. However, (D) when converted at 4dpf (larval stage), only yellow cells and red cells are observed 3 days later as shown in (E), indicating no specification of Sox4+ cell occurs in the larva. (F) Quantification of Sox4 specification in embryos, larvae and regeneration. The Hedges' g for two comparisons against the embryonic group are shown in the above Cumming estimation plot. The raw data is plotted on the upper axes. On the lower axes, mean differences are plotted as bootstrap sampling distributions. Each mean difference is depicted as a dot. Each 95% confidence interval is indicated by the ends of the vertical error bars. Sox4+ cell specification event is close to 0 by 4dpf, significantly decreased compared to the embryonic (2dpf) state. Specification of Sox4+ cells is restored in regenerating larvae. Scale bar in (B–E): 50 µm. dpf: day-post-fertilization. At least 40 embryos were examined from five independent batches.
-
Figure 4—source data 1
Quantification of sox4 green cells.
- https://cdn.elifesciences.org/articles/72983/elife-72983-fig4-data1-v2.xlsx
Figure 5 with 2 supplements
Sox4+ cells are specified from Sox2+ cells at the regeneration leading edge.
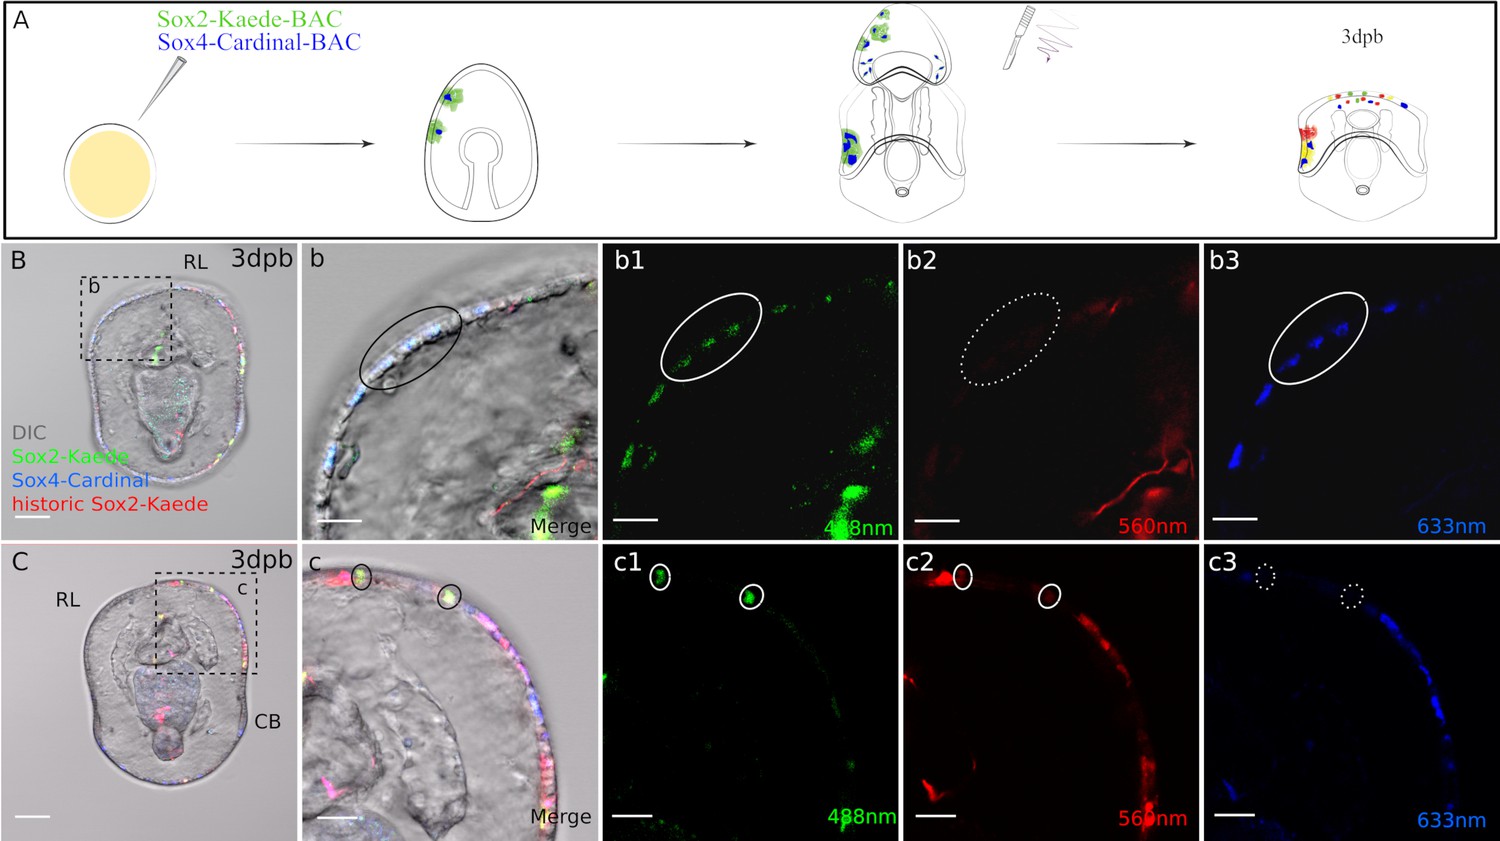
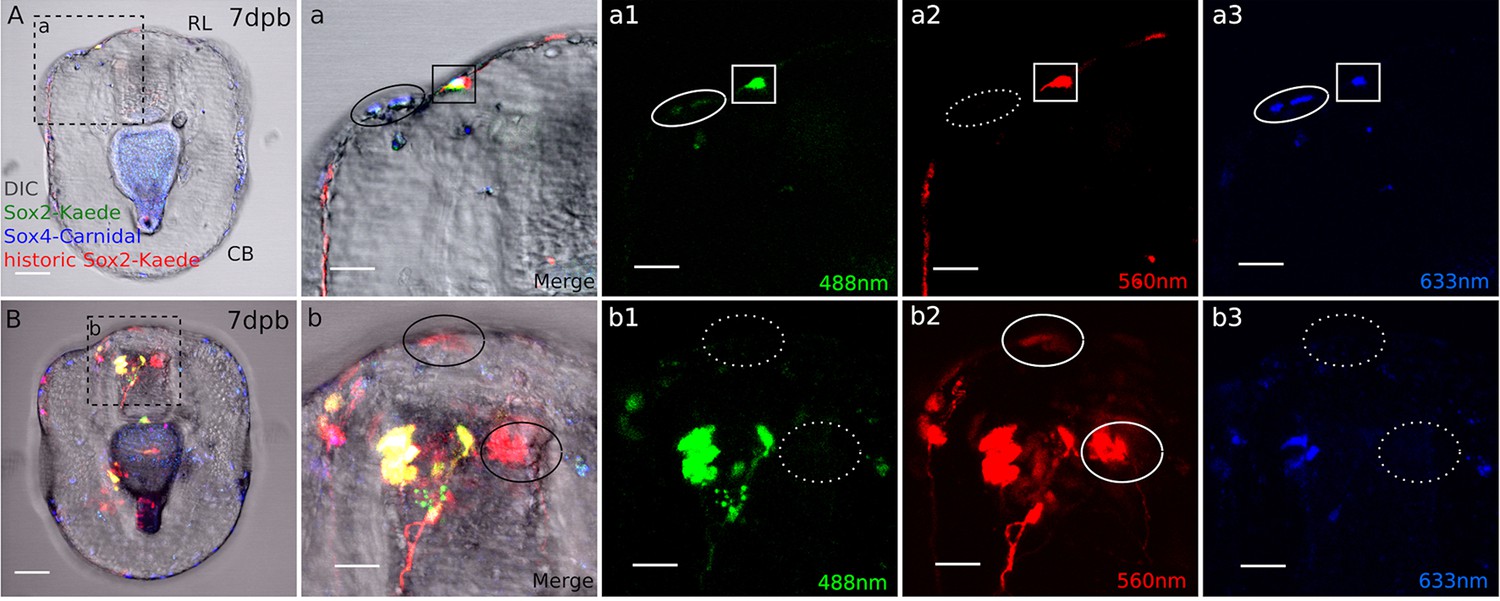
(A) Schematic representation of the experimental design. Two BACs: sox2:Kaede and sox4:Cardinal were coinjected. Seven days old transgenic larvae were bisected, Kaede protein was photoconverted immediately following bisection, then regenerated larvae were analysed at 3 days later. (B3) Some sox4+ cells at the regeneration leading edge are made from de novo sox2+ cells. Boxed area in (B) is amplified in (b). In 3dpb transgenic larvae, sox4+ cells with de novo sox2 expression are located at the lateral side of the regeneration leading edge (black solid circle). These cells have (b1) newly expressed, regenerative sox2:Kaede and (b3) sox4:Cardinal expression (both highlighted with white solid circle), (b2) but have no historic sox2:Kaede (white dotted circle). (C). Sox2+ cells at the regeneration leading edge have multiple sources. (c) Is the amplified view of the boxed area. Apart from the de novo sox2+ cells, there are also yellow, larval sox2 lineage at the regeneration leading edge (black solid circle). These cells do not enter sox4-mediated pathways. They are labeled with (c1) green and (c2) red Kaede (white solid circle), (c3) but not Cardinal (white dotted circle). Images B and C are representative of at least 15 observed samples. Scale bar in (B–C): 50 µm; (b–b3, c–c3): 20 µm; (d-d3). RL, regeneration leading edge; CB, ciliary band. Dpb: day-post-bisection. Sox2: Kaede (red, yellow, green) and Sox4: Cardinal (far red, false-colored to blue).
Figure 5—figure supplement 1
Expression pattern of sox2-Kaede BAC.
(A–B). Sox2 transgenic embryos. (C-C’). In the larval stage sox2+ cells are found in the ciliary band, mouth, and foregut. Some cells have clear long, axonal projections characteristic of neural morphology (arrowheads). The boxed area in (C) amplifies in C’. (D-D”). Normal transgenic larvae coexpressed two BACs: sox2:Kaede and sox4:Cardinal. This shows that the majority of sox2+ cell lineage are neurogenic and give rise to ectodermal sox4+ cells. Some sox2+ cells (white arrowheads) do not express sox4 BAC. (E-F”). In 7dpb regenerating larva sox2+ cells reused (yellow) and de novo (green, F’, F”) located in the restored mouth, ciliary band. The boxed area in (F) amplifies in (F’, F”). Scale bars in (A, B): 25 μm, in (C, D, E, F): 50 μm. Ant, anterior; cb, ciliary band; f, foregut; m, mouth. All confocal images (A-F”) are representative of at least ten observed samples from two independent batches.
Figure 5—figure supplement 2
Sox2+ cell lineage forms the regenerated nervous system.
(A). De novo sox2 cells form neurons through the sox4-mediated pathway in the regenerating anterior. (a) Amplification of boxed area in (A). There are two neurons at the lateral side of the regenerating anterior (black solid circle) derived from the newly specified sox2+/sox4+ cells. They contain (a1) regenerative green sox2-Kaede and (a3) blue sox4-Cardinal (white solid circle), (a2) but do not have historic sox2 expression (dotted white circle). Other than the de novo sox2+ cells, the existing sox2+ lineages also contribute to the regenerated neurons at the anterior marked by the black solid square in (a). (a1–a3). This neuron contains all three colors (white solid box), suggesting it is derived from the existing sox2+ cell lineage through sox4-mediated pathway. (B). Historic sox2+ cells present neural morphology. (b). There are red only, historic sox2+ neural cells at the regeneration leading edge and the oral domain (black solid circles). These cells are likely to be differentiated cells or cells taken other fates in regeneration, thus no longer express sox2. (b2). They contain the historic Kaede marker, (b1) but do not express new, green Kaede or (b3) Cardinal (white dotted circle). Scale bar in (A–B): 50 µm. RL, regeneration leading edge; CB, ciliary band. Images (A,B) are representative of at least eight analyzed samples from two separate batches.
Figure 6 with 1 supplement

Sox2+ cells fate specification (continued or de novo expression) does not depend on entering into the cell cycle during the early stage (upto 3dpb) of regeneration.
(A) Schematic representation of the experimental design. Sox2:Kaede transgenic larvae were bisected and photoconverted. The first dose of 25 µM aphidicolin or vehicle (0.08% DMSO) were applied after 3hpb, changed every 24 hr until 3dpb then the regenerated larvae were analyzed. (B-B”) To monitor the effect of aphidicolin on DNA synthesis, we used an EdU cell proliferation assay. 3dpb larvae in aphidicolin, DMSO or sea water solutions were incubated in 15 µM EdU for 1 hr. (C–D) Sox2-Kaede cell specification by three dpb under aphidicolin (D-D”) or vehicle (C-C”) treatment. Scale bar in (B-B”), (C-D) is 50 µm. Dpb: day-post-bisection. Hpb: hour-post-bisection. Arrowheads highlight de novo sox2 expression. The numbers shown in the lower right corner of (B-B’’) indicate the number of larvae analyzed. (C and D) images are representative of at least 15 transgenic samples from two independent batches. A percentage of yellow (re-used) and green (de novo) Kaede expressing cells at the wound site during vehicle or drug admission are 71.6 and 2.1; 80 and 1.7 correspondent (Figure 6—source data 1).
-
Figure 6—source data 1
Quantification of sox2 cells under drug/vehicle treatment.
- https://cdn.elifesciences.org/articles/72983/elife-72983-fig6-data1-v2.xlsx
Figure 6—figure supplement 1

Aphidicolin or vehicle treated bisected larvae during one week of regeneration.
(A) Schematic representation of the experimental design. The first dose of 25 µM aphidicolin or vehicle (0.08% DMSO) were applied after 3hpb, changed every 24 hr until the regenerated larvae were analyzed. To test the drug leakage possibility the larvae were analyzed every 24 hr using an EdU cell proliferation assay. Drug or DMSO-treated samples were incubated in 15 µM EdU for 1 hr. (B–G) Representative confocal images at different regeneration time points: (B) 1dpb, (C) 2dpb, (D) 3dpb, (E) 4dpb, (F) 5dpb, (G) 6dpb. Scale bar in (B–G): 50 µm. Dpb: day-post bisection. At least 15 larvae were examined from two independent batches for each time point. The numbers shown in the lower right corner of (B–G) indicate the number of larvae analyzed.
Tables
Key resources table
| Reagent type (species) or resource | Designation | Source or reference | Identifiers | Additional information |
|---|---|---|---|---|
| Commercial assay or kit | Label IT Nucleic Acid Labeling Kit, DNP | Mirus | MIR 3825 | |
| Commercial assay or kit | TSA Plus System | Perkin Elmer | NEL753001KT | |
| Commercial assay or kit | DIG RNA Labeling Kit (SP6/T7) | Roche | 11175025910 | |
| Commercial assay or kit | Click-iT Plus EdU Cell Proliferation Kit for Imaging, Alexa Fluor 488 dye | Invitrogen | C10637 | |
| Commercial assay or kit | mMESSAGE mMachine T7 transcription kit | Thermo- Fisher Scientific | AM1344 | |
| Antibody | Sheep polyclonal anti-digoxigenin AP-conjugate | Roche | 11093274910,RRID:AB_2734716 | IHC (1:2000) |
| Antibody | Sheep polyclonal anti-digoxigenin POD-conjugate | Roche | 1120773391,RRID:AB_514500 | IHC (1:2000) |
| Antibody | anti-DNP HRP-conjugate | Perkin Elmer | FP1129,RRID:AB_2629439 | IHC (1:500) |
| Antibody | Rabbit polyclonal anti-serotonin | Sigma | S5545,RRID:AB_477522 | IHC (1:250) |
| Antibody | Mouse monoclonal1E11 | DSHB (Nakajima et al., 2004) | IHC (1:5) | |
| Antibody | Goat anti-mouse polyclonalCy3 | Jackson Immuno- research | 115-165-146,RRID:AB_2491007 | IHC (1:2000) |
| Antibody | Goat anti-rabbit polyclonalCy3 | Jackson Immuno- research | 115-165-144 | IHC (1:2000) |
| Antibody | Goat anti-rabbit polyclonalAlexa Fluor 488 | Invitrogen | A11008,RRID:AB_143165 | IHC (1:1000) |
| Recombinant DNA reagent | sox2:Kaede BAC | This paper | http://echinobase.org | |
| Recombinant DNA reagent | sox4:Kaede BAC | This paper | http://echinobase.org | |
| Recombinant DNA reagent | sox4:mCardinal BAC | This paper | http://echinobase.org | |
| Recombinant DNA reagent | sox4:GFP BAC | This paper | http://echinobase.org | |
| Chemical compound, drug | Aphidicolin | Sigma | A0781 | 25 μM |
| Software, algorithm | Fiji | Fiji(http://fiji.sc) | RRID:SCR_002285 | |
| Software, algorithm | Inkscape | Inkscape(https://inkscape.org/en/) | RRID:SCR_014479 | |
| Software, algorithm | GNU Image Manipulation Program | GIMP(http://www.gimp.org) | RRID:SCR_003182 | |
| Software, algorithm | Imaris | Imaris(http://www.bitplane.com/imaris/imaris) | RRID:SCR_007370 |
Additional files
-
Supplementary file 1
Primers for probe amplification.
- https://cdn.elifesciences.org/articles/72983/elife-72983-supp1-v2.xlsx
-
Supplementary file 2
List of antibodies.
- https://cdn.elifesciences.org/articles/72983/elife-72983-supp2-v2.xlsx
-
Supplementary file 3
List of BAC.
- https://cdn.elifesciences.org/articles/72983/elife-72983-supp3-v2.xlsx
-
Transparent reporting form
- https://cdn.elifesciences.org/articles/72983/elife-72983-transrepform1-v2.docx
Download links
A two-part list of links to download the article, or parts of the article, in various formats.
Downloads (link to download the article as PDF)
Open citations (links to open the citations from this article in various online reference manager services)
Cite this article (links to download the citations from this article in formats compatible with various reference manager tools)
Regeneration of the larval sea star nervous system by wounding induced respecification to the Sox2 lineage
eLife 11:e72983.
https://doi.org/10.7554/eLife.72983


