Taller height and risk of coronary heart disease and cancer: A within-sibship Mendelian randomization study
- Medical Research Council Integrative Epidemiology Unit, Population Health Sciences, University of Bristol, United Kingdom
- Population Health Sciences, Bristol Medical School, University of Bristol, Barley House, Oakfield Grove, United Kingdom
- K.G. Jebsen Center for Genetic Epidemiology, Department of Public Health and Nursing, NTNU, Norwegian University of Science and Technology, Norway
- HUNT Research Center, Department of Public Health and Nursing, NTNU, Norwegian University of Science and Technology, Norway
- Clinic of Medicine, St. Olavs Hospital, Trondheim University Hospital, Norway
- Department of Endocrinology, Clinic of Medicine, St. Olavs Hospital, Trondheim University Hospital, Norway
Figures
Figure 1
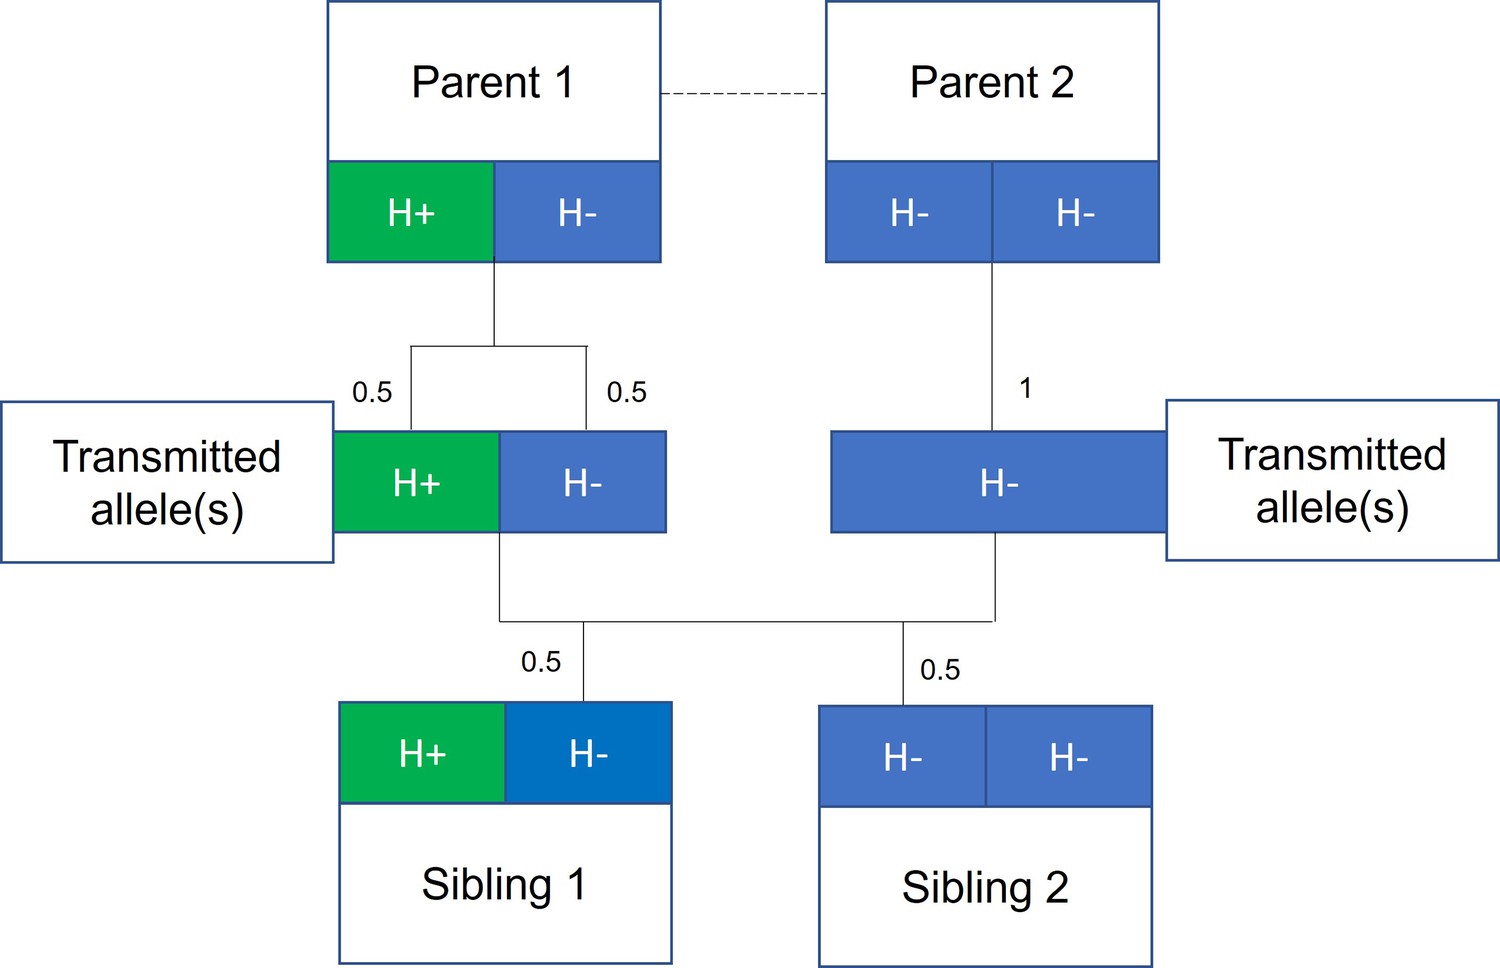
Mendelian randomization within families.
The random allocation of alleles within a parent-offspring quad (two parents and two offspring), initially observed by Mendel, is illustrated. Consider a height influencing genetic variant H where on average individuals with the H+ allele are taller than individuals with the H- allele. From Mendel’s law of segregation, parent 1, who is heterozygous at this allele, has an equal chance of transmitting either an H+ or H- allele to offspring. Parent 2, homozygous at this allele, will always transmit a copy of the H- allele. It follows that 50% of this pair’s offspring will be heterozygous (as parent 1) and 50% will be homozygous for the H- allele (as parent 2). On average, the heterozygous offspring will be taller than the homozygous H- offspring, with this difference a consequence of random segregation of gametes.
Figure 2

Taller height and risk of coronary heart disease and cancer.
The meta-analysis results from four different models used to evaluate the effect of height on coronary heart disease (CHD) and cancer risk are displayed. First, a phenotypic population model with measured height as the exposure and age and sex included as covariates. Second, a within-sibship phenotypic model with the family mean height included as an additional covariate to account for family structure. Third, a population Mendelian randomization model with height polygenic score (PGS) as the exposure exploiting advantageous properties of genetic instruments. Fourth, a within-sibship Mendelian randomization model with the family mean PGS included as a covariate to control for parental genotypes. Across all four models, we found consistent evidence that taller height reduces the odds of CHD and increases the odds of cancer.
Figure 3
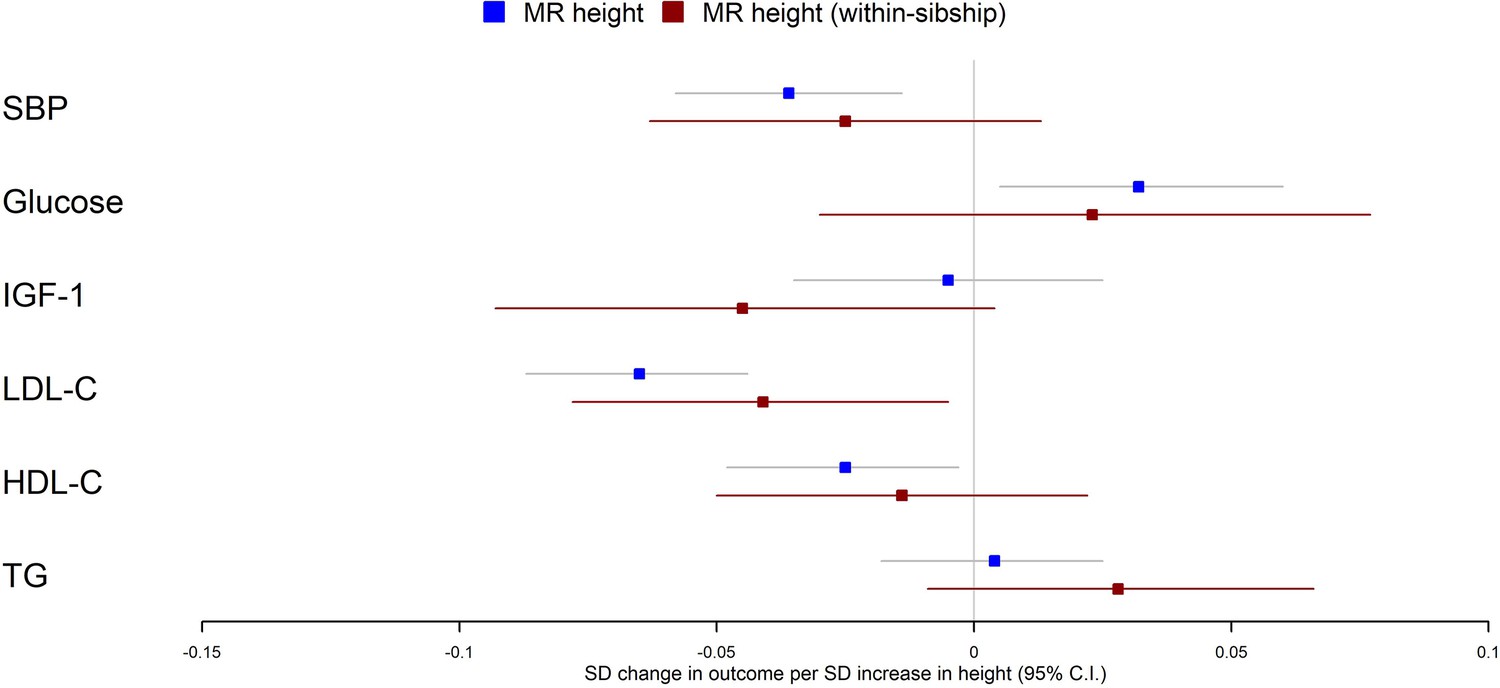
Mendelian randomization estimates of the effects of taller height on biomarkers.
The meta-analysis results from population and within-sibship Mendelian randomization analyses estimating the effect of taller height on biomarkers across UK Biobank and HUNT are shown. The estimates were broadly similar between the two models, suggesting the modest effects of demography and indirect genetic effects.
Tables
Table 1
UK Biobank and HUNT study characteristics.
Information on the UK Biobank and Norwegian HUNT studies, including descriptive of the sibling samples, is given.
| UK Biobank | HUNT | |
|---|---|---|
| Sibling sample:N individuals (N sibships) | 40,275 (19,588) | 38,723 (15,179) |
| Recruitment period:years | 2006–2010 | HUNT2 (1995–97)HUNT3 (2006–08) |
| Year of birth:median (Q1, Q3) | 1950 (1945, 1956) | 1951 (1937, 1963) |
| Sex:male (%) | 42.2 | 48.7 |
| Male height (cm):mean (SD) | 175.7 (6.7) | 177.6 (6.7) |
| Female height (cm):mean (SD) | 162.4 (6.2) | 164.4 (6.3) |
| Coronary heart disease:N cases (% of sample) | 3006 (7.5%) | 6447 (16.6%) |
| Cancer:N cases (% of sample) | 6724 (16.5%) | 2323 (6.0%) |
Table 2
Mendelian randomization (MR) results: change in outcome (SD units), per 1 SD increase in height.
Population and within-sibship MR estimates of height on the eight different outcomes are shown. The presented estimates are from UK Biobank, HUNT, and the combined fixed-effects meta-analysis. The heterogeneity p-value refers to the difference between the UK Biobank and HUNT estimates.
| Outcome | Model | UK Biobank | HUNT | Combined | Study heterogeneityp-value |
|---|---|---|---|---|---|
| Systolic blood pressure | Population | –0.044 (–0.074, –0.015) | –0.025 (–0.057, 0.008) | –0.036 (–0.058, –0.014) | 0.38 |
| Within-sibship | –0.077 (–0.137, –0.017) | 0.010 (–0.040, 0.059) | –0.025 (–0.063, 0.013) | 0.03 | |
| High-density lipoprotein cholesterol | Population | –0.039 (–0.070, –0.008) | –0.010 (–0.043, 0.024) | –0.025 (–0.048, –0.003) | 0.21 |
| Within-sibship | –0.038 (–0.096, 0.021) | 0.001 (–0.046, 0.047) | –0.014 (–0.050, 0.022) | 0.31 | |
| Low-density lipoprotein cholesterol | Population | –0.066 (–0.095, –0.036) | –0.065 (–0.098, –0.032) | –0.065 (–0.087, –0.044) | 0.99 |
| Within-sibship | –0.083 (–0.141, –0.025) | –0.014 (–0.061, 0.033) | –0.041 (–0.078, –0.005) | 0.07 | |
| Triglycerides | Population | 0.011 (–0.018, 0.040) | –0.006 (–0.038, 0.027) | 0.004 (–0.018, 0.025) | 0.43 |
| Within-sibship | 0.024 (–0.034, 0.081) | 0.032 (–0.018, 0.082) | 0.028 (–0.009, 0.066) | 0.84 | |
| Glucose | Population | 0.032 (0.005, 0.060) | N/A | 0.032 (0.005, 0.060) | N/A |
| Within-sibship | 0.023 (–0.030, 0.077) | N/A | 0.023 (–0.030, 0.077) | N/A | |
| IGF-1 | Population | –0.005 (–0.035, 0.025) | N/A | –0.005 (–0.035, 0.025) | N/A |
| Within-sibship | –0.045 (–0.093, 0.004) | N/A | –0.045 (–0.093, 0.004) | N/A | |
| Cancer (OR) | Population | 1.12 (1.04, 1.20) | 0.99 (0.88, 1.12) | 1.09 (1.02, 1.16) | 0.089 |
| Within-sibship | 1.21 (1.03, 1.42) | 1.12 (0.90, 1.39) | 1.18 (1.03, 1.34) | 0.57 | |
| Coronary heart disease (OR) | Population | 0.94 (0.84, 1.04) | 0.88 (0.80, 0.96) | 0.90 (0.84, 0.96) | 0.33 |
| Within-sibship | 0.81 (0.65, 1.02) | 0.88 (0.77, 1.00) | 0.86 (0.77, 0.97) | 0.55 |
Additional files
-
Supplementary file 1
Supplementary tables.
(a) contains the different variables and codes used to define coronary heart disease, all cancers, and subset of cancer disease outcomes in UK Biobank. (b) contains population and within-sibship associations between measured height and the eight different outcomes. Presented estimates are from UK Biobank, HUNT, and the combined fixed-effects meta-analysis. The heterogeneity p-value refers to the difference between the UK Biobank and HUNT estimates. (c) contains population and within-sibship associations between the height polygenic score (PGS) and the eight different outcomes. Estimates are presented from UK Biobank and HUNT. (d) contains population and within-sibship associations between three height-related measures (leg length, trunk length, and leg/trunk ratio) and cancer and coronary heart disease from UK Biobank. Height associations are presented for comparison. (e) contains population and within-sibship phenotypic and Mendelian randomization estimates for height on a set of cancer subtypes with limited prior evidence for association with height. Estimates for the ‘all cancers’ outcome are included for comparison. This analysis was conducted in UK Biobank only.
- https://cdn.elifesciences.org/articles/72984/elife-72984-supp1-v2.docx
-
Transparent reporting form
- https://cdn.elifesciences.org/articles/72984/elife-72984-transrepform1-v2.docx
Download links
A two-part list of links to download the article, or parts of the article, in various formats.
Downloads (link to download the article as PDF)
Open citations (links to open the citations from this article in various online reference manager services)
Cite this article (links to download the citations from this article in formats compatible with various reference manager tools)
Taller height and risk of coronary heart disease and cancer: A within-sibship Mendelian randomization study
eLife 11:e72984.
https://doi.org/10.7554/eLife.72984


