Effects of IFIH1 rs1990760 variants on systemic inflammation and outcome in critically ill COVID-19 patients in an observational translational study
- Unidad de Cuidados Intensivos Cardiológicos. Hospital Universitario Central de Asturias, Spain
- Centro de Investigación Biomédica en Red (CIBER)-Enfermedades Respiratorias. Instituto de Salud Carlos III, Spain
- Instituto de Investigación Sanitaria del Principado de Asturias, Spain
- Instituto Universitario de Oncología del Principado de Asturias, Spain
- Unidad de Cuidados Intensivos Polivalente. Hospital Universitario Central de Asturias, Spain
- Red de Investigación Renal (REDINREN), Spain
- Servicio de Inmunología. Hospital Universitario Central de Asturias, Spain
- Area de Gestión Clínica de Pediatría. Hospital Universitario Central de Asturias, Spain
- Department of Anesthesiology and Operative Intensive Care Medicine CCM/CVK, Charité - Universitätsmedizin Berlin, corporate member of Freie Universität Berlin, Humboldt Universität zu Berlin, and Berlin Institute of Health, Germany
- Servicio de Genética Molecular. Hospital Universitario Central de Asturias, Spain
- Servicio de Microbiología. Hospital Universitario Central de Asturias, Spain
- Universidad de Oviedo, Spain
- Servicio de Informática. Hospital Universitario Central de Asturias, Spain
- Critical Care Center, Hospital Universitari Parc Taulí, Institut D'Investigació I Innovació Parc Taulí I3PT, Universitat Autònoma de Barcelona, Spain
- Servicio de Bioquímica Clínica. Hospital Universitario Central de Asturias, Spain
Figures
Figure 1
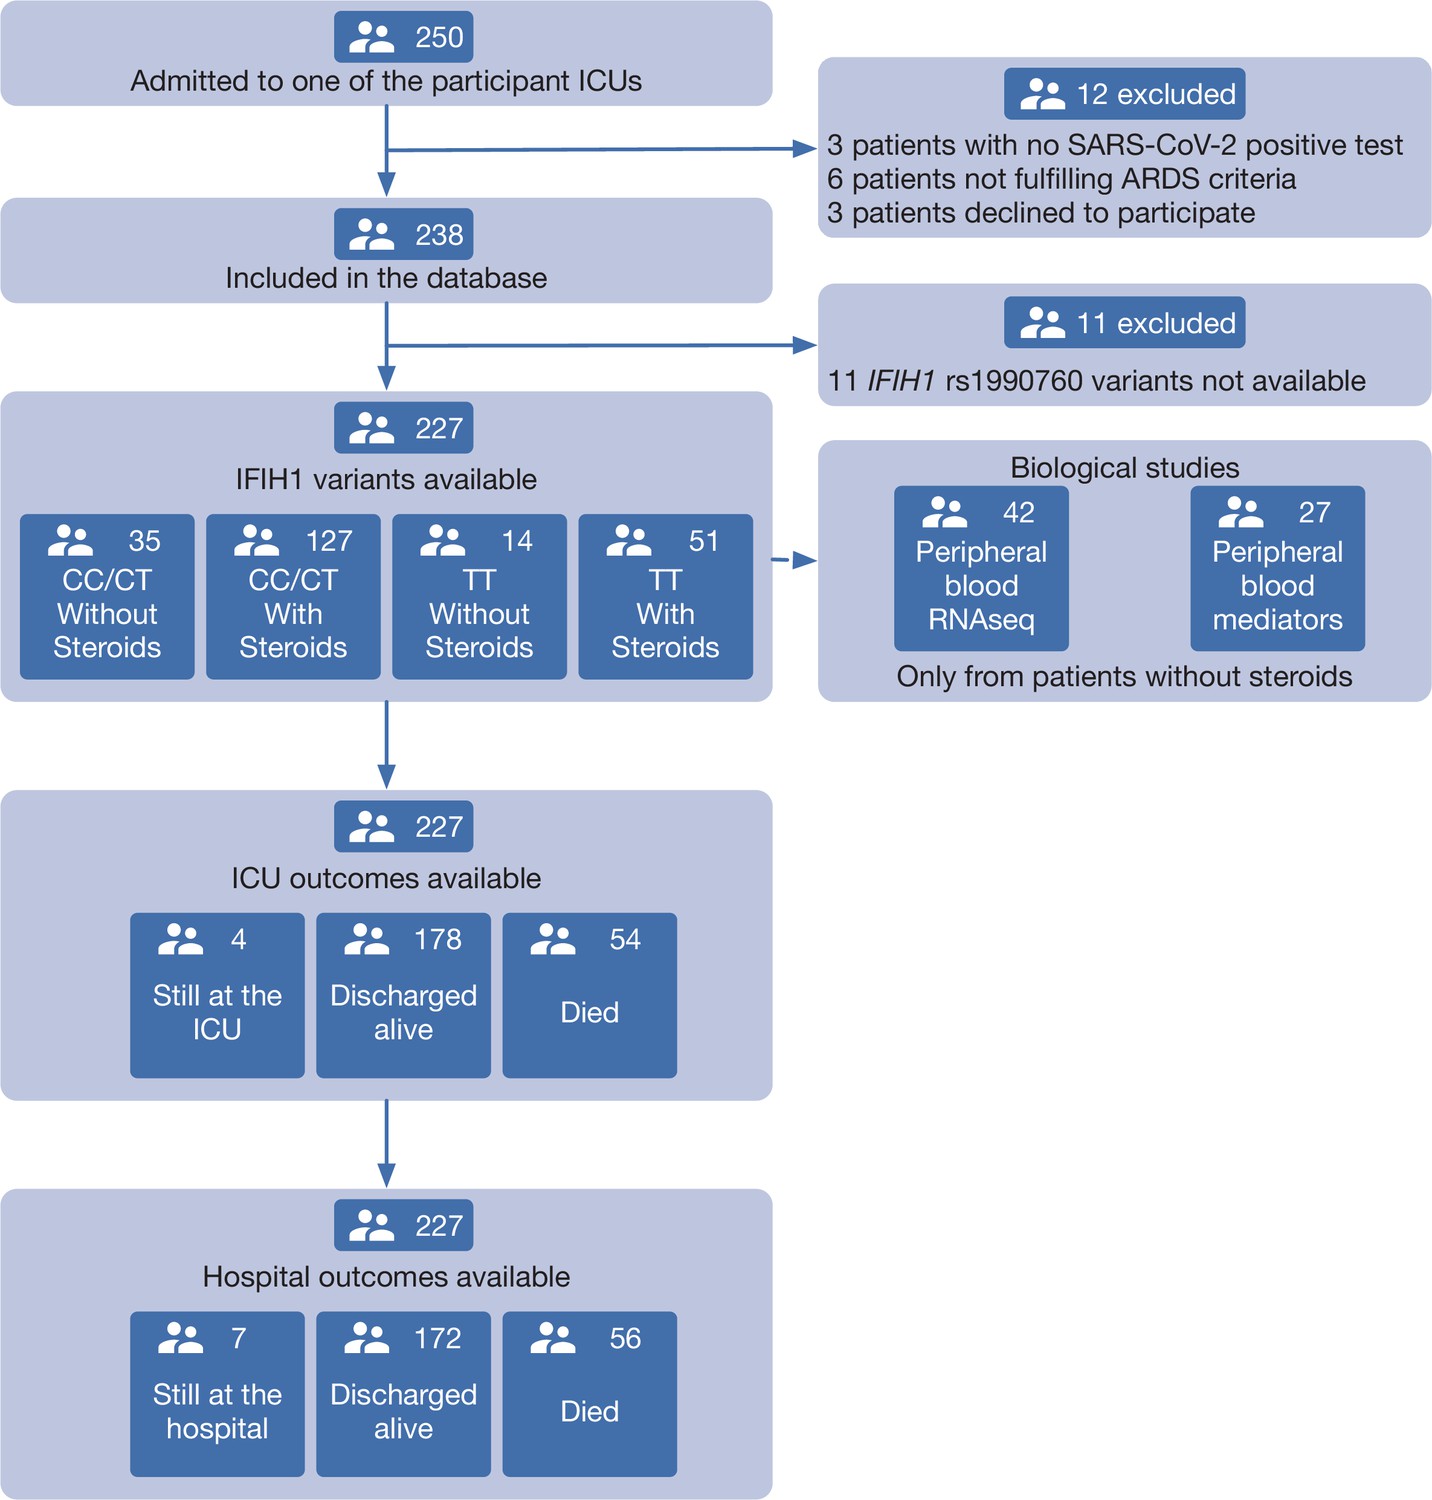
Patient study flow chart.
From 250 patients admitted to the participant ICUs during the study period, 227 were included in the study and classified according to the IFIH1 rs1990760 variants and prescription of steroid therapy. Peripheral blood samples for gene expression (N=41) and quantification of immune mediators (N=28) were taken in the first day after ICU admission in patients not receiving steroids. All patients were followed up until death or hospital discharge.
Figure 2 with 3 supplements
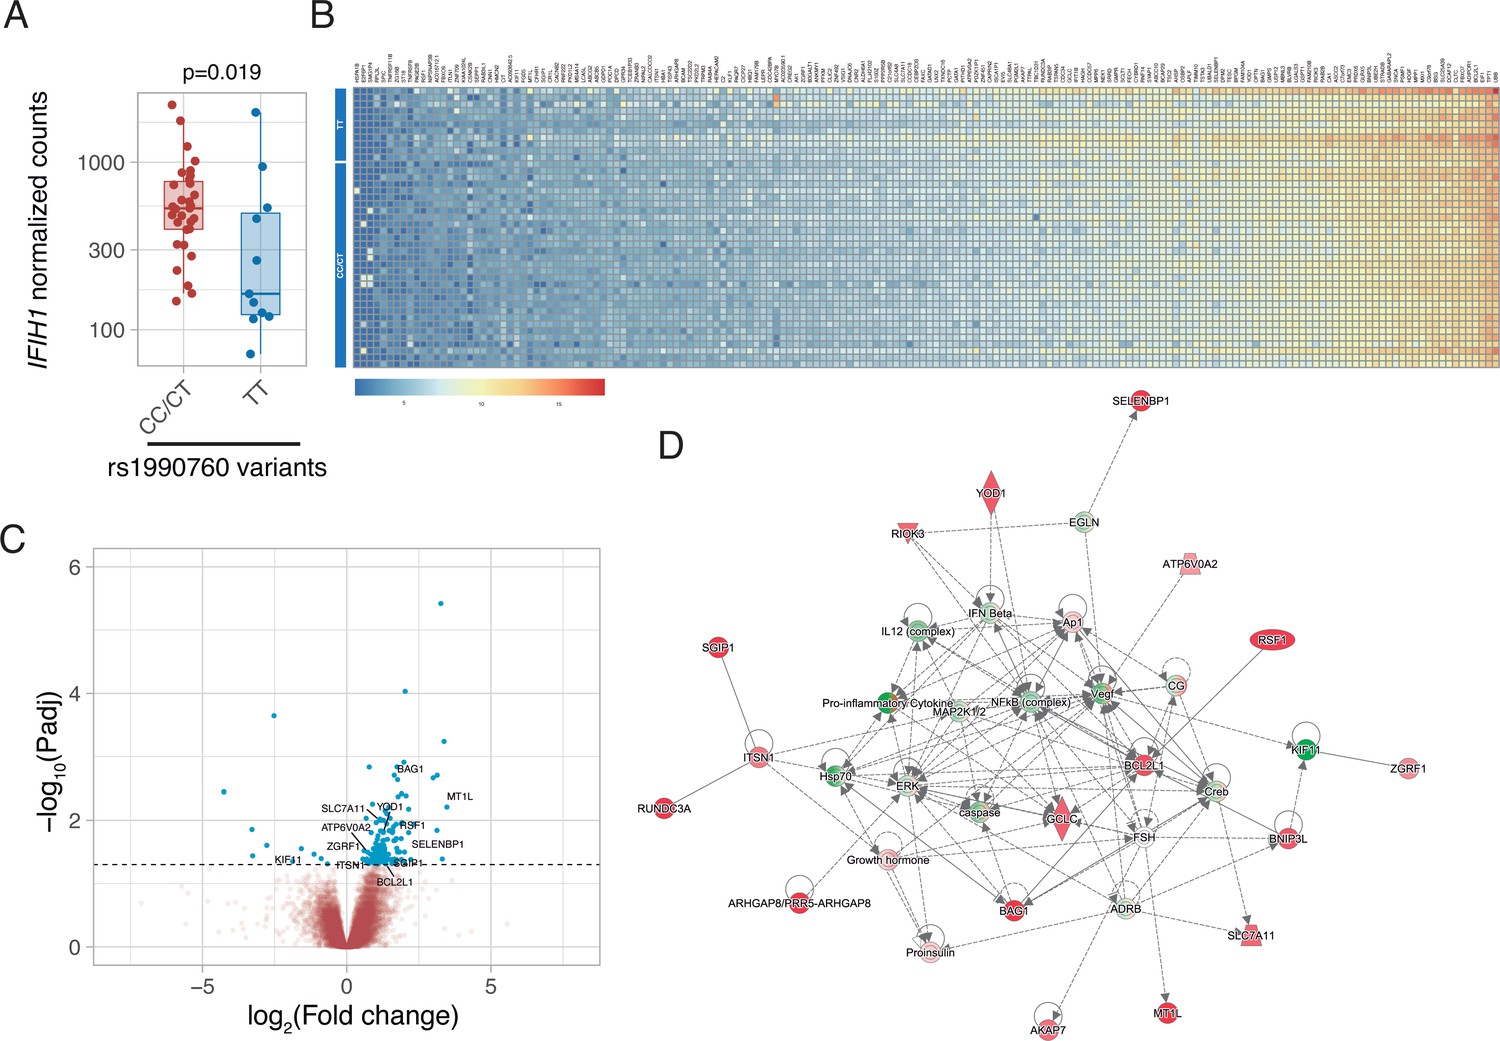
Differences in gene expression according to IFIH1 rs1990760 genotypes.
(A) Expression of IFIH1 in peripheral blood in patients with CC/CT (n=31) and TT (n=11) variants (p-value calculated using a Wilcoxon test). (B) Heatmap showing expression of the 160 genes with significant differences between variants. (C) Volcano plot showing the distribution of the magnitude of the differences in gene expression (Log2 Fold change) and their statistical significance. Inflammation-related genes with differential expression and included in the network shown in panel (D) are labeled. (D) Inflammation-related gene network identified using Ingenuity Pathway Analysis on the RNAseq data. Points represent individual patient data. In boxplots, bold line represents the median, lower and upper hinges correspond to the first and third quartiles (25th and 75th percentiles) and upper and lower whiskers extend from the hinge to the largest or smallest value no further than 1.5 times the interquartile range.
Figure 2—figure supplement 1
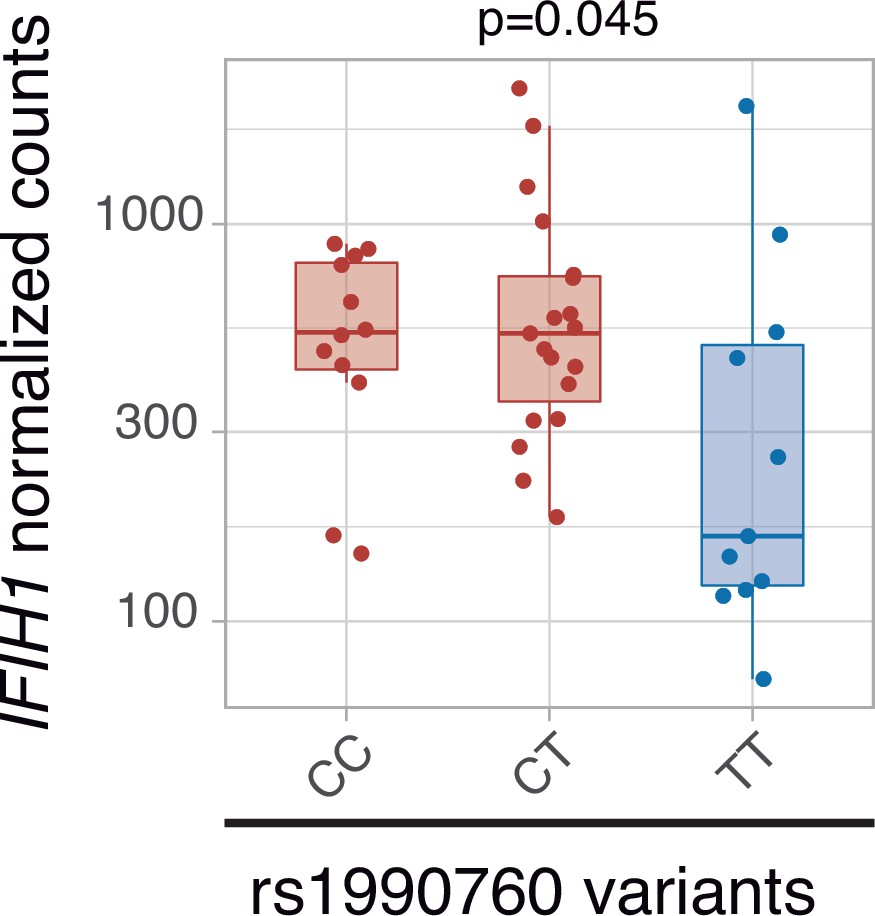
IFIH1 expression per rs1990760 variants.
Figure 2—figure supplement 2
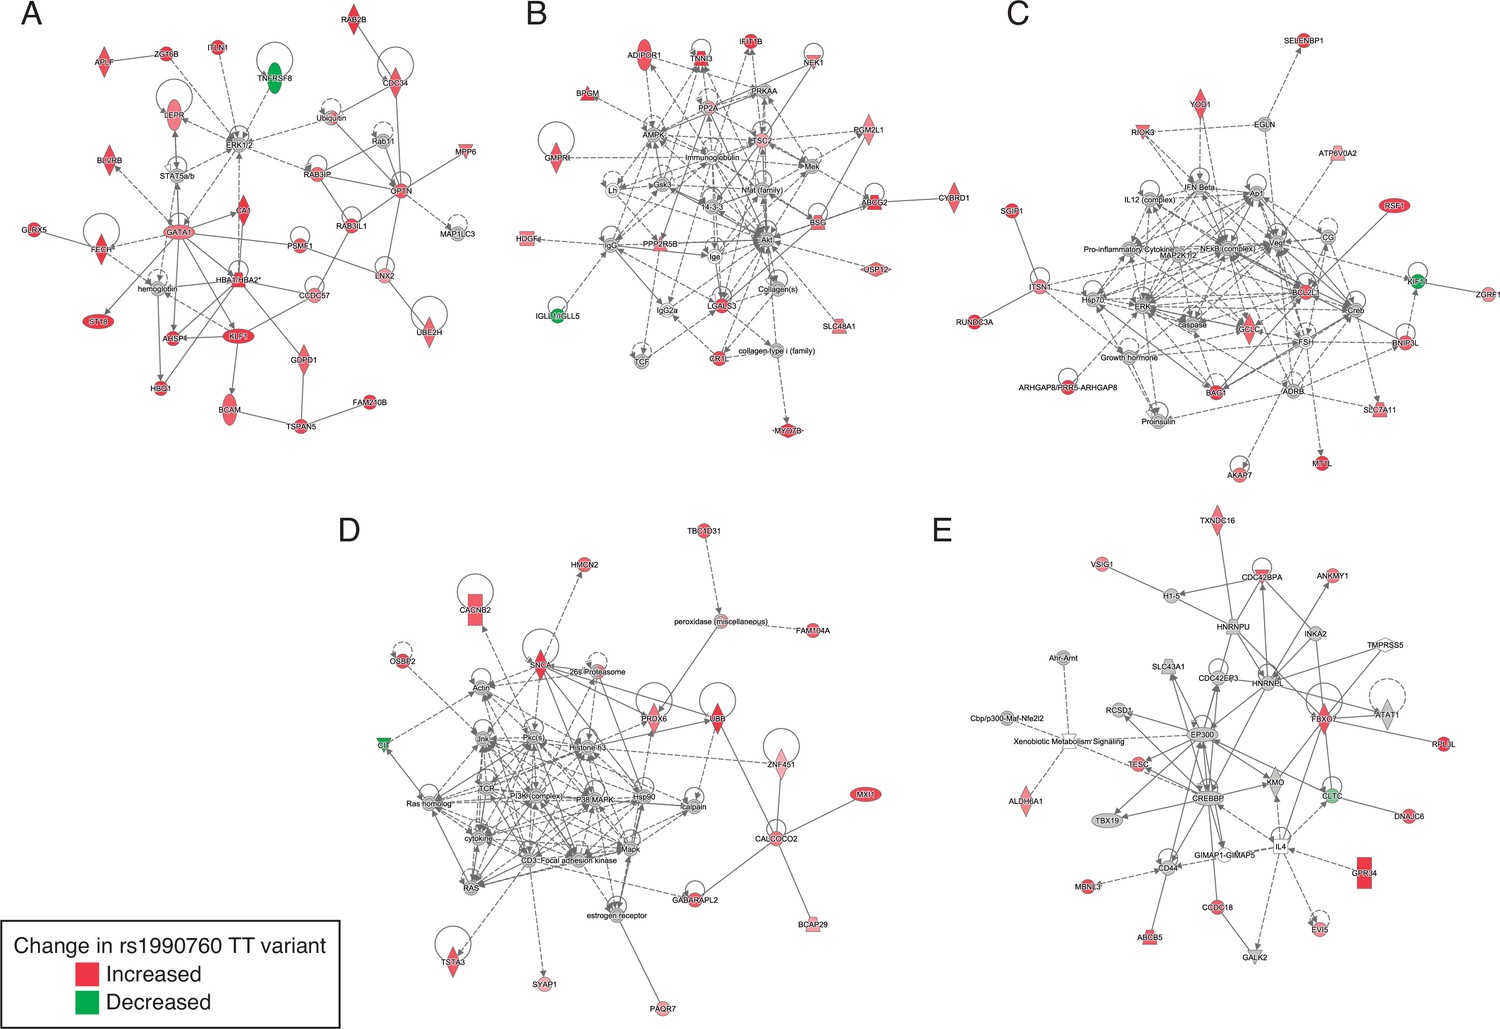
Gene networks involved in the regulation of the inflammatory response identified by Ingenuity Pathway Analysis among the genes with differential expression in patients with rs1990760 CC/CT and TT variants.
Figure 2—figure supplement 3
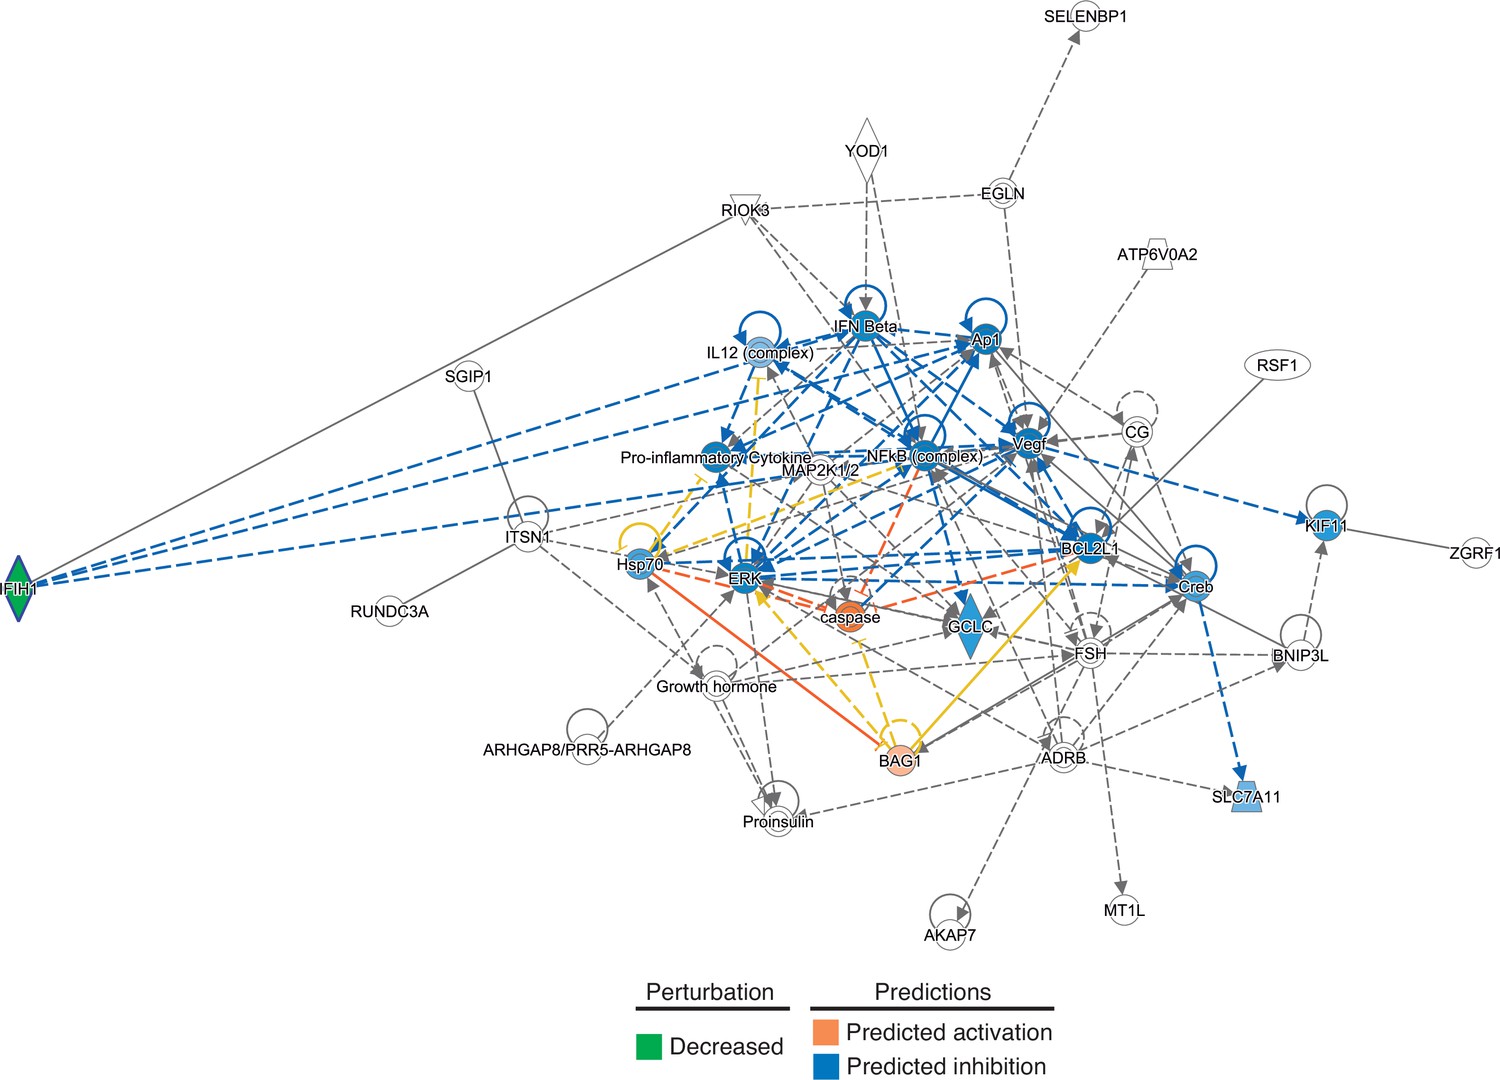
In-silico predictions of IFIH1 downregulation over a gene network involved in the regulation of the inflammatory response.
Figure 3 with 1 supplement
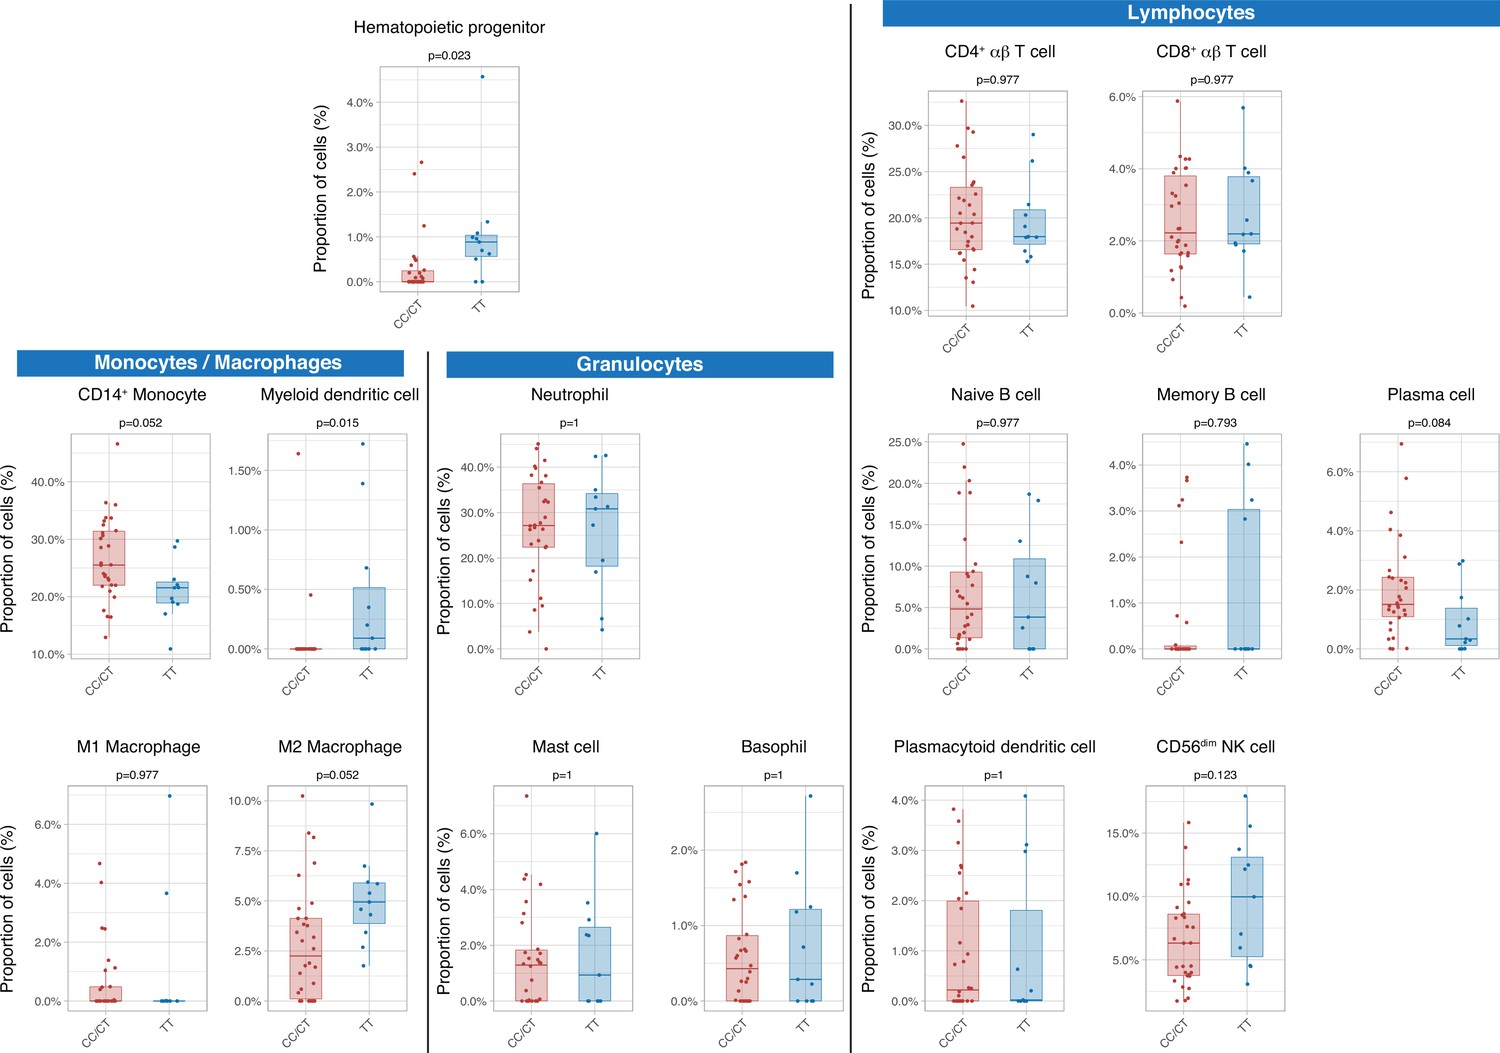
Differences in circulating cell populations according to IFIH1 rs1990760 variants (31 and 11 samples from patients with a CC/CT or TT variant, respectively).
Proportions of each cell line were estimated by deconvolution of RNAseq data. P-values were calculated using a Wilcoxon test and adjusted using the Benjamini-Hochberg method for a false discovery rate of 5%. Points represent individual patient data. In boxplots, bold line represents the median, lower and upper hinges correspond to the first and third quartiles (25th and 75th percentiles) and upper and lower whiskers extend from the hinge to the largest or smallest value no further than 1.5 times the interquartile range.
-
Figure 3—source data 1
Raw data used in Figure 3, showing different peripheral cell populations obtained after deconvolution of RNAseq data.
- https://cdn.elifesciences.org/articles/73012/elife-73012-fig3-data1-v1.csv
Figure 3—figure supplement 1
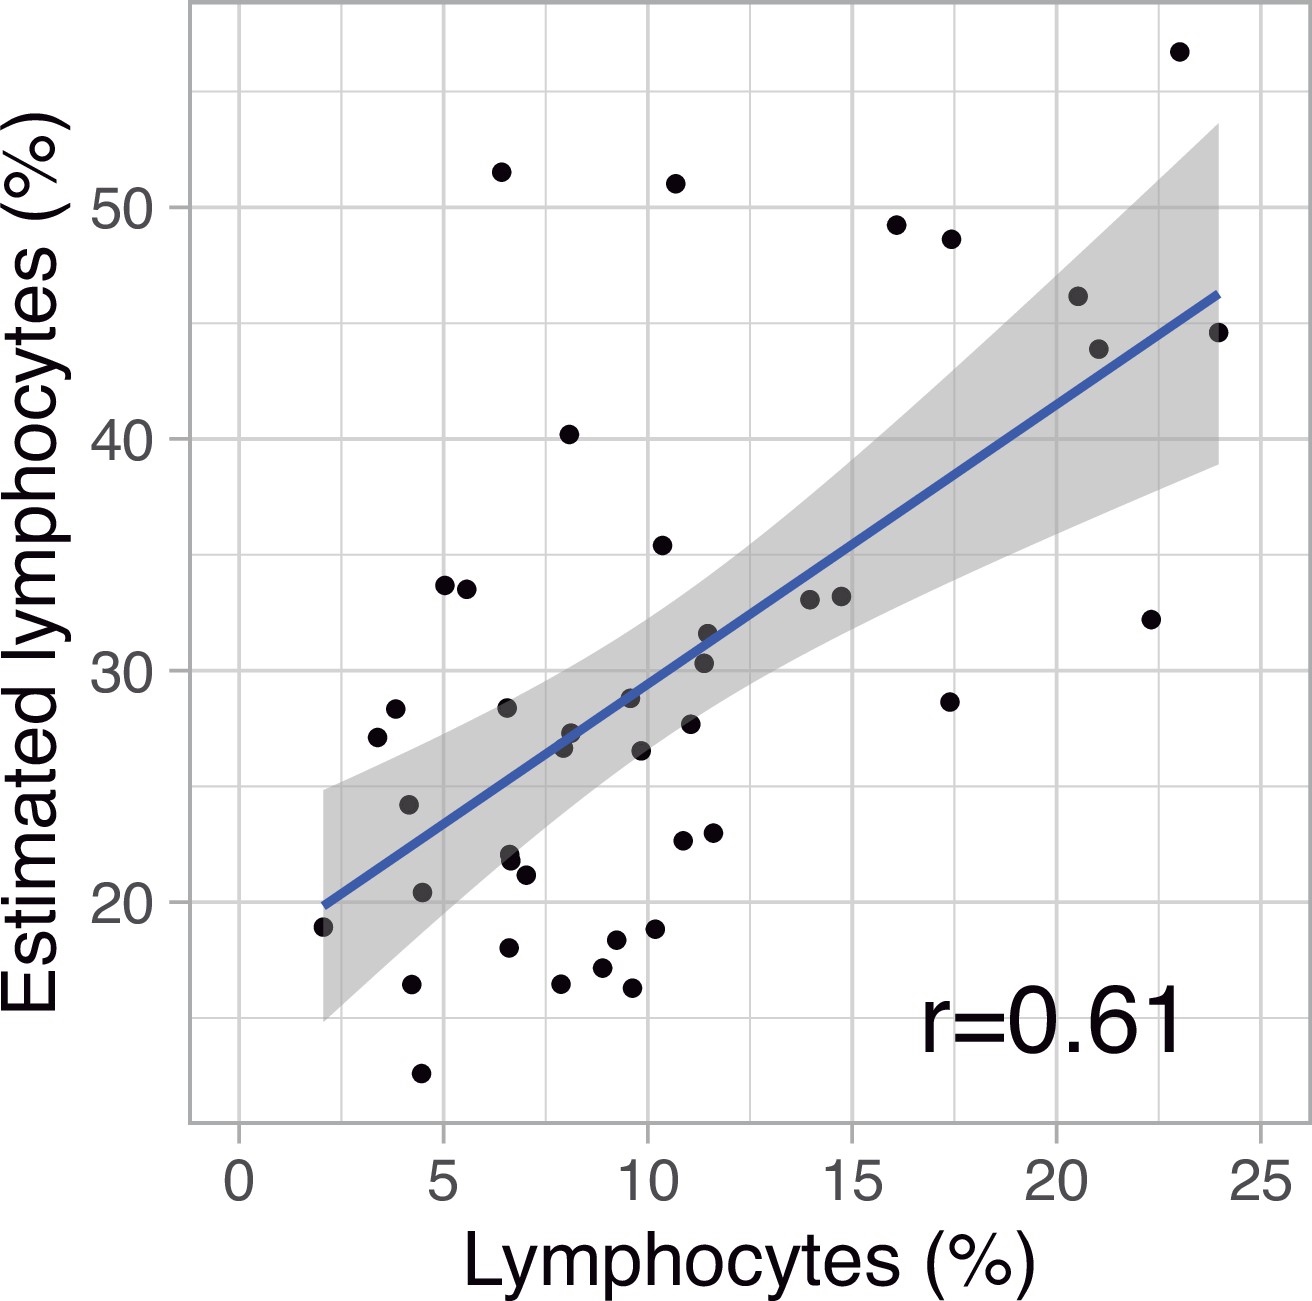
Correlation between measured and estimated (from deconvolution analysis) lymphocyte percentages in peripheral blood.
Figure 4 with 1 supplement
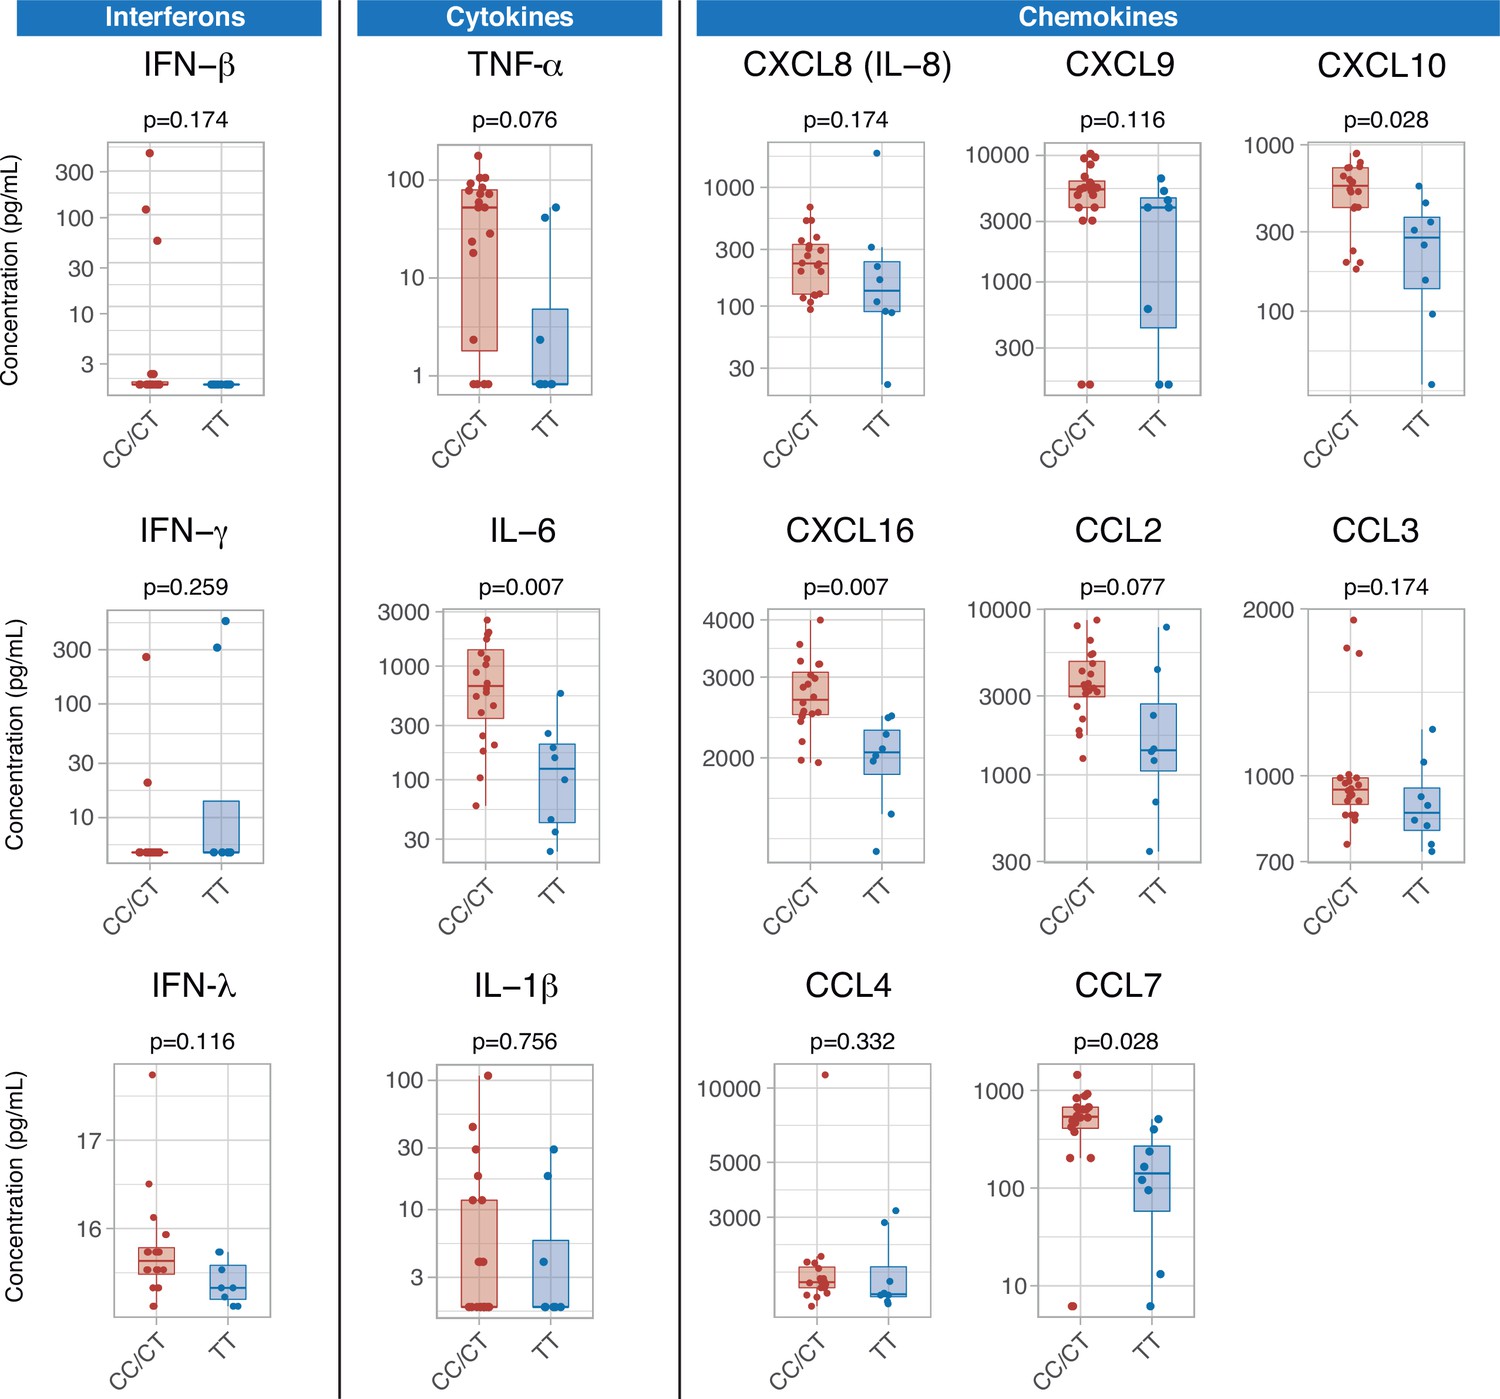
Differences in serum immune mediators according to IFIH1 rs1990760 variants (19 and 8 samples from patients with a CC/CT or TT variant, respectively).
P-values were calculated using a Wilcoxon test and adjusted using the Benjamini-Hochberg method for a false discovery rate of 5%. Points represent individual patient data. In boxplots, bold line represents the median, lower and upper hinges correspond to the first and third quartiles (25th and 75th percentiles) and upper and lower whiskers extend from the hinge to the largest or smallest value no further than 1.5 times the interquartile range.
-
Figure 4—source data 1
Raw data used in Figure 4, showing serum concentration of inflammatory mediators.
- https://cdn.elifesciences.org/articles/73012/elife-73012-fig4-data1-v1.csv
Figure 4—figure supplement 1
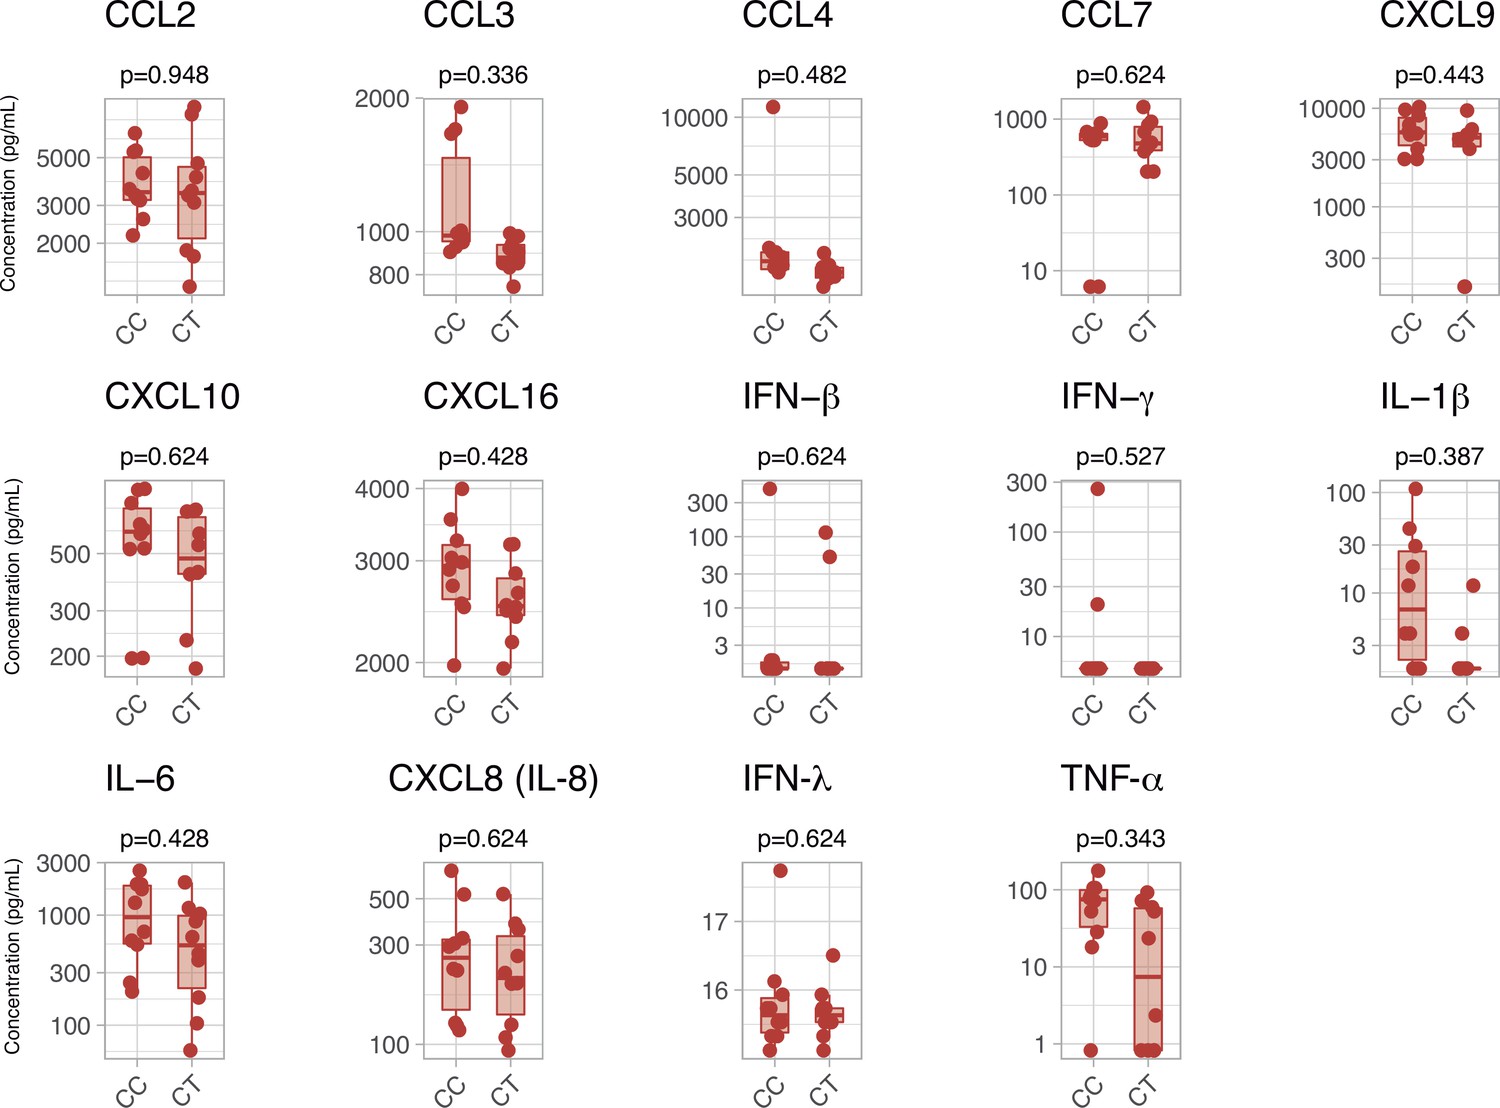
Serum inflammatory mediators in patients with a CC or CT variant in rs1990760 polymorphisms.
P-values were calculated using a Wilcoxon test and adjusted using the Benjamini-Hochberg method for a false discovery rate of 5%. Points represent individual patient data. In boxplots, bold line represents the median, lower and upper hinges correspond to the first and third quartiles (25th and 75th percentiles) and upper and lower whiskers extend from the hinge to the largest or smallest value no further than 1.5 times the interquartile range.
Figure 5 with 1 supplement
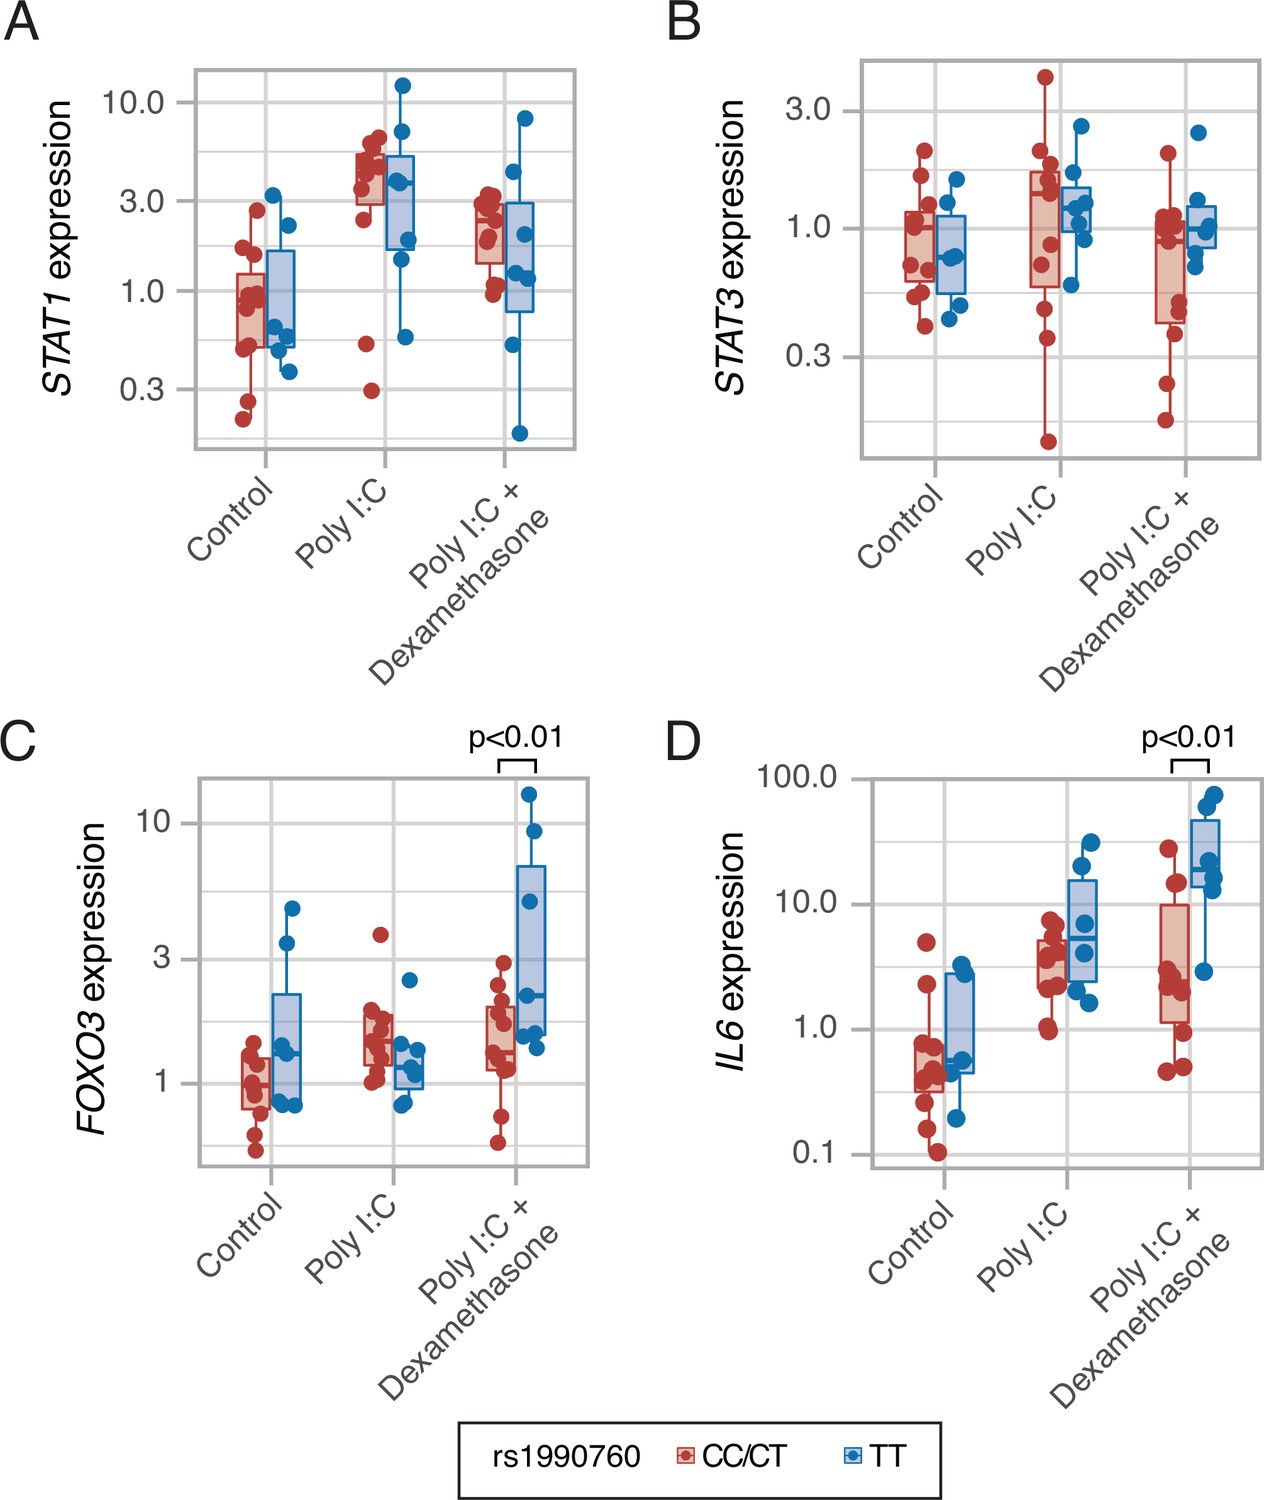
Expression of transcription factors STAT1 (A, p=0.012, no significant differences between variants in post hoc tests), STAT3 (B, p=0.443) and FOXO3 (C, p=0.002), and cytokine IL6 (D, p<0.001) induced by MDA5 activation using high molecular weight poly-I:C (a viral RNA analog) and dexamethasone in peripheral mononuclear blood cells.
Results were fitted using a mixed-effects linear model including cell donor as a fixed effect and experimental group and genotype as random effects. Pairwise p-values lower than 0.05 (using Holm’s correction) are shown. Points represent individual patient data. In boxplots, bold line represents the median, lower and upper hinges correspond to the first and third quartiles (the 25th and 75th percentiles) and upper and lower whiskers extend from the hinge to the largest or smallest value no further than 1.5 times the interquartile range.
-
Figure 5—source data 1
Raw data used in Figure 5, showing gene expression in an ex-vivo model of MDA5 stimulation.
- https://cdn.elifesciences.org/articles/73012/elife-73012-fig5-data1-v1.csv
Figure 5—figure supplement 1
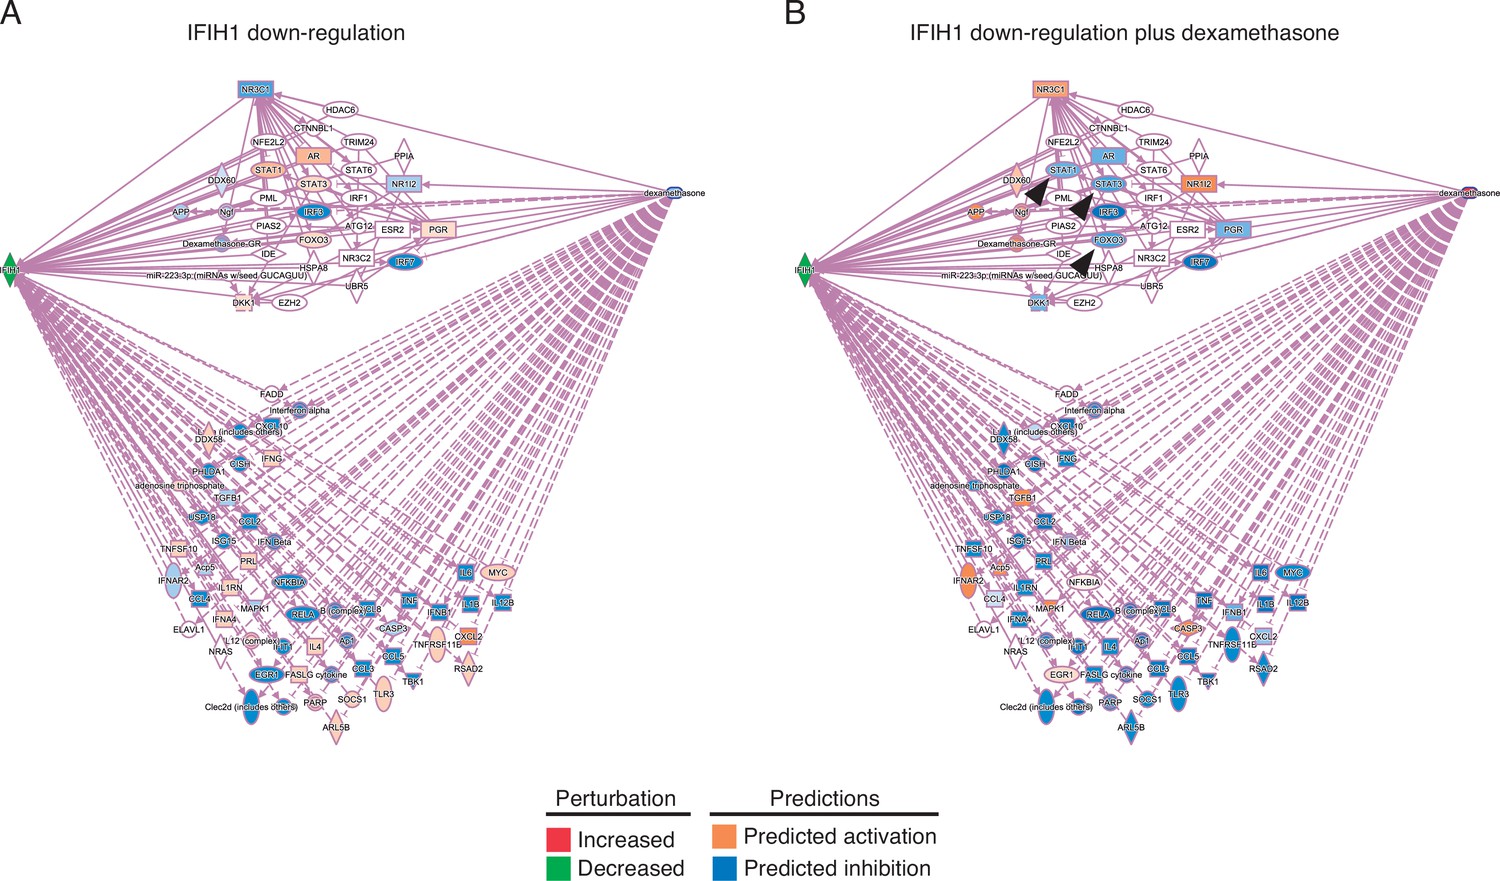
Predicted effects of IFIH1 downregulation in absence (A) or in presence (B) of dexamethasone.
A number of molecules downregulated in response to lower IFIH1 expression are upregulated when dexamethasone is added (arrowheads).
Figure 6 with 1 supplement
Outcomes according to IFIH1 rs1990760 variants and treatment with dexamethasone.
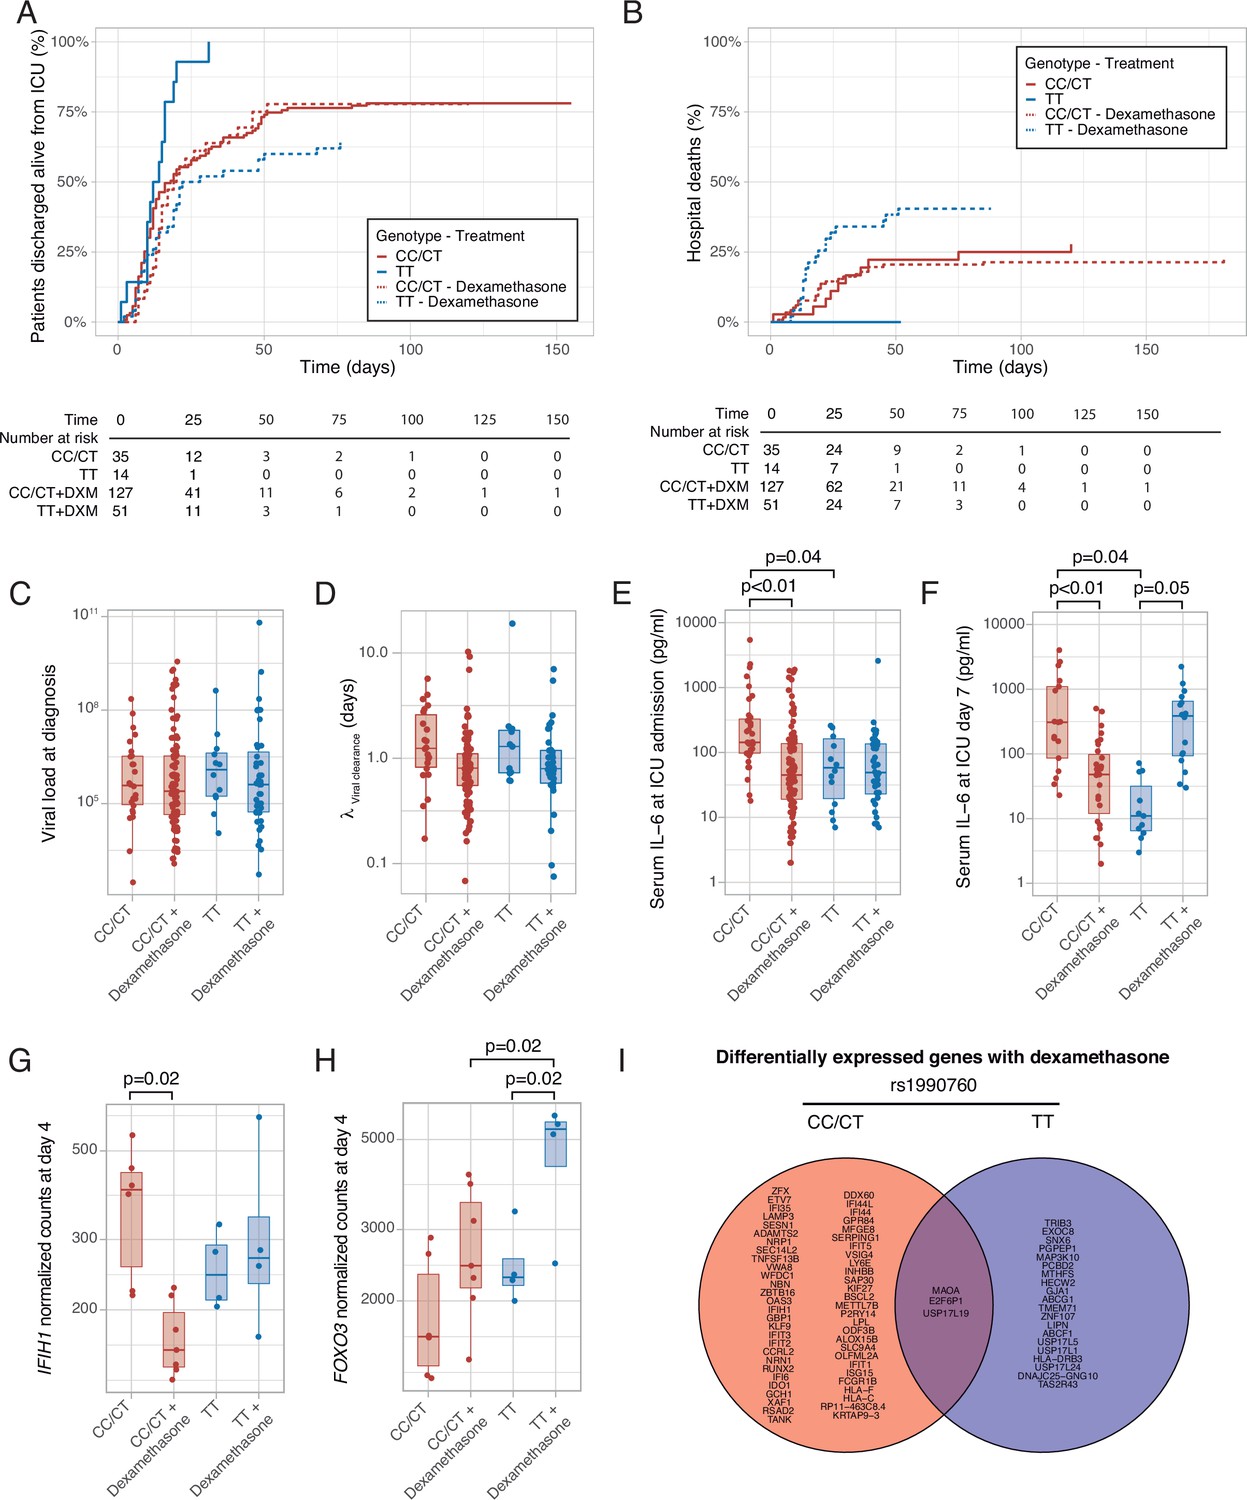
(A) Cumulative incidence of ICU discharge alive and spontaneously breathing for each group. (B) Cumulative incidence of hospital death for each group. Outcomes were modeled as competing events. (C) Viral load at diagnosis for each group (p=0.888). (D) Viral clearance evaluated as half-life of an exponential decay function calculated from the maximal viral load in each patient (p=0.056, no significant differences in post hoc tests). (E, F) Serum IL-6 concentrations during the first day (E, p<0.001) and 7 days (F, p=0.014) after ICU admission for each group. Differences among groups in panels (C–F) were evaluated using an analysis of the variance. Pairwise p-values lower than 0.05 (using Holm’s correction) are shown. (G, H) Changes in IFIH1 (G) and FOXO3 (H) expression in day 4 of ICU stay for each group (n=6 and 7 for CC/CT variants without and with dexamethasone, respectively, n = 4 and 4 for TT variant without and with dexamethasone, respectively). (I) Genes with dexamethasone-induced changes in gene expression in ICU day four in each rs1990760 variant. Points represent individual patient data. In boxplots, bold line represents the median, lower and upper hinges correspond to the first and third quartiles (25th and 75th percentiles) and upper and lower whiskers extend from the hinge to the largest or smallest value no further than 1.5 times the interquartile range.
Figure 6—figure supplement 1
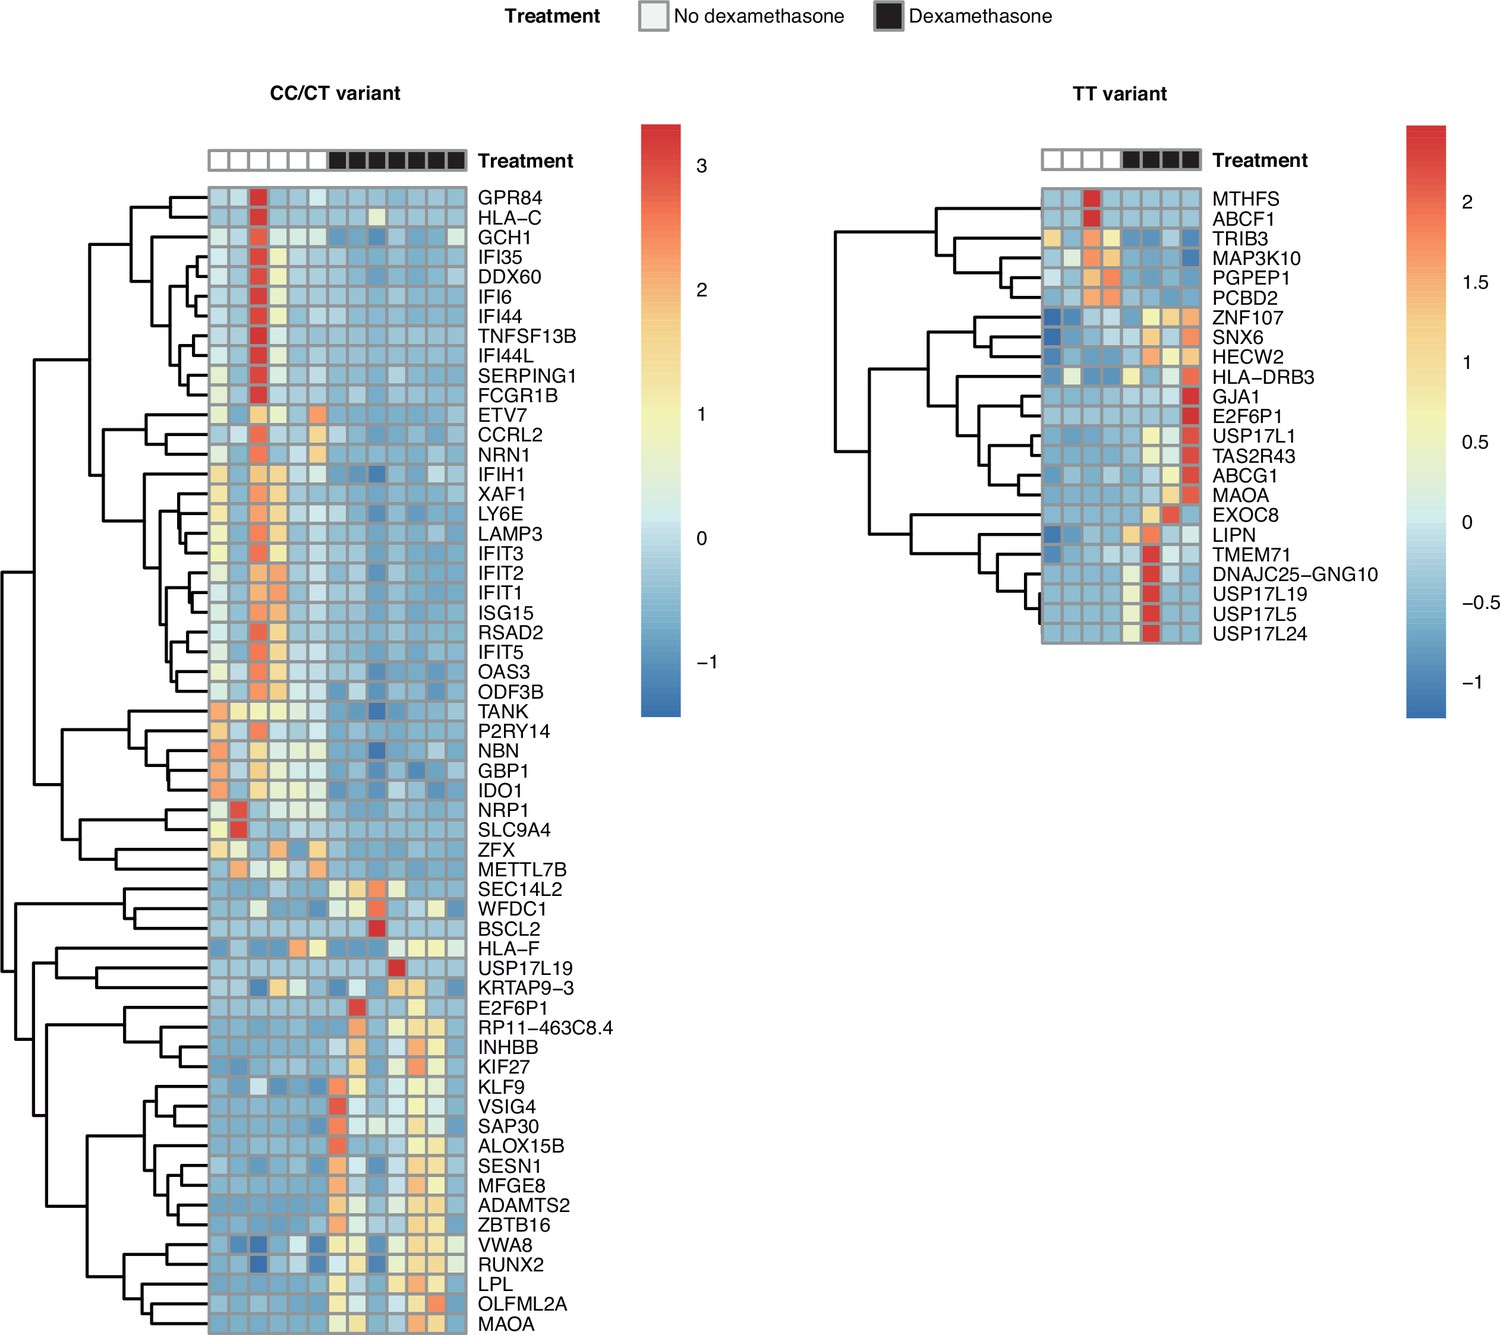
Heatmaps with the differentially expressed genes in response to steroids in patients of each rs1990760 variant.
Transcriptomic signatures in each variant only share three genes.
Figure 7 with 1 supplement
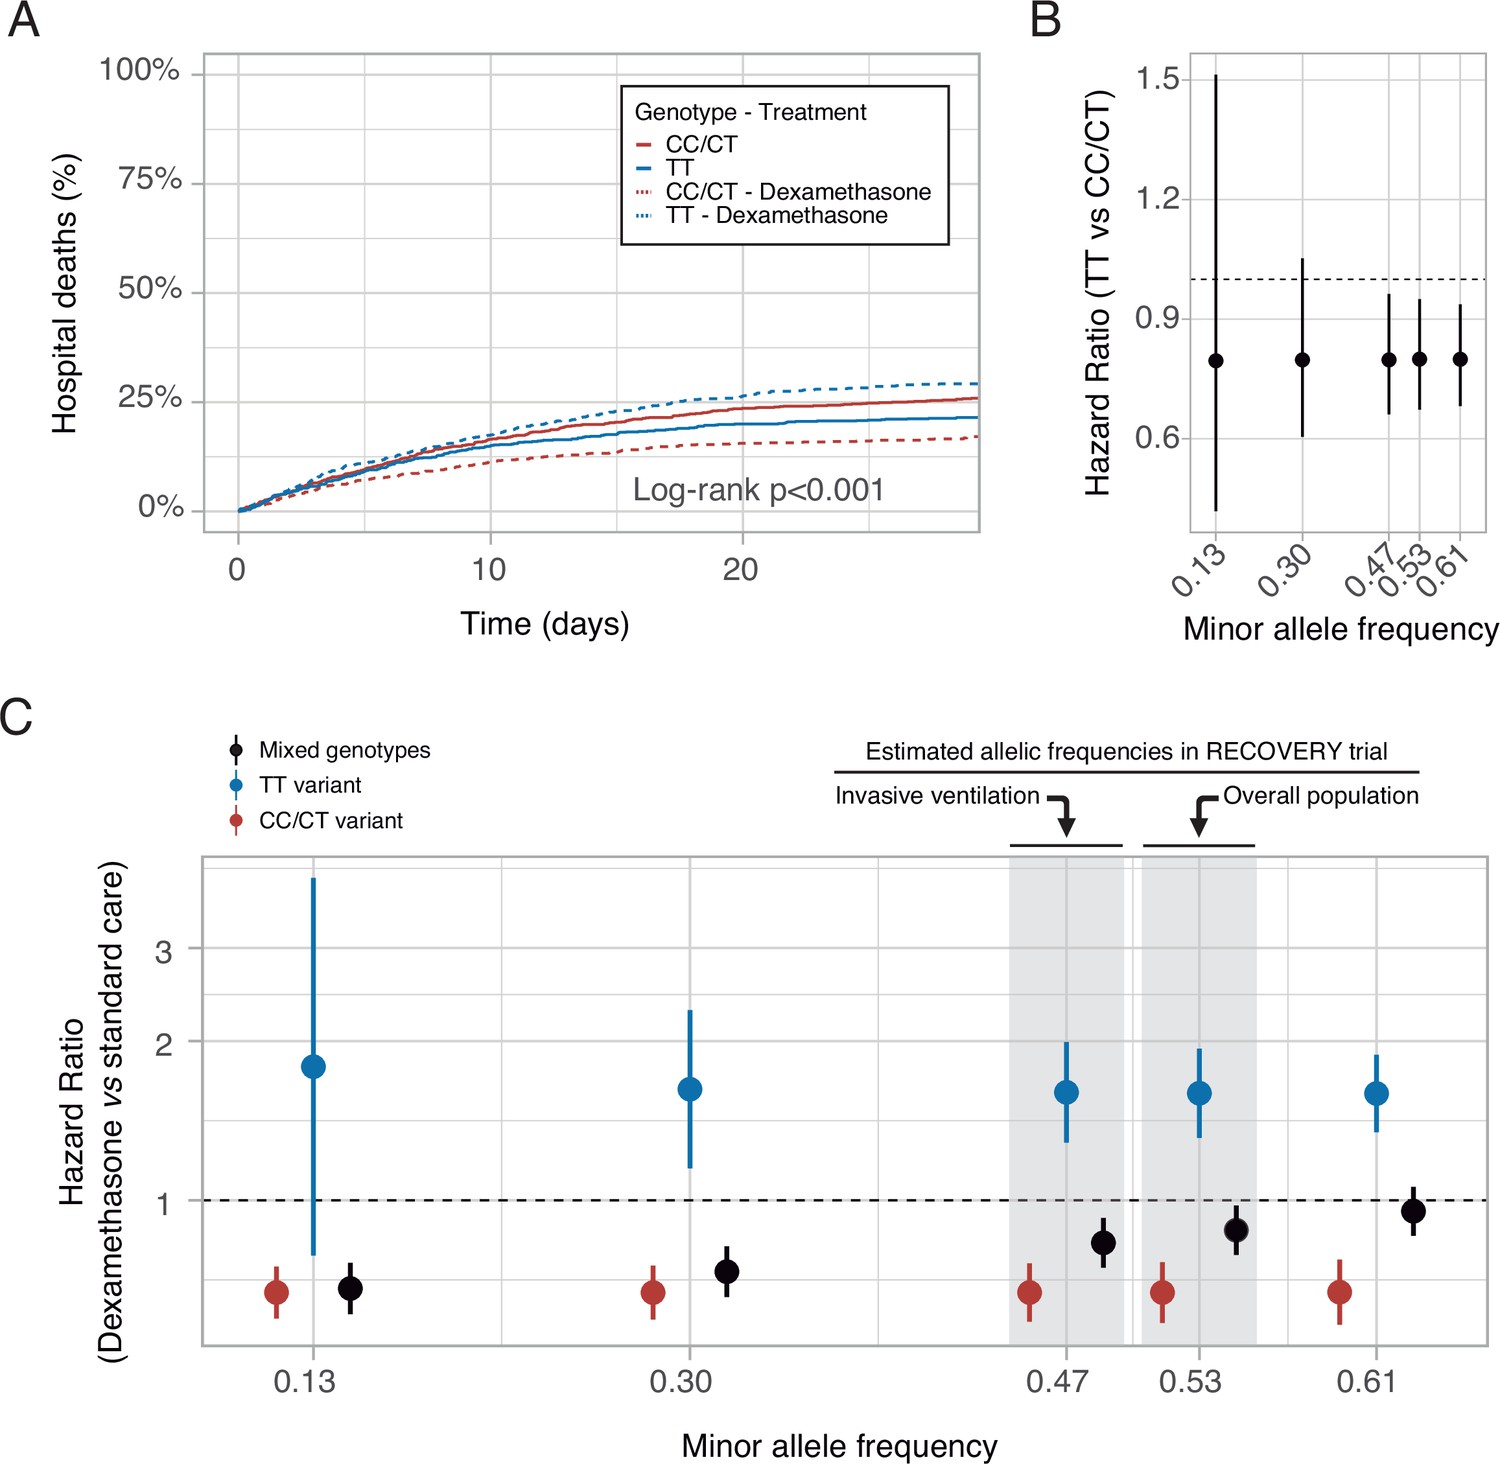
In-silico clinical trials.
(A) Mortality curves modeled using data from the RECOVERY clinical trial, for each rs1990760 variant and treatment allocation, assuming a sample size of 500 patients per group. (B) Effect of rs1990760 TT variants (expressed as hazard ratio, HR) in simulated clinical trials including 6000 patients from populations with different minor allele frequencies, assigned to standard care. (C) Effect of dexamethasone therapy according to rs1990760 variants and different minor allele frequencies in simulated clinical trials including 6000 patients. Minor allele frequencies were estimated according to reported race in several subsets of patients from the RECOVERY trial: European population (0.61), overall population (0.53), mechanically ventilated patients (0.47), and African American/Asian population (0.13). An intermediate value of 0.30 was added for illustrative purposes. Points and error bars represent the estimated HR and the corresponding 95% confidence interval.
Figure 7—figure supplement 1
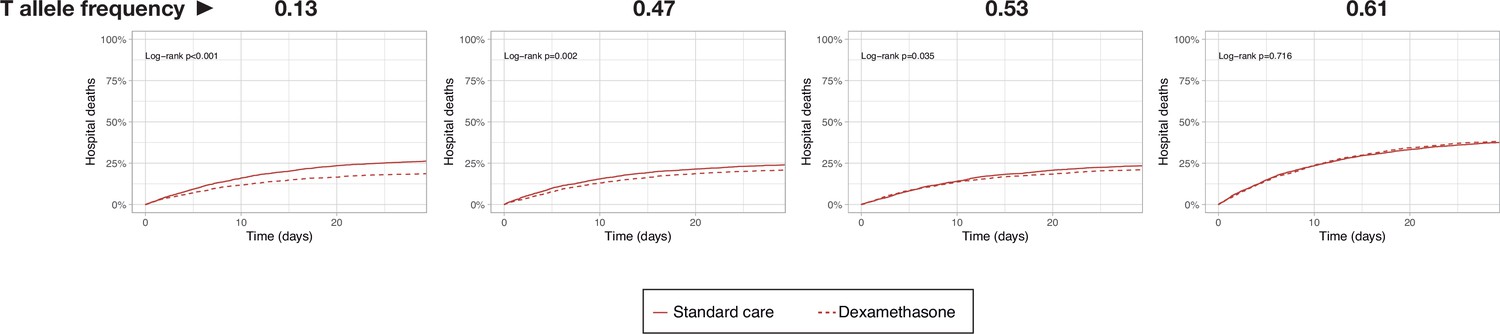
Simulated survival curves corresponding to in-silico clinical trials testing dexamethasone in 6000 COVID-19 patients from populations with different allelic frequencies.
T allele frequencies correspond to an African/American/Asian population (0.13), mechanically ventilated sample of the RECOVERY trial (0.47), overall sample of the RECOVERY trial (0.53), and a White population (0.61).
Tables
Table 1
Clinical characteristics of the study cohort.
COPD: Chronic Obstructive Pulmonary Disease. Values are shown as absolute count or median (interquartile range). PBW: Predicted body weight. NIV: Non-invasive ventilation. PEEP: Positive End-Expiratory Pressure. *p-values calculated for proportion over the number of intubated patients.
| rs1990760 | ||||
|---|---|---|---|---|
| Overall (n=227) | TT (n=65) | CC/CT (n=162) | p-value | |
| Demographics | ||||
| Age (years) | 67 (60–75) | 68.5 (63–75.25) | 66 (58–75) | 0.123 |
| Sex | ||||
| Male | 174 (77) | 47 (72) | 127 (78) | 0.327 |
| Female | 53 (23) | 18 (28) | 35 (22) | |
| Race | ||||
| Black | 3 (1.5) | 1 (2) | 2 (1.5) | 0.527 |
| White | 207 (91) | 62 (95) | 146 (90) | |
| Latino | 15 (7) | 2 (3) | 13 (8) | |
| Asian | 1 (0.5) | 0 | 1 (0.5) | |
| Body mass index (kg/m2) | 30 (27–33) | 30 (26–33) | 30 (27–32) | 0.592 |
| Days since symptom onset | 8 (6–11) | 8 (6–10) | 8 (6–11) | 0.873 |
| Days from hospital admission to ICU admission | 2 (1–4) | 2 (1–3) | 2 (1–4) | 0.841 |
| APACHE-II score | 15 (12–18) | 15.5 (13–18) | 14 (11—18) | 0.177 |
| Comorbidities | ||||
| Arterial hypertension | 132 (58) | 38 (59) | 94 (58) | 0.932 |
| Diabetes | 51 (23) | 14 (22) | 37 (23) | 1 |
| Chronic kidney disease | 15 (7) | 5 (8) | 10 (6) | 0.743 |
| COPD | 17 (8) | 7 (11) | 10 (6) | 0.339 |
| Cirrhosis | 2 (1) | 1 (2) | 1 (0.5) | 1 |
| Neoplasms | ||||
| No | 215 (95) | 62 (95)3 (5)0 | 154 (95) | 0.669 |
| Active | 10 (4) | 3 (5) | 7 (3.5) | |
| Past | 2 (1) | 0 | 2 (1.5) | |
| Immunosuppresive drugs (incl. steroids) | 5 (2) | 3 (5) | 2 (1.5) | 0.142 |
| Lung function at ICU admission | ||||
| Ventilation at admission | ||||
| Spontaneous /NIV | 38 (17) | 11 (17) | 27 (17) | 0.278 |
| Controlled invasive ventilation | 187 (82.5) | 53 (82) | 135 (83) | |
| Pressure support ventilation | 1 (0.5) | 1 (2) | 0 | |
| FiO2 | 0.5 (0.4–0.6) | 0.5 (0.4–0.7) | 0.5 (0.4–0.6) | 0.104 |
| PaO2/FiO2 (mmHg) | 204 (155–267) | 185 (142–226) | 218 (162–282) | 0.007 |
| PaCO2 (mmHg) | 43 (39–47) | 44 (39–47) | 43 (39–48) | 0.924 |
| Respiratory rate (min–1) | 18 (16–20) | 18 (16–20) | 18 (16–22) | 0.929 |
| Arterial pH | 7.38 (7.32–7.41) | 7.38 (7.33–7.42) | 7.37 (7.32–7.41) | 0.805 |
| Tidal volume/PBW (ml/Kg) | 7.6 (6.9–8.4) | 8 (6.9–9.2) | 7.5 (7–8.1) | 0.109 |
| Plateau pressure (cmH2O) | 24 (21–28) | 24 (22–29) | 24 (21–27) | 0.221 |
| PEEP (cmH2O) | 12 (10–14) | 12 (10–14) | 12 (10–14) | 0.397 |
| Driving pressure (cmH2O) | 12 (10–14) | 12 (10–14) | 12 (10–14) | 0.496 |
| Respiratory system compliance (ml/cmH2O) | 38 (32–50) | 36 (31–44) | 42 (32–50) | 0.11 |
| Laboratory results | ||||
| Leukocytes (×103/μl) | 8.34 (6.05–11.38) | 8.77 (5.96–11.52) | 8.29 (6.08–11.18) | 0.773 |
| Lymphocytes (×103/μl) | 0.65 (0.48–0.93) | 0.62 (0.47–0.94) | 0.67 (0.49–0.93) | 0.266 |
| Serum creatinine (mg/dl) | 0.83 (0.62–1.13) | 0.87 (0.62–1.14) | 0.82 (0.62–1.11) | 0.859 |
| Serum ferritin (ng/ml) | 1107 (717–1667) | 965 (634–1263) | 1262 (776–2374) | 0.011 |
| D-dimer (ng/ml) | 1053 (681–1967) | 1085 (643–1805) | 1036 (683–2126) | 0.854 |
| Additional treatments at ICU admission | ||||
| Steroids | 178 (78) | 51 (79) | 127 (78) | 1 |
| Vasoactive drugs | 102 (45) | 27 (42) | 75 (46) | 0.686 |
| Invasive mechanical ventilation | 210 (93) | 59 (91) | 151 (93) | 0.724 |
| Neuromuscular blocking agents | 99 (44) | 30 (46) | 69 (43) | 0.733* |
| Prone ventilation | 119 (52) | 32 (49) | 87 (54) | 0.657* |
| ECMO | 5 (2) | 2 (3) | 3 (2) | 0.544* |
Additional files
-
Supplementary file 1
Supplementary Tables.
1a. Primers and probes used to detect SARS-CoV-2. 1b: Primers used for qPCR of human genes. 1c: Clinical characteristics of patients according to IFIH1 rs1990760 genotypes and dexamethasone therapy. Values are shown as absolute count or median (interquartile range). PBW: Predicted body weight. NIV: Non-invasive ventilation. PEEP: Positive End-Expiratory Pressure. *p-values calculated for proportion over the number of intubated patients.
- https://cdn.elifesciences.org/articles/73012/elife-73012-supp1-v1.docx
-
Supplementary file 2
Results of differential expression analysis between rs1990760 variants.
- https://cdn.elifesciences.org/articles/73012/elife-73012-supp2-v1.csv
-
Supplementary file 3
Changes in gene expression after steroid treatment in rs1990760 variants.
- https://cdn.elifesciences.org/articles/73012/elife-73012-supp3-v1.csv
-
Transparent reporting form
- https://cdn.elifesciences.org/articles/73012/elife-73012-transrepform1-v1.docx
-
Reporting standard 1
STROBE check list for cohort studies.
- https://cdn.elifesciences.org/articles/73012/elife-73012-repstand1-v1.doc
Download links
A two-part list of links to download the article, or parts of the article, in various formats.
Downloads (link to download the article as PDF)
Open citations (links to open the citations from this article in various online reference manager services)
Cite this article (links to download the citations from this article in formats compatible with various reference manager tools)
Effects of IFIH1 rs1990760 variants on systemic inflammation and outcome in critically ill COVID-19 patients in an observational translational study
eLife 11:e73012.
https://doi.org/10.7554/eLife.73012


