How the insect central complex could coordinate multimodal navigation
- Machine Life and Intelligence Research Centre, School of Mathematics and Information Science, Guangzhou University, China
- Computational Intelligence Lab and L-CAS, School of Computer Science, University of Lincoln, United Kingdom
- Sheffield Robotics, Department of Computer Science, University of Sheffield, United Kingdom
Figures
Figure 1
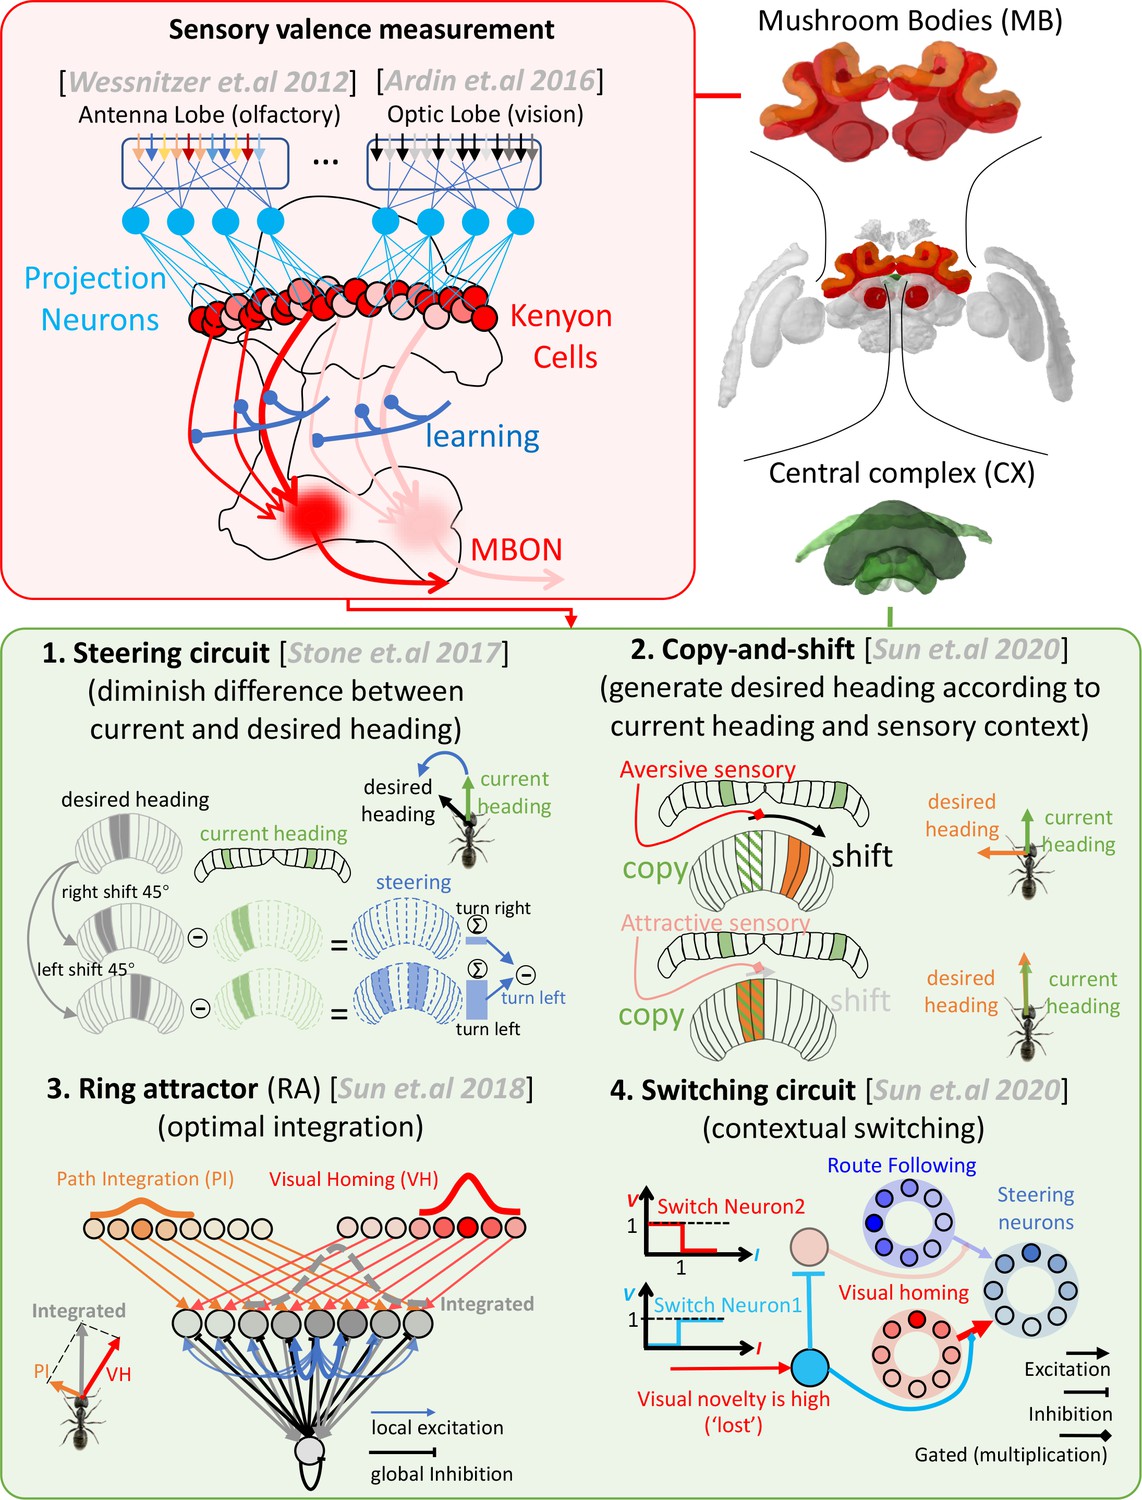
Schematic overview of the mushroom body-central complex (MB-CX) model first presented in Sun et al., 2020 and reapplied here to multimodal guidance.
The upper-right panel depicts the two key brain areas modelled (MBs in red, central in green). The upper-left panel (red background) outlines the role of the MBs in measuring valence of odour (Wessnitzer et al., 2012) and visual (Ardin et al., 2016) cues. The lower panel (green background) introduces the four CX subcircuits integrated in the previous model. (1) The steering circuit proposed to exist in the CPU1 neurons of the CX that computes the turning angle that minimises the difference between the current heading (from the protocerebral bridge [PB]) and desired heading (from the CPU4 cells) (Stone et al., 2017). (2) The copy-and-shift mechanism creates a desired heading from non-directional cues by simply copying the current heading and shifting it in proportion to the change in sensory valance. (3) Ring attractor networks can automatically and optimally integrate orientation cues from disparate sources into a single readout. Our model uses RAs to integrate both compass and desired heading signals. (4) Context-dependent switches multiplex systems at a high level (e.g. when ‘lost’ engages visual homing [VH] but not route following [RF]). Images of the brain regions are adapted from the Insect Brain Database (Heinze et al., 2021; https://www.insectbraindb.org).
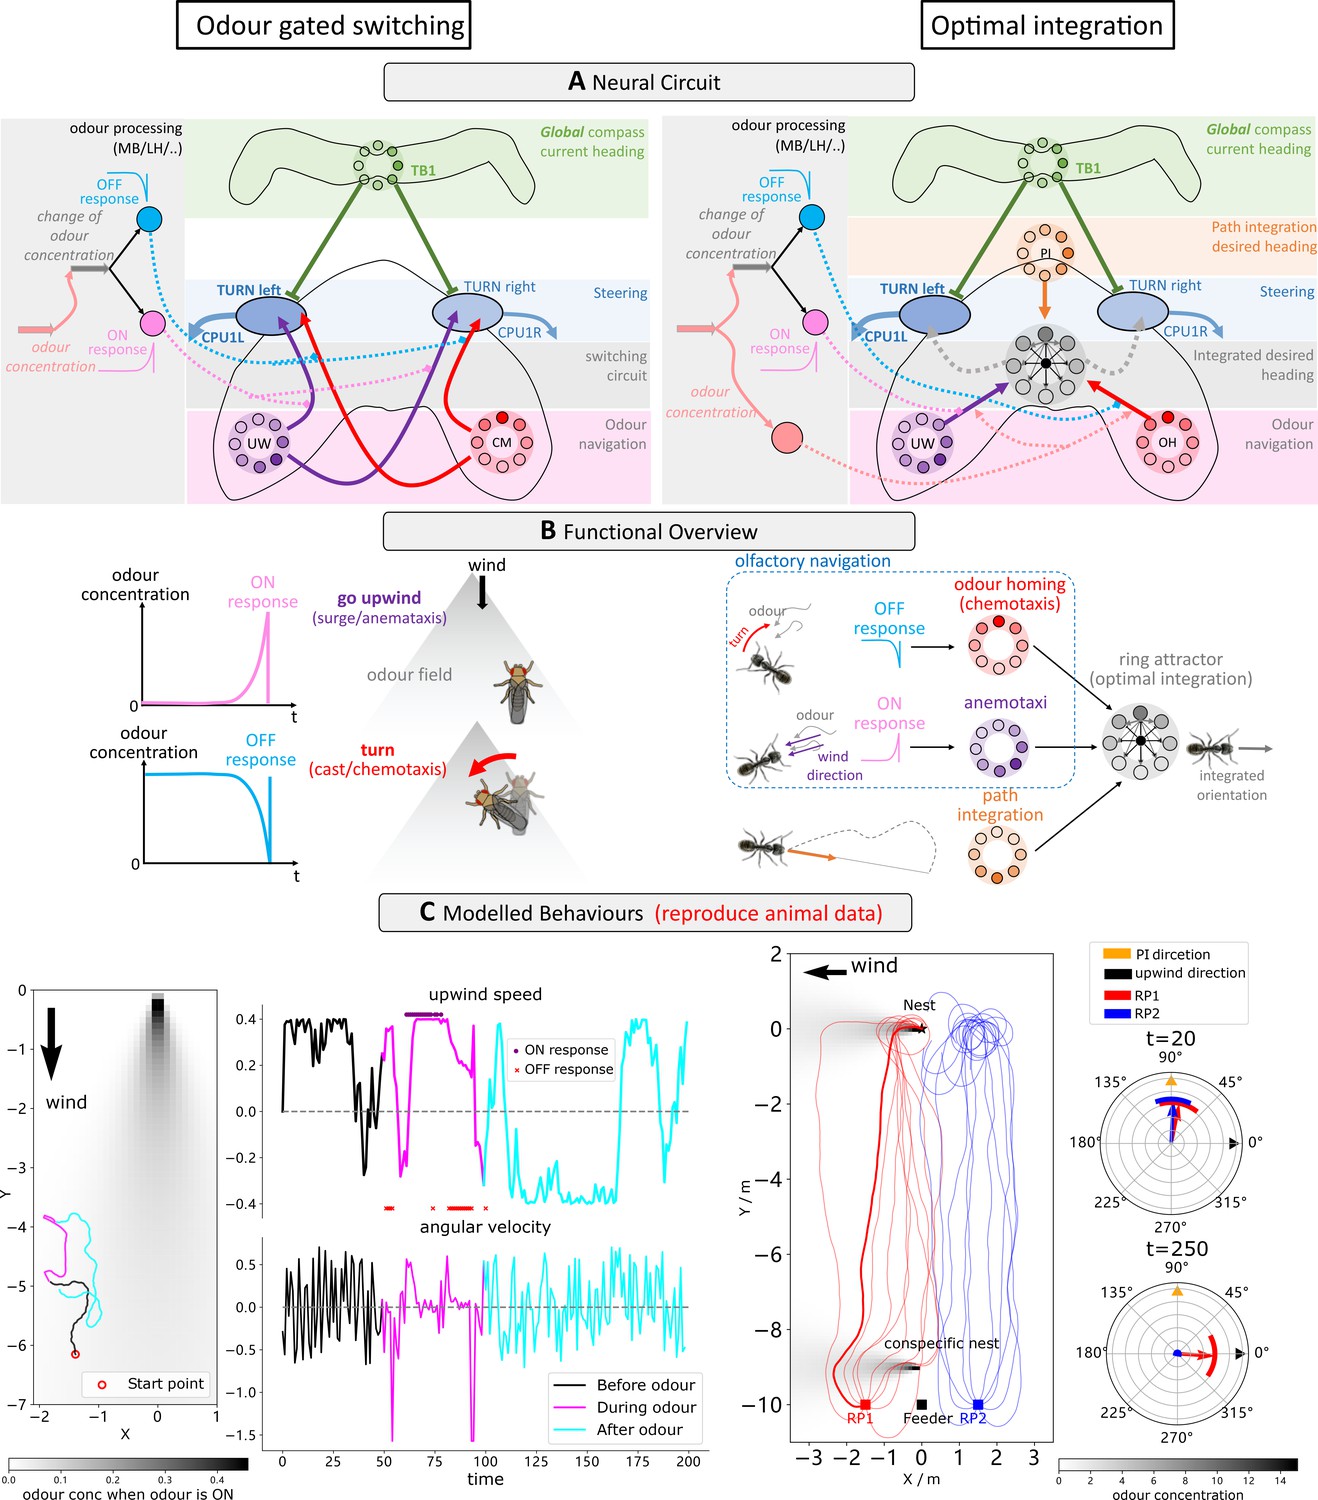
Figure 2 with 3 supplements
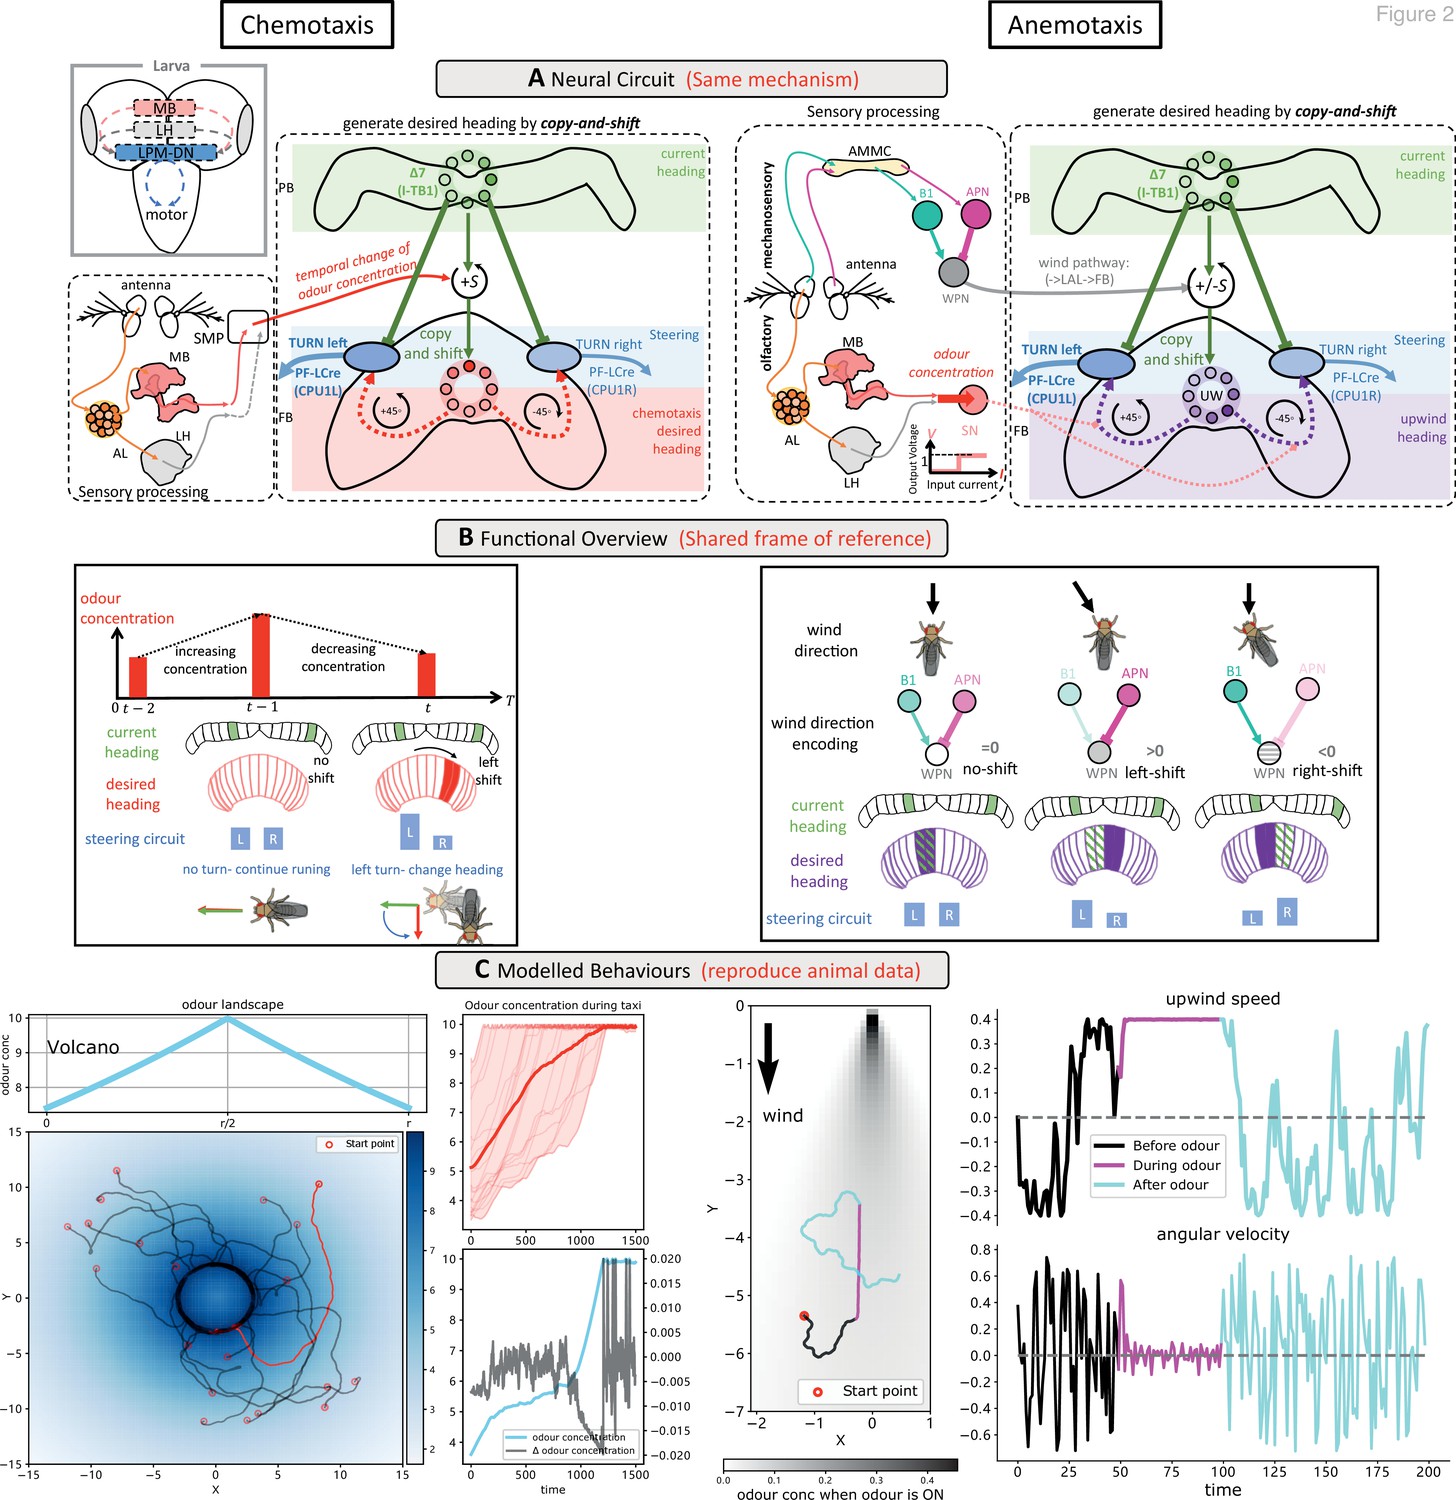
Modelling olfactory navigation in flies using a ‘copy-and-shift’ mechanism: chemotaxis (left side) and anemotaxis (right side).
(A) Schematic diagrams of the neural circuits generating current-desired heading pairings for chemotaxis and anemotaxis. The copy-and-shift mechanism is only different in how the shift is realised: for chemotaxis, the temporal change of the odour concentration produces turns of different magnitude in a predefined direction, which for anemotaxis the wedge projection neuron (WPN) provide both turning magnitude and direction to steer the animal upwind. The corresponding hypothesised functional map of larvae brain is inserted in the left panel, showing that the olfactory descending neurons LPM-DN may play similar role as the central complex (CX). (B) Schematic diagram explaining the model functions. For chemotaxis, decreasing odour concentration will shift the desired heading from current heading causing the steering circuit to initiate a turn. For anemotaxis, the WPNs subtract the activation of the antennal mechanosensory and motor centre (AMMC) projection neuron (APN) from that of B1 that directly shifts the desired heading to align with the upwind direction. Note that the two mechanisms share a frame of reference. (C) Example behaviours generated by the model. Realistic chemotaxis behaviour is shown (left) in a ‘volcano’ odour landscape. On the right, realistic anemotaxis (magenta path segment) are shown when odour is ‘ON’ vs. undirected motion (black and cyan path segments) when odour is ‘OFF’. Upwind speed and angular velocity of the example agent are shown on the right panel. Note the obvious higher upwind translational velocity and low angular velocity during the presence of the odour indicate surges upwind.
Figure 2—figure supplement 1
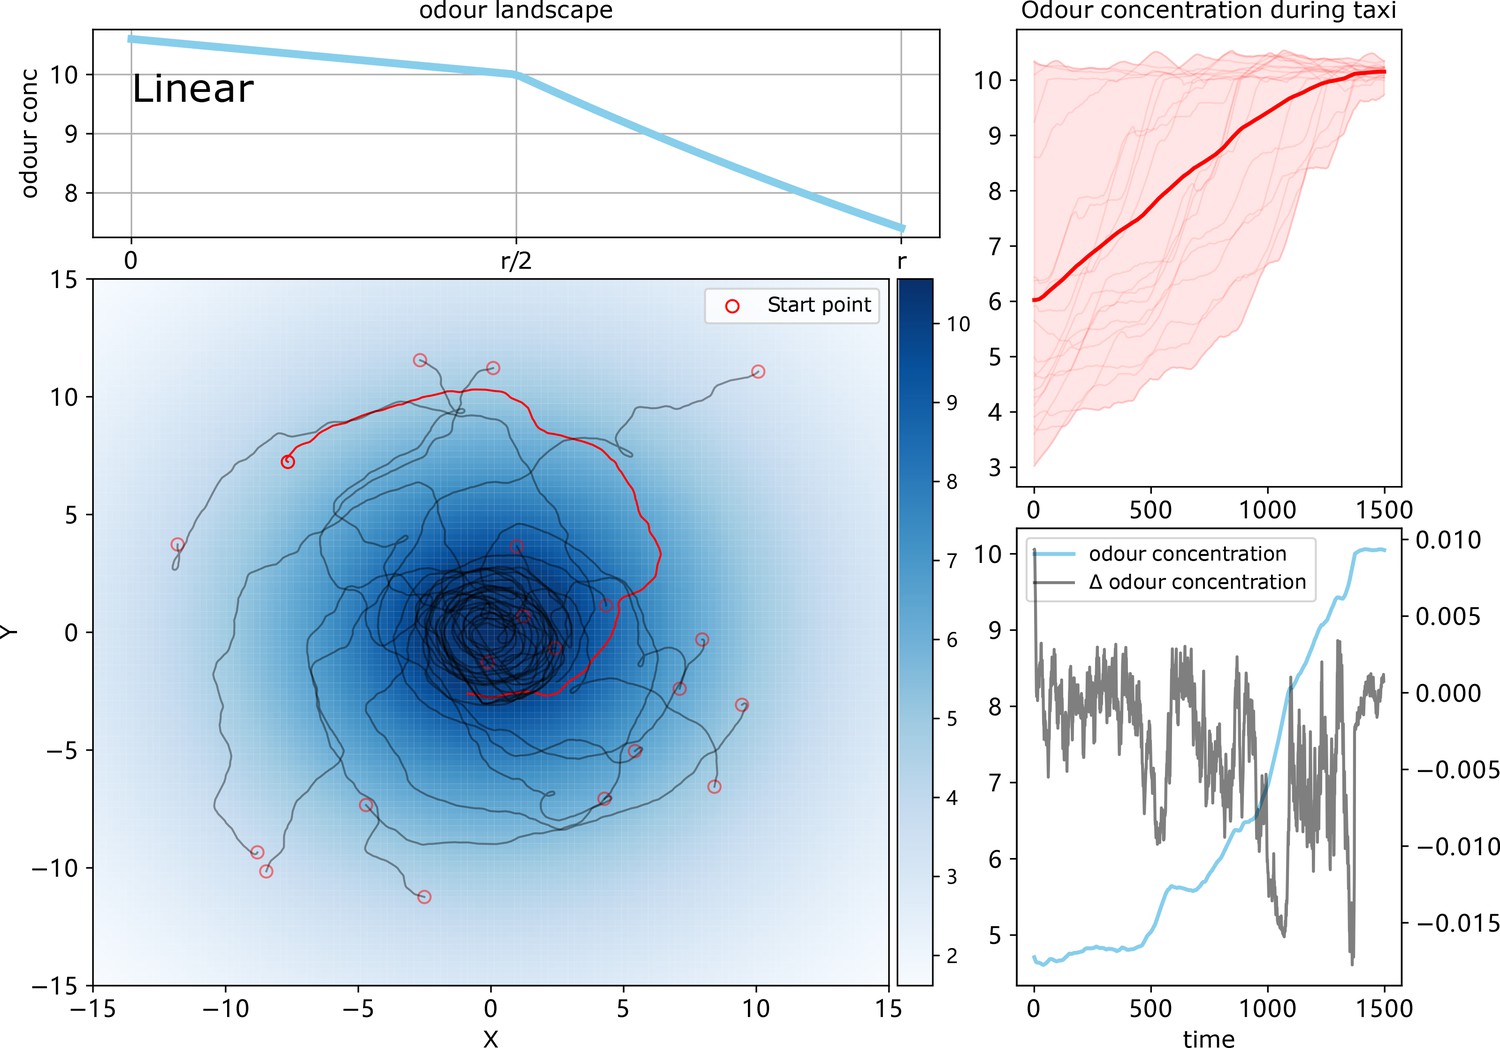
The simulation results of chemotaxis model with odour landscape of ‘linear’.
The odour field model and navigating trajectories are shown on the left whilst the perceived odour concentration and the temporal change of the highlighted agent are shown on the right.
Figure 2—figure supplement 2
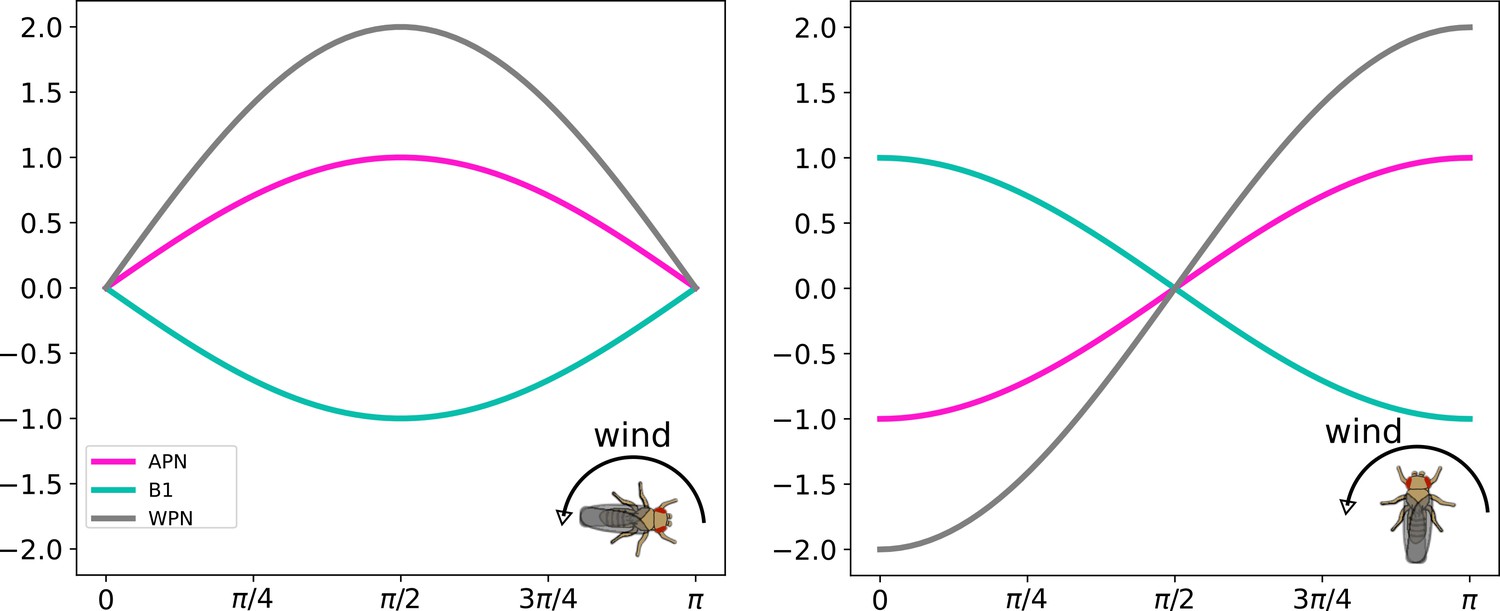
Simulation of wind direction encoding.
Neural responses of the wind direction encoding neurons with different animal headings (0 and π∕2) and the wind direction stimuli is swept from 0 to π.
Figure 2—figure supplement 3
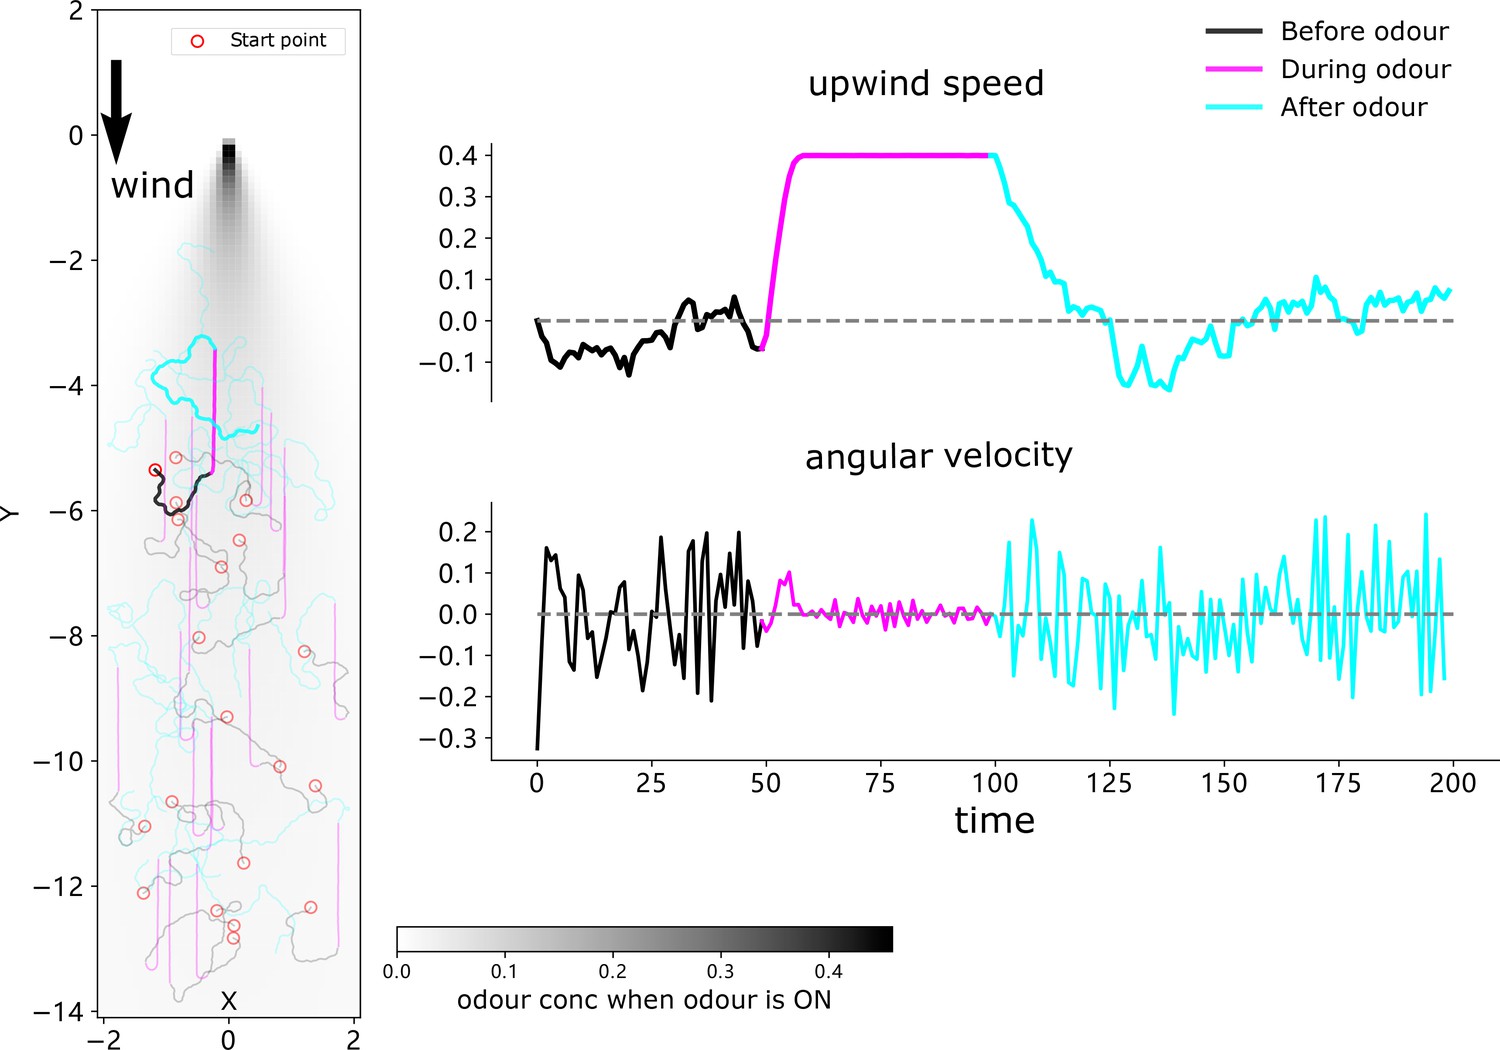
Simulation results of a group of agents (N = 20) driven by the odour-driven anemotaxis model.
Trajectories of each agents (highlighted one corresponding to that shown in Figure 3), mean upwind speed, and angular velocity of 20 simulated agents are shown.
Figure 3 with 4 supplements
Optimal coordination of guidance behaviours that share a frame of reference.
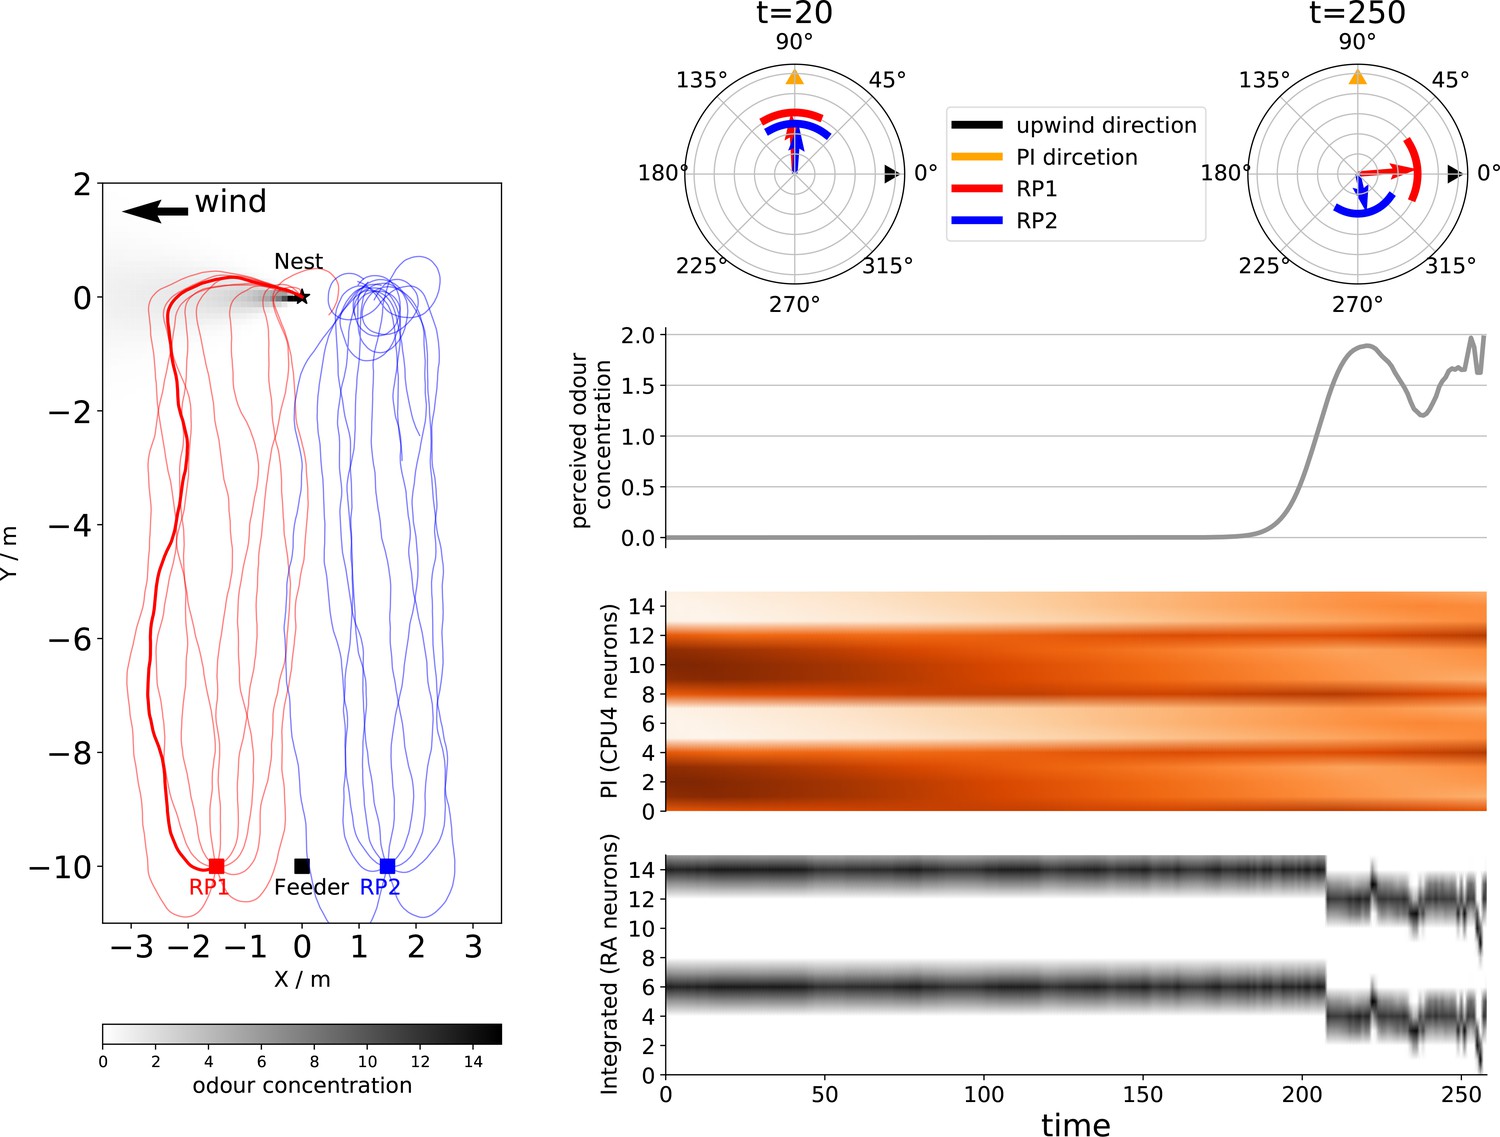
(A) Schematic diagrams of the integration circuits. Left: temporal change in odour concentration based ON and OFF responses drives the switching circuit to select between chemotaxis or anemotaxis strategies. Right: ring attractor network integrates multiple cues weighted by sensory valence. (B) Functional explanations of the model. Left: ON responses trigger upwind turns while OFF responses trigger chemotaxis, leading the animal back into the odour plume. Right: ring attractors serve as the optimal integration circuit to mediate between anemotaxis, chemotaxis, and path integration systems. (C) Example behaviours generated by the model in an anemotaxis and ant homing task. Left part of the left panel shows the trajectory of the one simulated fly, and the upwind speed and angular velocity of the agent are shown in the right part. The time at which ON and OFF responses are triggered are shown by purple dots and red stars, respectively. The left panel of the right-side data shows paths of simulated ants when guided by path integration (PI) and odour cues. Groups headings are also shown at t = 20 (early in the route when PI dominates) and t = 250 (later in the route when olfactory navigation begins to dominate as PI vector length is low).
Figure 3—figure supplement 1
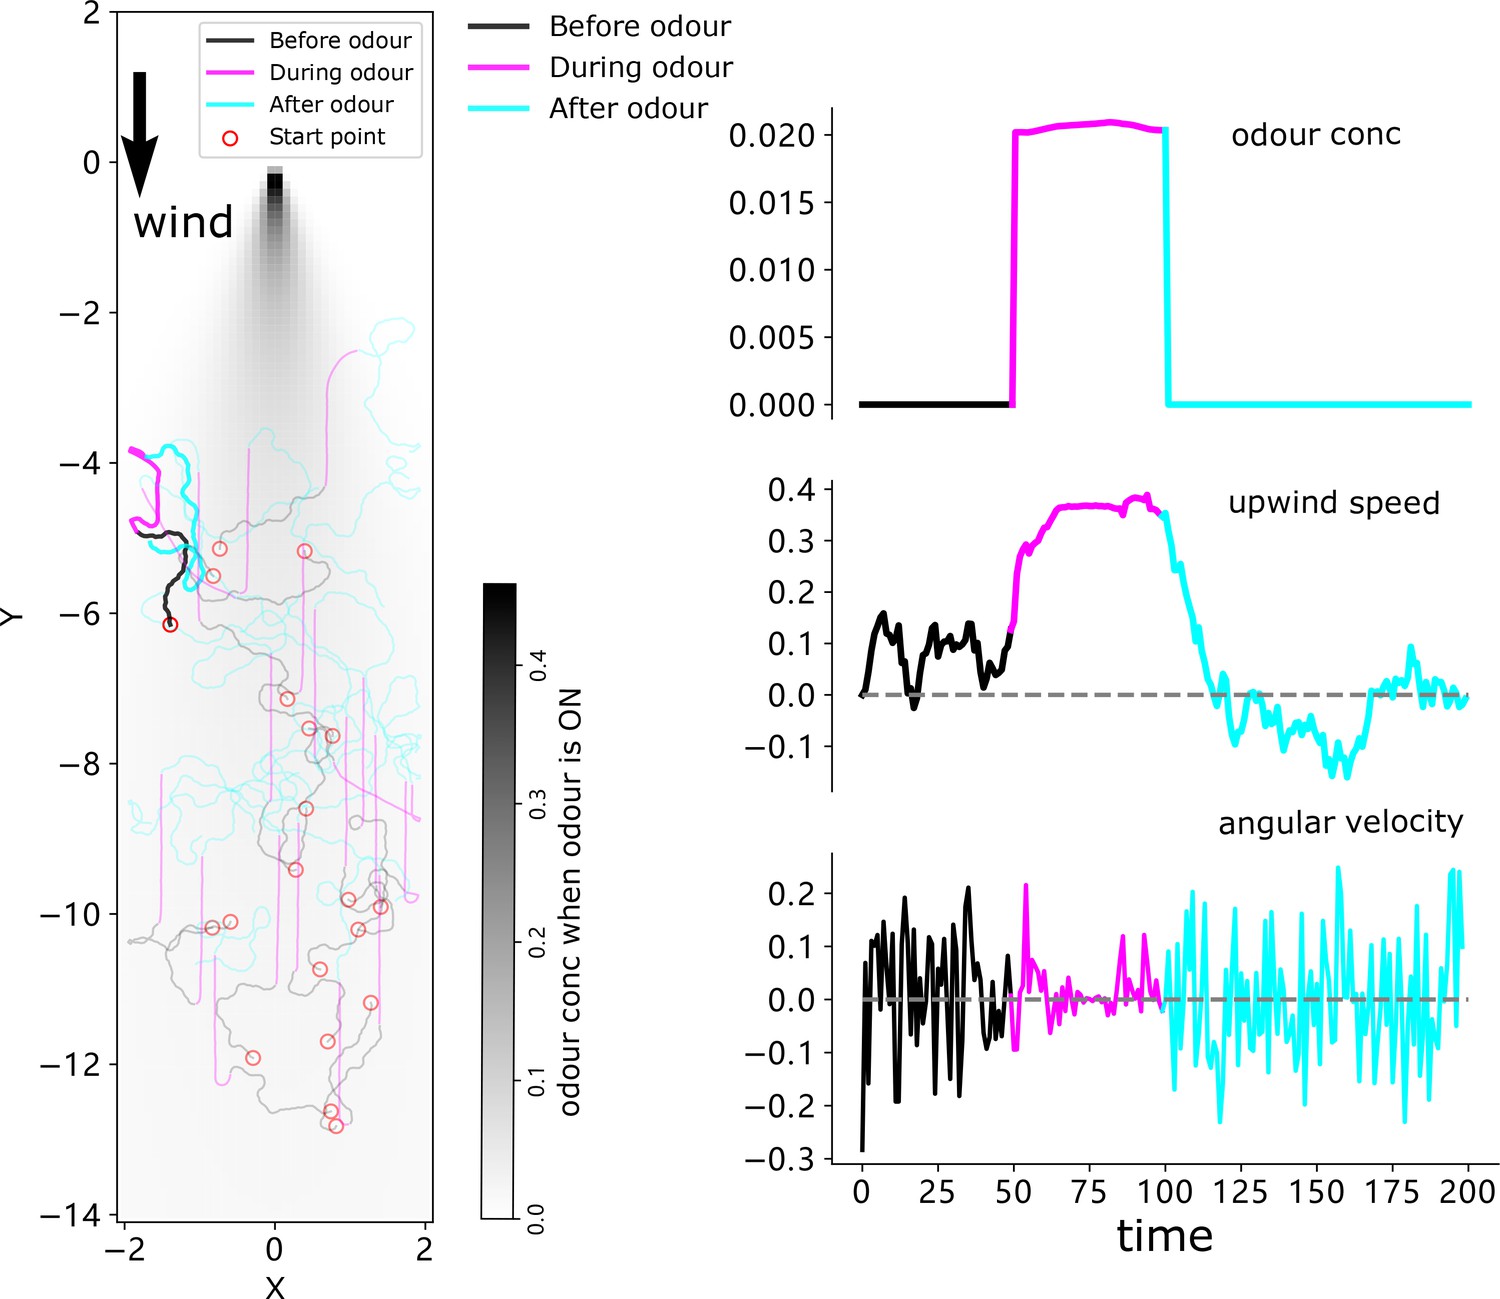
The simulation results of a 20-agent group driven by the ON and OFF responses-based switching model.
The simulation results of 20 agents. Trajectories are shown on the left with the highlighted one corresponding to that of Figure 5; mean perceived odour concentration, upwind speed, and angular velocity are plotted on the right.
Figure 3—figure supplement 2
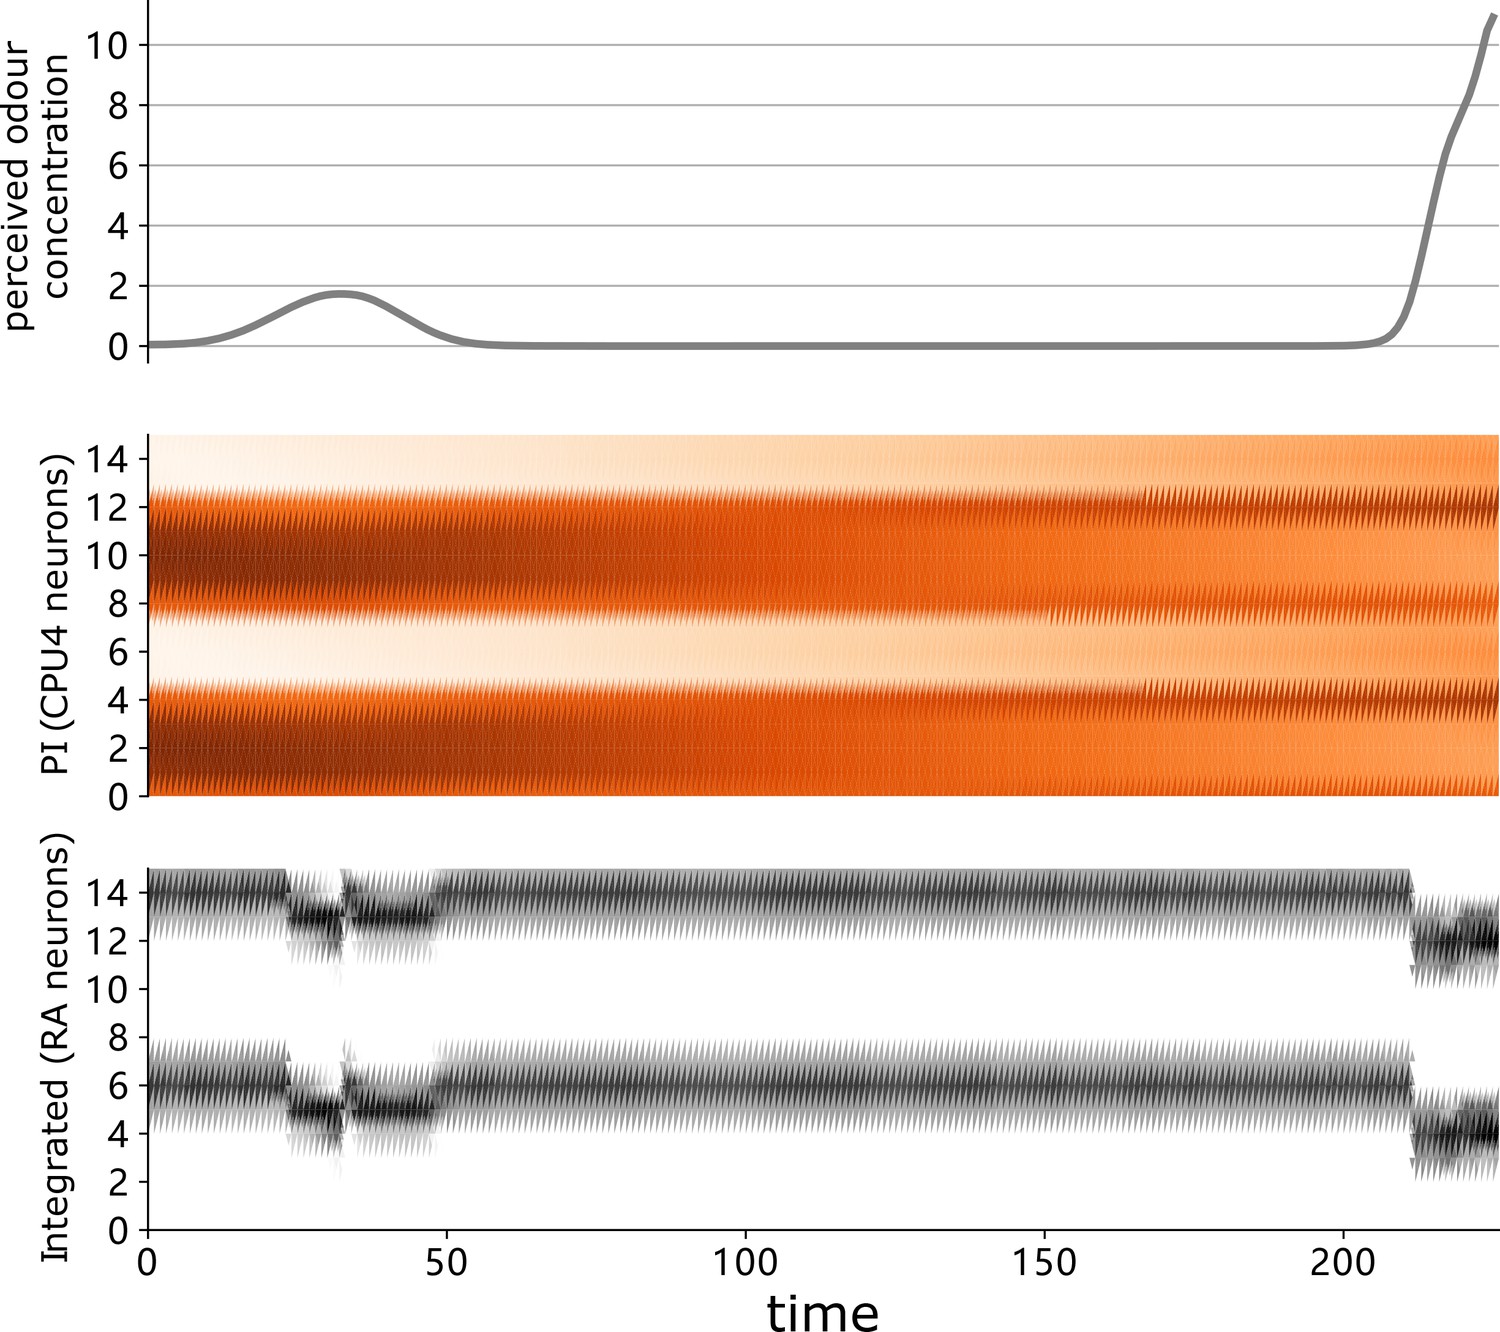
Sensory perception and neural activities of the highlighted ant driven by the proposed model.
The instantaneous sensory value and neural activation of the highlighted agent in Figure 3C (right panel) during homing. From top to bottom, the value of perceived odour concentration, the activation of path integration (PI) memory neurons (CPU4), and the ring attractor excitation neurons. Note that the output of the ring attractor neurons combines injected cues as expected.
Figure 3—figure supplement 3
Simulation results where there is no conspecific nest near the releasing points with comparison to Figure 3C, right panel.
Left part draws the simulated ants’ homing paths, and the group mean headings at t = 20 (when path integration [PI] dominated) and t = 250 (when olfactory navigation should dominate the steering) are shown on the right. The instantaneous sensory value and neural activation of the highlighted agent in the left panel during homing are shown on the right-hand panel: from top to bottom, the value of perceived odour concentration, the activation of PI memory neurons (CPU4), and the ring attractor excitation neurons.
Figure 3—video 1
The animation showing the simulation process including homing trajectories, dynamic neural activation, odour measurement, etc.
Figure 4
Navigating using egocentric and geocentric frames of reference.
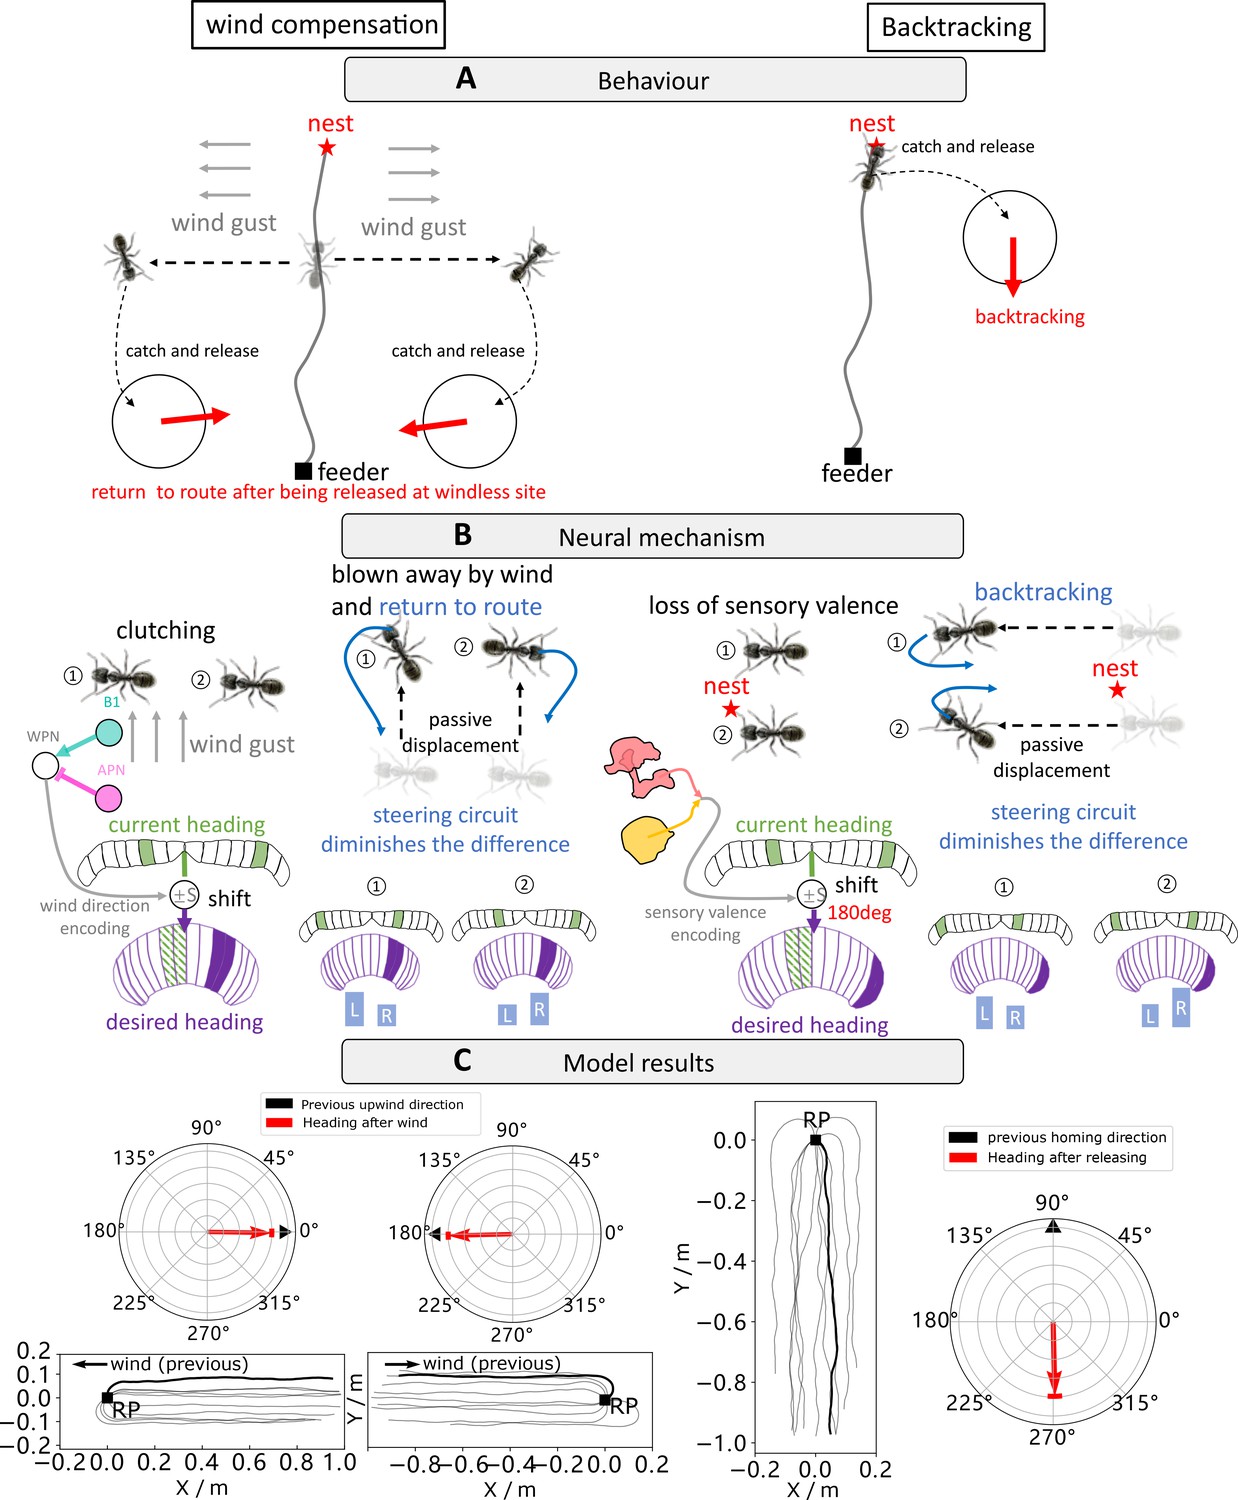
(A) Wind compensation and backtracking behaviour of navigating ants. Left panel illustrates the wind compensation behaviour where ants reorientate to the direction from which they were blown off course but with respect to their celestial compass (Wystrach and Schwarz, 2013). Right subfigure shows backtracking behaviours whereby homing desert ants captured just before entering their nest and released in unfamiliar visual surroundings initially dash back along the celestial compass heading in which they were travelling (Wystrach et al., 2013). (B) The proposed neural mechanism showing how the behaviours in (A) could be recreated. Wind compensation is implemented by using copy-and-shift to copy their heading compass stored in the central complex (CX) when clutching and shift by an amount of degree determined by the activation of wedge projection neurons (WPNs) to form the working memory (desired heading) for later navigation. Backtracking is modelled in an identical way except that the shift is constant 180°. (C) The simulation results of our model. In each panel, the navigating trajectories and initial headings of the simulated ants are shown. Simulated ants guided by the model are all heading to the expected orientation as observed in real behavioural experiments (Wystrach and Schwarz, 2013; Wystrach and Schwarz, 2013).
Figure 5
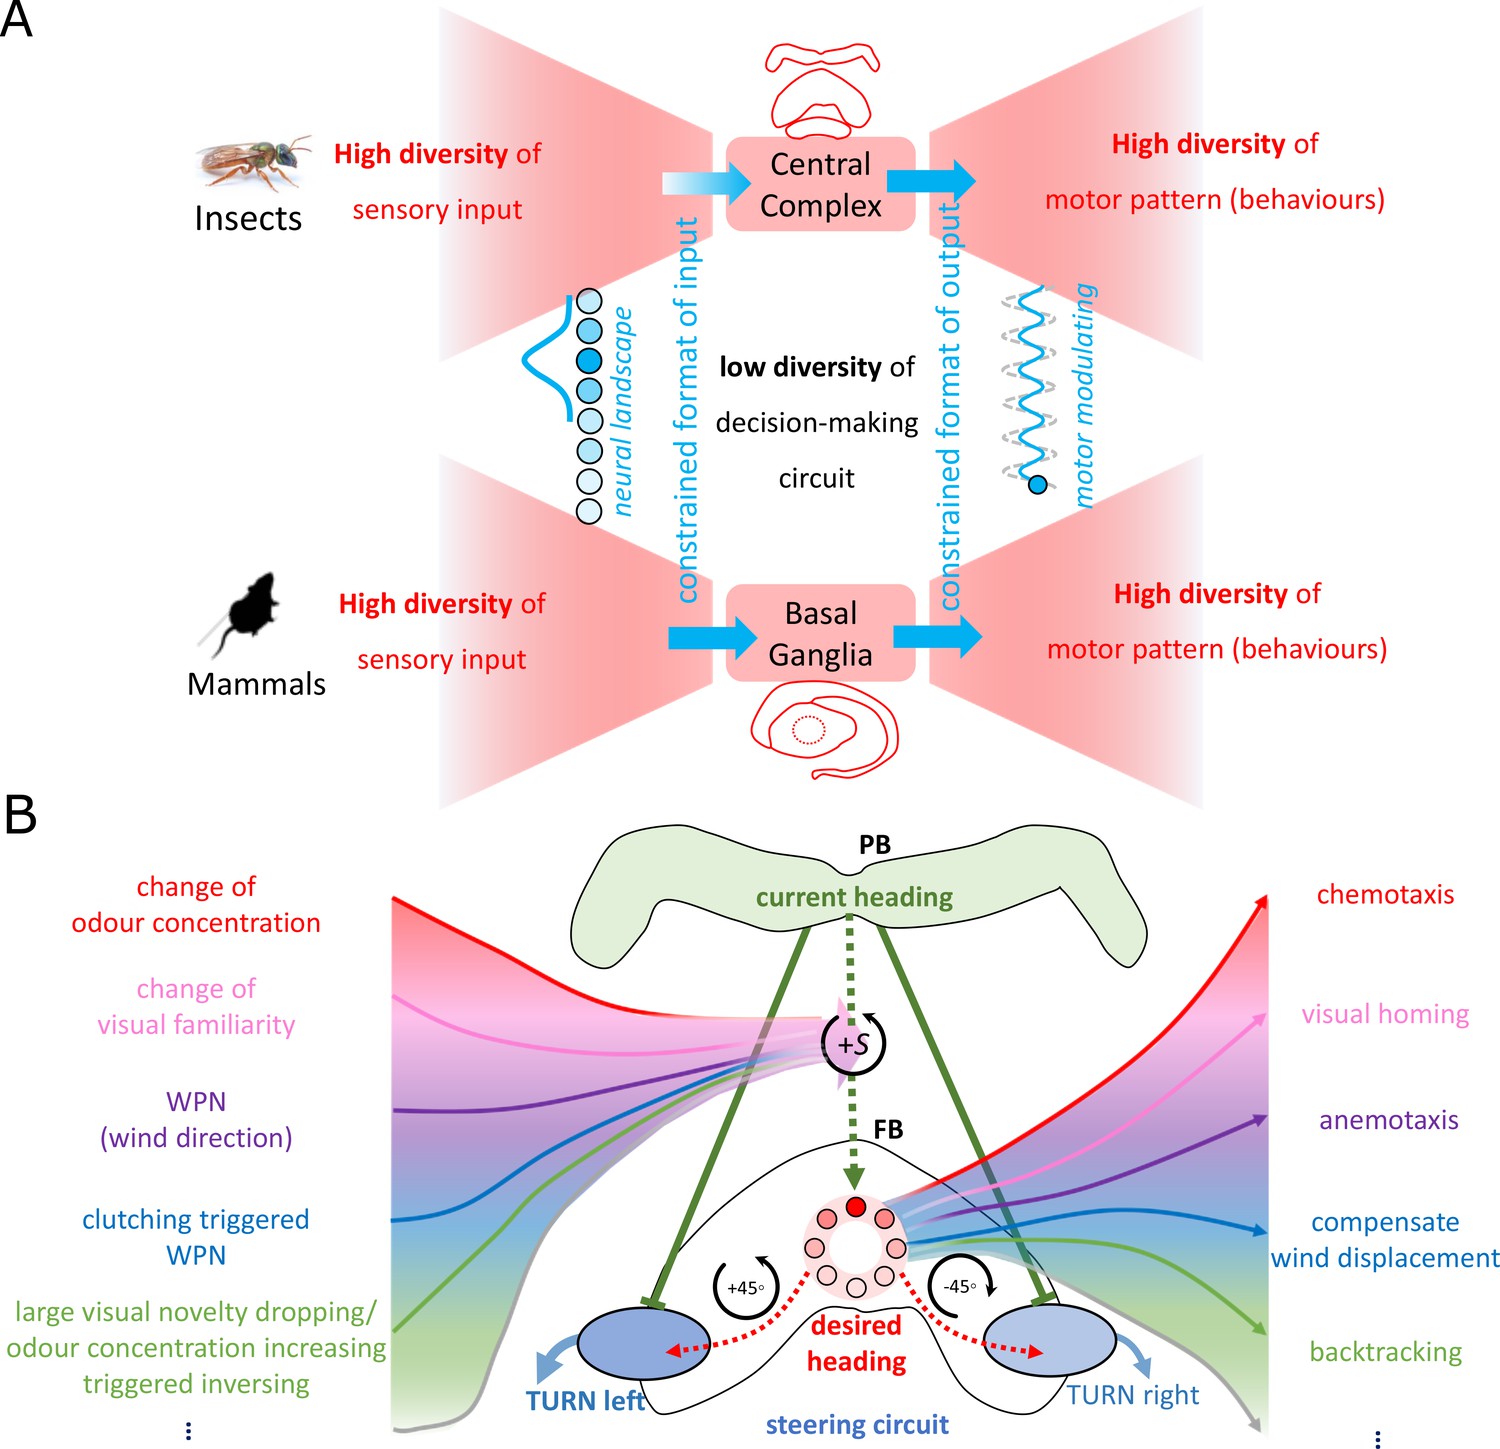
The ‘bowtie/hourglass’ architecture (Doyle and Csete, 2011) of biological control system.
(A) The control systems of insect navigation (top) and mammalian decision-making (bottom) are epitomised by the ‘bowtie’ architecture, proposing that fixed brain circuitry constrains the format of the sensory input (fanning in to the knot) but decontrains the application domains of the output behaviours (fanning out of the bowtie). Photo of sweet bee Megalopta genalis is from Ajay Narendra. (B) The proposed mapping of the bowtie architecture to the central complex (CX) for insect navigation. Specially, the copy-and-shift mechanism (regarded as the knot of the bowtie, thus constrains the representation) is reused to generate different desired headings across sensory and task domains (deconstrains the motor pattern, thus allows for high diversity of behaviours).
Tables
Table 1
'Truth table’ of the ON and OFF responses of the modelled fly odour navigation.
Columns list the state of sensed odour concentration while rows indicate the state of the changing of odour concentration.
| Random | Random | ON | |
| OFF | ON | ON |
Table 2
The detailed parameter settings for the simulations in this study.
| Fly – chemotaxis | Fly – anemotaxis | Fly – integrated | Ant – integrated | |||
|---|---|---|---|---|---|---|
| Volcano | Linear | |||||
| Odour | 10 | 10 | / | |||
| 0.1 | 0.1 | |||||
| 6 | 6 | |||||
| / | / | 10.0 | 10.0 | 20 | ||
| Wind | No wind | 10.0 | 10.0 | 10.0 | ||
| Model and simulation | / | / | 0.001 | 1.2 | ||
| 0.02 | 0.5 | |||||
| -0.0002 | -0.0002 | |||||
| ko | / | 0.5 | ||||
| 100.0 | 100.0 | / | 100.0 | 100.0 | ||
| 1.0 | 1.0 | 1.5 | 1.5 | 1.0 | ||
| 0.02 | 0.02 | 0.4 | 0.4 | 0.05 | ||
| Heading | Random | Random | Random | Random | ||
Additional files
Download links
A two-part list of links to download the article, or parts of the article, in various formats.
Downloads (link to download the article as PDF)
Open citations (links to open the citations from this article in various online reference manager services)
Cite this article (links to download the citations from this article in formats compatible with various reference manager tools)
How the insect central complex could coordinate multimodal navigation
eLife 10:e73077.
https://doi.org/10.7554/eLife.73077


