Anopheles salivary antigens as serological biomarkers of vector exposure and malaria transmission: A systematic review with multilevel modelling
- The McFarlane Burnet Institute of Medical Research and Public Health, Australia
- Centre for Epidemiology and Biostatistics, Melbourne School of Population and Global Health, The University of Melbourne, Australia
- Department of Epidemiology and Preventive Medicine, Monash University, Australia
- Shoklo Malaria Research Unit, Mahidol-Oxford Tropical Medicine Research Unit, Faculty of Tropical Medicine, Mahidol University, Thailand
- Centre for Tropical Medicine and Global Health, Nuffield Department of Medicine, University of Oxford, United Kingdom
- Department of Medicine at the Doherty Institute, The University of Melbourne, Australia
Figures
Figure 1
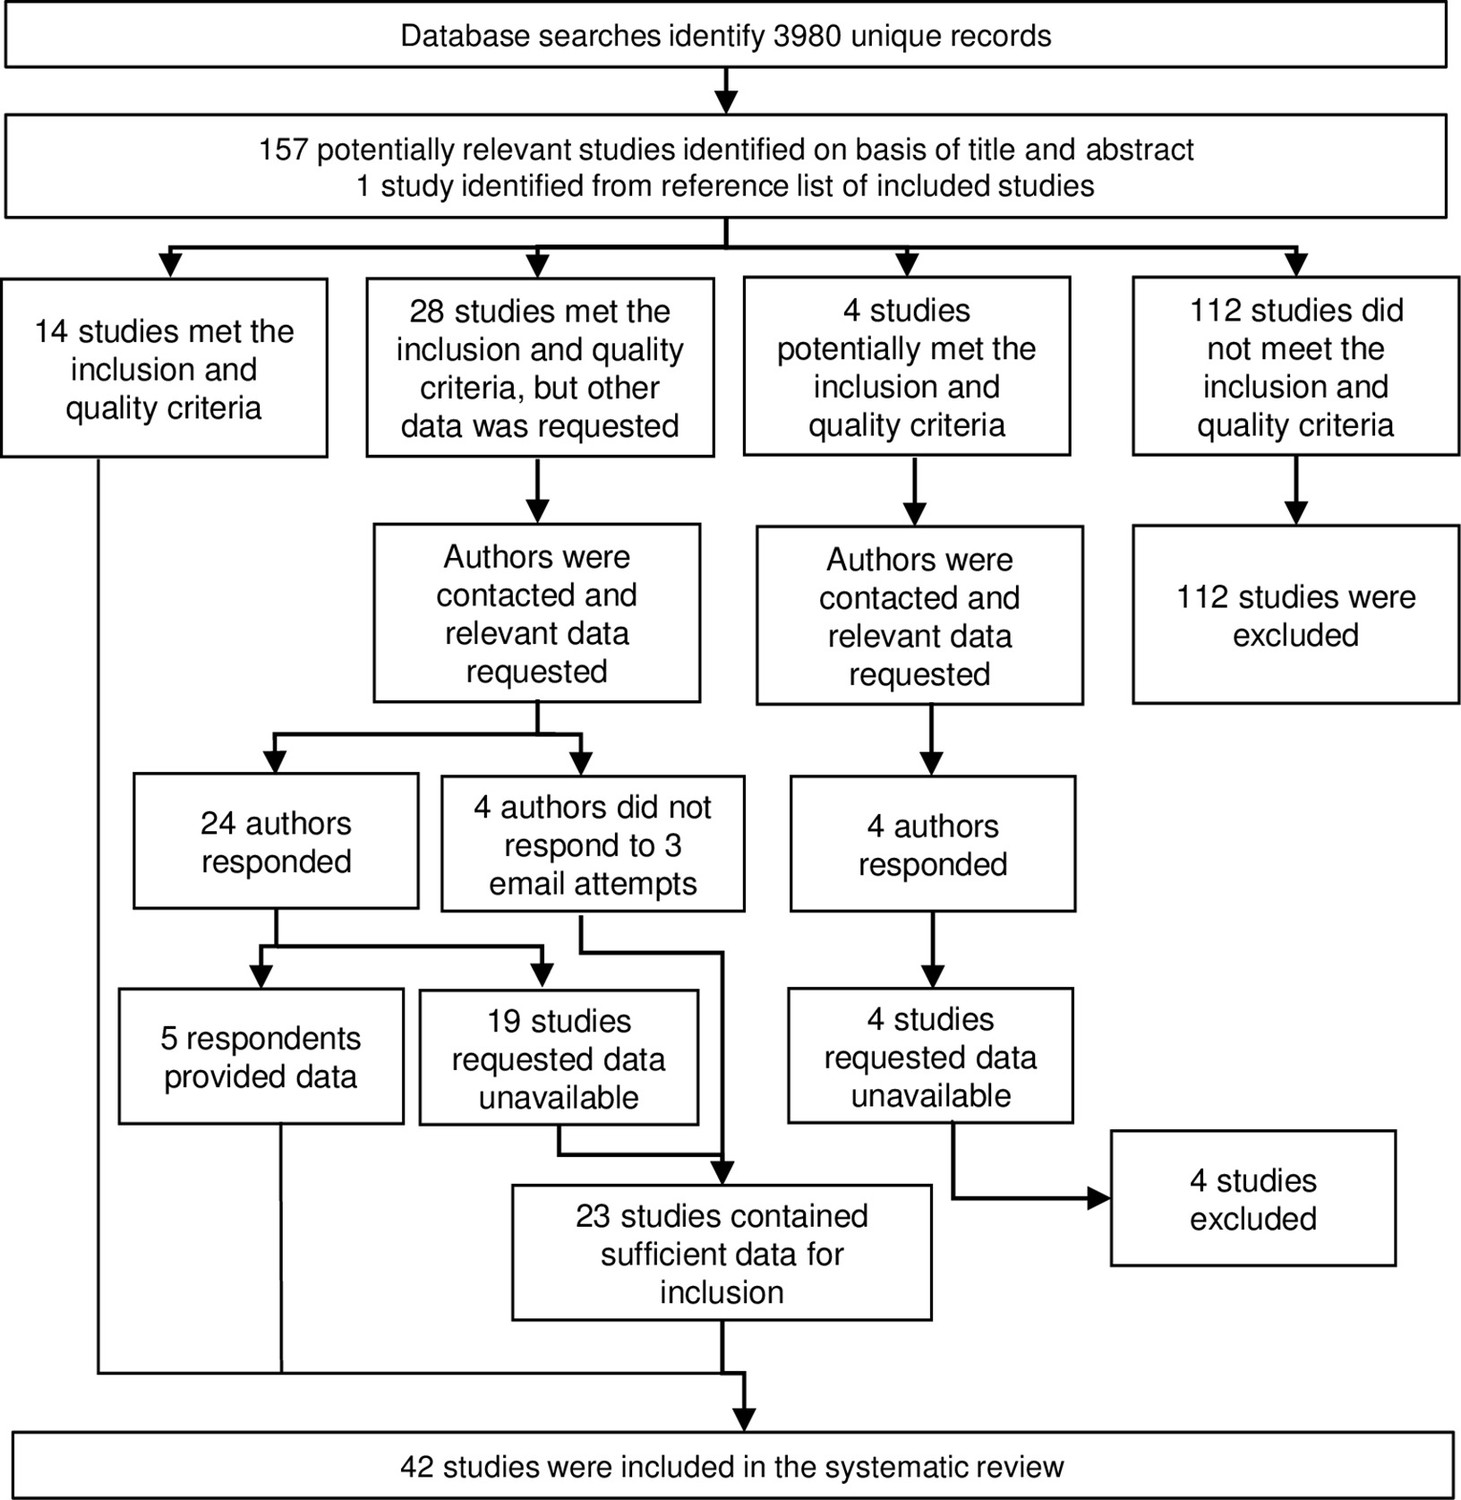
Flow diagram of study identification.
Excluded studies are detailed in Appendix 3.
Figure 2 with 1 supplement
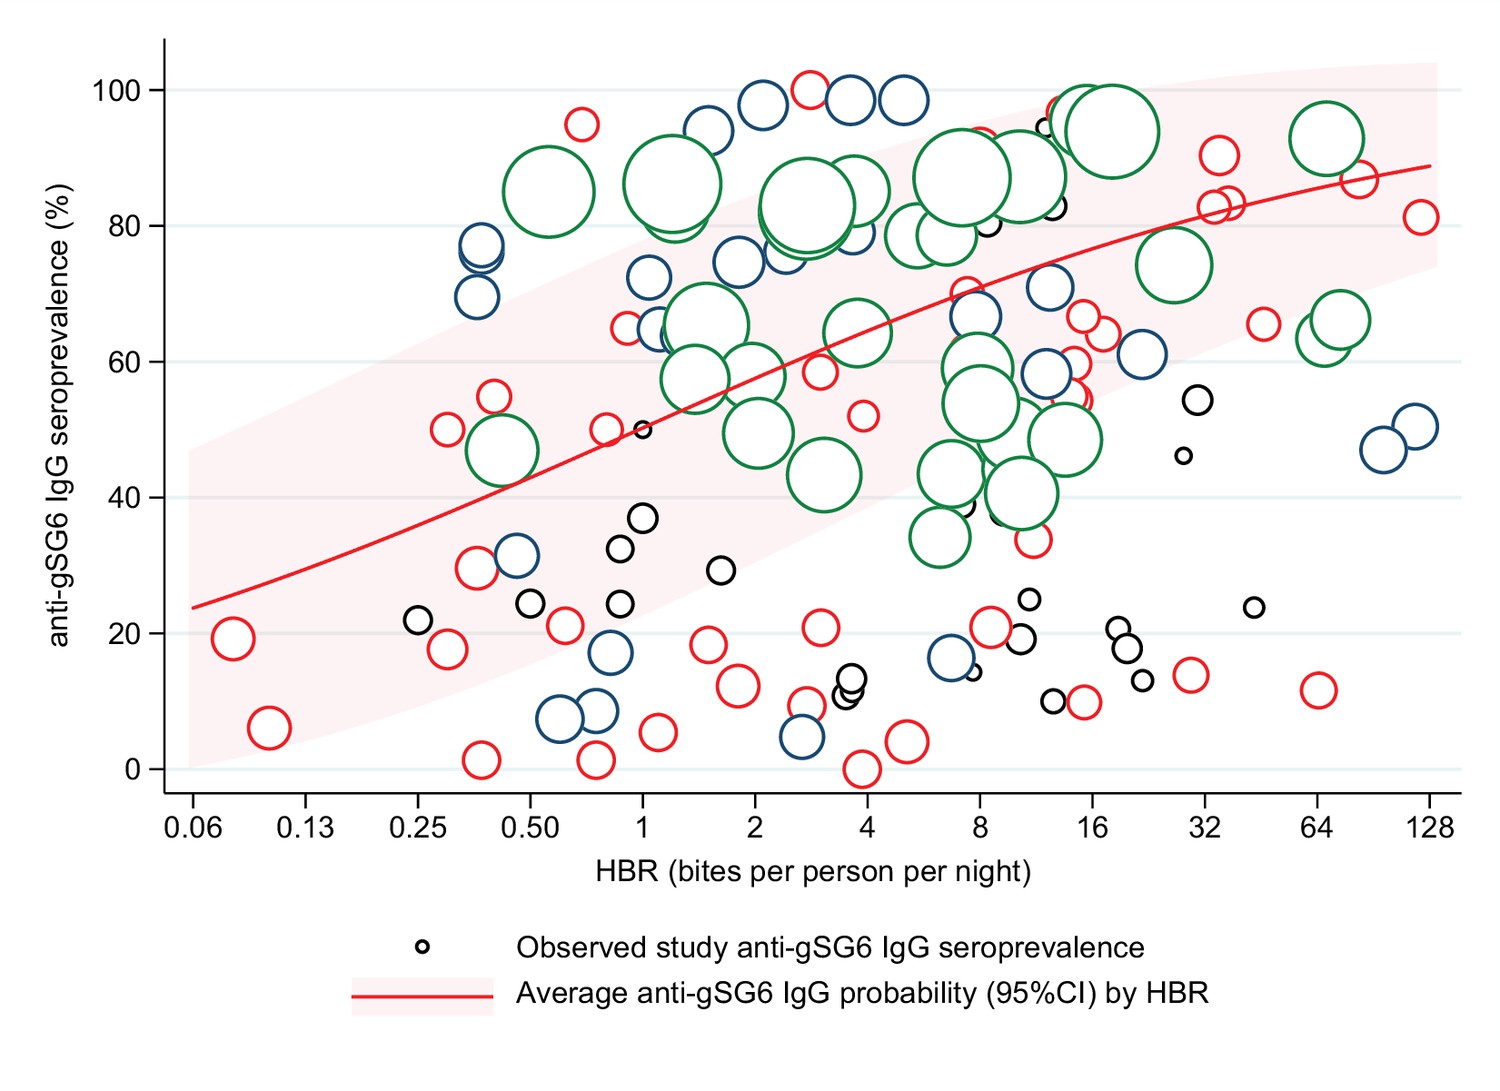
Association between anti-gSG6 IgG seroprevalence and log2 human biting rate (HBR).
Figure shows the observed anti-gSG6 (either recombinant or peptide form) IgG seroprevalence (%) and HBR for each study-specific observation, as well as the predicted average anti-gSG6 IgG seroprevalence (predicted probability for the average study and country) with 95% confidence intervals (95% CI). Circles are proportional to the size of the sample for each study-specific observation, with colours indicating sample size: black (<50), red (50–100), navy (100–150), and green (>150). Association estimated using generalised linear multilevel modelling (mixed effects, logistic) to account for the hierarchical nature of the data, where study-specific anti-gSG6 IgG observations are nested within study and study is nested within country (model output shown in Appendix 4; p<0.001).
Figure 2—figure supplement 1
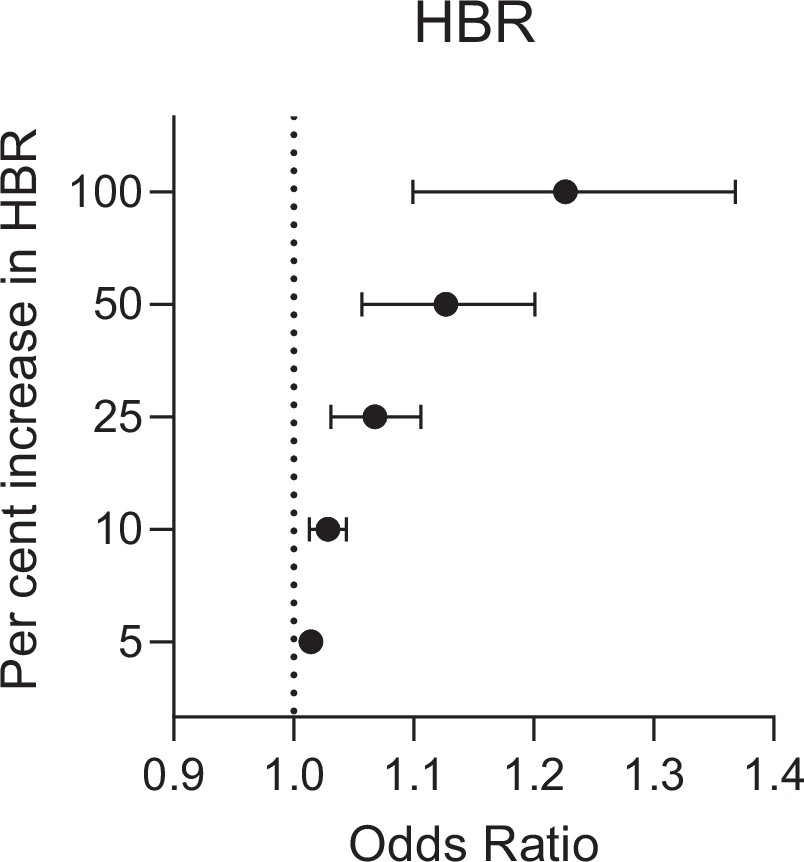
Estimated relative change in odds of anti-gSG6 IgG seropositivity (95% confidence interval) for given relative percent increases in human biting rate (HBR) (bites/person/night).
HBR has been log transformed to account for the non-linear relationship between HBR and log odds of gSG6 IgG seropositivity, where a 100% relative increase in HBR corresponds to a twofold increase in HBR. Estimated using generalised linear multilevel modelling (mixed effects, logistic) of the association between anti-gSG6 IgG seropositivity and log HBR, with random effects for country-specific and study-specific heterogeneity in gSG6 IgG seroprevalence and study-specific heterogeneity in effect of HBR (see Appendix 4).
Figure 3 with 1 supplement
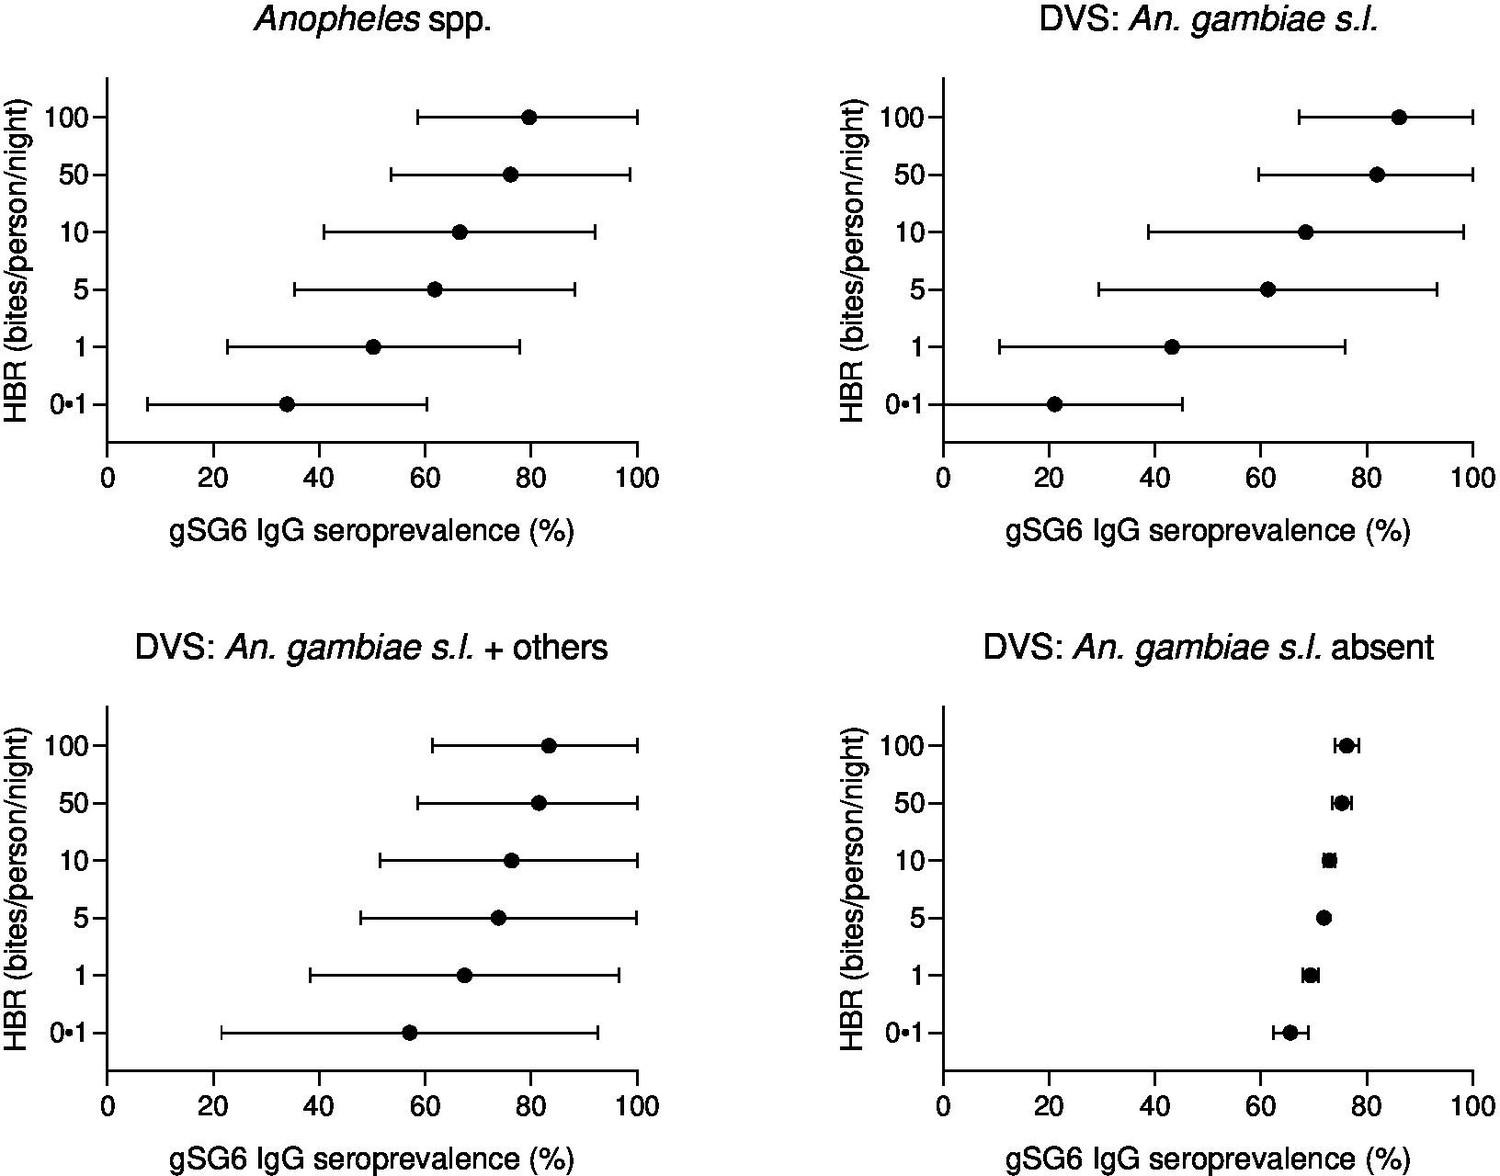
Forest plots of predicted anti-gSG6 IgG seroprevalence (%) and Anopheles species-specific human biting rate (HBR).
Panels show the predicted average anti-gSG6 IgG seroprevalence (predicted probability for the average study and country) with 95% confidence intervals for given HBR, for all Anopheles spp. (using model output from Appendix 4) and for specific-dominant vector species (DVS): where An. gambiae s.l. is the only DVS, where other DVS were present in addition to An. gambiae s.l. and where An. gambiae s.l. was absent (using model output from Appendix 5).
Figure 3—figure supplement 1
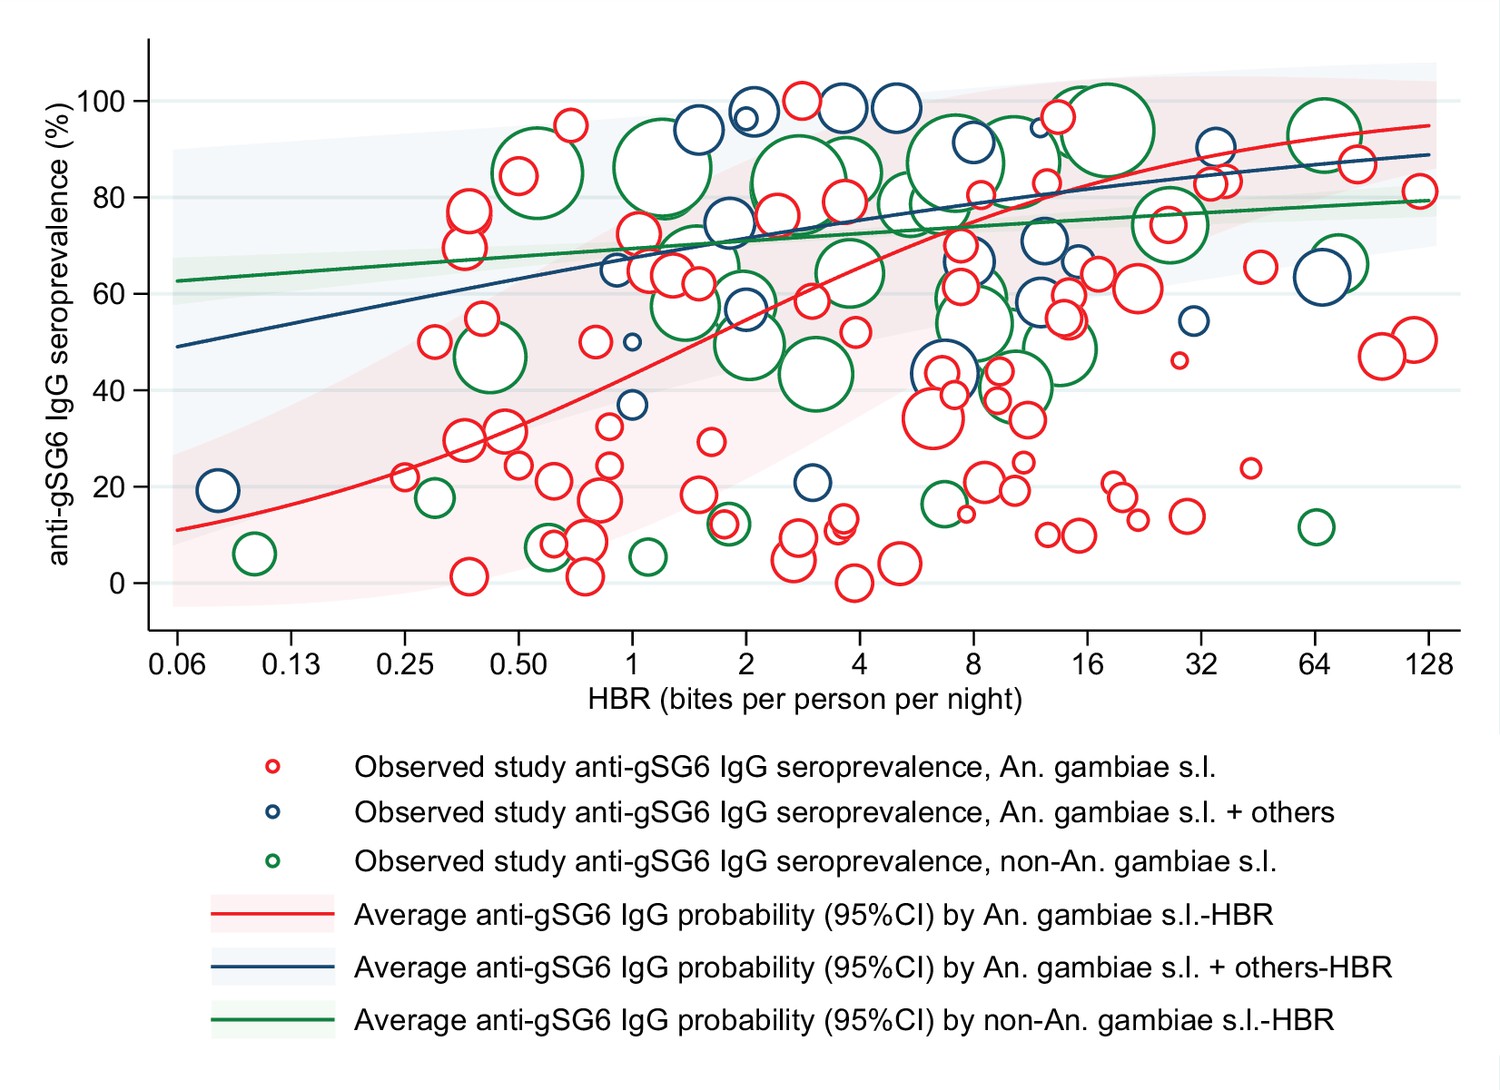
Association between anti-gSG6 IgG seroprevalence and Anopheles species-specific log2 human biting rate (HBR).
Figure shows the observed anti-gSG6 (either recombinant or peptide form) IgG seroprevalence (%) and HBR for each study-specific observation coloured by dominant vector species (DVS), as well as the predicted average anti-gSG6 IgG seroprevalence (predicted probability for the average study and country) with 95% confidence intervals (95% CI). Coloured circles and lines denote DVS, with red indicating where An. gambiae s.l. is the only DVS, navy where other DVS were present in addition to An. gambiae s.l., and green where An. gambiae s.l. was absent. Circles are proportional to the size of the sample for each study-specific estimate. Association estimated using generalised linear multilevel modelling (mixed effects, logistic) to account for the hierarchical nature of the data, where study-specific anti-gSG6 IgG observations, are nested within study, and study is nested within country.
Figure 4 with 1 supplement

Association between anti-gSG6 IgG seroprevalence and log2 entomological inoculation rate (EIR).
Figure shows the observed anti-gSG6 (either recombinant or peptide form) IgG seroprevalence (%) and EIR for each study-specific observation, as well as the predicted average anti-gSG6 IgG seroprevalence (predicted probability for the average study and country) with 95% confidence intervals (95% CI). Circles are proportional to the size of the sample for each study-specific estimate, with colours indicating sample size: black (<50), red (50–100), navy (100–150), and green (>150). Association estimated using generalised linear multilevel modelling (mixed effects, logistic) to account for the hierarchical nature of the data, where study-specific anti-gSG6 IgG observations are nested within study and study is nested within country (model output shown in Appendix 6; p<0.001).
Figure 4—figure supplement 1
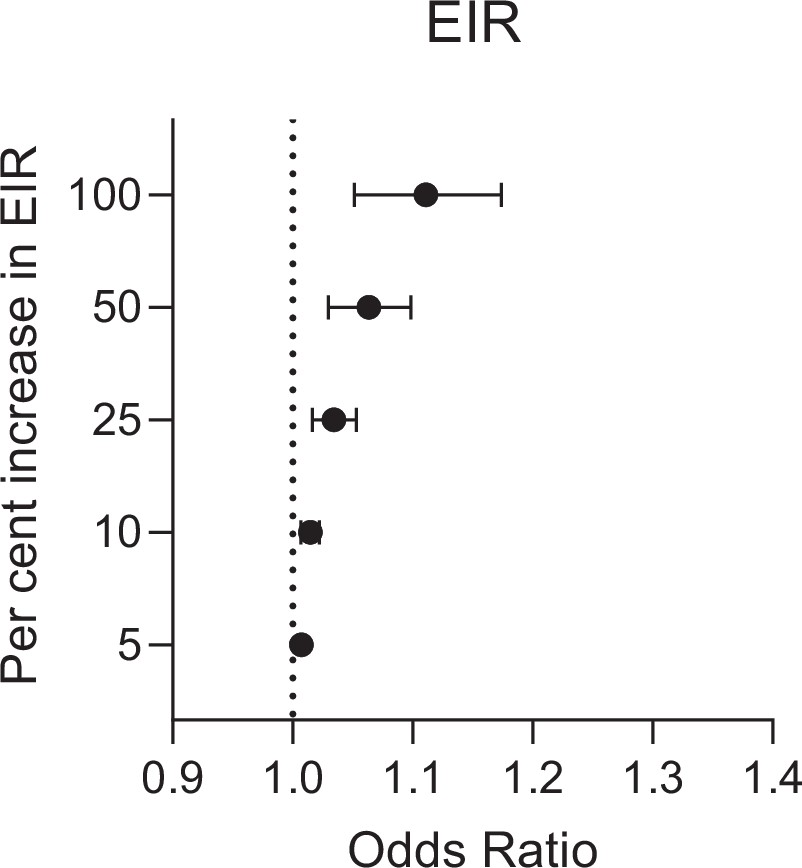
Estimated change in odds of anti-gSG6 IgG seropositivity (95% confidence interval) for given relative percent increases in entomological inoculation rate (EIR) (infective bites/person/night).
EIR has been log transformed to account for the non-linear relationship between EIR and log odds of gSG6 IgG seropositivity, where a 100% relative increase in EIR corresponds to a twofold increase in EIR. Estimated using generalised linear multilevel modelling (mixed effects, logistic) of the association between anti-gSG6 IgG seropositivity and log EIR, with random effects for country-specific and study-specific heterogeneity in gSG6 IgG seroprevalence and study-specific heterogeneity in effect of EIR (see Appendix 6).
Figure 5
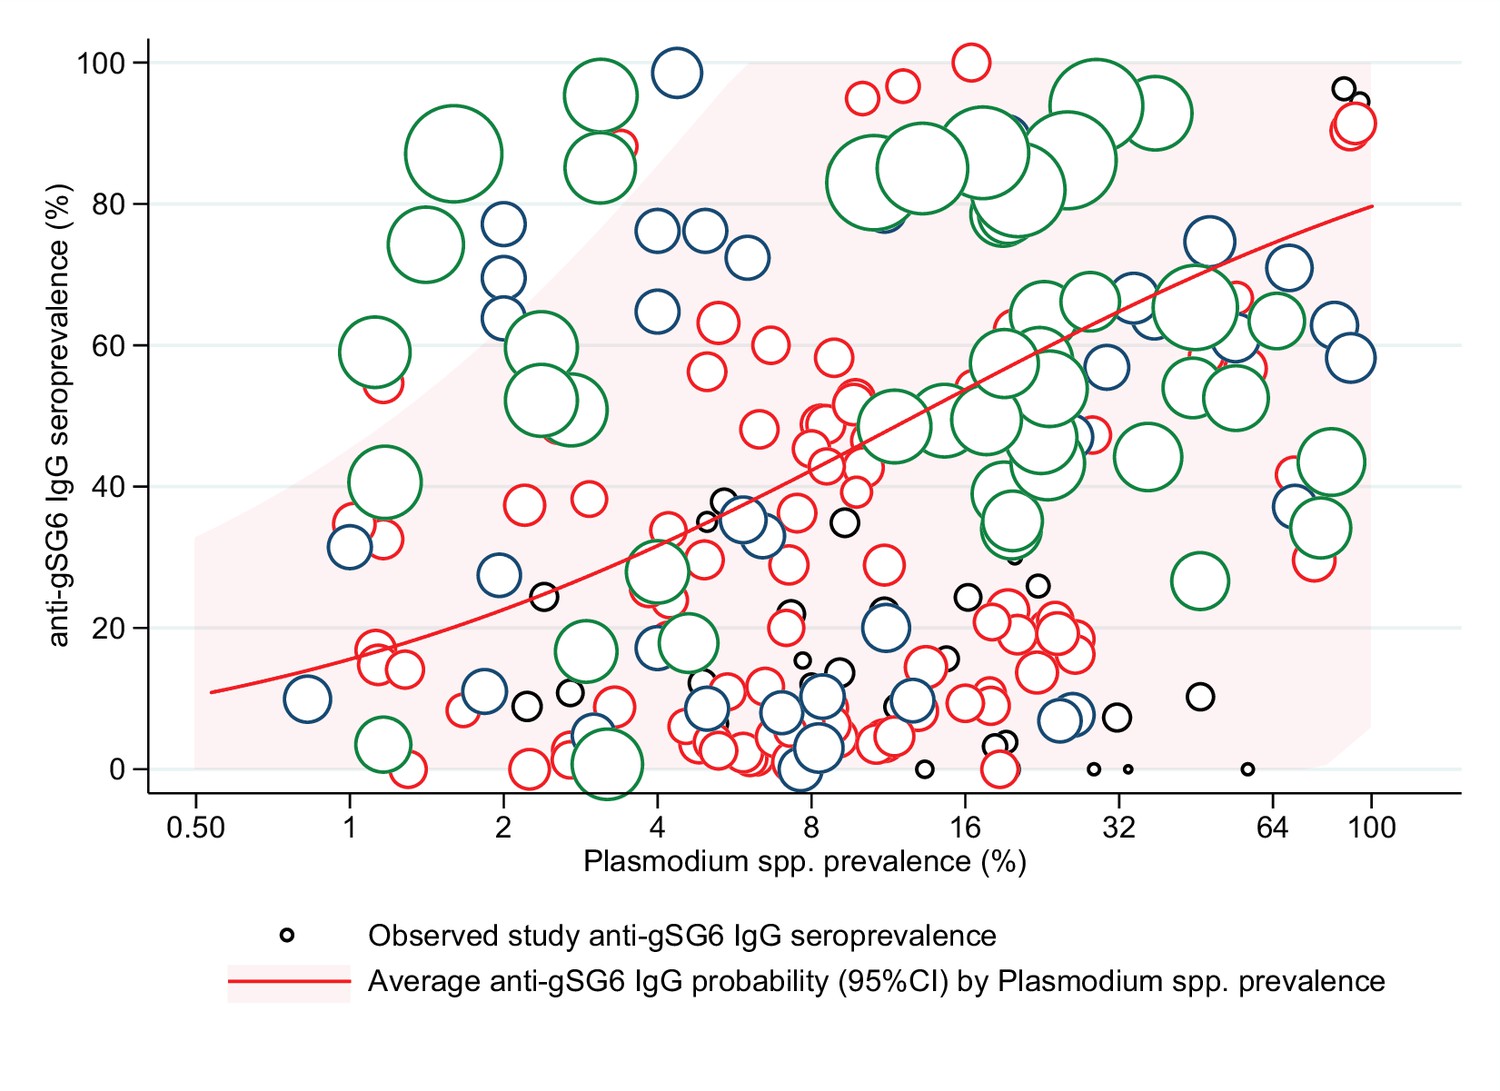
The association between anti-gSG6 IgG seroprevalence (%) and log2 Plasmodium spp. prevalence (%).
Figure shows the observed anti-gSG6 (either recombinant or peptide form) IgG seroprevalence (%) and prevalence of any Plasmodium spp. infection (%) for each study-specific observation, as well as the predicted average anti-gSG6 IgG seroprevalence (predicted probability for average study) with 95% confidence intervals (95% CI). Circles are proportional to the size of the sample for each study-specific observation, with colours indicating sample size: black (<50), red (50–100), navy (100–150), and green (>150). Association estimated using generalised linear multilevel modelling (mixed effects, logistic) to account for the hierarchical nature of the data, where study-specific anti-gSG6 IgG observations are nested within study. See Appendix 7 for model output.
Appendix 2—figure 1
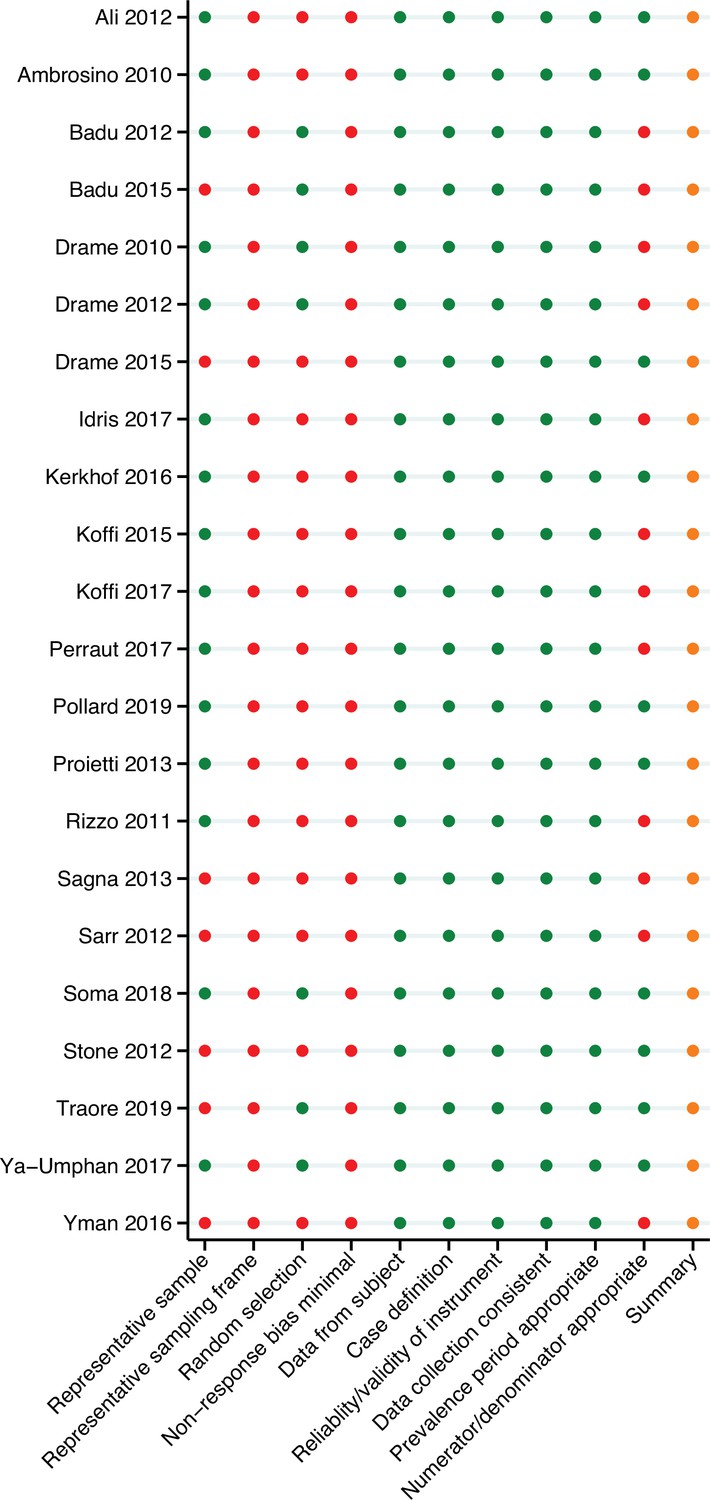
Risk of bias assessment.
Red, high risk; orange, moderate risk; green, low risk.
Appendix 9—figure 1

Predicted gSG6 IgG seroprevalence by country.
Predicted probabilities of gSG6 IgG seropositivity including country-specific random effects with 95% confidence intervals. Estimated from intercept-only three-level random-effects logistic regression to account for the hierarchical nature of the data, with study-specific anti-gSG6 IgG observation nested within study nested within country. Based upon n = 301 study-specific observations from 22 studies. Of note, nine studies that measured IgG antibodies to gSG6 were excluded from this analysis as eight only reported gSG6 IgG levels and one was a case–control study.
Appendix 9—figure 2

Predicted gSG6 IgG seroprevalence by study.
Predicted probabilities of gSG6 IgG seropositivity including study-specific random effects with 95% confidence intervals. Estimated from intercept-only three-level random-effects logistic regression to account for the hierarchical nature of the data, with study-specific anti-gSG6 IgG observation nested within study nested within country. Based upon n = 301 study-specific observations from 22 studies. Of note, nine studies that measured IgG antibodies to gSG6 were excluded from this analysis as eight only reported gSG6 IgG levels and one was a case–control study.
Tables
Table 1
Key descriptive information from included studies.
| Study year | Country | Malarial endemicity class | Dominant malaria vector species | Study design | No.participants(samples) | Study-specific n | Vector and malariometric variables | Salivary antibody outcomes(seroprevalence [%];[L]evels) |
|---|---|---|---|---|---|---|---|---|
| Africa | ||||||||
| Brosseau et al., 2012 | Angola | Hypoendemic;mesoendemic | An. gambiae s.l.;An. funestus | Cross-sectional‡ | -(1584) | 6 | Plas+LM; PfPR | gSGE IgG [L] |
| Drame et al., 2010a | Angola | Hypoendemic | An. gambiae s.l. | Cohort | 105(1470) | 12 | HBR; Plas+LM; PfPR | gSG6-P1 IgG [%; L] |
| Drame et al., 2010b | Angola | Hypoendemic | An. gambiae s.l. | Cohort | 109(1279) | 12 | HBR; Plas+LM; PfPR | gSGE IgG [L] |
| Marie et al., 2015 | Angola | Hypoendemic | An. gambiae s.l. | Cohort | 71(852) | 12 | HBR; PfPR | gcE5 IgG [L] |
| Drame et al., 2015 | Benin | Hyperendemic | An. gambiae s.l.;An. funestus | Cohort‡ | 133(532) | 4 | HBR; PfPR | gSG6-P1 IgG and IgM [%; L] |
| Rizzo et al., 2011b | Burkina Faso | Hyperendemic* | An. gambiae s.l. | Repeated cross-sectional | -(2066) | 14 | HBR; EIR; Plas+LM§ | gSG6 IgG [%; L] |
| Rizzo et al., 2011a | Burkina Faso | Hyperendemic* | An. gambiae s.l. | Repeated cross-sectional | 335(335) | 3 | HBR | fSG6 IgG [%; L] |
| Rizzo et al., 2014a | Burkina Faso | Hyperendemic* | An. gambiae s.l. | Repeated cross-sectional | -(359) | 3 | HBR | gcE5 IgG [%; L]; IgG1 and IgG4 [L] |
| Rizzo et al., 2014b | Burkina Faso | Hyperendemic* | An. gambiae s.l. | Repeated cross-sectional | 270(270) | 6 | HBR | gSG6 IgG1 and IgG4 [L] |
| Soma et al., 2018 | Burkina Faso | Mesoendemic | An. gambiae s.l. | Cross-sectional | 1,728(273) | 6 | HBR; EIR; Plas+LM; PfPR | gSG6-P1 IgG [%; L] |
| Koffi et al., 2015 | Cote d'Ivoire | Hypoendemic;mesoendemic | An. gambiae s.l.;An. funestus† | Cross-sectional | 94(94) | 3 | Plas+LM; Pf-IgG; PfPR | gSG6-P1 IgG [%; L] |
| Koffi et al., 2017 | Cote d'Ivoire | Hypoendemic | An. gambiae s.l.;An. funestus† | Repeated cross-sectional | 234(234) | 5 | Pf-IgG; PfPR | gSG6-P1 IgG [%; L] |
| Traoré et al., 2018 | Cote d'Ivoire | Hypoendemic | An. gambiae s.l. | Repeated cross-sectional‡ | 89 (178) | 4 | HBR; Plas+LM; PfPR | gSG6-P1 IgG [L] |
| Traoré et al., 2019 | Cote d'Ivoire | Hypoendemic | An. gambiae s.l.;An. funestus† | Repeated cross-sectional‡ | -(442) | 6 | HBR; Plas+LM; PfPR | gSG6-P1 IgG [%; L] |
| Sadia-Kacou et al., 2019 | Cote d'Ivoire | Mesoendemic | An. gambiae s.l. | Repeated cross-sectional‡ | 775(775) | 8 | PfPR | gSG6-P1 IgG [L] |
| Badu et al., 2015 | Ghana | Mesoendemic | An. gambiae s.l.;An. funestus† | Repeated cross-sectional‡ | 295(885) | 3 | Plas+LM; Pf-IgG; PfPR | gSG6-P1 IgG [%; L] |
| Badu et al., 2012b | Kenya | Hypoendemic;mesoendemic | An. gambiae s.l. | Repeated cross-sectional | -(1366) | 5 | EIR; Plas+LM§; PfPR | gSG6-P1 IgG [%; L] |
| Sagna et al., 2013b | Senegal | Hypoendemic;mesoendemic | An. gambiae s.l. | Cohort‡ | 265(1325) | 25 | HBR; Plas+LM§; PfPR | gSG6-P1 IgG [%; L] |
| Drame et al., 2012 | Senegal | Hypoendemic | An. gambiae s.l. | Cross-sectional | 1010(1010) | 16 | HBR; PfPR | gSG6-P1 IgG [%; L] |
| Poinsignon et al., 2010b | Senegal | Hypoendemic | An. funestus | Cohort‡ | 87(261) | 3 | HBR; Plas+LM§; PfPR | gSG6-P1 IgG [L] |
| Sarr et al., 2012 | Senegal | Hypoendemic;mesoendemic | An. gambiae s.l.;An. funestus† | Repeated cross-sectional‡ | -(401) | 4 | HBR; Plas+LM§; Pf-IgG; PfPR | gSG6-P1 IgG [%; L] |
| Lawaly et al., 2012 | Senegal | Mesoendemic | An. gambiae s.l. | Cohort | 387(711) | 4 | HBR; Plas+LM§; PfPR | gSGE IgG, IgG4 and IgE [L] |
| Ali et al., 2012 | Senegal | Hypoendemic;*mesoendemic;*hyperendemic* | An. gambiae s.l.;An. funestus;An. pharoensis | Cross-sectional | -(134) | 3 | HBR; EIR | gSG6 IgG [%; L] fSG6 IgG [%; L]; f5’nuc IgG [%; L]; g5’nuc IgG [%; L] |
| Ambrosino et al., 2010 | Senegal | Hypoendemic;*mesoendemic;*hyperendemic* | An. gambiae s.l.;An. funestus;An. pharoensis | Cross-sectional | -(123) | 3 | EIR; Pf-IgG | gSG6-P1 IgG [%]; gSG6-P2 IgG [%] |
| Perraut et al., 2017 | Senegal | Hypoendemic;mesoendemic | An. gambiae s.l.; An. funestus | Repeated cross-sectional | -(798) | 4 | EIR; Plas+LM; Plas+PCR; Pf-IgG; PfPR | gSG6-P1 IgG [%] |
| Poinsignon et al., 2008a | Senegal | Mesoendemic | An. gambiae s.l. | Cross-sectional‡ | 241(241) | 3 | HBR; PfPR | gSG6-P1 IgG [L]; gSG6-P2 IgG [L] |
| Poinsignon et al., 2009 | Senegal | Mesoendemic | An. gambiae s.l. | Repeated cross-sectional‡ | 61 (122) | 2 | HBR; Plas+LM§; PfPR | gSG6-P1 IgG [L] |
| Remoue et al., 2006 | Senegal | Mesoendemic | An. gambiae s.l. | Cross-sectional‡ | 448(448) | 4 | HBR; Plas+LM§; PfPR | gSGE IgG [%; L] |
| Sagna et al., 2019 | Senegal | Hypoendemic | An. gambiae s.l.† | Cross-sectional‡ | 809(809) | 4 | PfPR | gSG6-P1 IgG [L] |
| Stone et al., 2012 | Tanzania | Mesoendemic;hyperendemic | An. gambiae s.l. | Cross-sectional‡ | 636(636) | 16 | HBR; Pf-IgG; PfPR | gSG6 IgG [%; L] |
| Yman et al., 2016 | Tanzania | Mesoendemic;holoendemic* | An. gambiae s.l.;An. funestus | Repeated cross-sectional‡ | 668(668) | 16 | Pf-IgG; PfPR | gSG6 IgG [%] |
| Proietti et al., 2013 | Uganda | Mesoendemic | An. gambiae s.l.;An. funestus† | Repeated cross-sectional | 509(509) | 3 | Pf-IgG; PfPR | gSG6 IgG [%] |
| South America | ||||||||
| Andrade et al., 2009 | Brazil | Eliminating;hypoendemic | An. darlingi | Cross-sectional | 204(204) | 3 | Plas+LM¶; Plas+PCR¶; PfPR | dSGE IgG [L||] |
| Londono-Renteria et al., 2015a | Colombia | An. albimanus | Cross-sectional | 42(42) | 2 | Plas+PCR¶ | gSG6-P1 IgG [L||] | |
| Londono-Renteria et al., 2020a | Colombia | Eliminating | An. albimanus | Cross-sectional | 337(337) | 2 | Plas+PCR; PfPR | aPEROX-P1, P2 and P3 IgG [L]; aTRANS-P1 and P2 IgG [L] |
| Montiel et al., 2020 | Colombia | Eliminating | An. albimanus | Case–control | 113(113) | 2 | Plas+LM; Plas+PCR¶; PfPR | gSG6-P1 IgG [L ||]; dSGE IgG [L ||]; aSTECLA SGE IgG [L ||]; aCartagena SGE IgG [L ||] |
| Asia | ||||||||
| Kerkhof et al., 2016 | Cambodia | Hypoendemic | An. dirus | Cross-sectional | -(8438) | 113 | Plas+PCR; Pf-IgG; Pv-IgG; PfPR | gSG6-P1 IgG [%; L]; gSG6-P2 IgG [%; L] |
| Charlwood et al., 2017 | Cambodia | Eliminating | An. dirus | Repeated cross-sectional | 454(1180) | 6 | HBR; Plas+PCR; Pf-IgG; PfPR | gSG6 IgG [L] |
| Ya-Umphan et al., 2017 | Myanmar | Eliminating | An. minimus;An. maculatus;An. dirus s.l. | Repeated cross-sectional | 2602(9425) | 28 | HBR; EIR;Plas+PCR;Pf-IgG; PfPR | gSG6-P1 IgG [%; L] |
| Waitayakul et al., 2006 | Thailand | An. dirus | Case–control | 139 (139) | 3 | Plas+LM | dirSGE IgG and IgM [L ||] | |
| Pacific | ||||||||
| Pollard et al., 2019 | Solomon Islands | Eliminating;hypoendemic | An. farauti | Repeated cross-sectional | 686(791) | 9 | HBR; EIR; PfPR | gSG6-P1 IgG [%; L] |
| Idris et al., 2017 | Vanuatu | Eliminating;hypoendemic;mesoendemic | An. farauti | Repeated cross-sectional | 905(905) | 3 | Plas+LM; Pf-IgG; Pv-IgG; PfPR | gSG6 IgG [%; L] |
-
Data are given as study, year of publication, country, malarial endemicity class, malarial DVS, study design (‡ indicates that study was performed solely in children), number of participants and number of samples, number of study-specific salivary antibody outcome observations (study-specific n), entomological and malariometric parameters, and salivary antibody outcomes assessed. Malarial endemicity class (categorical) is derived from P. falciparum prevalence rate in 2–10 year olds (PfPR) extracted from MAP using site geolocations and year of study, and applying established cut-offs reported in Bhatt et al., 2015. If PfPR data were not available (e.g. surveys prior to 2000; or unable to determine study site geolocation and year), endemicity class is given as stated in the study (indicated by *). DVS is as stated in the study or extracted from MAP (indicated by †). Of note, An. gambiae sensu lato (s.l.) includes both An. gambiae sensu stricto and An. arabiensis. Entomological and malariometric parameters include HBR, EIR, prevalence estimates of Plasmodium spp. (Plas+): detected by LM, or PCR, with § indicating prevalence of P. falciparum only and ¶ indicating prevalence of P. vivax only (no footnote indicates P. falciparum and P. vivax co-endemic), as well as PfPR extracted from MAP (The Malaria Atlas, 2017). Salivary antibody outcomes are indicated as either seroprevalence [%] or levels [L], or both [%; L], with || indicating that studies reported results stratified by malarial infection status. Salivary antigens include recombinant full-length proteins, synthetic peptides, and whole SGE. Italicised prefix of salivary antigen indicates species: An. gambiae (g), An. funestus (f), An. darlingi (d), An. albimanus (a), An. dirus (dir).
-
DVS: dominant vector species; MAP: Malaria Atlas Project; HBR: human biting rate; EIR: entomological inoculation rate; LM: light microscopy; PCR: polymerase chain reaction; SGE: salivary gland extracts.
Table 2
Association between gSG6 IgG seroprevalence (%) and malarial endemicity (PfPR2-10).
Table shows the odds ratio (OR), 95% confidence interval (95% CI), p-value, as well as the predicted gSG6 IgG seroprevalence and associated 95%CI† for associations between endemicity class (categorical: derived from P. falciparum parasite rates in 2–10 year olds [PfPR]) and anti-gSG6 IgG seropositivity.
| Malaria endemicity class* | OR | 95% CI | p-Value | Predicted gSG6 IgG seroprevalence (%) | 95% CI |
|---|---|---|---|---|---|
| Eliminating malaria(PfPR <1%) | Ref. | 20.0 | 8.3–31.7 | ||
| Hypoendemic(PfPR 1-10%) | 2.04 | 1.43–2.90 | <0.001 | 33.7 | 18.9–48.5 |
| Mesoendemic(PfPR 10-50%) | 4.19 | 2.80–6.08 | <0.001 | 51.5 | 34.6–67.7 |
| Hyperendemic(PfPR 50-75%) | 3.36 | 1.98–5.71 | <0.001 | 46.5 | 27.4–63.8 |
| Holoendemic(PfPR >75%) | 14.4 | 9.72–21.36 | <0.001 | 78.2 | 66.8–89.7 |
-
*Generalised linear multilevel modelling (mixed effects, logistic) estimating the association between anti-gSG6 IgG seropositivity and endemicity class with random effects for study-specific heterogeneity in gSG6 IgG. Model fitted to n = 297 study-specific observations from 22 studies. Of note, nine studies that measured Plasmodium spp. prevalence and IgG antibodies to gSG6 were excluded from this analysis as eight only reported gSG6 IgG levels and one was a case–control study. Endemicity class membership is derived from PfPR from The Malaria Atlas, 2017 (MAP) using cut-offs taken from Bhatt et al., 2015, or where MAP data were unavailable, endemicity was included as indicated in the study.
-
†Predicted gSG6 IgG seroprevalence (predicted probability in the average study) is estimated from generalised linear multilevel modelling (mixed effects, logistic).
Appendix 1—table 1
Model selection process, showing the log likelihood, Akaike’s information criterion (AIC), and Bayesian information criterion (BIC) fit indices for each model estimating different functional forms for the association between gSG6 IgG seropositivity and respective exposures.
| Model | Log likelihood | AIC | BIC |
|---|---|---|---|
| HBR | |||
| Linear | –1533.3 | 3076.6 | 3091.2 |
| Log | –1492.8 | 2995.7 | 3010.1 |
| Quadratic | –1523.7 | 3059.4 | 3077.0 |
| Cubic | –1523.7 | 3061.3 | 3081.9 |
| EIR | |||
| Linear | –1003.40 | 2016.80 | 2027.27 |
| Log | –530.65 | 1071.30 | 1079.49 |
| Quadratic | –1002.65 | 2017.30 | 2029.87 |
| Cubic | –976.36 | 1966.72 | 1981.38 |
| Plasmodium spp. prevalence | |||
| Linear | –2777.45 | 5564.91 | 5582.03 |
| Log | –2597.24 | 5202.47 | 5215.90 |
| Quadratic | –2775.47 | 5562.95 | 5583.50 |
| Cubic | –2769.91 | 5553.82 | 5577.80 |
-
HBR: human biting rate; EIR: entomological inoculation rate.
Appendix 3—table 1
Reasons for study exclusion.
Appendix 4—table 1
Unadjusted association between gSG6 IgG seropositivity and log human biting rate (HBR).
| Variable | log odds ratio (SE) | 95% CI | p-Value | RE |
|---|---|---|---|---|
| Fixed part | ||||
| log HBR*,† | 0.29 (0.08) | 0.14–0.45 | <0.001 | |
| Random part | ||||
| ‡ | 1.29 | |||
| 1.55 | ||||
| 0.06 | ||||
| § | 0.21 | |||
| ¶ | 0.47 | |||
| ℓ | –1492.8 | |||
| Model fit indices | ||||
| Akaike’s information criterion | 2995.7 | |||
| Bayesian information criterion | 3010.1 |
-
HBR association: log odds ratio and standard error (SE), 95% confidence interval (95% CI), p-value, random-effect components (RE): variances (ψ), conditional intraclass correlation coefficient ICC (ρ),* and model log likelihood (ℓ) from generalised linear multilevel modelling (mixed effects, logistic).† This analysis is based upon n = 132 study-specific observations from 12 studies. Of note, five studies that measured HBR and IgG antibodies to gSG6 were excluded from this analysis as they only reported gSG6 IgG levels.
-
*ρ = , where through are random-effect variance estimates pertaining to each of the respective variance components (see table notes ‡–¶) from the generalised linear multilevel modelling (mixed effects, logistic) for a specific ICC estimate.
-
†Generalised linear multilevel modelling (mixed effects, logistic) estimating the association between log transformed HBR and anti-gSG6 IgG seropositivity with random effects for country-specific and study-specific heterogeneity in gSG6 IgG seroprevalence and study-specific heterogeneity in effect of HBR.
-
‡ , , and represent variances of the random effects for country, study, and effect of HBR, respectively.
-
§ represents conditional ICC for salivary antibody observations from the same country but different study.
-
¶ represents conditional ICC for salivary antibody observations from the same country and study with the median HBR.
Appendix 5—table 1
Association between gSG6 IgG seropositivity and log human biting rate (HBR), moderated by dominant vector species.
| Variable | log odds ratio (SE) | 95% CI | p-Value | RE |
|---|---|---|---|---|
| Fixed part | ||||
| log HBR | 0.46 (0.11) | 0.25–0.66 | <0.001 | |
| DVS | <0.001** | |||
| An. gambiae s.l. only | Ref. | |||
| An. gambiae s.l. and other DVS | 1.00 (0.18) | 0.65–1.25 | <0.001 | |
| Non-An. gambiae s.l. | 1.09 (0.68) | –0.24 to 2.42 | 0.109 | |
| log HBR by DVS | <0.001** | |||
| An. gambiae s.l. only | Ref. | |||
| An. gambiae s.l. and other DVS | –0.26 (0.08) | −0.41 to –0.11 | 0.001 | |
| Non-An. gambiae s.l. | –0.38 (0.11) | −0.59 to –0.17 | <0.001 | |
| Random part | ||||
| ‡ | 0.96 | |||
| 2.32 | ||||
| 0.08 | ||||
| § | 0.14 | |||
| ¶ | 0.51 | |||
| ℓ | –1488.8 | |||
| Model fit indices | ||||
| Akaike’s information criterion | 2995.5 | |||
| Bayesian information criterion | 3021.5 |
-
HBR × dominant vector species (DVS) association: log odds ratio and standard error (SE), 95% confidence interval (95% CI), p-value, random-effect components (RE): variances (ψ), conditional intraclass correlation coefficient (ICC) (ρ),* and model log likelihood (ℓ) from generalised linear multilevel modelling (mixed effects, logistic).† This analysis is based upon n = 132 study-specific observations from 12 studies. Of note, five studies that measured HBR and IgG antibodies to gSG6 were excluded from this analysis as they only reported gSG6 IgG levels.
-
* ρ = , where through are random-effect variance estimates pertaining to each of the respective variance components (see table notes ‡–¶) from the generalised linear multilevel modelling (mixed effects, logistic) for a specific ICC estimate.
-
† Generalised linear multilevel modelling (mixed effects, logistic) estimating the association between log transformed HBR and anti-gSG6 IgG seropositivity including an interaction term between DVS and log HBR with random effects for country-specific and study-specific heterogeneity in gSG6 IgG seroprevalence and study-specific heterogeneity in effect of HBR.
-
‡ , , and represent variances of the random effects for country, study, and effect of HBR, respectively.
-
§ represents the conditional ICC for salivary antibody observations from the same country but different study.
-
¶ represents the conditional ICC for salivary antibody observations from the same country and study with the median HBR.
-
**indicates p-value from joint Wald test for polytomous variables.
Appendix 6—table 1
Unadjusted association between gSG6 IgG seropositivity log entomological inoculation rate (EIR).
| Variable | log odds ratio (SE) | 95% CI | p-Value | RE |
|---|---|---|---|---|
| Fixed part | ||||
| log EIR | 0.15 (0.04) | 0.07–0.23 | <0.001 | |
| Random part | ||||
| ‡ | 1.02 | |||
| 2.15 | ||||
| 0.01 | ||||
| § | 0.16 | |||
| ¶ | 0.49 | |||
| ℓ | –530.7 | |||
| Model fit indices | ||||
| Akaike’s information criterion | 1071.3 | |||
| Bayesian information criterion | 1079.5 |
-
Entomological inoculation rate (EIR) association: log odds ratio and standard error (SE), 95% confidence interval (95% CI), p-value, random-effect components (RE): variances (ψ), conditional intraclass correlation coefficient (ICC) (ρ)* and model log likelihood (ℓ) from generalised linear multilevel modelling (mixed effects, logistic).† This analysis is based upon n = 38 study-specific observations from eight studies.
-
* ρ = , where through are random-effect variance estimates pertaining to each of the respective variance components (see table notes ‡–¶) from the generalised linear multilevel (mixed effects, logistic) modelling for a specific ICC estimate.
-
† Generalised linear multilevel modelling (mixed effects, logistic) estimating the association between log transformed EIR and anti-gSG6 IgG seropositivity with random effects for country-specific and study-specific heterogeneity in gSG6 IgG seroprevalence and study-specific heterogeneity in effect of EIR.
-
‡ , , and represent variances of the random effects for country, study, and effect of EIR, respectively.
-
§ represents the conditional ICC for salivary antibody observations from the same country but different study.
-
¶ represents the conditional ICC for salivary antibody observations from the same country and study with the median EIR
Appendix 7—table 1
Unadjusted association between gSG6 IgG seropositivity and log Plasmodium spp prevalence.
| Variable | log odds ratio (SE) | 95% CI | p-Value | RE |
|---|---|---|---|---|
| Fixed part | ||||
| log Plasmodium spp. prevalence | 0.46 (0.32) | –0.16–1.08 | 0.148 | |
| Random part | ||||
| ‡ | 17.21 | |||
| 1.25 | ||||
| § | 0.85 | |||
| ℓ | –2597.2 | |||
| Model fit indices | ||||
| Akaike’s information criterion | 5202.5 | |||
| Bayesian information criterion | 5215.9 |
-
Any Plasmodium species infections (including prevalence estimates of P. falciparum only, P. vivax only, both P. falciparum and P. vivax and untyped infections): log odds ratio and standard error (SE), 95% confidence interval (95% CI), p-value, random-effect components (RE): variances (ψ), conditional intraclass correlation coefficient (ICC) (ρ),* and model log likelihood (ℓ) from generalised linear multilevel modelling (mixed effects, logistic).† This analysis is based upon n = 212 study-specific observations from 14 studies. Of note, six studies that measured Plasmodium spp. prevalence and IgG antibodies to gSG6 were excluded from this analysis as five only reported gSG6 IgG levels and one was a case–control study.
-
* ρ = , where through are random-effect variance estimates pertaining to each of the respective variance components (see table notes ‡ and §) from the generalised linear multilevel modelling (mixed effects, logistic) for a specific ICC estimate.
-
† Generalised linear multilevel modelling (mixed effects, logistic) estimating the association between the log prevalence of any Plasmodium spp. infection and anti-gSG6 IgG seropositivity with random effects for study-specific heterogeneity in gSG6 IgG seroprevalence and study-specific heterogeneity in effect of Plasmodium spp. prevalence.
-
‡ and represent variances of the random effects for study and effect of Plasmodium spp. prevalence, respectively.
-
§ represents the conditional ICC for salivary antibody observations from the same study and with the median Plasmodium spp. prevalence.
Appendix 8—table 1
Associations between anti-gSG6 IgG seropositivity and log of antimalarial antibody seroprevalence.
-
Effects for each exposure represent separate generalised linear multilevel modelling (mixed effects, logistic) analyses estimating the association between the log of the seroprevalence of antimalarial antibodies and the seroprevalence of anti-gSG6 IgG, with the inclusion of a random intercept for study-specific heterogeneity and a random coefficient to allow the effect of the antimalarial antigen to vary across studies. Table shows log odds ratio and standard error (SE), 95% confidence interval (95% CI), and p-value, number of study-specific salivary antibody observations (Study-specific n) and studies, with associated references. Random effects not shown. Of note, one study that measured antimalarial antibody seroprevalence and IgG antibodies to gSG6 could not be included in analyses as it only reported gSG6 IgG levels.
-
* Studies did not include a random coefficient (i.e. slope); as empirical support was not shown.
Appendix 10—table 1
Association between fSG6 IgG seropositivity and human biting rate (HBR).
| Variable | log odds ratio (SE) | 95% CI | p-Value | RE |
|---|---|---|---|---|
| Fixed part | ||||
| log HBR | 0.17 (0.07) | 0.03–0.31 | 0.017 | |
| Random part | ||||
| ‡ | 0.47 | |||
| § | 0.13 |
-
Association between HBR and fSG6 IgG: log odds ratio and standard error (SE), 95% confidence interval (95% CI), p-value, random-effect components (RE): variances (ψ), conditional intraclass correlation coefficient (ICC) (ψ)* and model log likelihood (ℓ) from generalised linear multilevel modelling (mixed effects, logistic).† This analysis is based upon n = 6 study-specific observations.
-
* ρ = , where through are random-effect variance estimates pertaining to each of the respective variance components (see table notes ‡ and §) from generalised linear multilevel model (mixed-effects, logistic) for a specific ICC estimate.
-
† Generalised linear multilevel modelling (mixed effects, logistic) estimating the association between anti-An. funestus fSG6 IgG seropositivity and log transformed HBR with random effects for study-specific heterogeneity in fSG6 IgG seropositivity.
-
‡ represents variance of the random effect for study.
-
§ represents conditional ICC for salivary antibody observations from the same study.
Appendix 10—table 2
Association between gSG6-P2 IgG seropositivity and log PfCSP IgG seroprevalence.
| Variable | log odds ratio (SE) | 95% CI | p-Value | RE |
|---|---|---|---|---|
| Fixed part | ||||
| log PfCSP IgG seroprevalence | 3.70 (0.12) | 3.45–3.94 | <0.001 | |
| Random part | ||||
| ‡ | 25.2 | |||
| § | 0.88 |
-
Association between log PfCSP seroprevalence and gSG6-P2 IgG: log odds ratio and standard error (SE), 95% confidence interval (95% CI), p-value, random-effect variances (ψ), conditional intraclass correlation coefficient (ICC) (ρ)* and model log likelihood (ℓ) from logistic mixed-effects modelling.† This analysis is based upon n = 115 study-specific observations.
-
* ρ = , where through are random-effect (RE) variance estimates pertaining to each of the respective variance components (see table notes ‡ and §) from generalised linear multilevel model (mixed effects, logistic) for a specific ICC estimate.
-
† Generalised linear multilevel modelling (mixed effects, logistic) estimating the association between log PfCSP seroprevalence and anti-gSG6-P2 IgG seropositivity with random effects for study-specific heterogeneity in gSG6-P2 IgG seropositivity.
-
‡ represents variance of the random effect for study.
-
§ represents conditional ICC for salivary antibody observations from the same study.
Appendix 10—table 3
Association between gSG6-P2 IgG seropositivity and log PfGLURP IgG seroprevalence.
| Variable | log odds ratio (SE) | 95% CI | p-Value | RE |
|---|---|---|---|---|
| Fixed part | ||||
| log PfGLURP IgG seroprevalence | 2.01 (0.09) | 1.85–2.18 | <0.001 | |
| Random part | ||||
| ‡ | 24.3 | |||
| § | 0.88 |
-
Association between log PfGLURP seroprevalence and gSG6-P2 IgG: log odds ratio and standard error (SE), 95% confidence interval (95% CI), p-value, random-effect variances (ψ), conditional intraclass correlation coefficient (ICC) (ρ)* and model log likelihood (ℓ) from logistic mixed-effects modelling.† This analysis is based upon n = 116 study-specific observations.
-
*ρ = , where ψk through ψnk are random-effect (RE) variance estimates pertaining to each of the respective variance components (see table notes ‡ and §) from generalised linear multilevel model (mixed effects, logistic) for a specific ICC estimate.
-
†Generalised linear multilevel modelling (mixed effects, logistic) estimating the association between log PfGLURP seroprevalence and anti-gSG6-P2 IgG seropositivity with random effects for study-specific heterogeneity in gSG6-P2 IgG seropositivity.
-
‡ψ1 represents variance of the random effect for study.
-
§ρ1 represents conditional ICC for salivary antibody observations from the same study.
Additional files
Download links
A two-part list of links to download the article, or parts of the article, in various formats.
Downloads (link to download the article as PDF)
Open citations (links to open the citations from this article in various online reference manager services)
Cite this article (links to download the citations from this article in formats compatible with various reference manager tools)
Anopheles salivary antigens as serological biomarkers of vector exposure and malaria transmission: A systematic review with multilevel modelling
eLife 10:e73080.
https://doi.org/10.7554/eLife.73080


