Eye movements reveal spatiotemporal dynamics of visually-informed planning in navigation
- Center for Neural Science, New York University, United States
- Center for Theoretical Neuroscience, Columbia University, United States
- Department of Psychology, New York University, United States
- Department of Mechanical and Aerospace Engineering, New York University, United States
Figures
Figure 1 with 3 supplements
Participants exhibit near-optimal navigation performance across multiple environments.
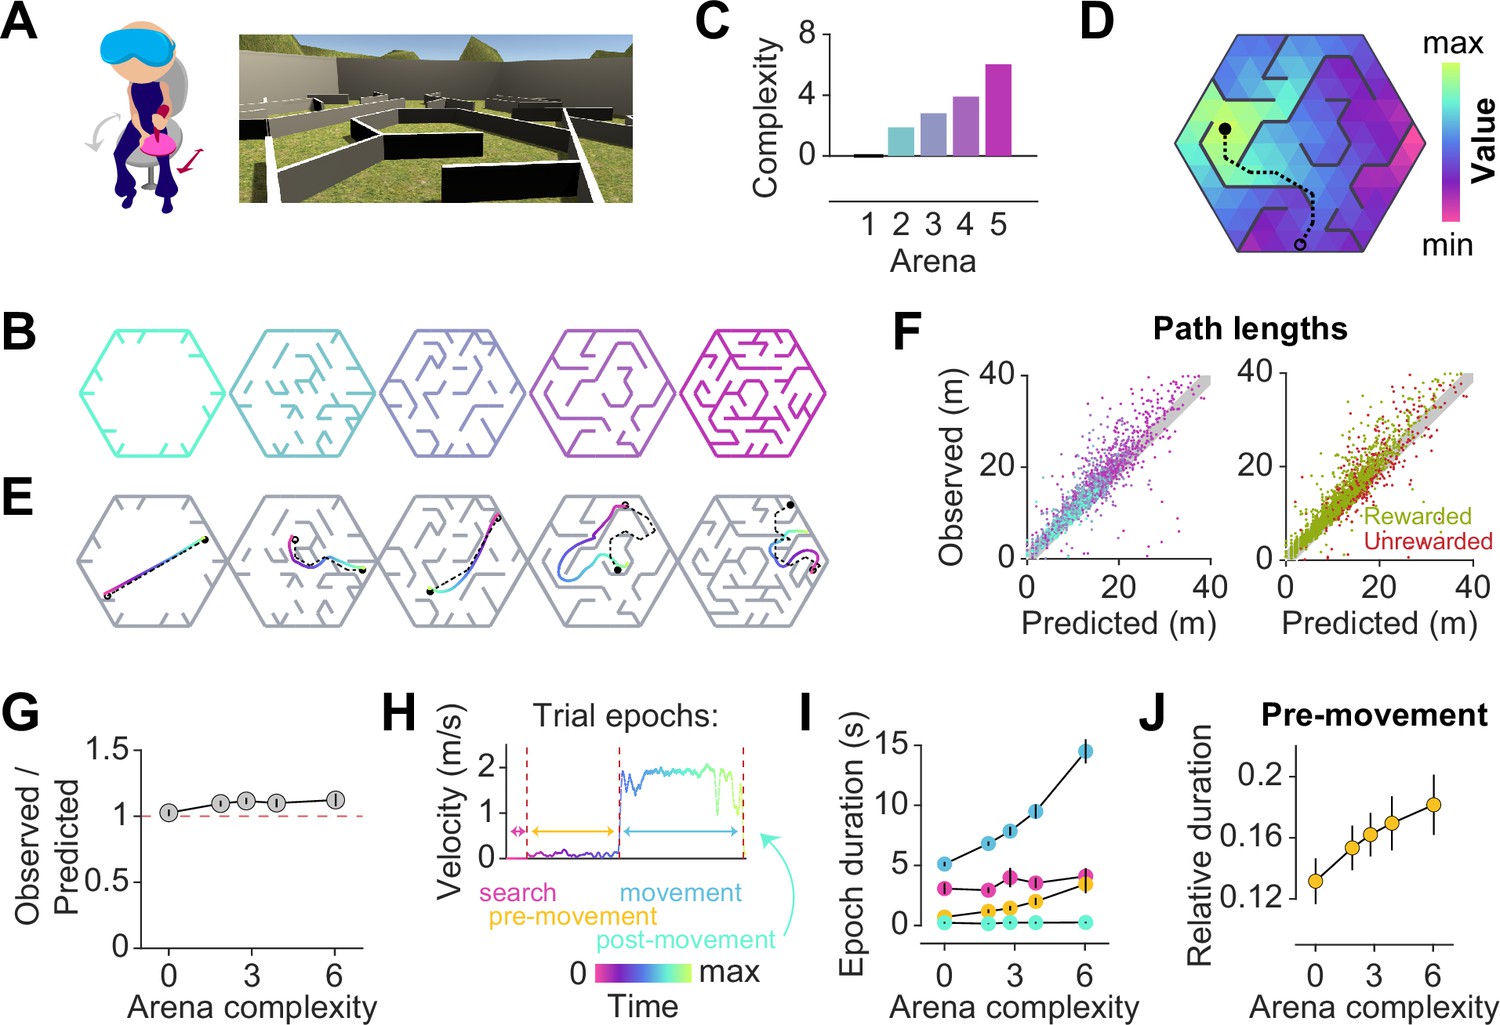
(A) Left: Human participants wore a VR headset and executed turns by rotating in a swivel chair, while translating forwards or backwards using an analog joystick. Right: A screenshot of the first-person view of the display. The headset conferred an immersive field of view of 110°. (B) Aerial view showing the layout of the arenas. (C) Arenas ranged in complexity, which is related to negative mean state closeness centrality. (D) Heatmap showing the value function corresponding to an arbitrary goal state (closed circle) in one of the arenas. The value of each state is related to the geodesic distance between that state and the goal. Dashed line denotes the optimal trajectory from an example starting state (open circle). (E) Trajectories from an example trial in each arena, executed by one participant. The optimal trajectory is superimposed in black (dashed line). Time is color-coded. (F) Comparison of the empirical path length against the path length predicted by the optimal policy. The gray shaded region denotes the width of the outer reward zone (see Figure 1—figure supplement 1A). Left: Data points are colored in accordance to the colors of each arena as depicted in B. Right: Unrewarded trials (red) vs rewarded trials (green) had similar path lengths. For both plots, all trials for all participants and all arenas are superimposed. (G) Across participants, the average ratio of observed vs optimal (predicted) trajectory lengths is consistently around 1 in all arenas. (H) The search epoch was defined as the period between goal stimulus appearance and goal stimulus foveation. A threshold applied on the filtered joystick input (movement velocity) was used to delineate the pre-movement and movement epochs. (I) The average duration of the pre-movement (orange) and movement epochs (blue; colored according to the scheme in H) increased with arena complexity, in conjunction with the trial-level effects exerted by path lengths (Figure 1—figure supplement 3A). (J) The relative planning time, calculated as the ratio of pre-movement to total trial time after goal foveation, was higher for more complex arenas. For G, I, and J, error bars denote ±1 SEM.
Figure 1—figure supplement 1
Experimental details and behavioral performance.
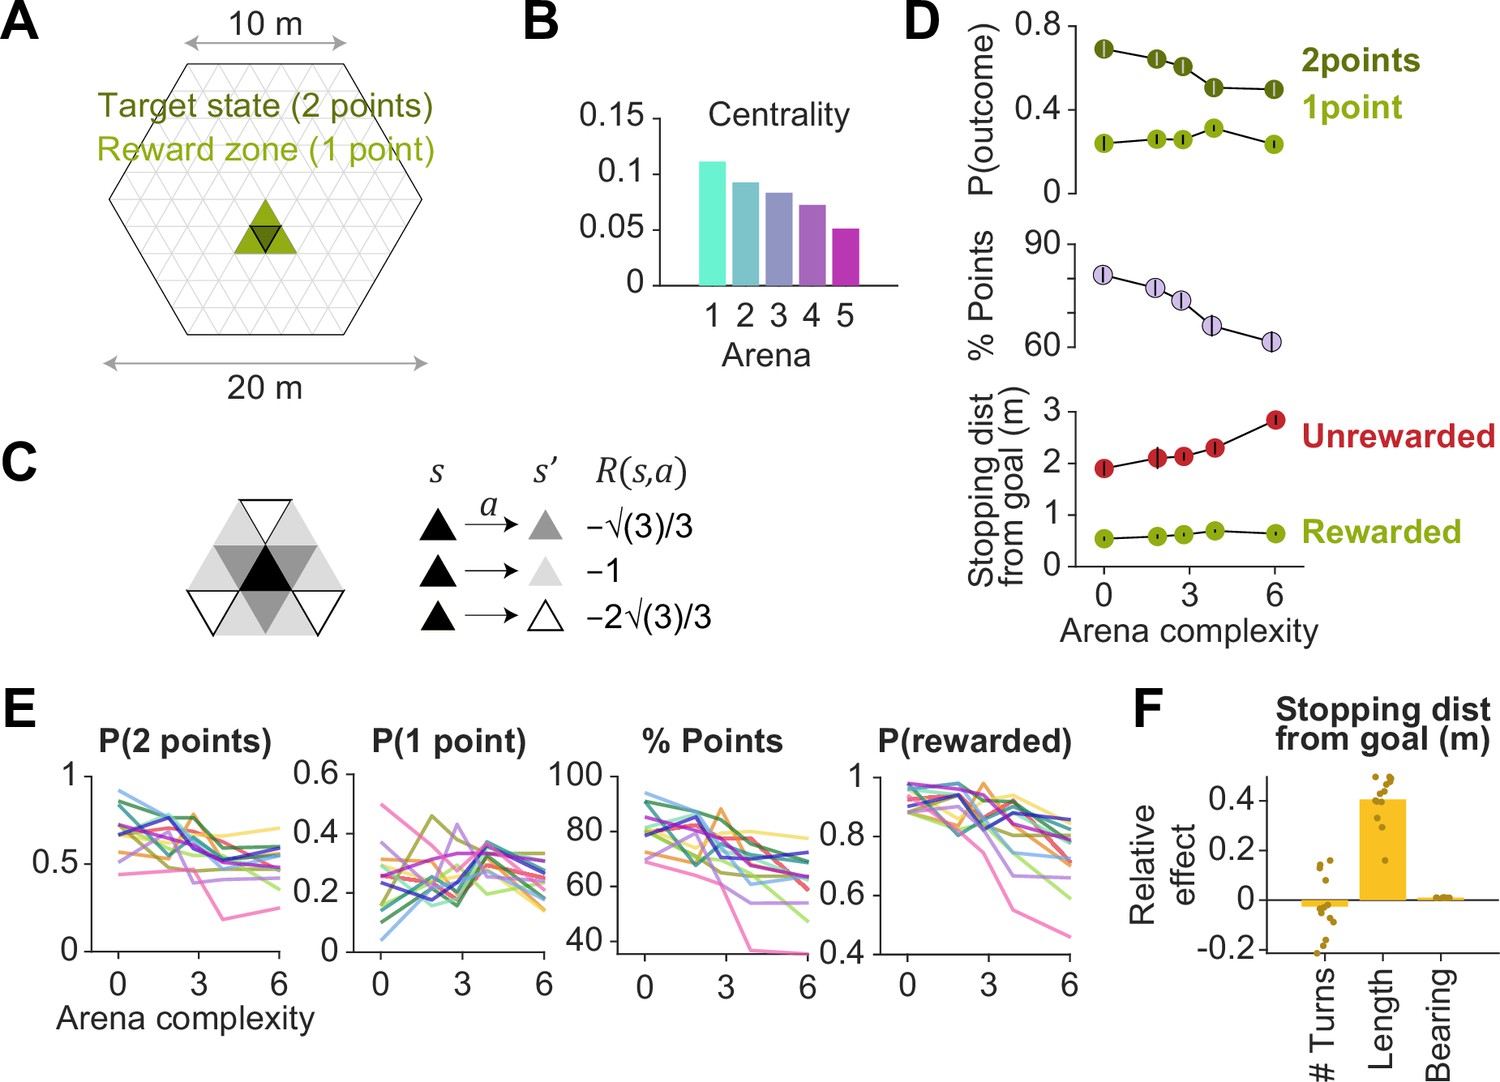
(A) Arenas were regular hexagons of side length 10 m with a triangular tessellation of side length 2 m. Two points were rewarded if participants reached the goal state (green), and one point was rewarded if participants reached a state neighboring the goal state (light green). (B) Mean state closeness centrality of each arena, where higher centrality values correspond to a less complex arena. Error bars denote ±1 SD across states. (C) To incorporate twelve degrees of freedom in translation, value functions were computed using dynamic programming, whereby the cost of actions scaled in accordance with the center-to-center distance between states and (pertaining to the transition which results from taking action ). (D) Top: Across all participants and all trials, the probability of being awarded two points (green) decreased with arena complexity, while the probability of being awarded one point (light green) was relatively constant across all arenas. Middle: The total fraction of points earned decreased with arena complexity. Bottom: Distance between the stopping location and the goal in rewarded (green) and unrewarded (red) trials. Error bars denote ±1 SEM. (E) Each color corresponds to a single participant. Variables plotted against arena complexity are, from left to right: the probability that participants scored two points or one point, the percentage of total points scored, and the probability of being rewarded. (F) Linear mixed model with random intercepts and slopes for the effect of trial-specific variables (number of turns, length of optimal trajectory, relative bearing, and the number of trajectory options) on the distance between the participant’s stopping position and the goal (error). The path length best predicts stopping errors. The overlaid scatter shows fixed effect slope + participant − specific random effect slope, and all variables were z-scored prior to model fitting.
Figure 1—figure supplement 2
Effect of arena complexity on behavioral performance.
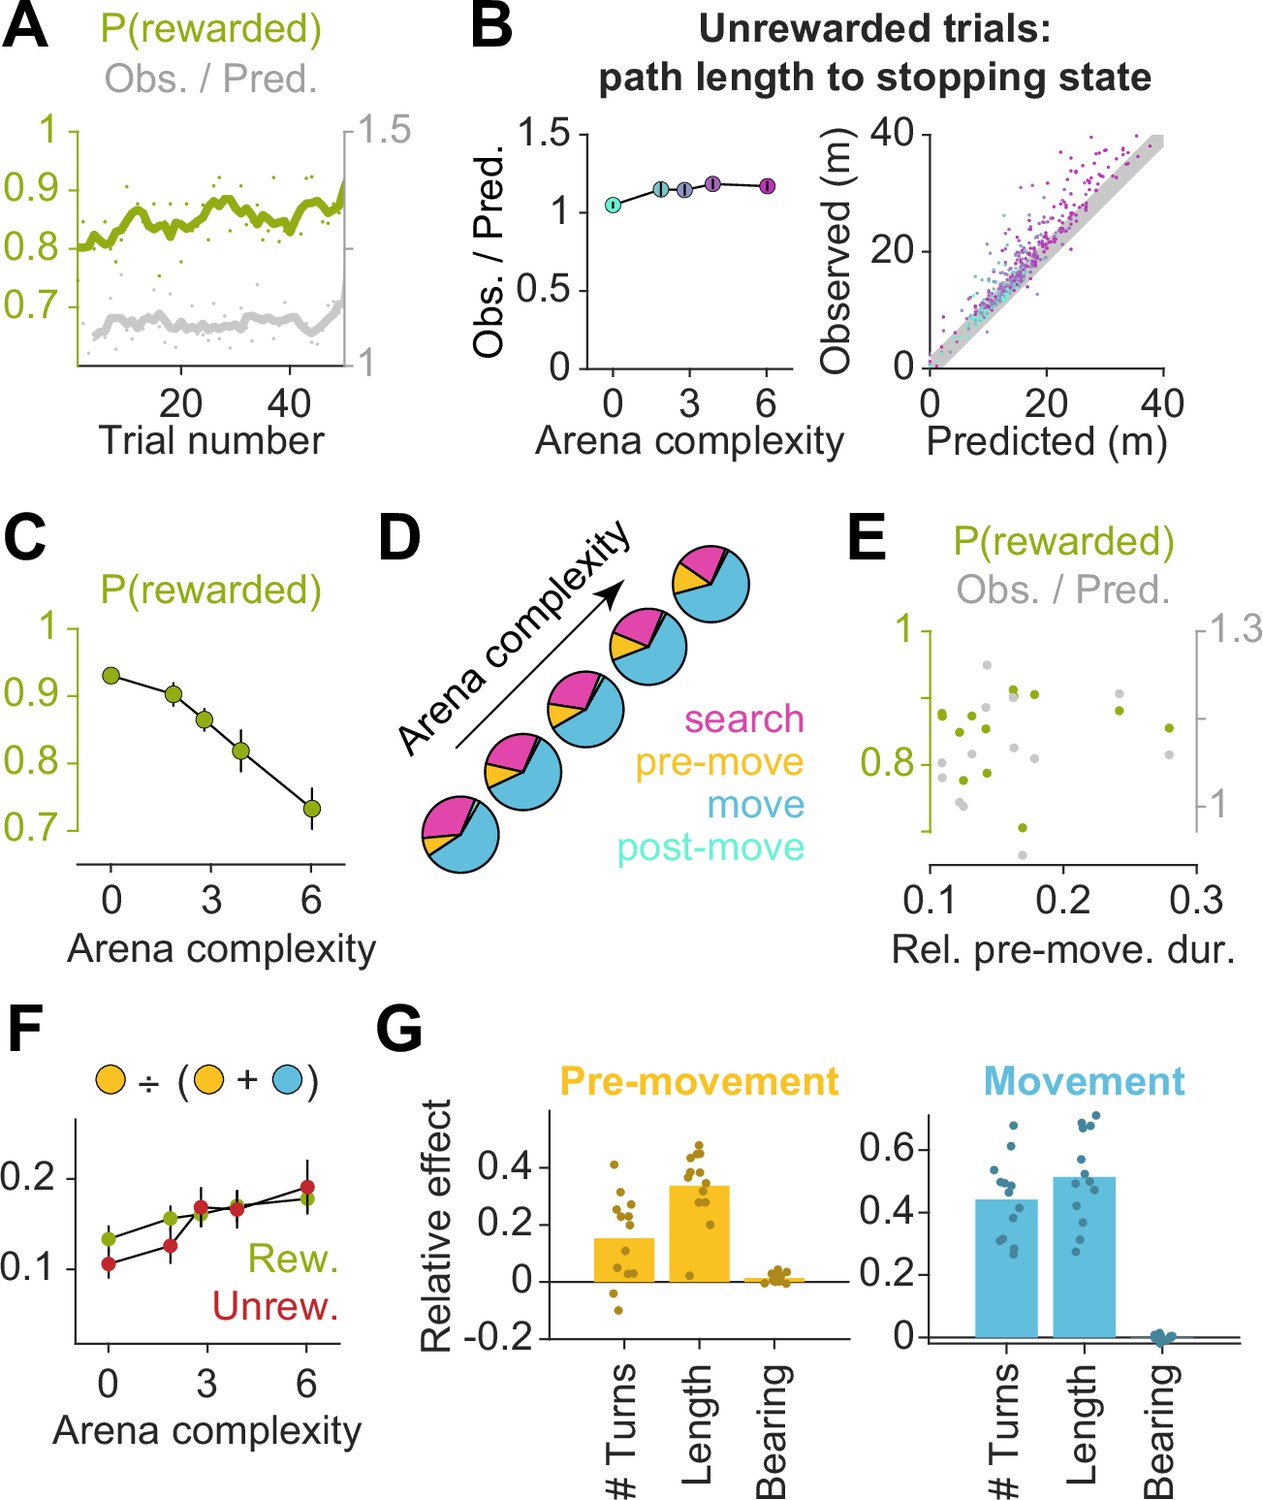
(A) Performance was stable across each block, as measured by the average probability of being rewarded on each trial (green), as well as the average ratio between the empirical and optimal path lengths (gray). (B) Left: Across all arenas (colored according to the coloring scheme introduced in Figure 1B), the path lengths observed in unrewarded trials were close to the optimal trajectory lengths between the starting state and the state at which participants stopped on these trials, suggesting that unrewarded trials were predominantly caused by participants forgetting the precise location of the target. Right: The ratio of observed to optimal path lengths (to the participants’ stopping location on unrewarded trials) was close to unity in all arenas. (C) Arena complexity predicts the fraction of rewarded trials in each arena. (D) Distribution of epoch durations across all participants and all trials. Pre-movement and movement occupied a greater fraction of the total trial time for less open arenas. (E) Some participants spent less time deliberating before movement, but this did not impact task performance. Relative pre-movement duration was defined as the average ratio of the duration of the pre-movement epoch to the duration of the entire trial after goal detection. The average proportion of time that participants spent making prospective eye movements prior to using the joystick did not correlate with their average path lengths across all arenas (gray), nor with the overall probability of them being rewarded (green). (F) The relative pre-movement duration did not differ between rewarded (green) and unrewarded trials (red), except for the two easiest arenas (where planning demands are low). This suggests that unrewarded trials are not merely caused by poor planning. (G) Linear mixed models with random intercepts and slopes for the effect of trial-specific variables on epoch durations – left: pre-movement; right: movement; and relative pre-movement duration, top right. (Please see the description for Figure 1—figure supplement 1F for further details.) The number of turns and the length of the optimal trajectory had the greatest effect on epoch durations. All error bars denote ±1 SEM.
Figure 1—figure supplement 3
Effect of path length and arena complexity on epoch durations and gaze.
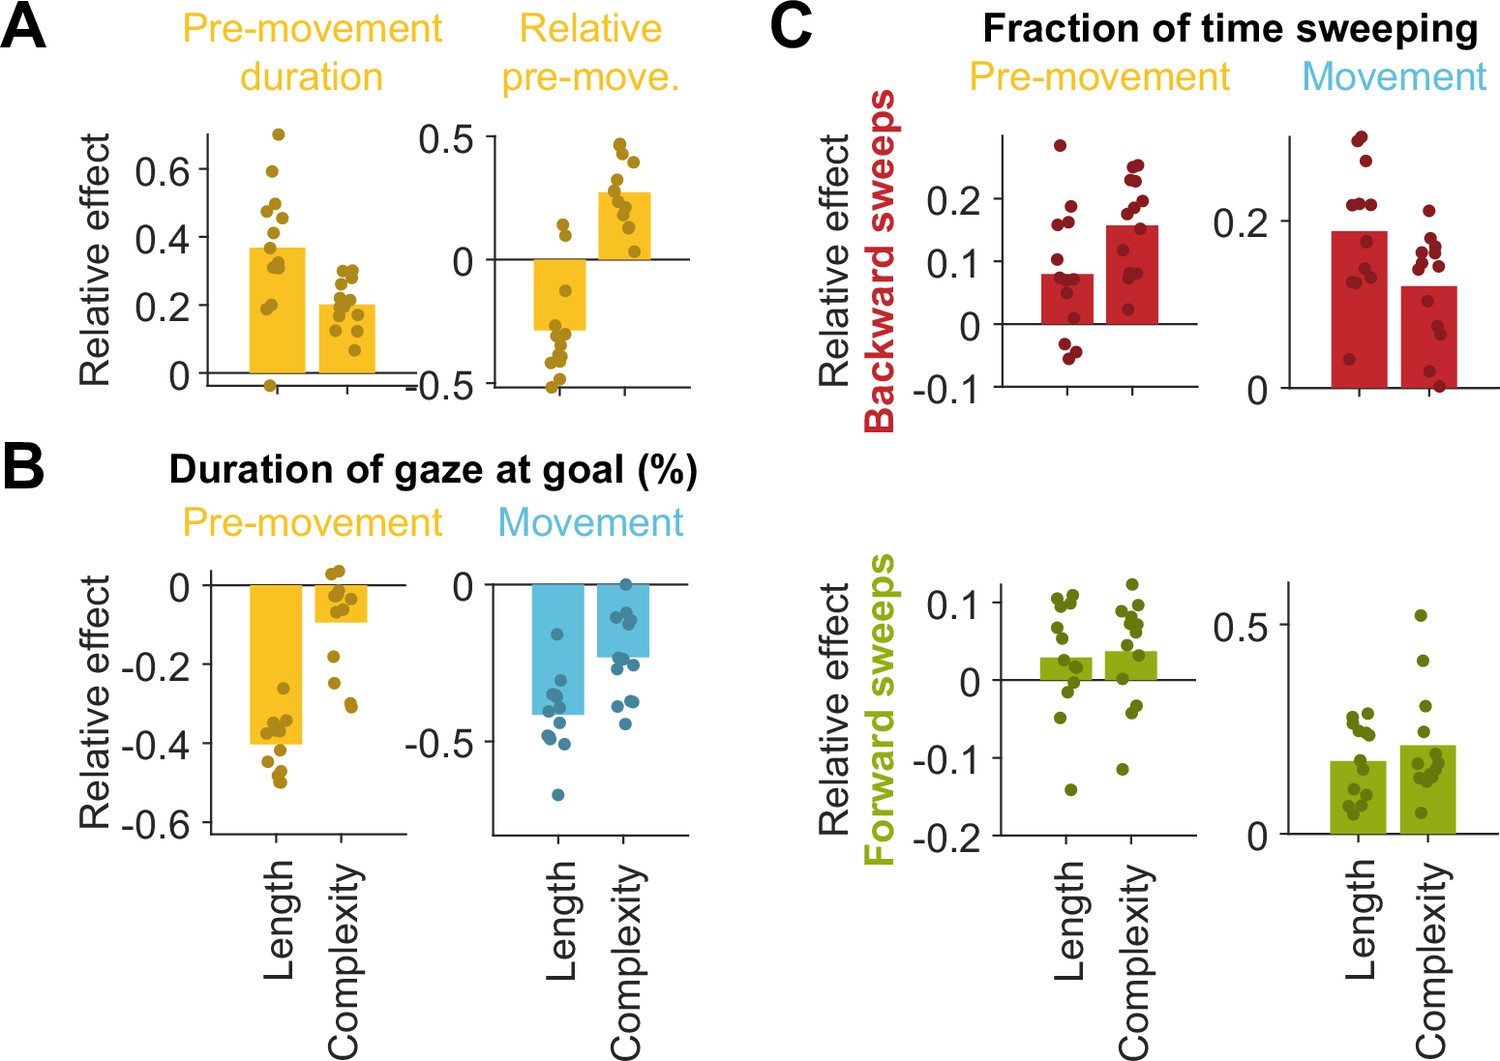
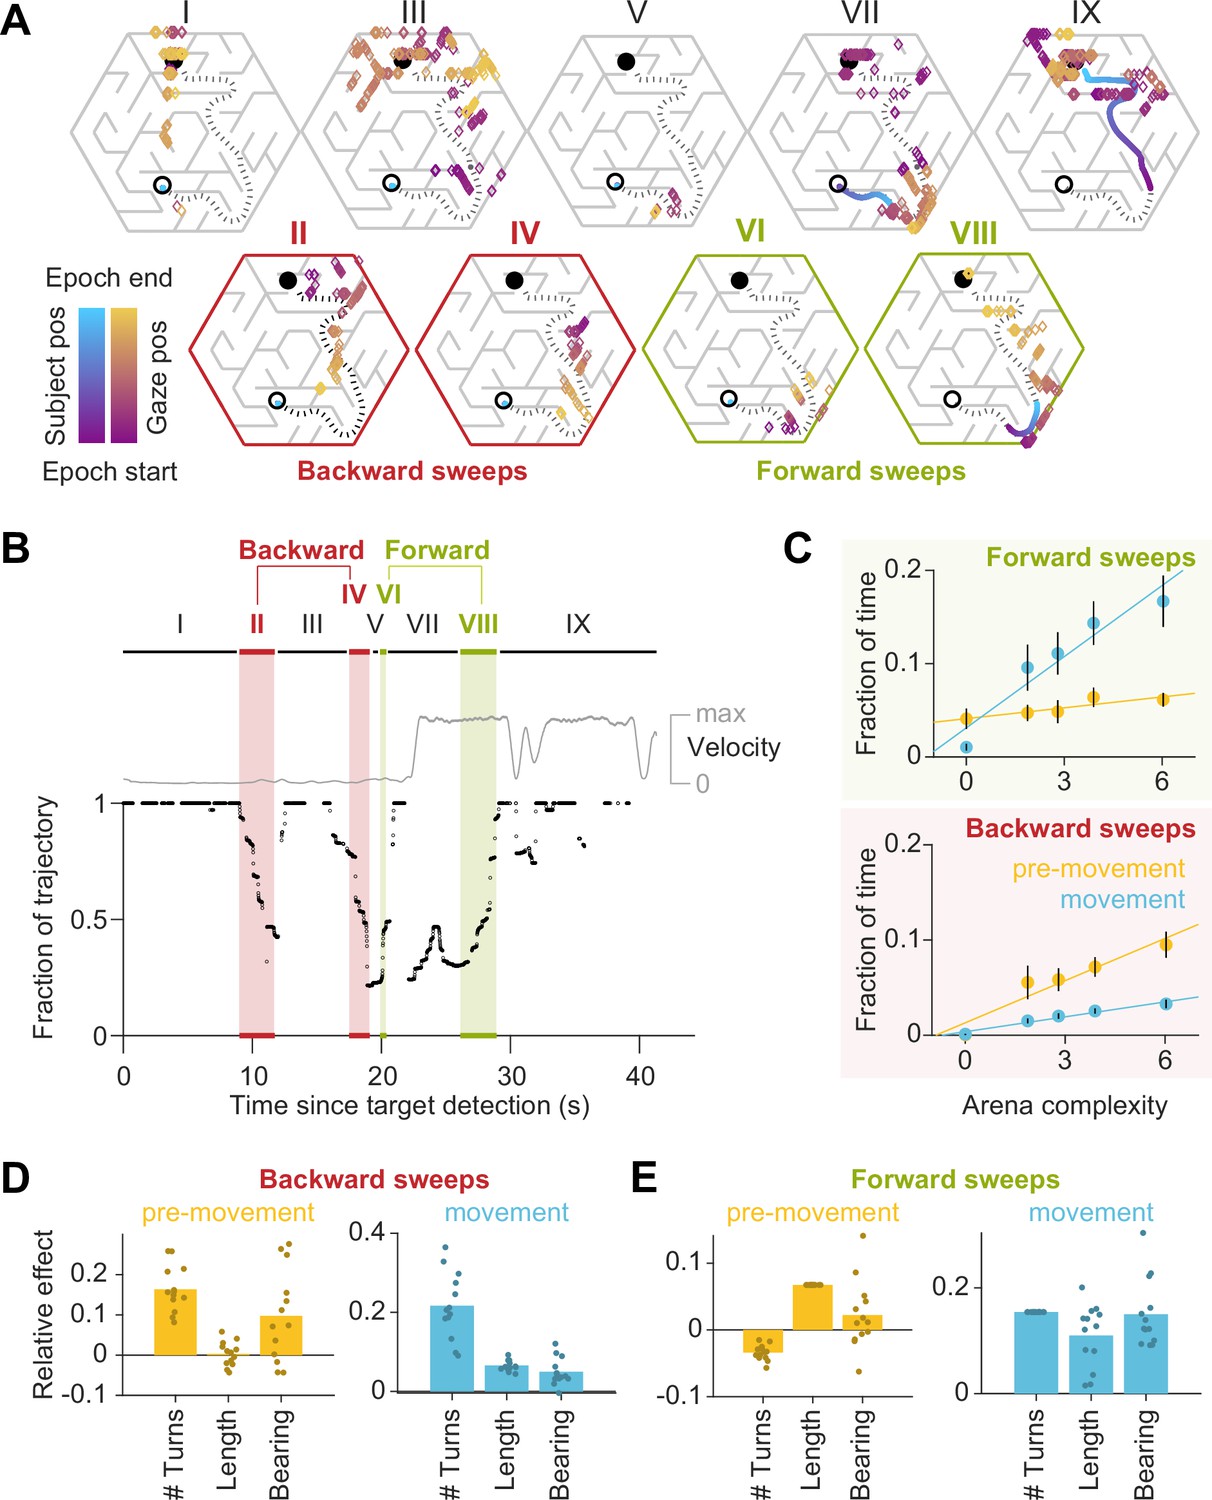
(A) Slopes obtained by linear regression of the pre-movement epoch duration (left) or relative pre-movement epoch duration (right) against path length and arena complexity, averaged across participants. Overlaid scatter depicts participant-specific slopes. Both arena-level and trial-level variables influence these dependent variables, and notably exert opposing effects in the case of relative pre-movement duration. (B) Left: The negative trend in the duration of gaze at the goal vs. arena complexity during pre-movement observed in Figure 2D can be mostly explained by the longer trajectories in more complex arenas. Right: However, the stronger negative trend during movement can be predicted by both arena complexity and path lengths. (C) The fraction of time sweeping in the backwards direction pre-movement can be more strongly explained by arena-level effects than trial path lengths (top left). Both arena complexity and path lengths influence the overall fraction of time sweeping during movement (right) and the fraction of time sweeping forward pre-movement (bottom left).
Figure 2 with 2 supplements
Eye movements are modulated by goal location and environment complexity.
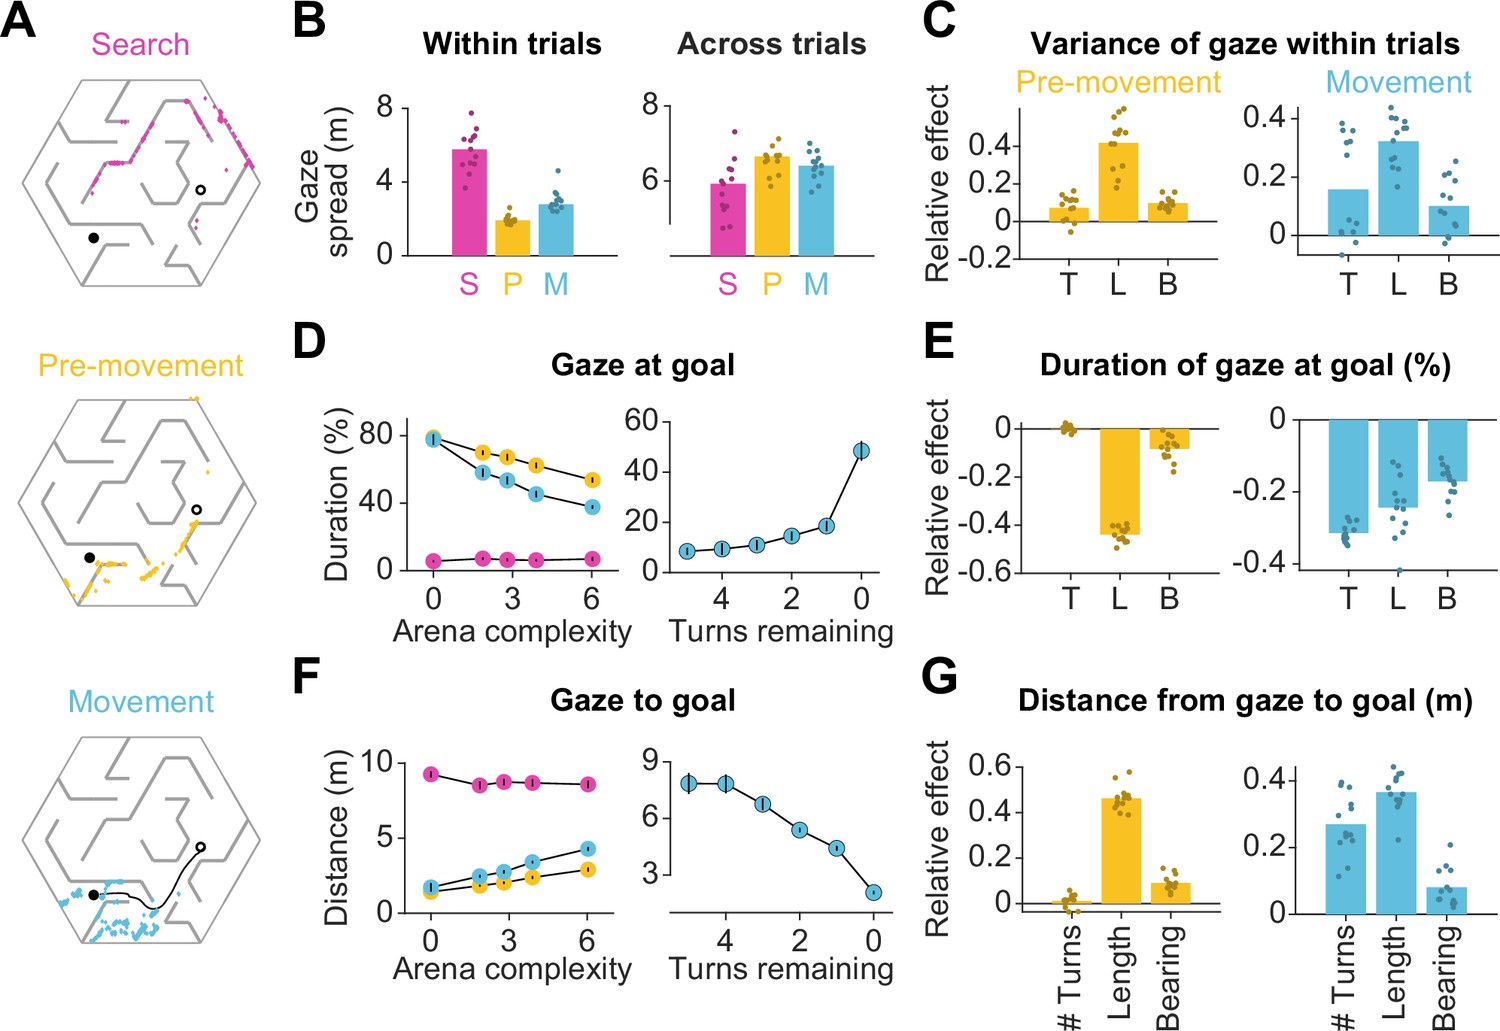
(A) Eye positions on a representative trial for one participant during the three main trial epochs. Each datapoint corresponds to one frame. An open black circle denotes the start location, while a closed black circle denotes the goal. The color scheme applies to all plots in this figure. (B) Left: The median spatial spread of gaze within trial epochs (averaged across trials and arenas) was higher during search than during pre-movement and movement. Right: In contrast, the median spread of the average gaze positions across trials was higher during the pre-movement and movement epochs. Individual participant data are overlaid on top of the bars. (C) Left: A linear mixed model for the effect of trial-specific variables (number of turns, length of optimal trajectory, relative bearing) on the variance of gaze within the pre-movement epoch reveals that the expected path length has the greatest effect on gaze spread. The overlaid scatter shows fixed effect slope + participant - specific random effect slope. Right: Similar result for gaze spread within the movement epoch. (D) Left: Across participants, the average fraction of time for which gaze was near (within 2 m of) the center of the goal state decreased with arena complexity. The arena-level variable (complexity) and the trial-level equivalent (path length) both independently exert effects on the amount of time subjects looked at the goal (Figure 1—figure supplement 3B). Right: Participants spent more time looking near the goal location when fewer turns separated them from the goal. (E) Left: A linear mixed model reveals that expected path length had the greatest negative effect on the fraction of time that participants spent gazing at the goal location prior to movement. Right: During movement, all measures of trial difficulty decreased goal-fixation behavior, especially the number of turns. (F) Left: The average distance between the gaze position and the goal state increased with arena complexity during pre-movement and movement. Right: The average distance of the point of gaze from the goal location decreases as the participant approaches the target. (G) Left: Expected path length best predicted the average distance of gaze to the goal prior to movement. Right: During movement, the number of turns and the expected path length most positively affected this statistic. All error bars denote ±1 SEM, and all variables were z-scored prior to model fitting.
Figure 2—figure supplement 1
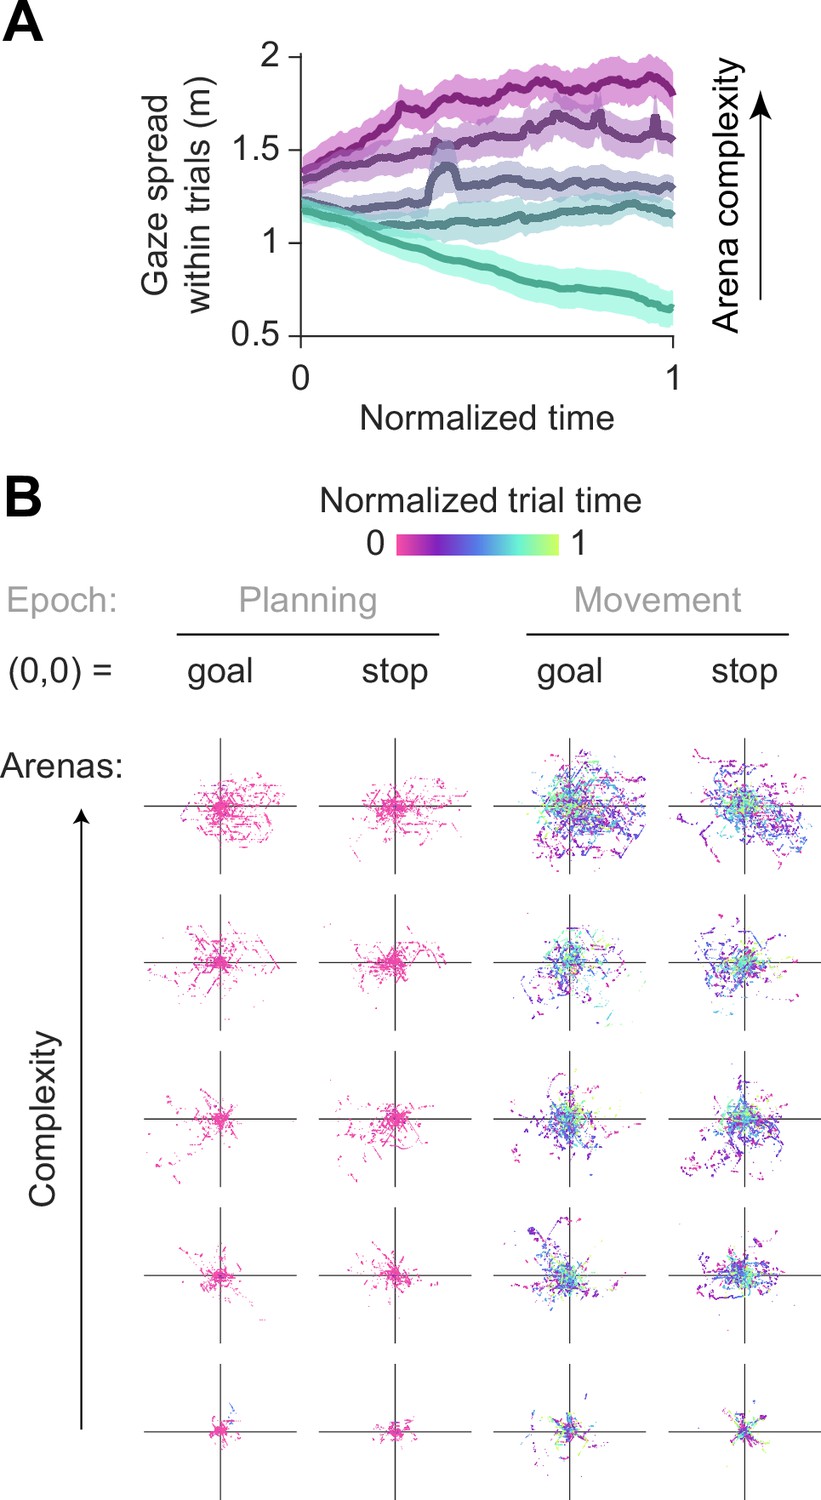
Gaze variance.
(A) The variance of gaze within trials across reaches a peak in the second half of the pre-movement period. Because the pre-movement duration scales with arena complexity, variance was computed using a sliding window of length between 0.32 s (least complex arena) to 0.68 s (most complex arena), linearly spaced between the extremes for arenas of intermediate complexity. Endpoints that fell outside the window were discarded. Results were qualitatively similar when using a fixed window size for all arenas. (B) Gaze is increasingly concentrated around the goal/stopping location for easier arenas. The believed goal location was assumed to be the participants’ stopping position, and the point of gaze was visibly more concentrated around the stop location than around the true goal location (especially in the most complex arena). The effects of working memory on gaze were more apparent for easier, more open arenas. Each panel depicts eye movements on a random subset of trials (3 trials × 13 participants) in each arena. The origin (0,0) denotes the goal location or the stopping location. Raw gaze positions relative to these points are depicted during the pre-movement and movement epochs. Axis limits are ±15 m for all panels.
Figure 2—figure supplement 2
Gaze locations.
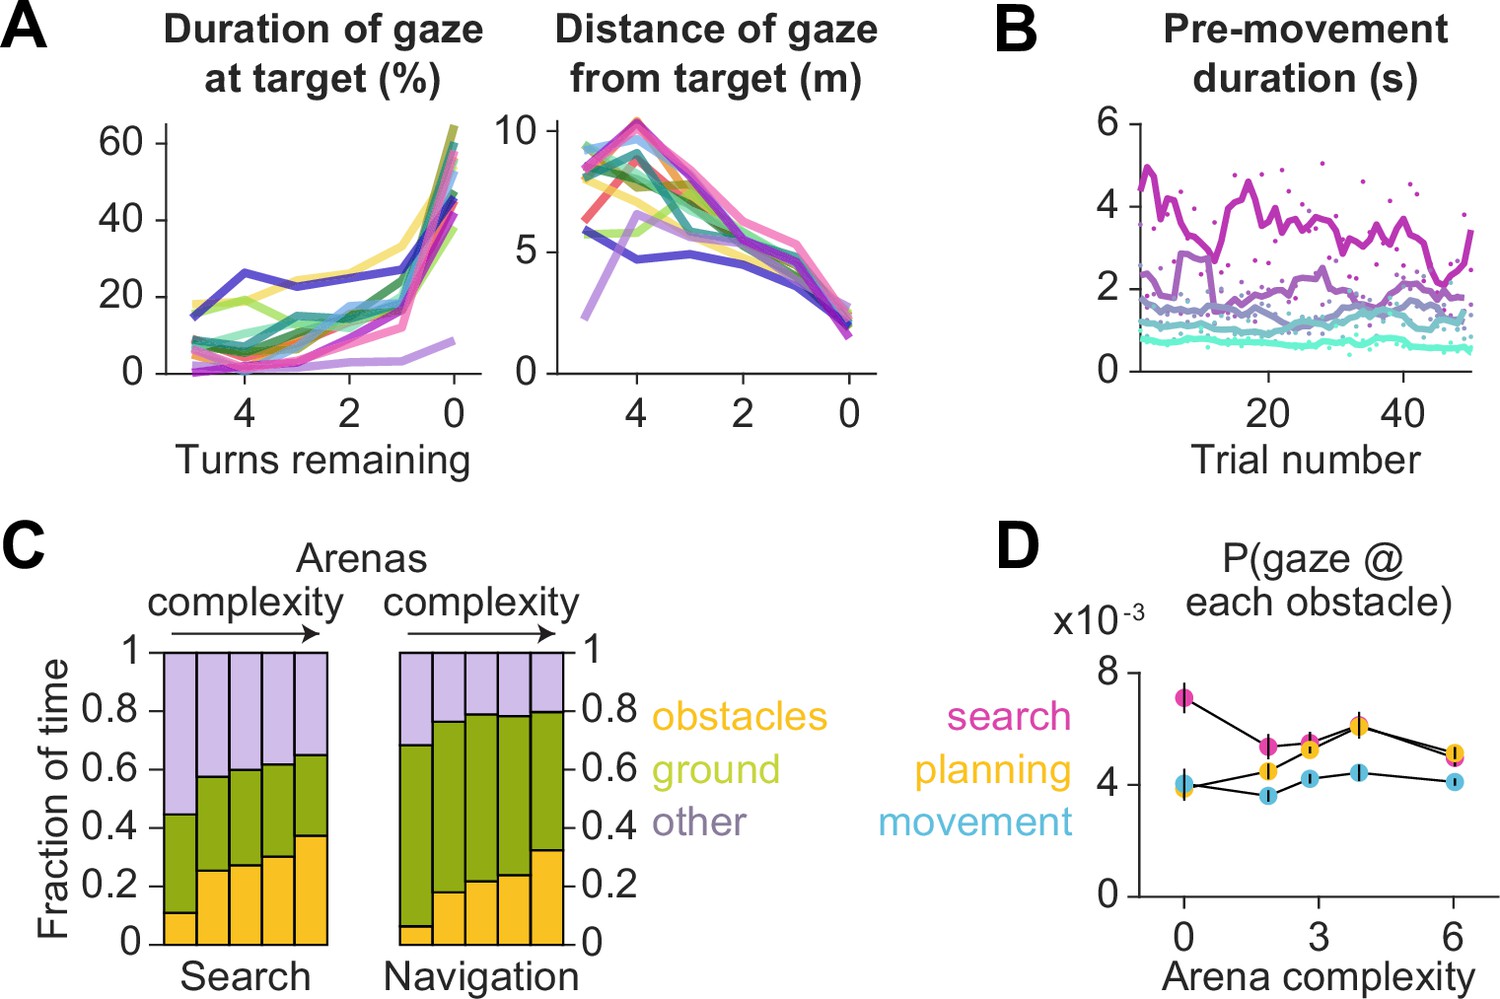
(A) Each color corresponds to a single participant. Variables plotted against arena complexity are — left: percent of time participants spent gazing at the target location, right: average distance of gaze to the target location. (B) The pre-movement duration in each arena (colored according to the color scheme used for Figure 1B and Figure 1—figure supplement 1B) does not significantly change across trials. (C) During search, participants spent a greater fraction of time foveating the arena borders (purple), and after the target was located, participants spent more time foveating the ground (green). While there appears to be a trend in the fraction of time foveating obstacles (orange) vs arena complexity, this is explained by a higher obstacle density in the more complex arenas. (D) Across all participants and all trials, the probability of gazing upon each obstacle remains relatively constant across all arenas during each epoch. All error bars denote ±1 SEM across participants.
Figure 3 with 1 supplement
Eye movements reveal a cognitive trade-off between reward and transition encoding.
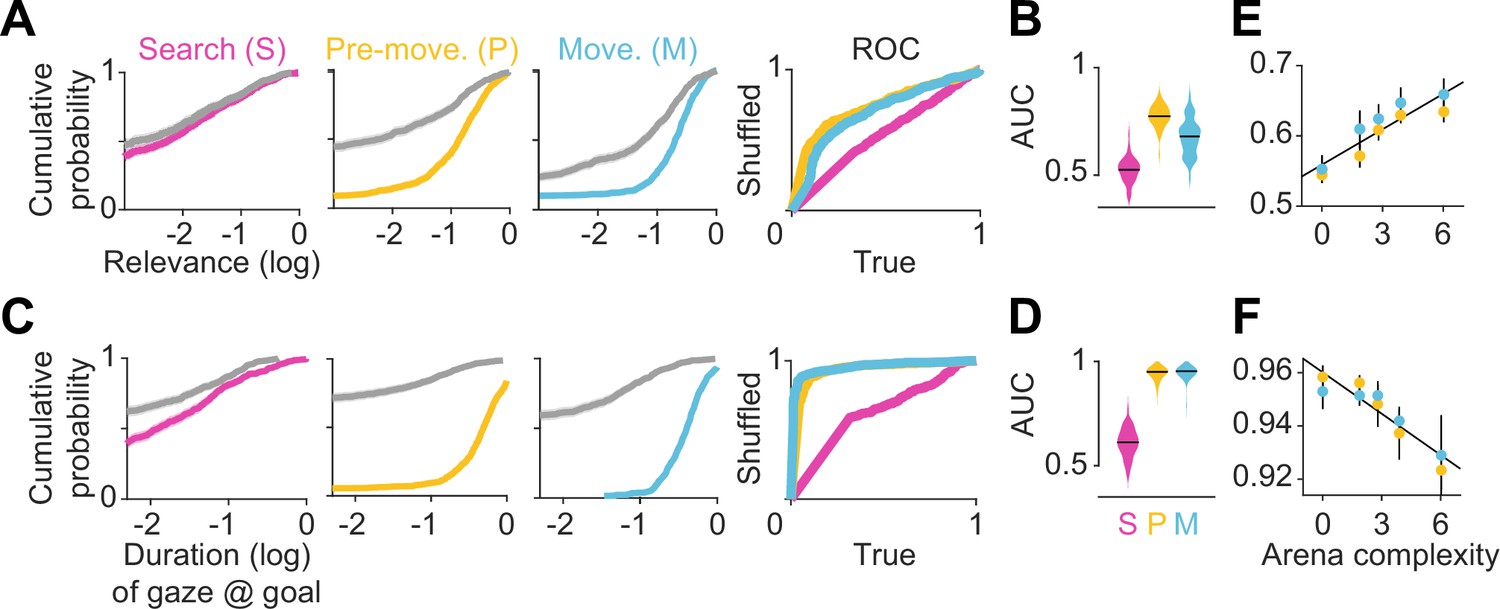
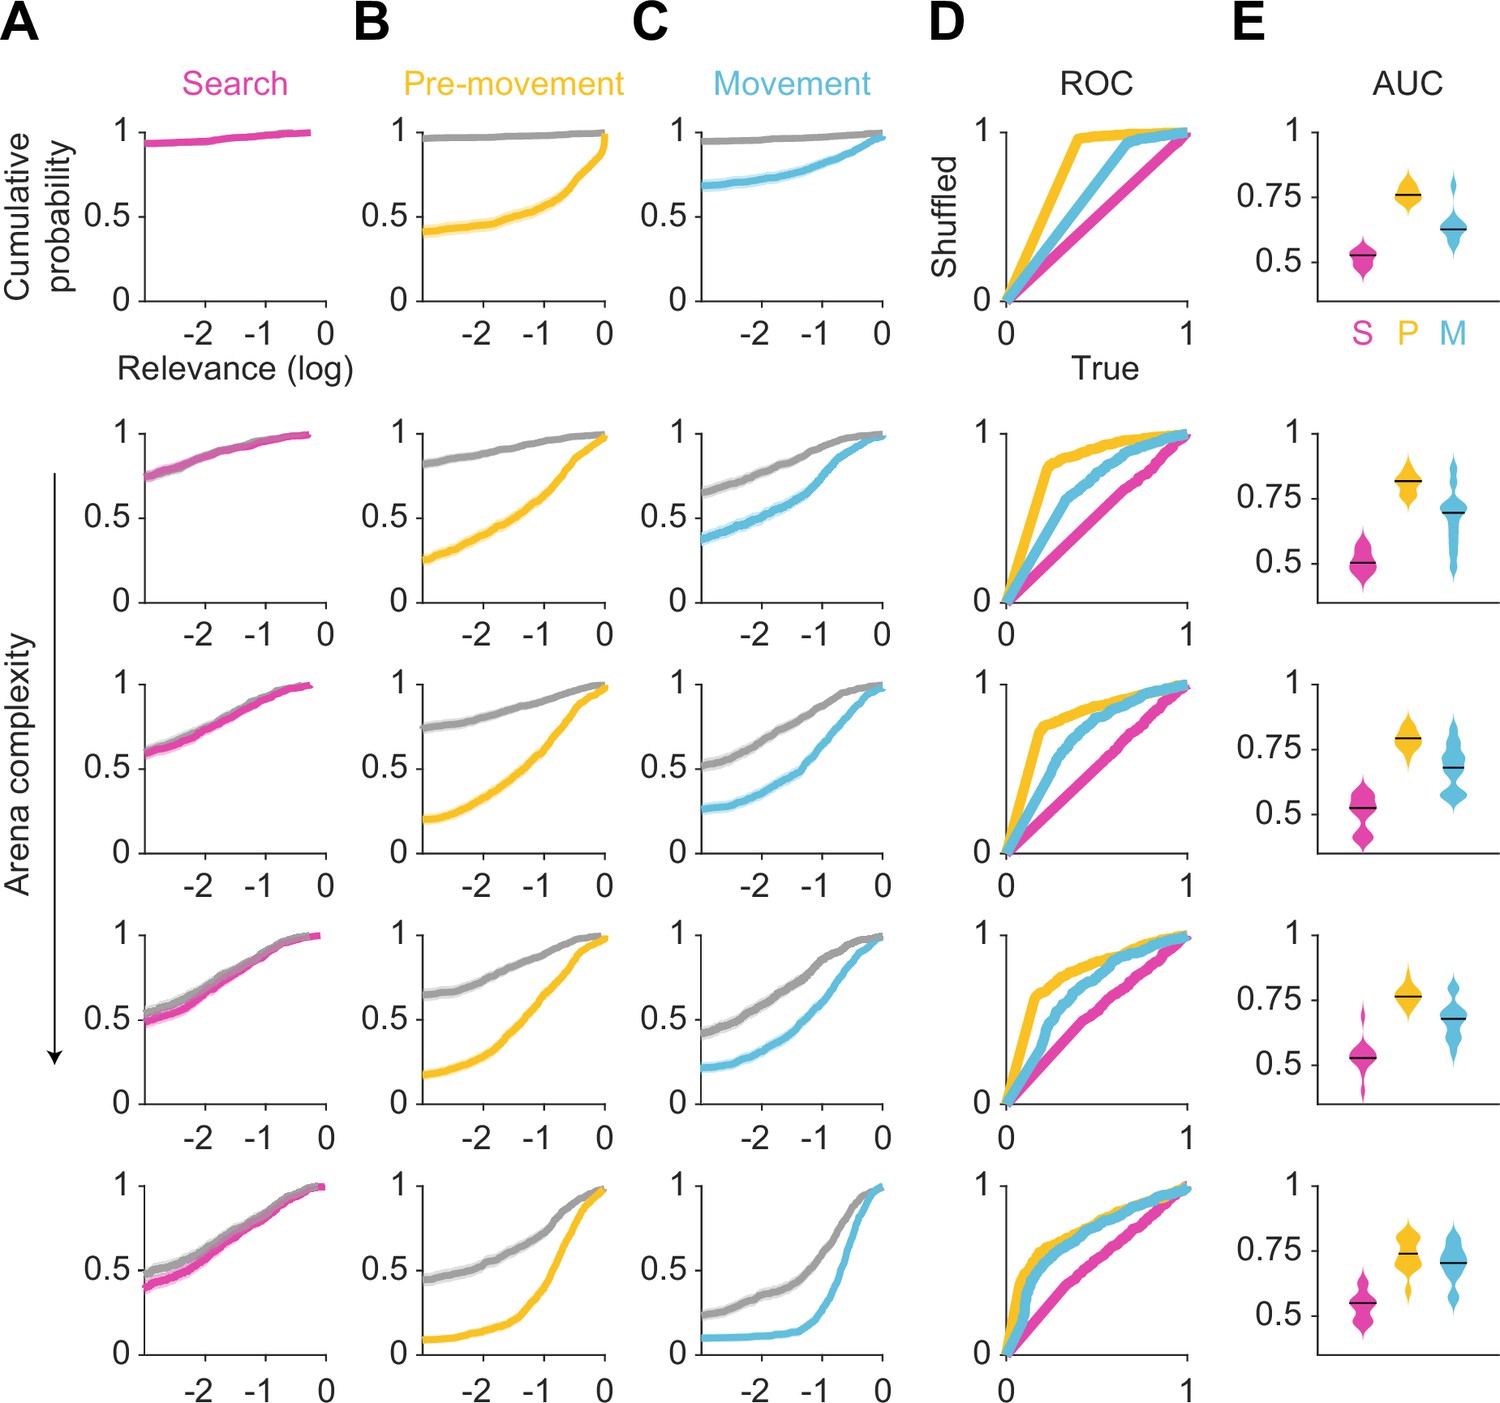
(A) Left: Cumulative distribution (computed by pooling trials from all participants) of average log (normalized) relevance values (colored line) and the corresponding shuffled distribution (gray) during search (left), pre-movement (center), and movement (right) epochs (data for the most complex arena is shown). Shaded regions denote 95% confidence bounds computed using Greenwood’s formula. Rightmost: ROC curves characterizing the gaze relevance during the three epochs. (B) Area under the ROC curves (AUC) for different epochs, colored according to the color scheme in A. (C-D) Similar plots as A-B, but for the distributions of the log fraction of the duration in each epoch spent gazing near (within 2 m of) the eventual stopping position (which was assumed to be the participants’ believed goal location). (E) AUC values of gaze relevance computed for the distributions of trial-averaged relevances, after excluding fixations within the reward zone, during the pre-movement (orange) and movement (blue) epochs. Black line represents best-fit linear regression model. (F) Similar to E, but showing the AUC values of gaze durations within the reward zone. All error bars were computed using bootstrapping.
Figure 3—figure supplement 1
Gaze relevance across epochs and arenas.
(A–E) Breakdown of Figure 3A, B and E for arenas 1 (most complex) through 5 (least complex).
Figure 4 with 3 supplements
Gaze traveled forwards and backwards along the intended trajectory.
(A) Spatial locations of gaze positions (the arrow of relative time within each window increases from violet to orange) and participant positions (violet to blue) during individual time windows demarcated in panel B. Panels in the bottom row correspond to time periods corresponding to sweeps. The participant’s trajectory from the starting location (open black circle) to the goal (closed black circle) is denoted by a black dashed line. (B) Time-series of the points on the trajectory that were closest to the participant’s gaze on each frame, expressed as a fraction (0: start of trajectory, 1: end of trajectory) during one example trial. Only frames during which the gaze position fell within 2 m of the trajectory are plotted. The gray trace shows the movement velocity of the participant during this trial. Red and green shaded regions highlight time windows during which the sweep classification algorithm detected backward and forward sweeps, respectively. In this trial, there were two backward sweeps before movement, and one forward sweep each before and during movement. (C) Across all participants, the fraction of time spent sweeping in the forward and backward directions within each epoch reveals an antiparallel effect: more time was spent sweeping forwards during movement than during pre-movement (top), whereas more time was spent sweeping backwards during pre-movement than during movement (bottom). Generally, the arena complexity as well as the trial-specific path lengths, both increase the fraction of time sweeping (Figure 1—figure supplement 3C). Error bars denote ±1 SEM. (D) Linear mixed models with random intercepts and slopes for the effect of trial-specific variables (number of turns, length of optimal trajectory, relative bearing) on the fraction of time that participants spent sweeping their trajectory in the backward direction, separated for pre-movement and movement epochs. The overlaid scatter shows fixed effect slope + participant − specific random effect slope. (E) Similar analysis as D, but for forward sweeps. All variables were z-scored prior to model fitting.
Figure 4—figure supplement 1
Effect of arena complexity and alternative trajectories on gaze.
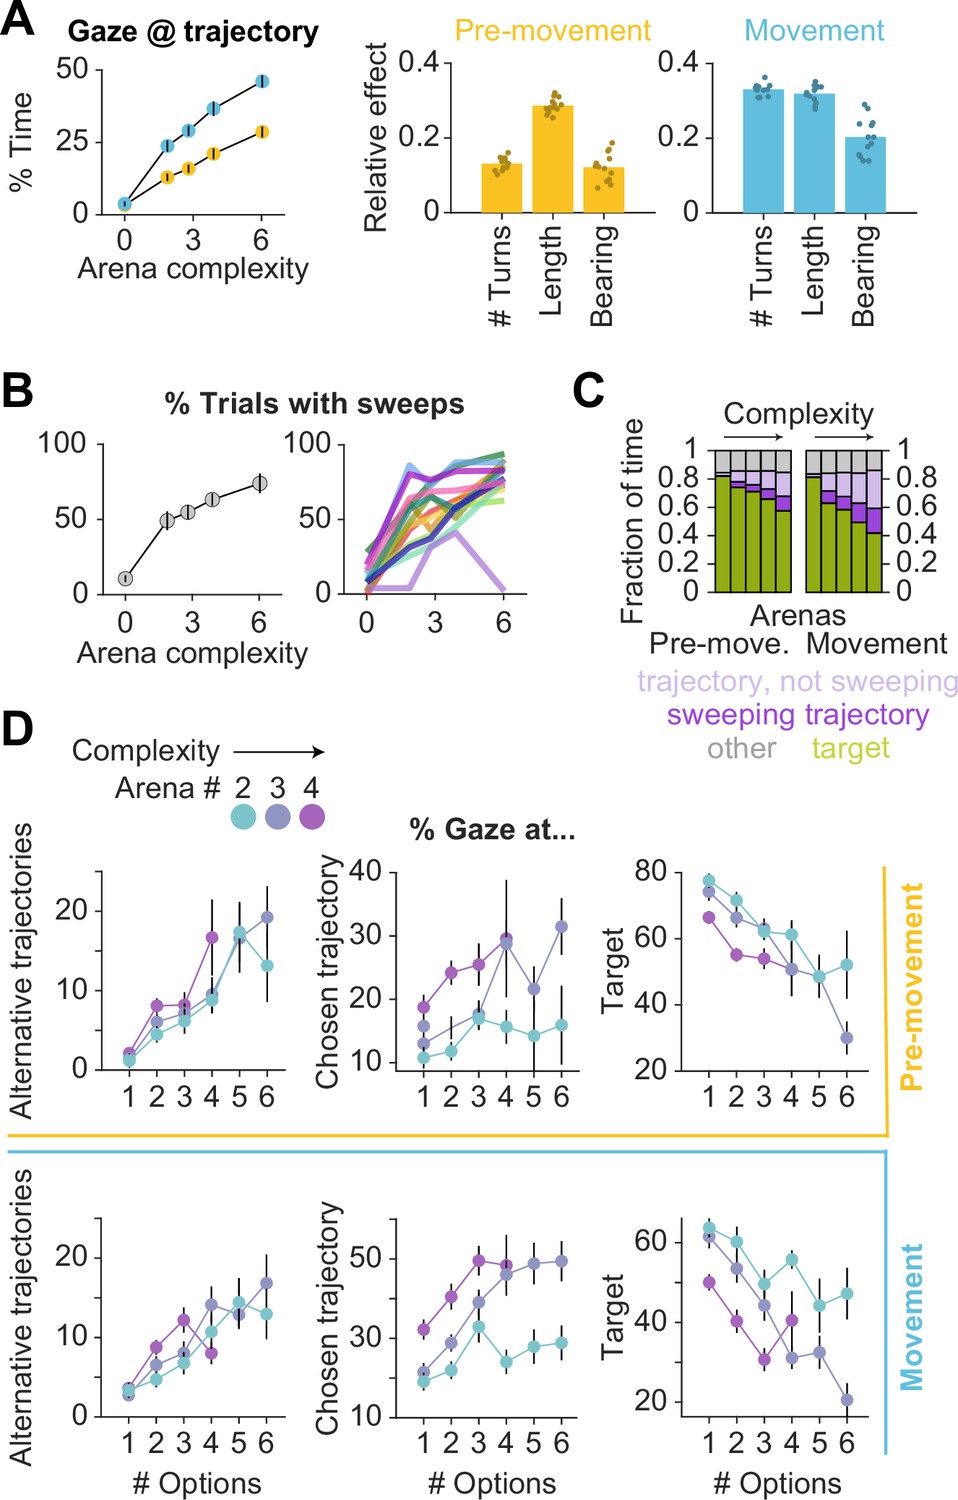
(A) Line plot: The fraction of time that participants spent gazing near (within 2 m from) the trajectory that they took on each trial (excluding points of gaze near the goal location) increased with arena complexity during both pre-movement (gold) and movement (blue). Bar graphs: Linear mixed models with random intercepts and slopes for the effect of trial-specific variables on the fraction of time participants gazed upon the trajectory. (Please see the description for Figure 1—figure supplement 1F for further details.) The tendency to make on-trajectory eye movements increased with trial difficulty, and the expected trajectory length had the greatest effect on this statistic prior to movement. (B) Left: The fraction of trials with sweeps was lower for less complex arenas. Right: Each color corresponds to a single participant. (C) Eye movements on each trial were decomposed into fixations near the target (green), fixations near the participant’s trajectory (excluding the target) during sweeps vs outside of sweeps, and fixations outside of sweeps that were neither made to the target nor trajectory. Participants viewed the hidden target location more in easier arenas, and gazed upon the rest of the trajectory more in difficult arenas. The fraction of time that was spent looking elsewhere was relatively constant across arenas and epochs. (D) During pre-movement (top row) and movement (bottom row), participants spent more time foveating alternative trajectories on trials where there were more trajectory options (left), as well as more time foveating the chosen trajectory (middle). Participants spent less time foveating the goal location when there were more trajectory options (right). All error bars denote ±1 SEM.
Figure 4—figure supplement 2
Properties of sweeping eye movements.
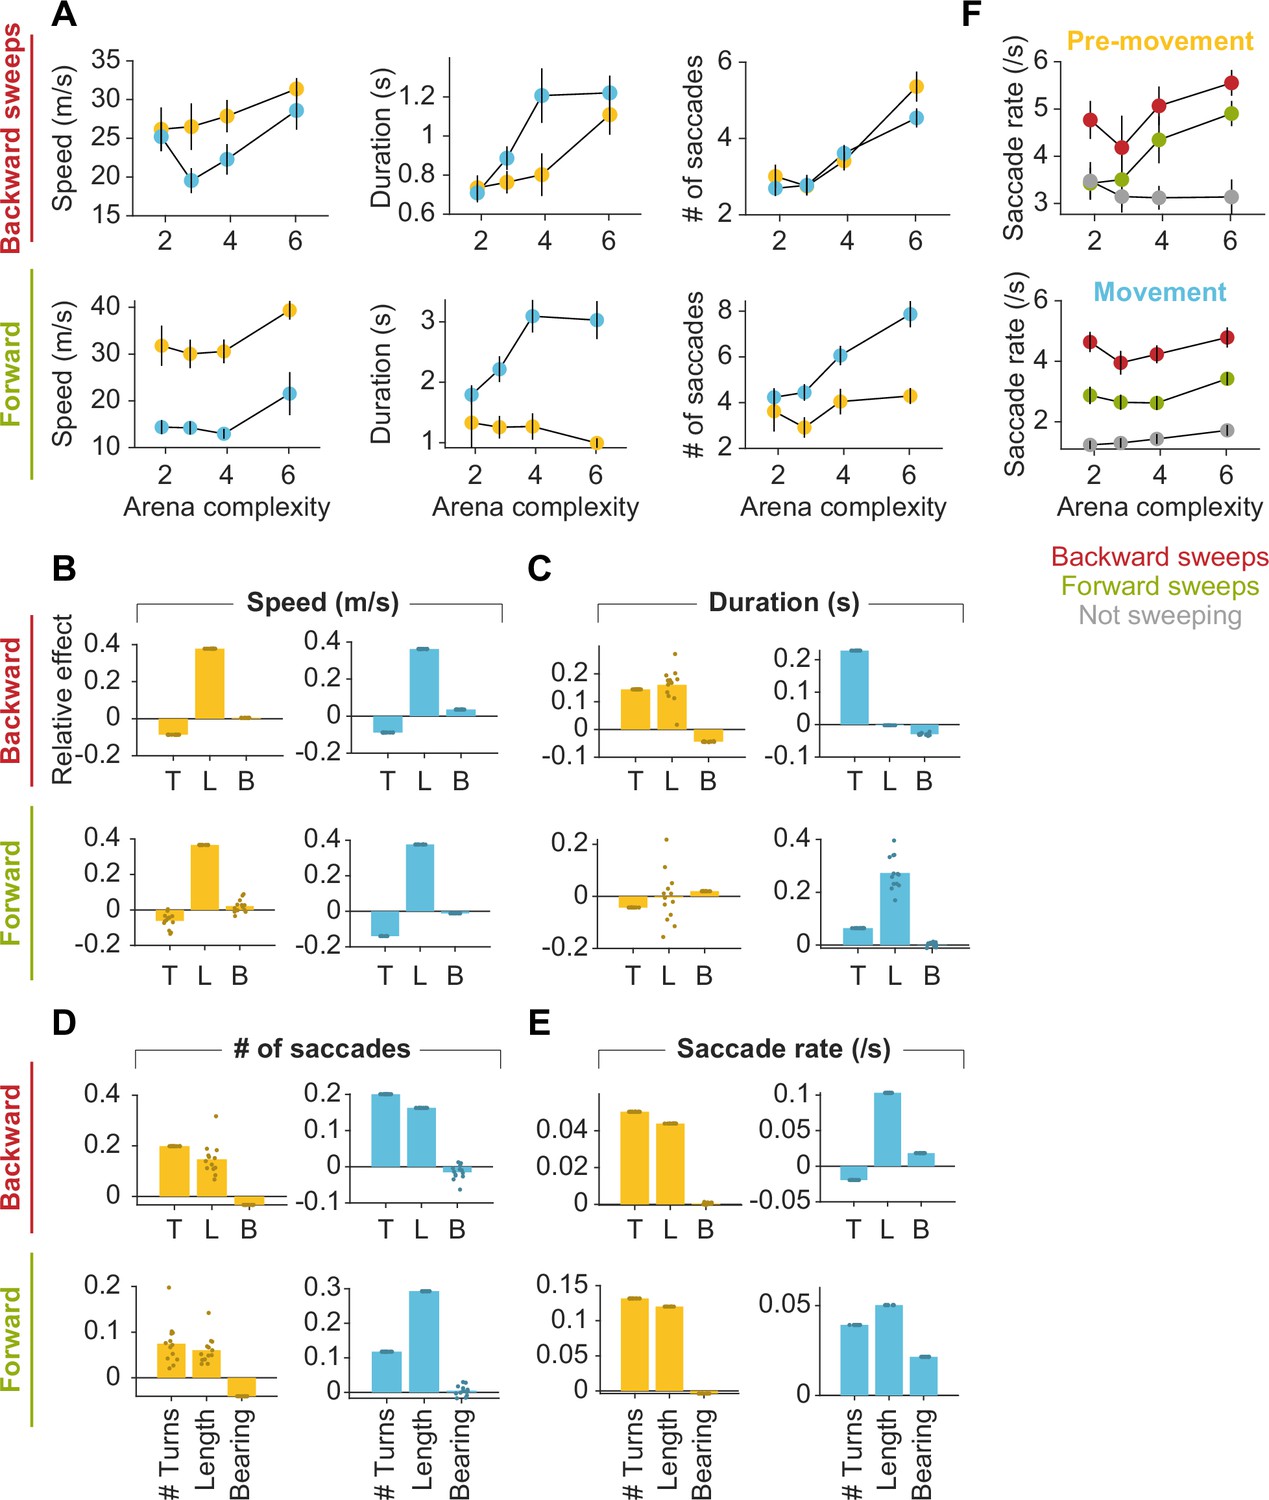
(A) Left: Across all participants and all trials, the speed of backward sweeps (top plot) and forward sweeps (bottom plot) during pre-movement (gold) was greater than that during movement (blue). Center: Forward sweeps before movement were relatively constant in duration across different arenas (bottom plot). Otherwise, sweeps were generally longer in duration in more complex arenas, and forward sweeps were longer than backward sweeps (top plot). Right: The number of saccades during forward sweeps before movement were relatively constant across arenas. Otherwise, the average number of saccades per sweep was higher for more complex arenas. (B–E) Linear mixed models with random intercepts and slopes for the effect of trial-specific variables on the dependent variables: (B) speed of sweeps (m/s), (C) duration of sweeps (s),(D) number of saccades during each sweep, and (E) saccade rate during sweeps. (Please see the description for Figure 1—figure supplement 1F for further details.) All variables were z-scored prior to model fitting. (F) During both pre-movement (top plot) and movement (bottom), the saccade rate was generally higher during sweeps than outside of sweeps.
Figure 4—figure supplement 3
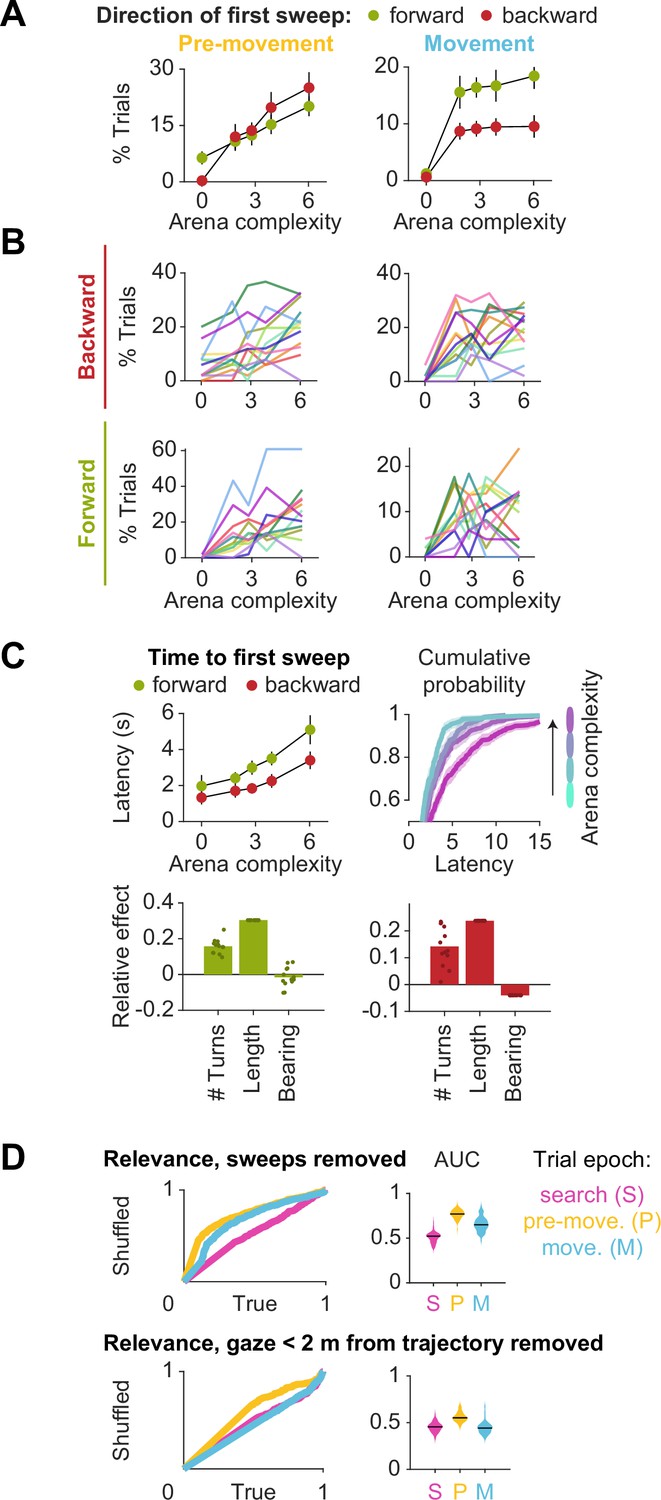
Sweep direction and timing.
(A) The direction of the first sweep was more likely to be backwards if it occurred prior to movement (left plot), and forwards if it occurred during movement (right). (B) Same plots as in A, but backward and forward sweeps are shown separately, and each color corresponds to a single participant. (C) Top left: The average delay between goal detection and the first sweep increased with arena difficulty. Top right: Cumulative distribution of sweep delays across all participants and all trials. Bar graphs: Linear mixed models with random intercepts and slopes for the effect of trial-specific variables on the latency to the first sweep if it occurred in the forward direction (bottom left) or the backward direction (bottom right). (Please see the description for Figure 1—figure supplement 1F for additional information.) The number of turns and especially the path length positively influence sweep latency. (D) Top left: ROC curves constructed as described in Figure 3A (rightmost) for the distributions of true vs. shuffled average relevance values for each trial (pooled across all arenas, all participants, and all trials), with periods of sweeping eye movements removed, reveals that during the pre-movement (orange) and movement (blue) epochs, non-sequential eye movements are still directed towards task-relevant locations. Top right: AUC plots were constructed with sweeps removed, as described in Figure 3B. The AUC values remain well above chance during the pre-movement (orange) and movement (blue) epochs. Bottom left/right: The same analysis was performed with gaze positions falling within 2 m of the participant’s trajectory on each trial removed, revealing that the remaining visual samples were made to relevant locations in space during pre-movement, but not during movement.
Figure 5
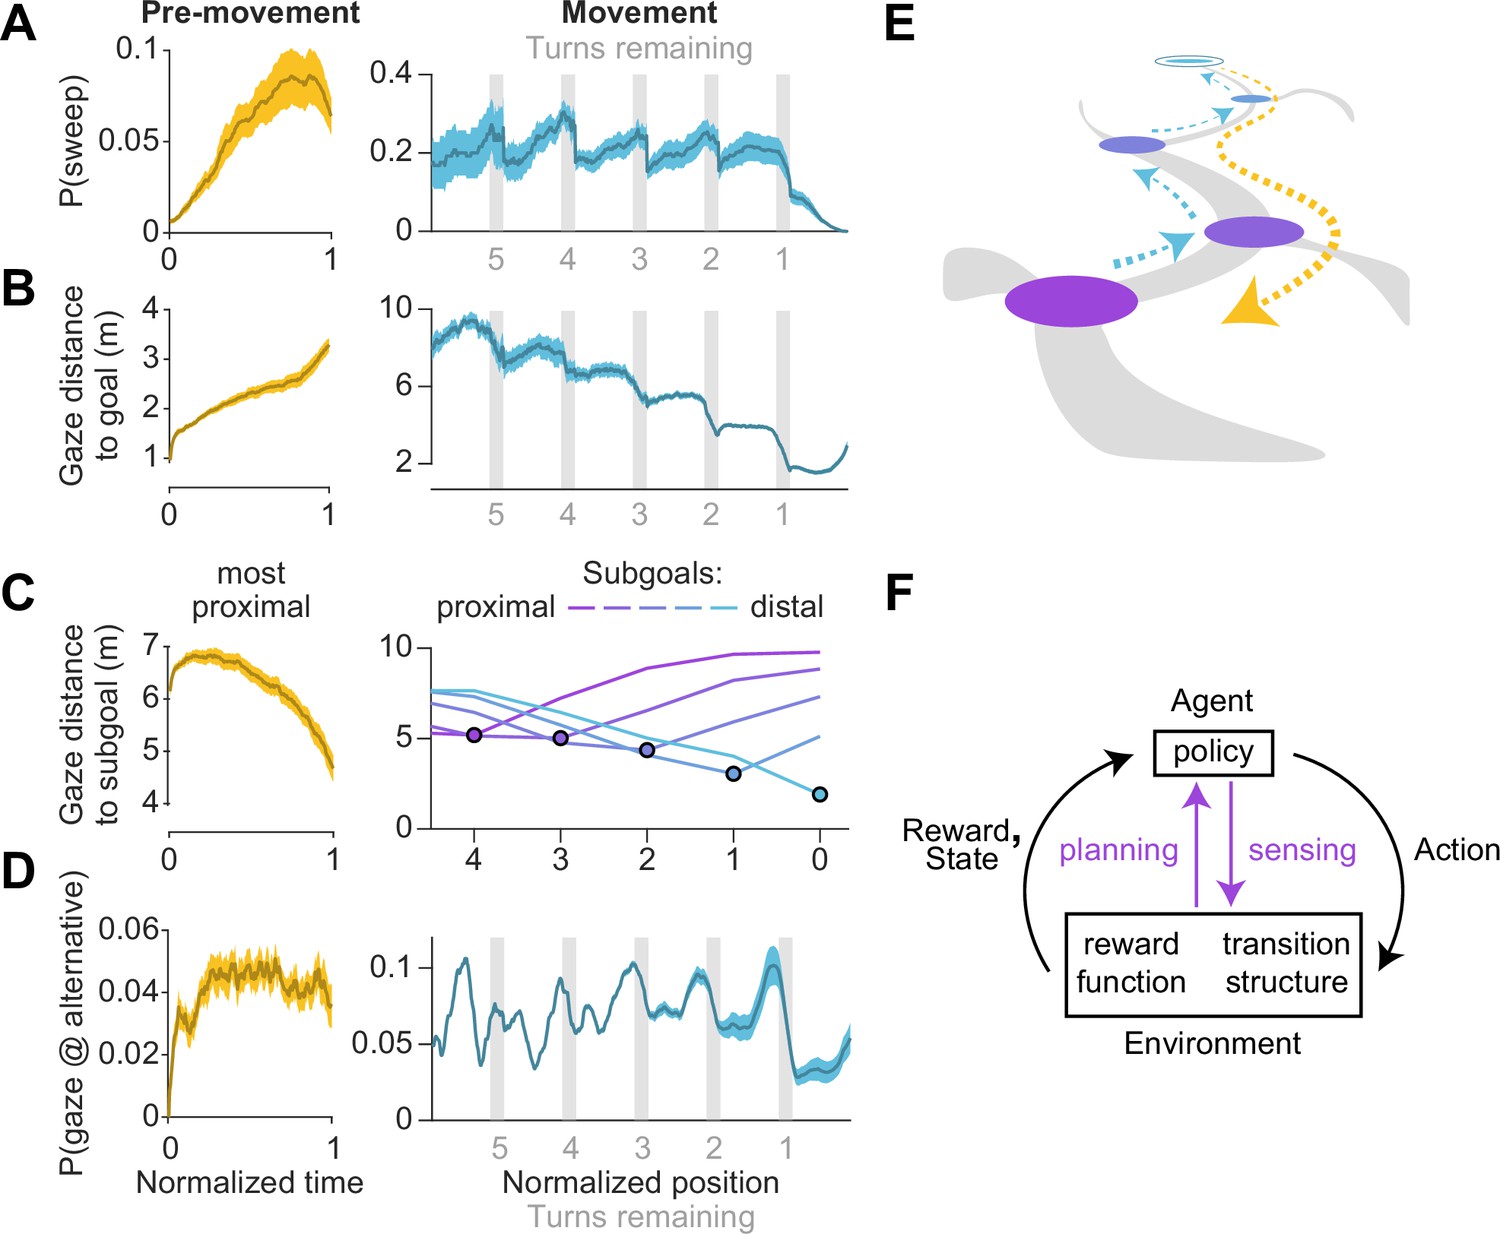
Timing of sweeps reveals task decomposition.
Trials across all arenas and all participants were aligned and scaled for the purpose of trial-averaging. This process was carried out separately for the pre-movement and movement epochs. (A) Left: Prior to movement, the probability of (backward) sweeps increased with time. Right: During movement, the probability of (forward) sweeps transiently increased at the precise moments when participants reached each subgoal. Participant position is defined in relation to the location of subgoals. Subgoals are designated as numbers starting from the goal (subgoal 0) and counting backwards along the trajectory (subgoals 1, 2, 3 etc.) such that greater values correspond to more proximal subgoals. (B) Left: Gaze traveled away from the goal location prior to movement. Right: The average distance of gaze from the goal decreased in steps, with steps occurring at each subgoal. (C) Distance of gaze from individual subgoals (most proximal in yellow, most distal in cyan). Left: Gaze traveled towards the most proximal subgoal prior to movement, consistent with the increased probability of backward sweeps during this epoch. Right: The average distance of gaze to each individual subgoal (colored lines) was minimized precisely when participants approached that subgoal. (D) Left: The probability of gazing at alternative trajectories is relatively constant throughout the pre-movement epoch. Right: Participants gaze at alternative trajectories more frequently when approaching turns. (E) A graphical summary of the spatiotemporal dynamics of eye movements in this task. Subgoals are depicted in the same color scheme used in C. (F) Diagram of a standard Markov Decision Process, augmented with an additional pathway for agent-environment interaction through eye movements (colored arrows). Dashed arrows denote sweeps, and possible paths throughout the arena are depicted in gray. Darker bounds in A–C denote ±1 SEM.
Appendix 1—figure 1
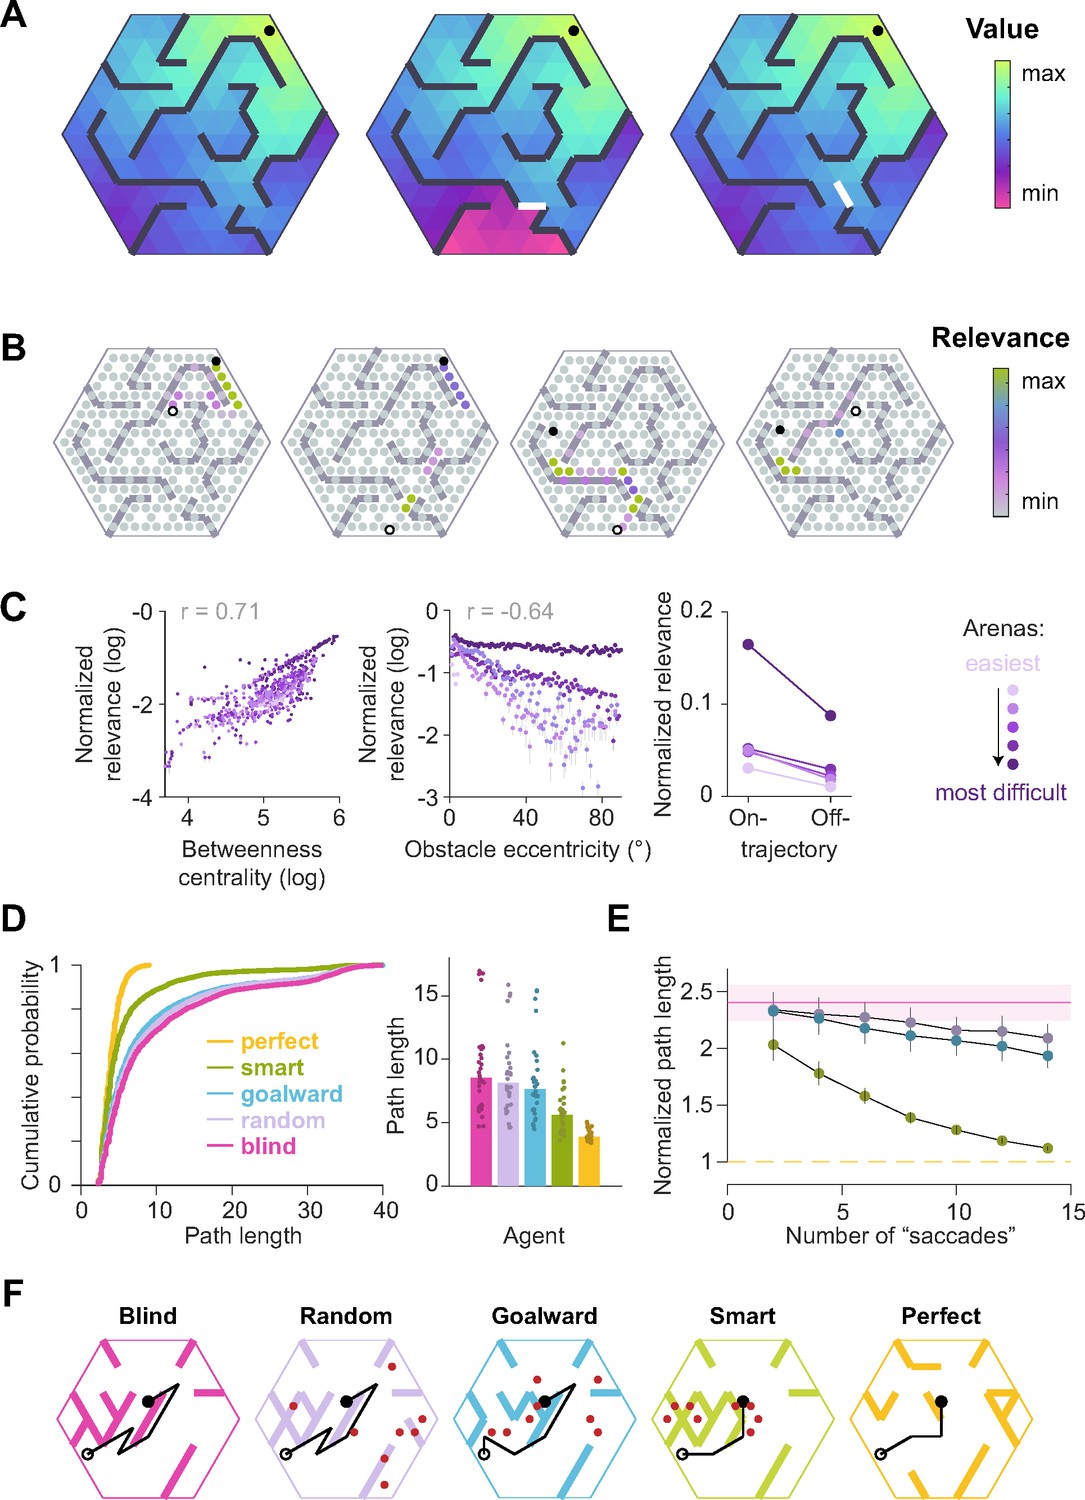
Simulations validate the utility of precisely knowing the status of theoretically important transitions.
(A) Value functions corresponding to an arbitrary goal location (closed circle) in an example arena (left) and in the arenas resulting from blocking either a bottleneck transition (center) or a transition that was not a bottleneck (right). (B) Theoretical relevance of all transitions (circles) for the example arena for four different pairs of start (open black circle) and goal (closed black circle) states. (C) The betweenness centrality of a state describes the degree to which the state controls the traffic flowing through the area (see Methods). Left: Across all possible start and end locations, the mean normalized relevance of non-obstacle transitions (across all possible start and goal state pairings) was positively correlated with betweenness centrality values. Middle: The mean normalized relevance of obstacles was negatively correlated with the eccentricity of each obstacle from the straight line connecting the current state to the goal state. Right: Transitions that fell on the optimal trajectory had greater relevance than those that fell outside of it. (D) Simulation results of an agent instantiated with a perfect transition model (orange), and four agents with imperfect transition models, three of whom were endowed with the ability to correct their model according to different rules (see text). Those three agents were allowed to make eight ’saccades’, each of which could update one transition. Left: Cumulative distributions of the path lengths of various agents (100 trials each from 25 different arenas; see Methods). Right: Median of trial-averaged path lengths across all simulated arenas; data points denote trial-averaged path lengths in individual arenas. (E) Results of simulations similar to D but with a variable budget of ’saccades’. Each line denotes the average path length (across arenas) of one agent as a function of the number of ’saccades’. For each trial, path lengths of different agents were normalized by the optimal path length before trial-averaging. Error bars denote ±1 SEM. (F) Example simulated trajectories, as well as the gaze samples (red dots, if applicable), taken by each agent. The configuration of the arena reflects the agent’s subjective model at the end of all eye movements. Note that the subjective model of the ‘smart’ agent was still quite mismatched with the true world model after eight eye movements, but the visual samples allowed for the correction of the model at crucial locations such that the trajectory of the ‘smart’ agent was closer to optimal than that of the other agents.
Appendix 1—figure 2
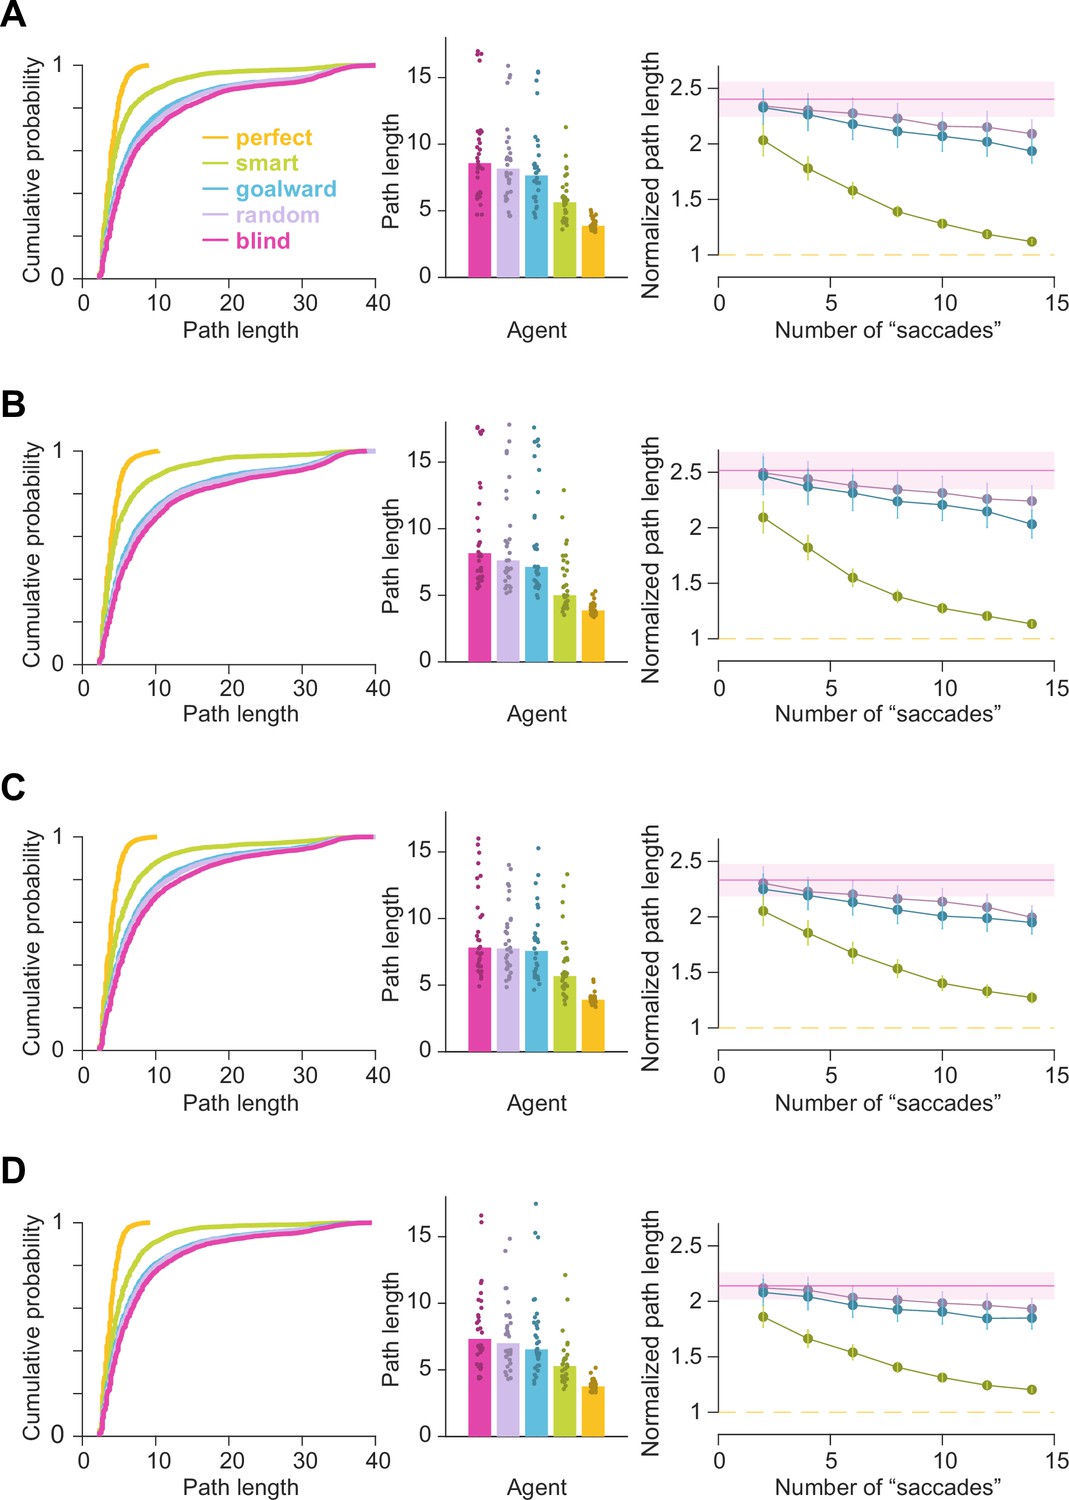
Simulations reveal that foveating ‘relevant transitions’ reduces path length.
Results were robust to the precise algorithm (value iteration vs. successor representation) as well as the degree of temporal abstraction (current state vs optimal trajectory) used to estimate the relevance of transitions. Plots similar to Figure 3C and D are shown for relevance values calculated with A value iteration, current state, B value iteration, entire trajectory, C successor representation, current state, and D successor representation, entire trajectory.
Videos
Video 1
Six representative trials in which participants exhibited sweeping eye movements.
(Top) Aerial view of the arena with the participant’s dynamically evolving position (lilac) and gaze (green). The target is represented as a black circle. (Bottom) Time-evolving version of the plot described in Figure 4B. The video speed is veridical, and the search epoch was omitted from each trial.
Tables
Appendix 2—table 1
The order of arena presentation was randomized across participants.
| Participant ID | Block 1 | Block 2 | Block 3 | Block 4 | Block 5 |
|---|---|---|---|---|---|
| 1 | 3 | 2 | 1 | 4 | 5 |
| 2 | 5 | 4 | 1 | 2 | 3 |
| 3 | 5 | 3 | 1 | 2 | 4 |
| 4 | 4 | 5 | 2 | 3 | 1 |
| 5 | 3 | 4 | 2 | 5 | 1 |
| 6 | 5 | 2 | 1 | 3 | 4 |
| 7 | 3 | 2 | 5 | 1 | 4 |
| 8 | 4 | 5 | 3 | 1 | 2 |
| 9 | 2 | 1 | 4 | 5 | 3 |
| 10 | 5 | 3 | 1 | 2 | 4 |
| 11 | 2 | 3 | 4 | 5 | 1 |
| 12 | 1 | 2 | 5 | 3 | 4 |
| 13 | 3 | 2 | 5 | 1 | 4 |
Appendix 2—table 2
Median true relevance values (vs median shuffled relevance) for each arena (×10-3).
Arenas 1–5 are in the order of least to greatest complexity.
| Epoch | Arena 1 | Arena 2 | Arena 3 | Arena 4 | Arena 5 |
|---|---|---|---|---|---|
| Search | 0 (vs 0) | 0 (vs 0) | 0 (vs 0) | 1.4 (vs 0.1) | 5.3 (vs 1.4) |
| Pre-movement | 32 (vs 0) | 31 (vs 0) | 45 (vs 0) | 47 (vs 0) | 137 (vs 6.2) |
| Movement | 0 (vs 0) | 9.5 (vs 0) | 47 (vs 0.7) | 51 (vs 4.3) | 201 (vs 60) |
Appendix 2—table 3
Number of participants (13 total) with a significant Pearson’s correlation (p≤0.05) between the dependent variable and each independent variable (number of turns, path length, bearing angle, number of trajectory options).
Note: This correlation analyses does not characterize conditional dependencies, which may also be present in the data. Such dependencies are factored into the LME model described elsewhere.
| Figure(s) | Dependent variable | # Turns | Length | Bearing | # Options |
|---|---|---|---|---|---|
| 1i | Pre-movement epoch duration | 12 | 12 | 10 | 1 |
| 1i | Movement epoch duration | 13 | 13 | 12 | 5 |
| 2b | Variance of gaze pre-move. | 13 | 13 | 11 | 5 |
| 2b | Variance of gaze move. | 10 | 13 | 7 | 6 |
| 2d | Gaze @ goal duration pre-move. | 13 | 13 | 10 | 8 |
| 2d | Gaze @ goal duration move. | 13 | 13 | 12 | 10 |
| 2 f | Gaze distance from goal pre-move. | 13 | 13 | 11 | 7 |
| 2 f | Gaze distance from goal move. | 13 | 13 | 11 | 7 |
| 4 c, 4d | % Time sweeping backward pre-move. | 10 | 8 | 7 | 2 |
| 4 c, 4d | % Time sweeping backward move. | 12 | 12 | 4 | 3 |
| 4 c, 4e | % Time sweeping forward pre-move. | 2 | 3 | 3 | 2 |
| 4 c, 4e | % Time sweeping forward move. | 13 | 12 | 12 | 4 |
Appendix 2—table 4
Number of participants (13 total) with a significant Pearson’s correlation (p≤0.05) between the dependent variable and arena complexity (for analyses which require pooling trials).
A linear mixed effects model (LME) with random slopes and intercepts yielded participant-specific slopes, from which we computed the mean and coefficient of variation (CV). Note that results showed low between-participant variability. All variables were z-scored prior to model fitting.
| Figure(s) | Dependent variable | Mean slope | CV slope |
|---|---|---|---|
| 2d | Gaze @ goal duration move. by # turns remaining | 0.80 | 5.6e-15 |
| 2 f | Gaze distance from goal move. by # turns remaining | –0.86 | –2.2e-3 |
Additional files
Download links
A two-part list of links to download the article, or parts of the article, in various formats.
Downloads (link to download the article as PDF)
Open citations (links to open the citations from this article in various online reference manager services)
Cite this article (links to download the citations from this article in formats compatible with various reference manager tools)
Eye movements reveal spatiotemporal dynamics of visually-informed planning in navigation
eLife 11:e73097.
https://doi.org/10.7554/eLife.73097


