Different B cell subpopulations show distinct patterns in their IgH repertoire metrics
- Division of Immunology, University Children's Hospital and Children’s Research Center, University of Zurich (UZH), Switzerland
- Department of Statistics, University of Oxford, United Kingdom
- Alchemab Therapeutics Ltd, United Kingdom
Figures
Figure 1 with 3 supplements
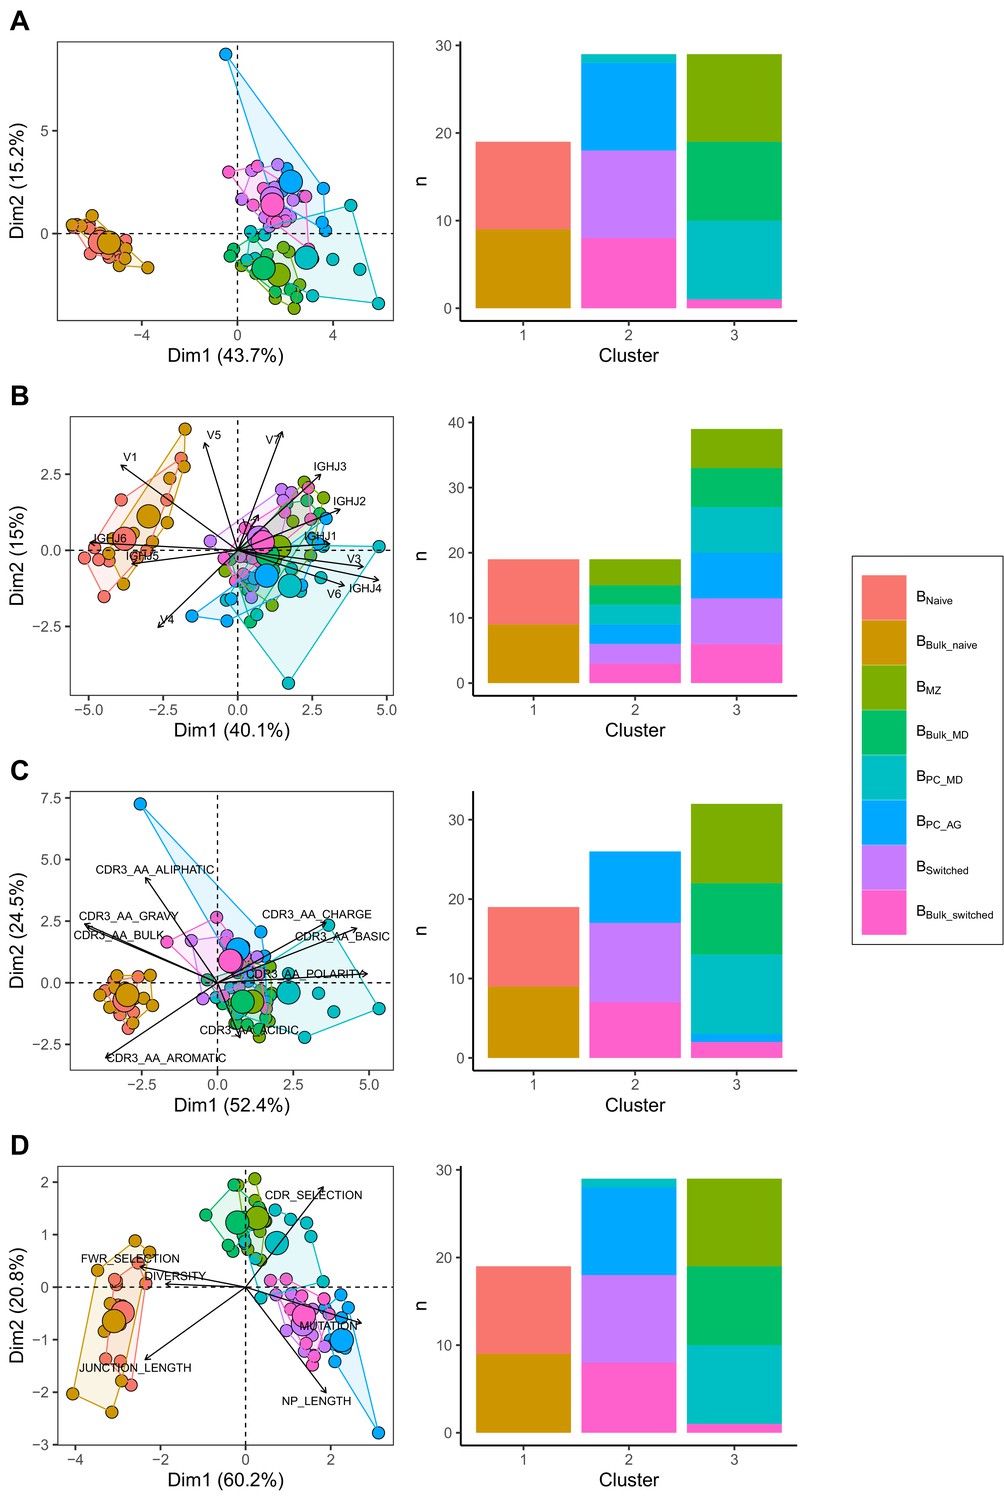
Different repertoire characteristics similarly separate between B cells subpopulations.
Principal component analysis (PCA) (left) and composition of the clusters formed using k-means clustering with k = 3 (right) applied on (A) all repertoire characteristics, (B) V family and J gene usage (see Figure 1—figure supplement 1), (C) physiochemical properties of CDR3 junction (see Figure 1—figure supplement 2) and (D) global repertoire metrics (see Figure 1—figure supplement 3). The percentage of all variation in the data that is explained by PC1 and PC2 is shown on the x and y axis, respectively, between brackets. In the PCA plots, areas are the convex hulls of the subsets, and the largest point of one colour represents the centre of that hull.
-
Figure 1—source data 1
Related to Figure 1A-D.
- https://cdn.elifesciences.org/articles/73111/elife-73111-fig1-data1-v2.zip
Figure 1—figure supplement 1
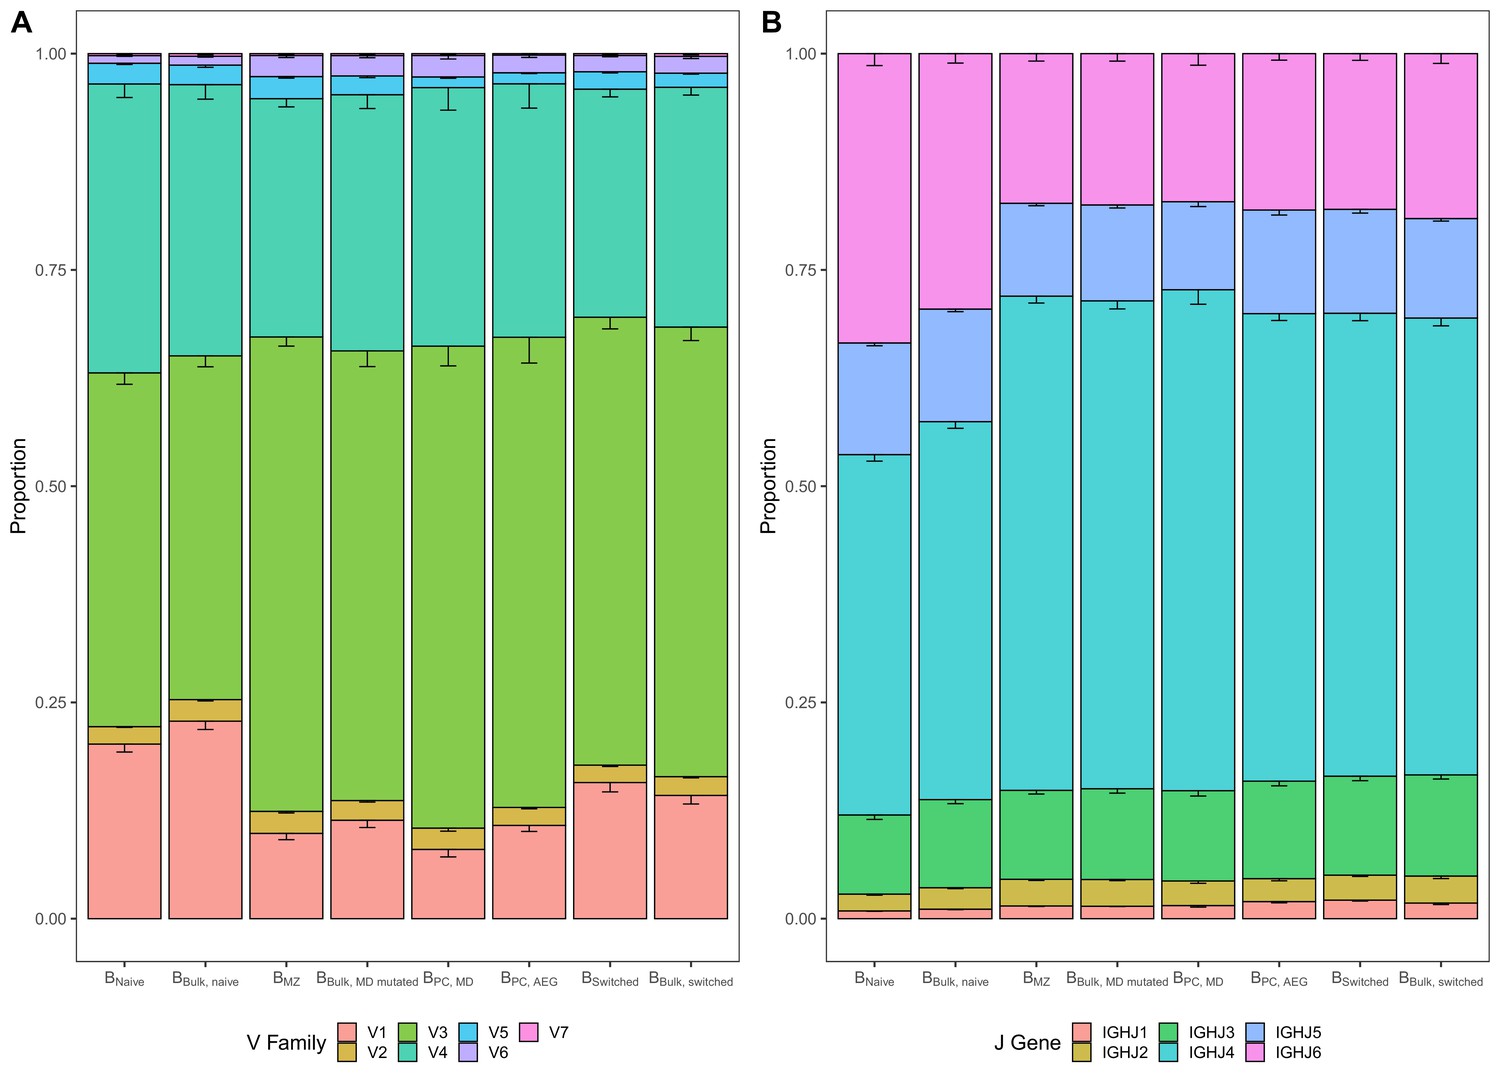
Differences in V and J gene usage across different B cell subpopulations.
(A) V family and (B) J gene usage by B cell subpopulation representing data underlying PCA in Figure 1B. Bar plots indicate the proportion of sequences with a certain gene. Error bars represent the standard error of the mean. Underlying source data can be accessed under Figure 1—source data 1.
Figure 1—figure supplement 2
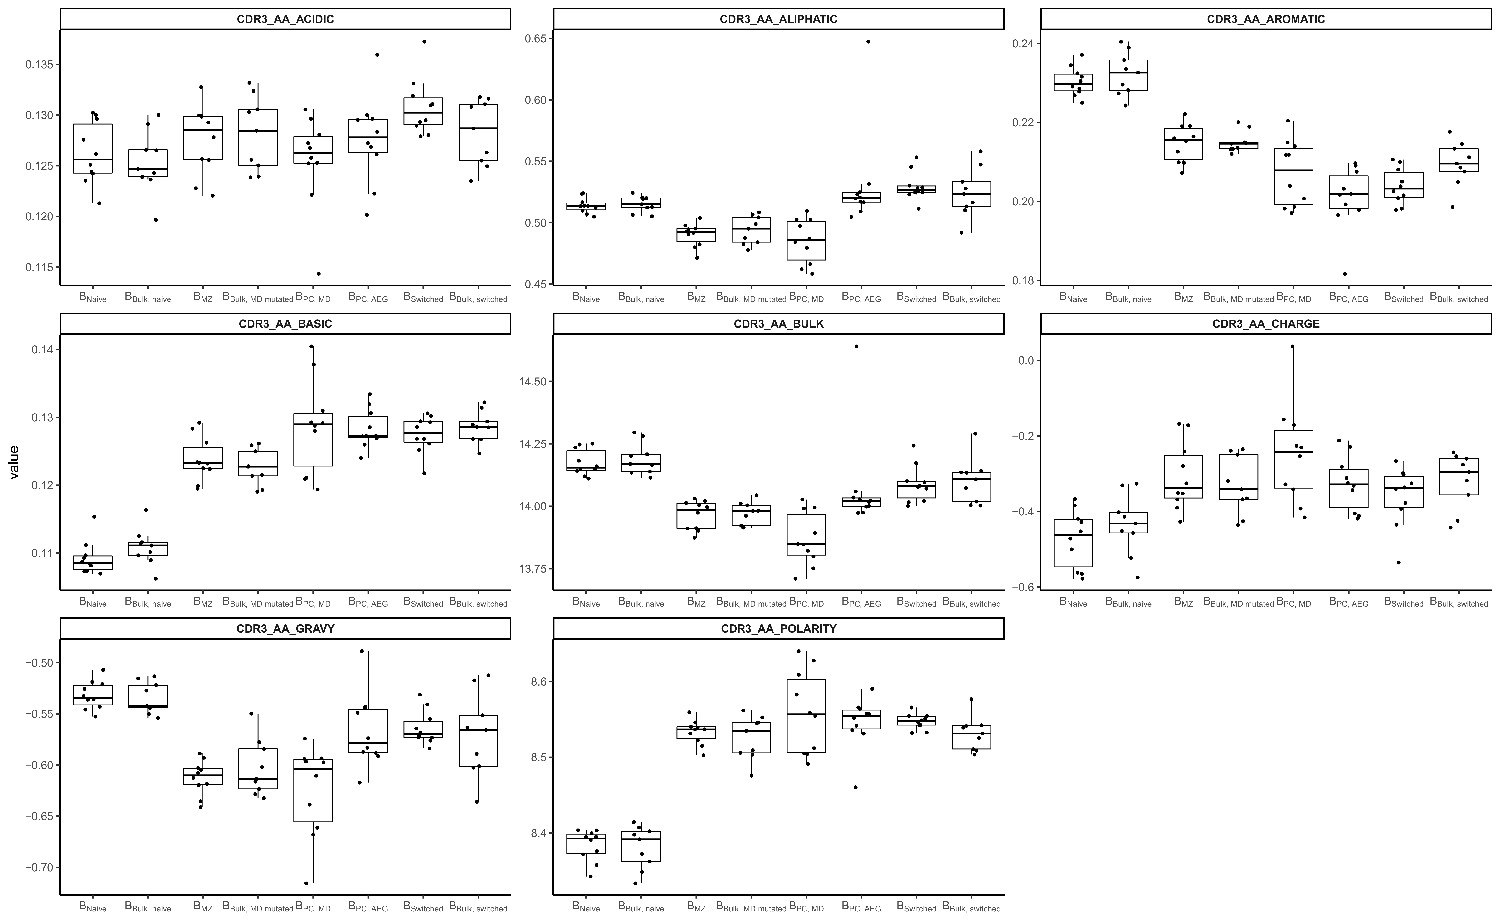
Comparison of CDR3 amino acid physiochemical properties in different B cell subpopulations.
Figure 1—figure supplement 3
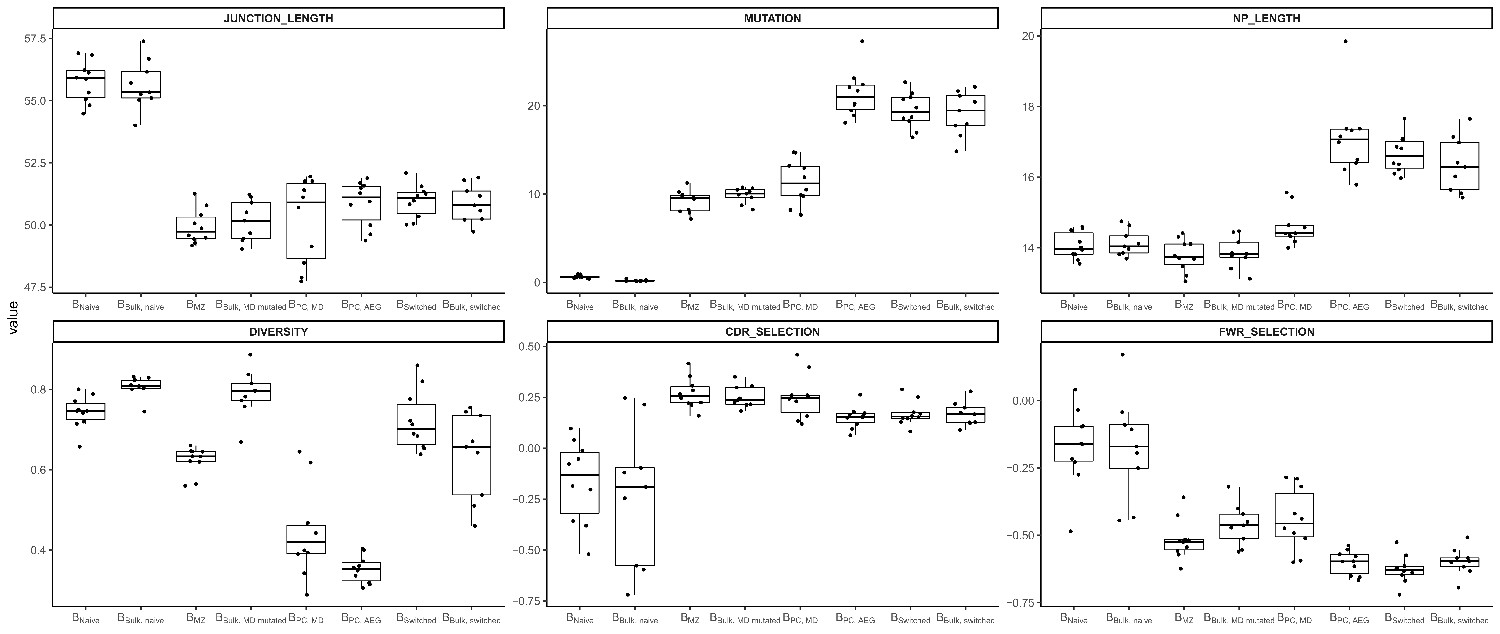
Comparison of global repertoire metrics in different B cell subpopulations.
Figure 2
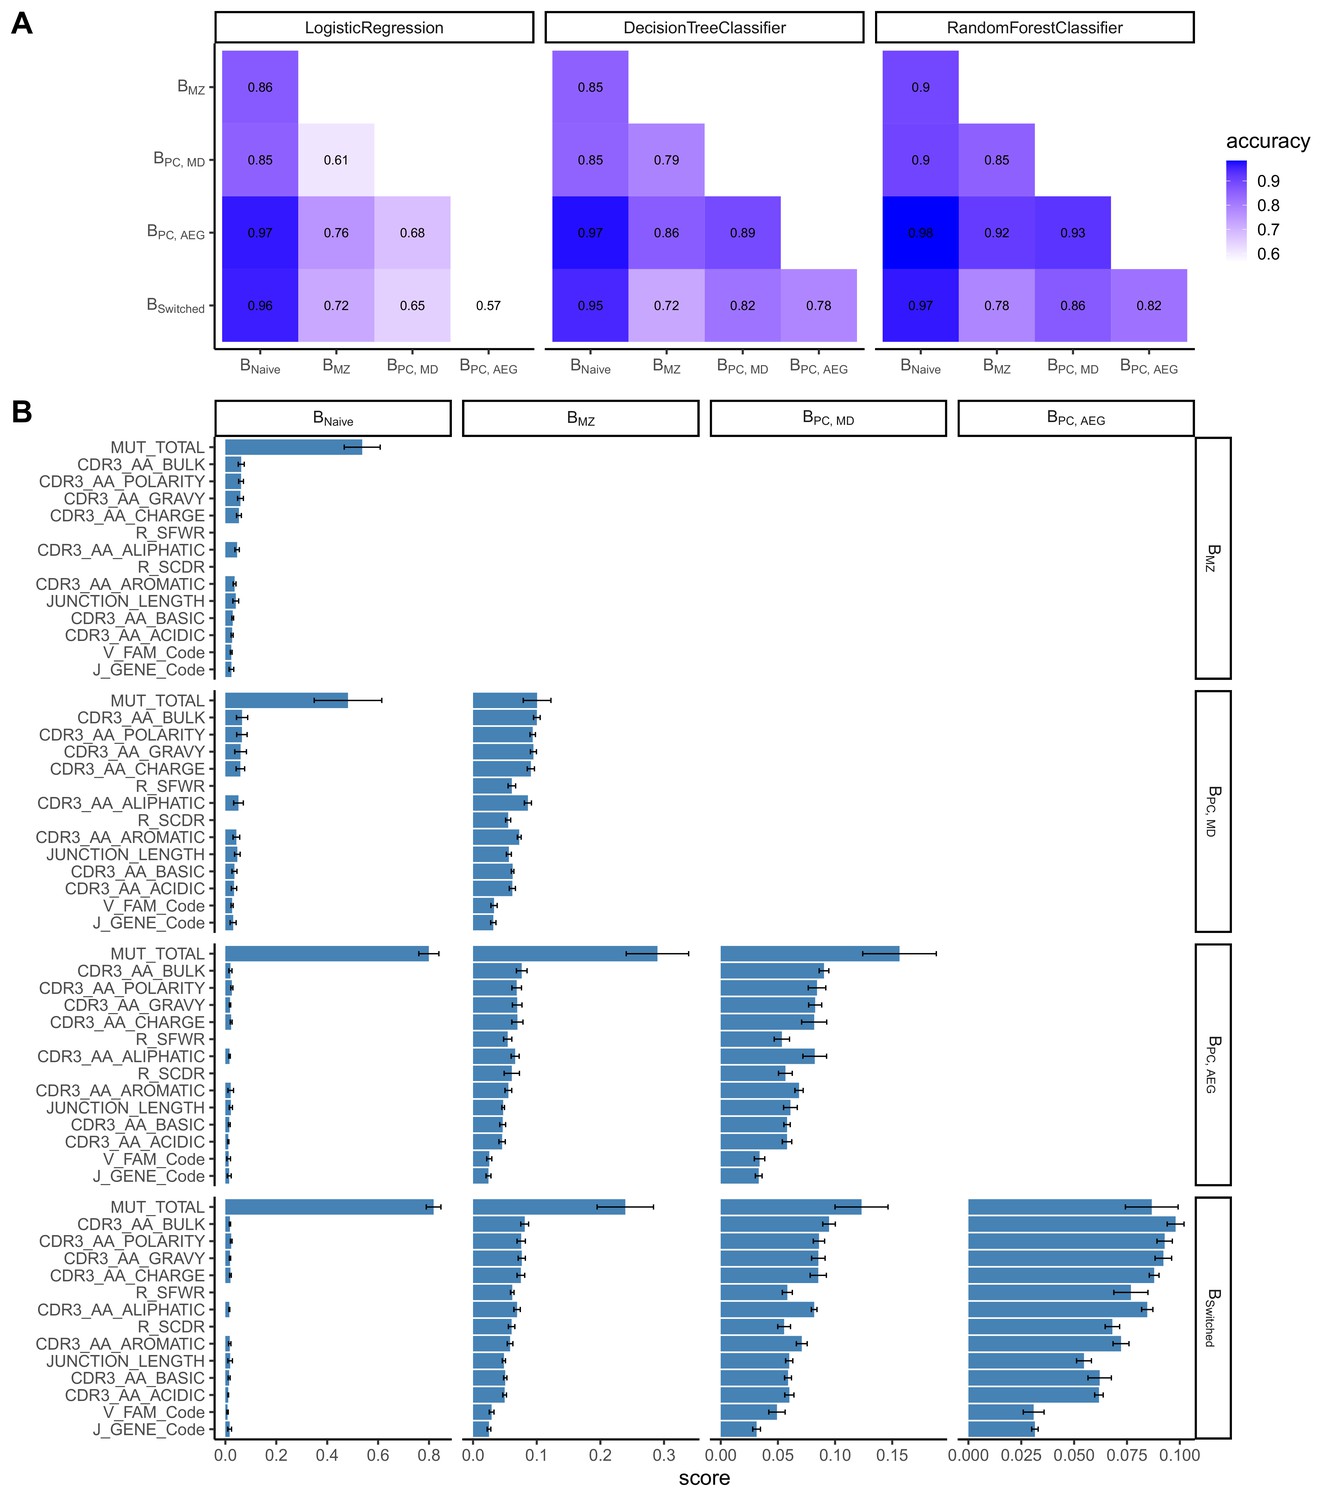
Classification accuracies and feature scores on a single-sequence level.
(A) Heatmap showing pairwise classification accuracy results using logistic regression, decision tree and random forest classifier. (B) Random forest feature scores by cell pair.
Figure 3
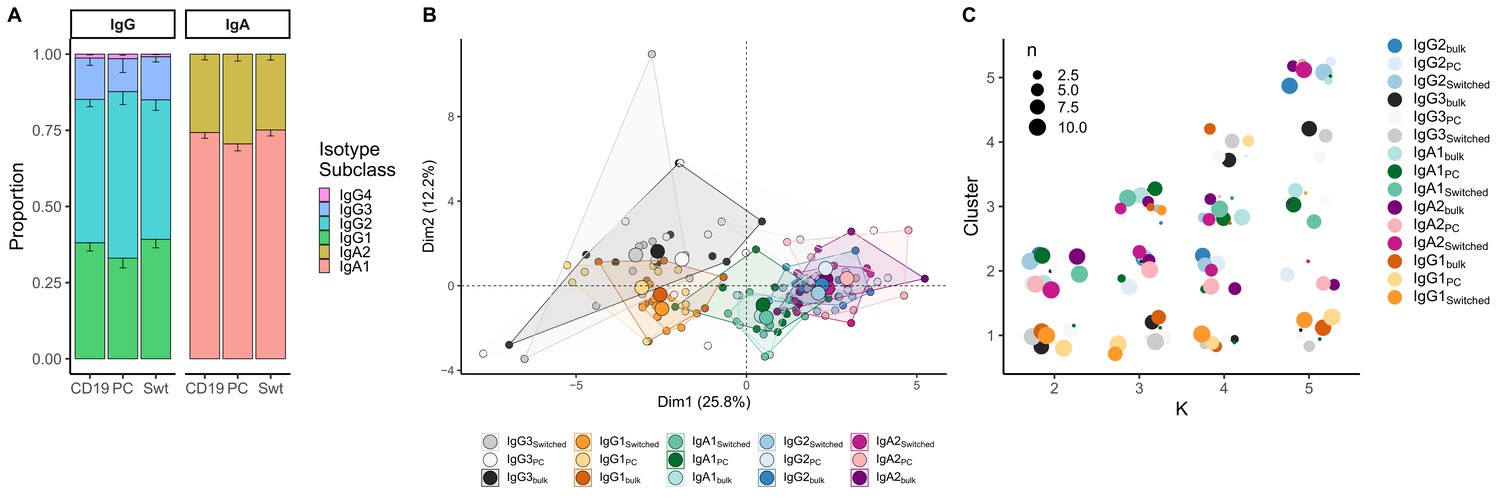
Analysis of isotype subclasses in IgG and IgA transcripts.
(A) Isotype subclass distribution by cell type. Error bars represent the standard error of the mean. (B) Principal component analysis (PCA) on all repertoire properties combined by cell type and isotype subclass. Areas are the convex hulls of a group, and the largest point of one colour represents the centre of that hull. (C) Composition of the clusters formed by applying the k-means clustering algorithm on all data with increasing k from k = 2 to k = 5. Underlyaing source data can be found under Figure 4—source data 1.
Figure 4 with 1 supplement
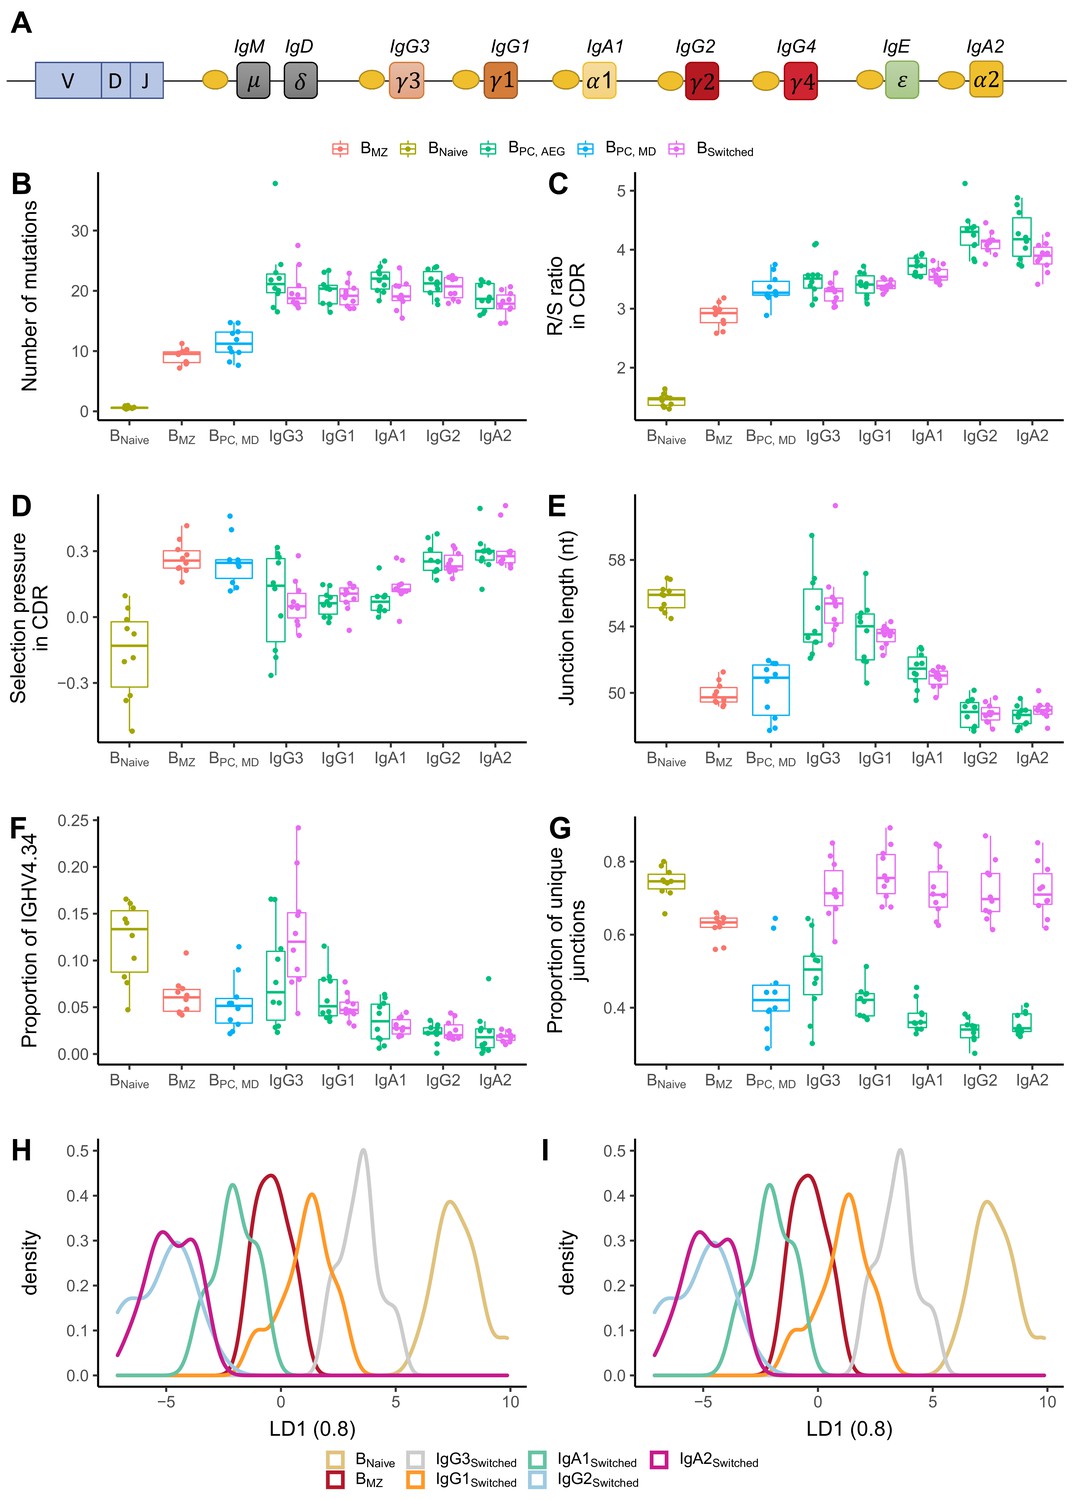
Analysis of repertoire metrics by isotype subclass and cell type.
(A) Overview of the IgH constant region locus. Comparison of (B) mutation counts, (C) R/S ratio, (D) selection pressure, (E) junction length, (F) proportion of IGHV4-34 and (G) diversity between different B cell subpopulations. Linear discriminant analysis (LDA) fitted on (H) V family and J gene usage (see Figure 4—figure supplement 1) and (I) CDR3 amino acid physiochemical properties.
-
Figure 4—source data 1
- https://cdn.elifesciences.org/articles/73111/elife-73111-fig4-data1-v2.zip
Figure 4—figure supplement 1
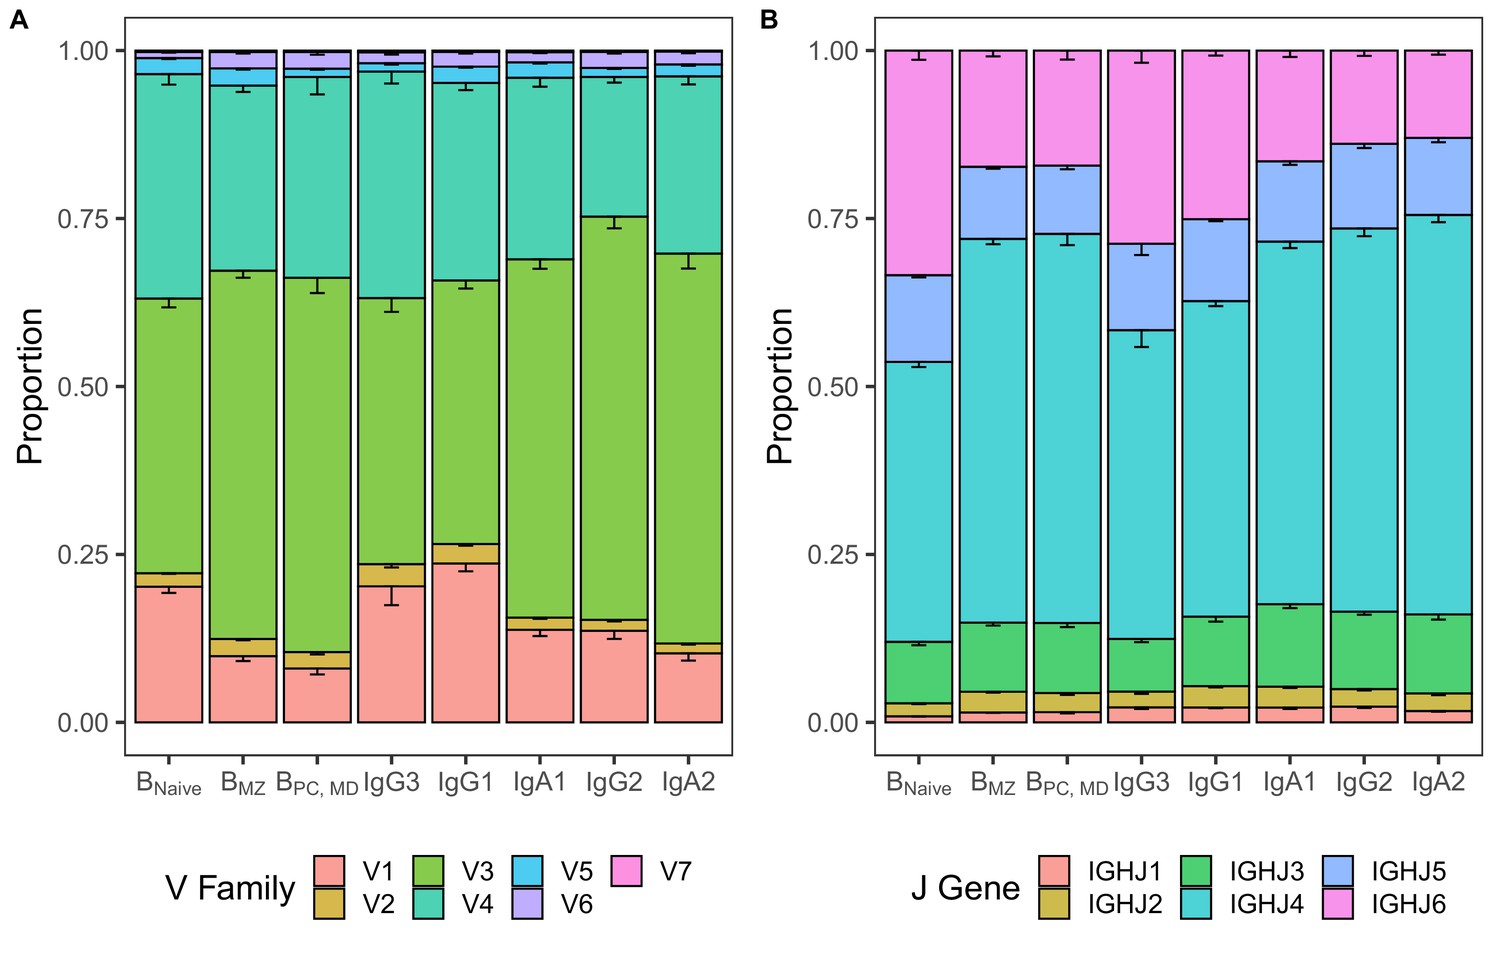
Differences in V and J usage across different B cell subpopulations and istotype subclasses.
(A) V family and (B) J gene usage in different B cell subpopulations and isotype subclasses representing data underlying LDA in Figure 4H. Bar plots indicate the proportion of sequences with a certain gene. Error bars represent the standard error of the mean.
Tables
Key resources table
| Reagent type (species) or resource | Designation | Source or reference | Identifiers | Additional information |
|---|---|---|---|---|
| Antibody | Anti-human CD19-PE (mouse monoclonal) | BioLegend | Cat# 363003; RRID:AB_2564125 | FACS (5 μl per test) |
| Antibody | Anti-human CD27-FITC (mouse monoclonal) | BioLegend | Cat# 302806; RRID:AB_314298 | FACS (5 μl per test) |
| Antibody | Anti-human CD38-APC/Fire 750 (mouse monoclonal) | BioLegend | Cat# 356626; RRID:AB_2616713 | FACS (5 μl per test) |
| Antibody | Anti-human IgD-APC (mouse monoclonal) | BioLegend | Cat# 348222; RRID:AB_2561595 | FACS (5 μl per test) |
| Antibody | Anti-human IgM-Pacific Blue (mouse monoclonal) | BioLegend | Cat# 314513; RRID:AB_10574306 | FACS (5 μl per test) |
Additional files
-
Supplementary file 1
Demographics, number of cells and purity of samples.
- https://cdn.elifesciences.org/articles/73111/elife-73111-supp1-v2.docx
-
Transparent reporting form
- https://cdn.elifesciences.org/articles/73111/elife-73111-transrepform1-v2.pdf
Download links
A two-part list of links to download the article, or parts of the article, in various formats.
Downloads (link to download the article as PDF)
Open citations (links to open the citations from this article in various online reference manager services)
Cite this article (links to download the citations from this article in formats compatible with various reference manager tools)
Different B cell subpopulations show distinct patterns in their IgH repertoire metrics
eLife 10:e73111.
https://doi.org/10.7554/eLife.73111


