Local field potentials reflect cortical population dynamics in a region-specific and frequency-dependent manner
- Department of Bioengineering, Imperial College London, United Kingdom
- Neural and Cognitive Engineering Group, Centre for Automation and Robotics, Spanish National Research Council, Spain
- Department of Neuroscience, Icahn School of Medicine at Mount Sinai, United States
- Département de neurosciences, Faculté de médecine, Université de Montréal, Canada
- Department of Bioengineering, University of Pittsburgh, United States
- Department of Neuroscience, Northwestern University, United States
- Department of Biomedical Engineering, Northwestern University, United States
- Department of Physical Medicine and Rehabilitation, Northwestern University, and Shirley Ryan AbilityLab, United States
Figures
Figure 1
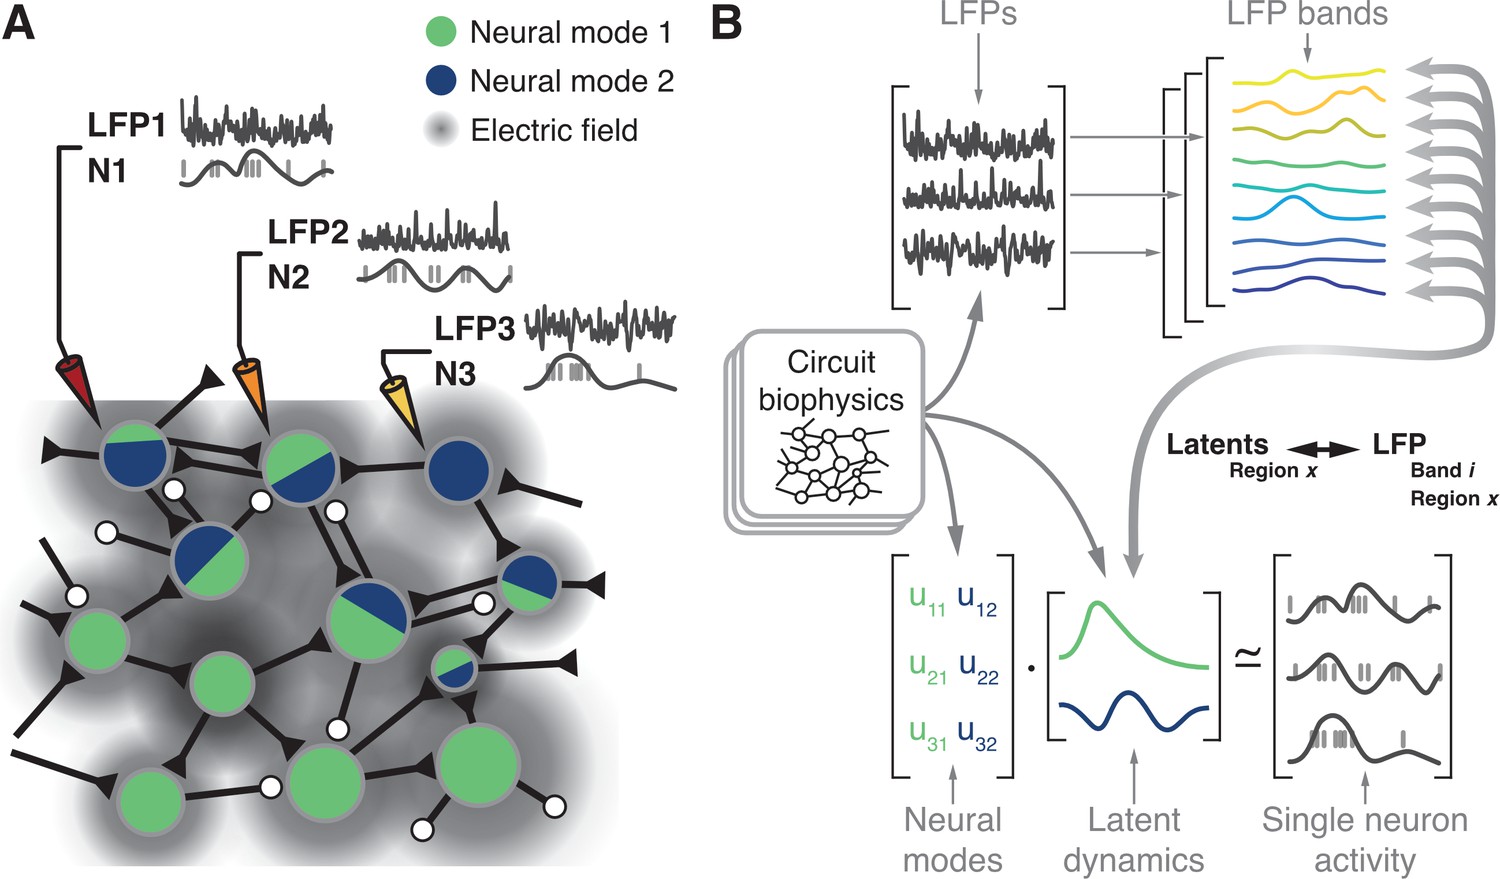
Hypothesis.
(A) Microelectrode arrays record both the spiking activity of single neurons (denoted as N1, N2, N3) and the local field potentials at these same sites (denoted as LFP1, LFP2, LFP3) of a cortical region X. (B) Synchronisation of synaptic currents within this circuit generate LFPs in different bands (top). Circuit connectivity and other biophysical properties also constrain the coordinated latent dynamics of the N1, N2, N3 population (bottom). We thus hypothesise that, for each brain region, there will be a frequency-dependent association between LFPs and latent dynamics that should remain stable while circuit biophysics remain stable.
Figure 2
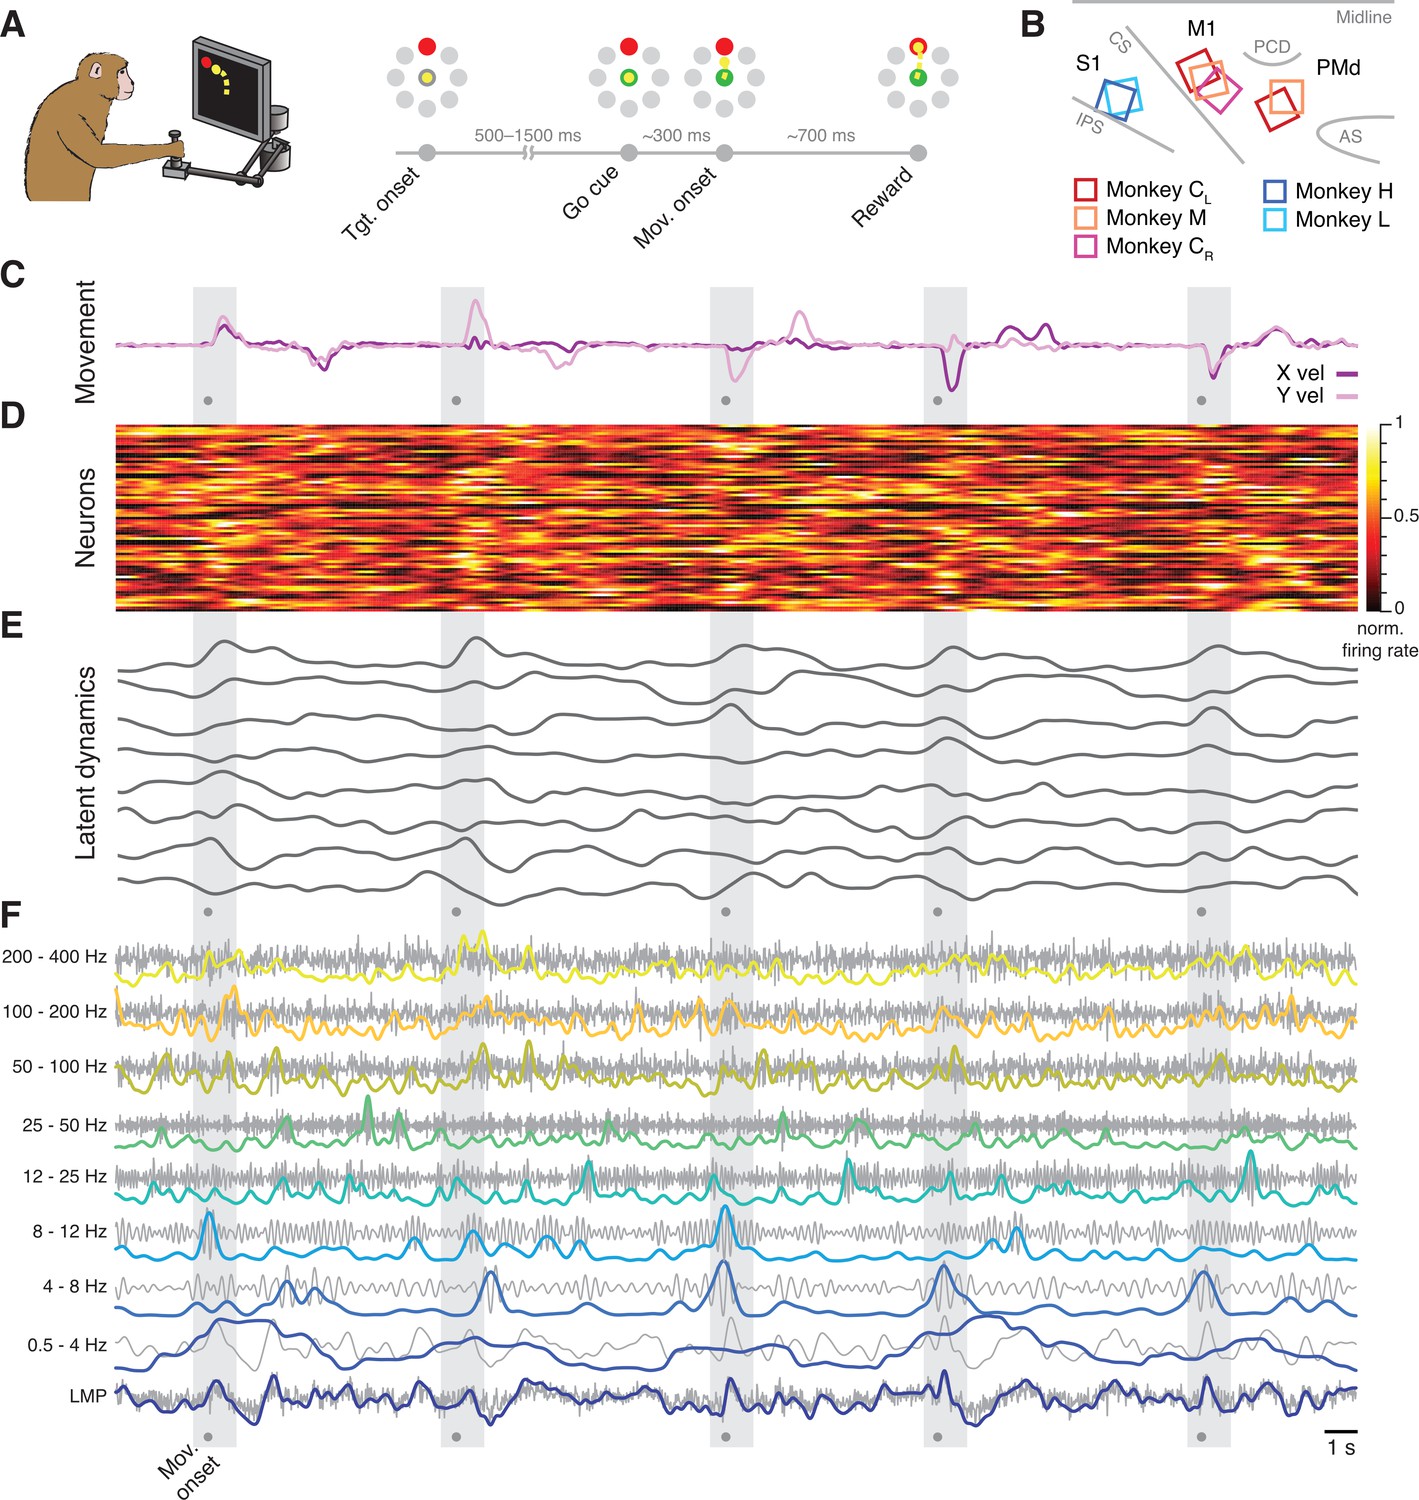
Behavioural task and neural recordings.
(A) Monkeys performed a reaching task using a planar manipulandum. (B) Approximate locations of all seven arrays; each colour is one set of implants (legend). IPS, intraparietal sulcus; CS, central sulcus; AS, arcuate sulcus; PCD, precentral dimple. (C) Hand velocity along the horizontal (X) and vertical (Y) axes during five trials from a representative session from Monkey CL. Shaded grey areas, reach epoch for each trial; dots, movement onset. (D) Example neural recordings showing the activity of 84 simultaneously recorded putative single neurons. (E) Latent dynamics corresponding to the neural firing rates in D. (F) Example local field potential (LFP) recordings. Each row shows the LFP activity filtered in one of the nine frequency bands we studied (grey) along with its power (colour). A, B have been adapted from Figure 2A and Figure 3A from Gallego et al., 2020.
Figure 3 with 6 supplements
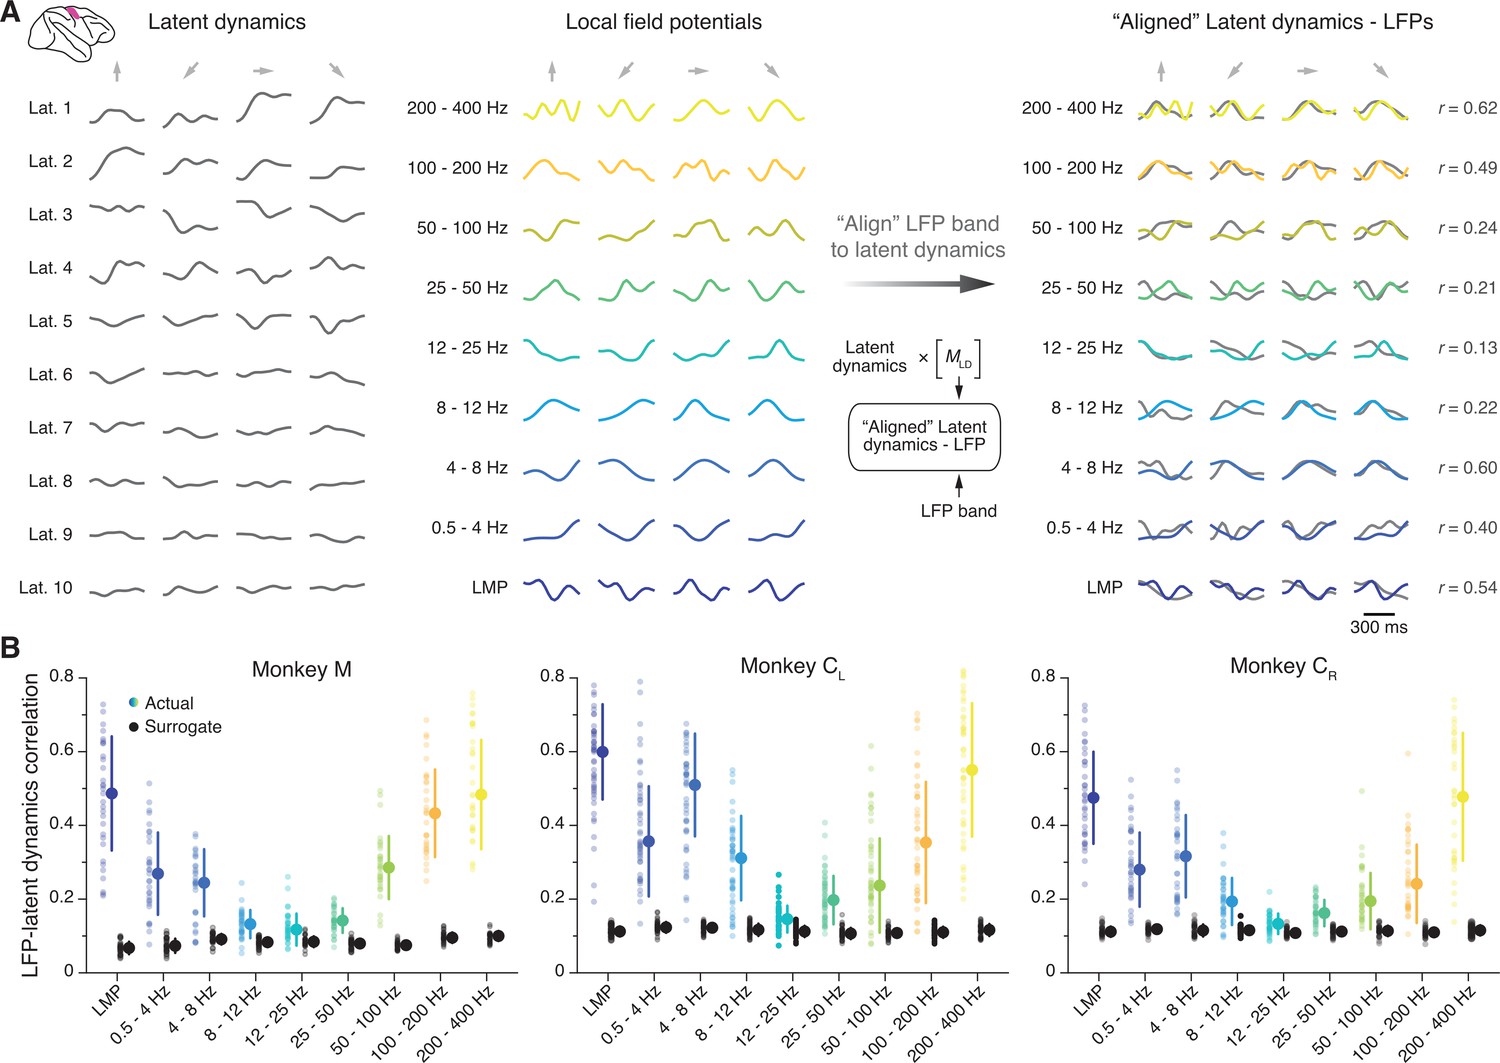
Similarity between primary motor cortex (M1) latent dynamics and each local field potential (LFP) band during movement execution.
(A) Left: Example M1 latent dynamics during four reaches to different targets (direction indicated by the arrows above each column); figure shows top 10 dimensions of the latent dynamics. Middle: Example LFP power in each of the nine bands we study during the same three trials. Right: Canonical correlation analysis (CCA) ‘alignment’ finds strong similarities between certain LFP bands and the latent dynamics. r, correlation coefficient. From one session from Monkey CL. (B) Correlation between each LFP band and the latent dynamics (coloured markers) during one representative session from each M1 monkey. Black markers show the control correlation values obtained after generating surrogate neural activity using tensor maximum entropy (TME); note that at low and high LFP frequencies, the actual correlations are much larger than the surrogate correlations. Error bars, median ± s.d. (n=31, 50, 34 for Monkeys M, CL, and CR, respectively).
Figure 3—figure supplement 1
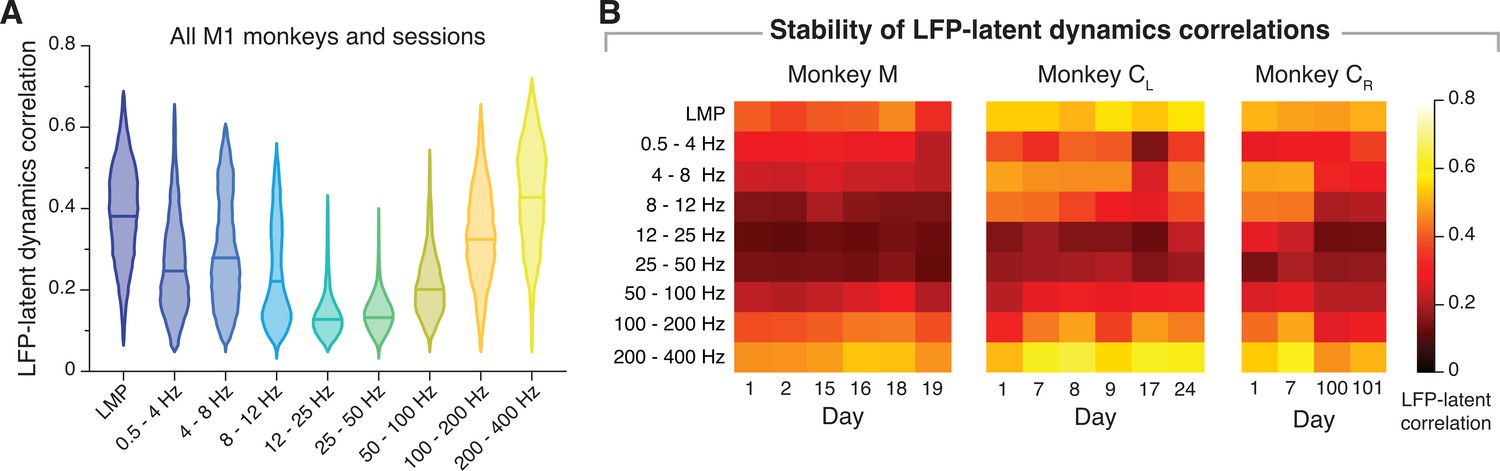
Similarity between primary motor cortex (M1) latent dynamics and each local field potential (LFP) band.
(A) Correlation between each LFP band and the latent dynamics; data pooled across all M1 sessions and monkeys. Note that the correlation profile matches well the example sessions in Figure 3. Violin, probability density for one frequency band (n=606); horizontal line, median. (B) Stability of the LFP-latent dynamics correlation profiles across different sessions from each monkey. Coloured squares represent the mean value across all LFP channels for each frequency band. Note that the frequency-dependent correlations are very similar across sessions; the only noticeable change is a shift in magnitude between days 7 and 100 for Monkey CR.
Figure 3—figure supplement 2
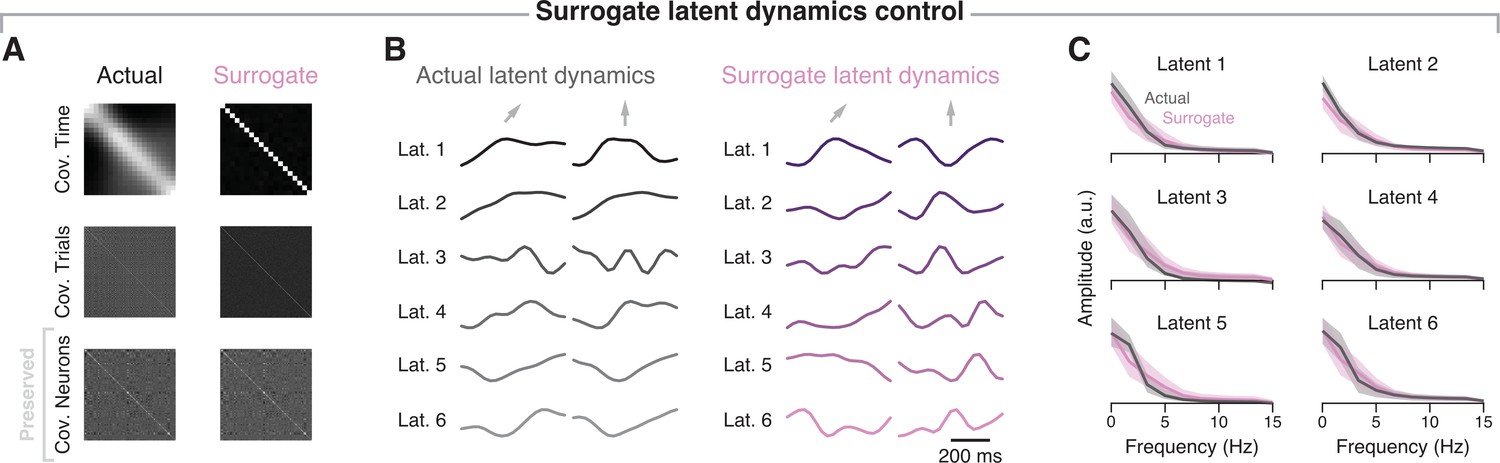
Surrogate latent dynamics control.
(A) Covariance over time, across trials and across neurons for the example session from Monkey CL shown in Figure 3 (‘Actual’), compared to the same covariance matrices from surrogate data that preserves the covariance across neurons (‘Surrogate’) that is, the neural manifold. (B) Example actual latent dynamics and surrogate latent dynamics generated using tensor maximum entropy (TME) for two randomly selected trials from the same example session. Arrows, target direction. Only six of ten dimensions are shown for visualisation purposes. (C) Amplitude spectrum of the actual and surrogate latent dynamics for the same session. Line and shaded areas: mean ± s.d. across all the trials in the session (n=286). Note the strong similarity in spectral content between actual and surrogate latent dynamics.
Figure 3—figure supplement 3
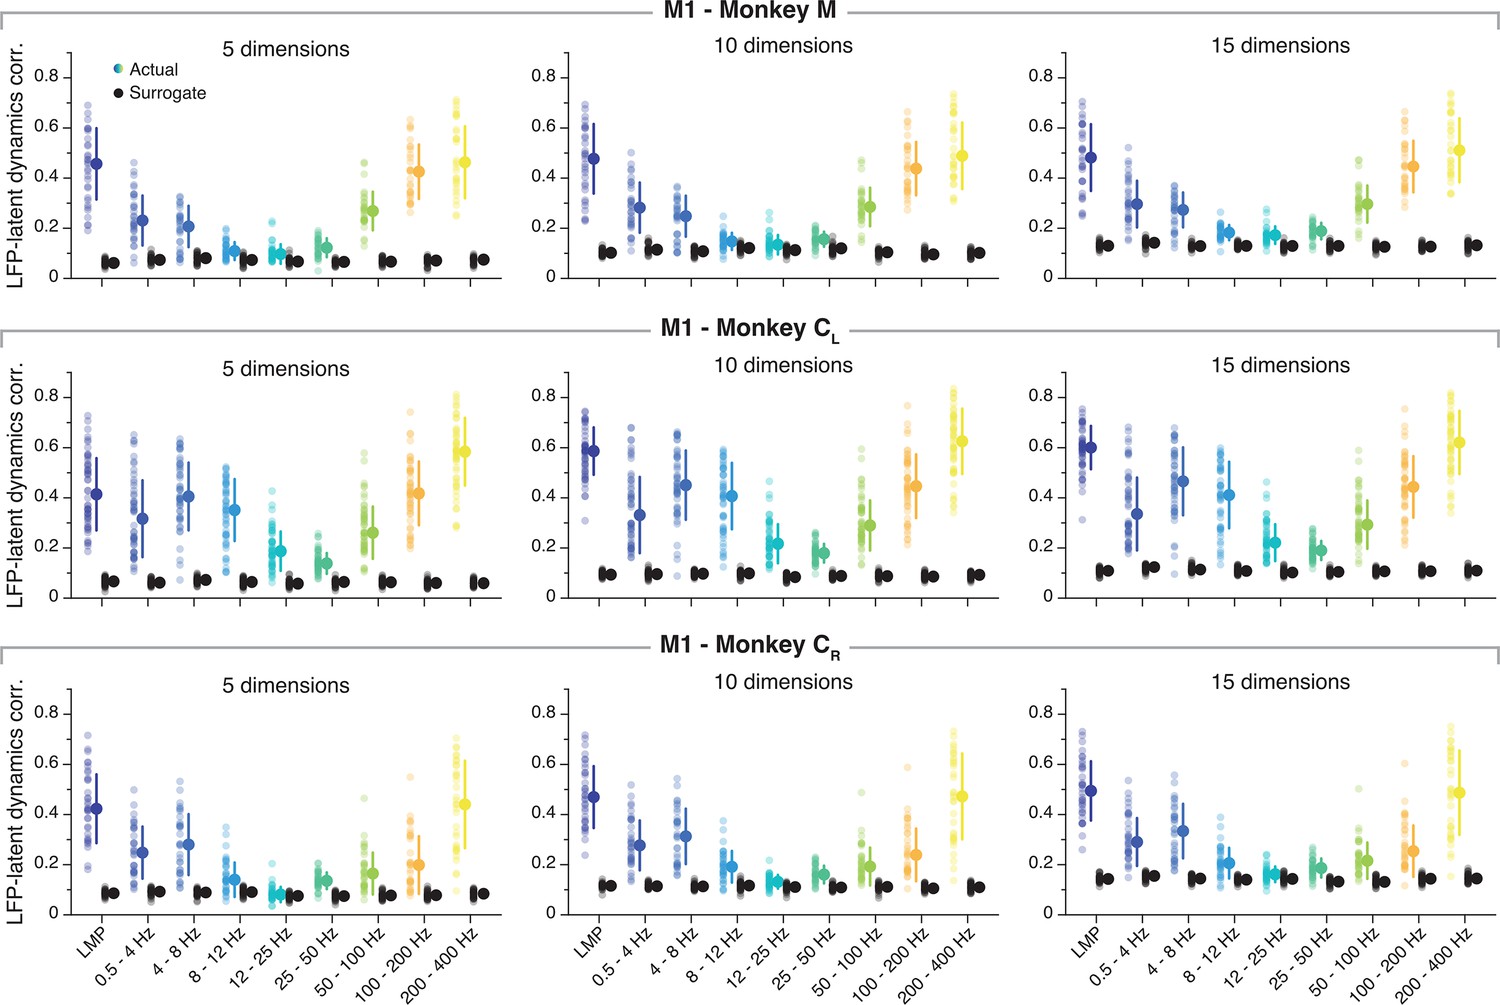
The local field potential (LFP)-latent dynamics correlation profiles are preserved when changing neural manifold dimensionality.
Similarity between primary motor cortex (M1) latent dynamics and each LFP band for three different manifold dimensionalities. The plots show the same representative session from each M1 monkey shown in Figure 3 using the same format. Note that the trend in the LFP-latent dynamics correlation profile does not depend on the assumed dimensionality of the neural manifold. For all comparisons, two-sided Wilcoxon’s rank sum test, p<0.001 except when comparing the 12–25 Hz LFP band to the latent dynamics in a five-dimensional manifold for Monkey CR (p=0.037).
Figure 3—figure supplement 4
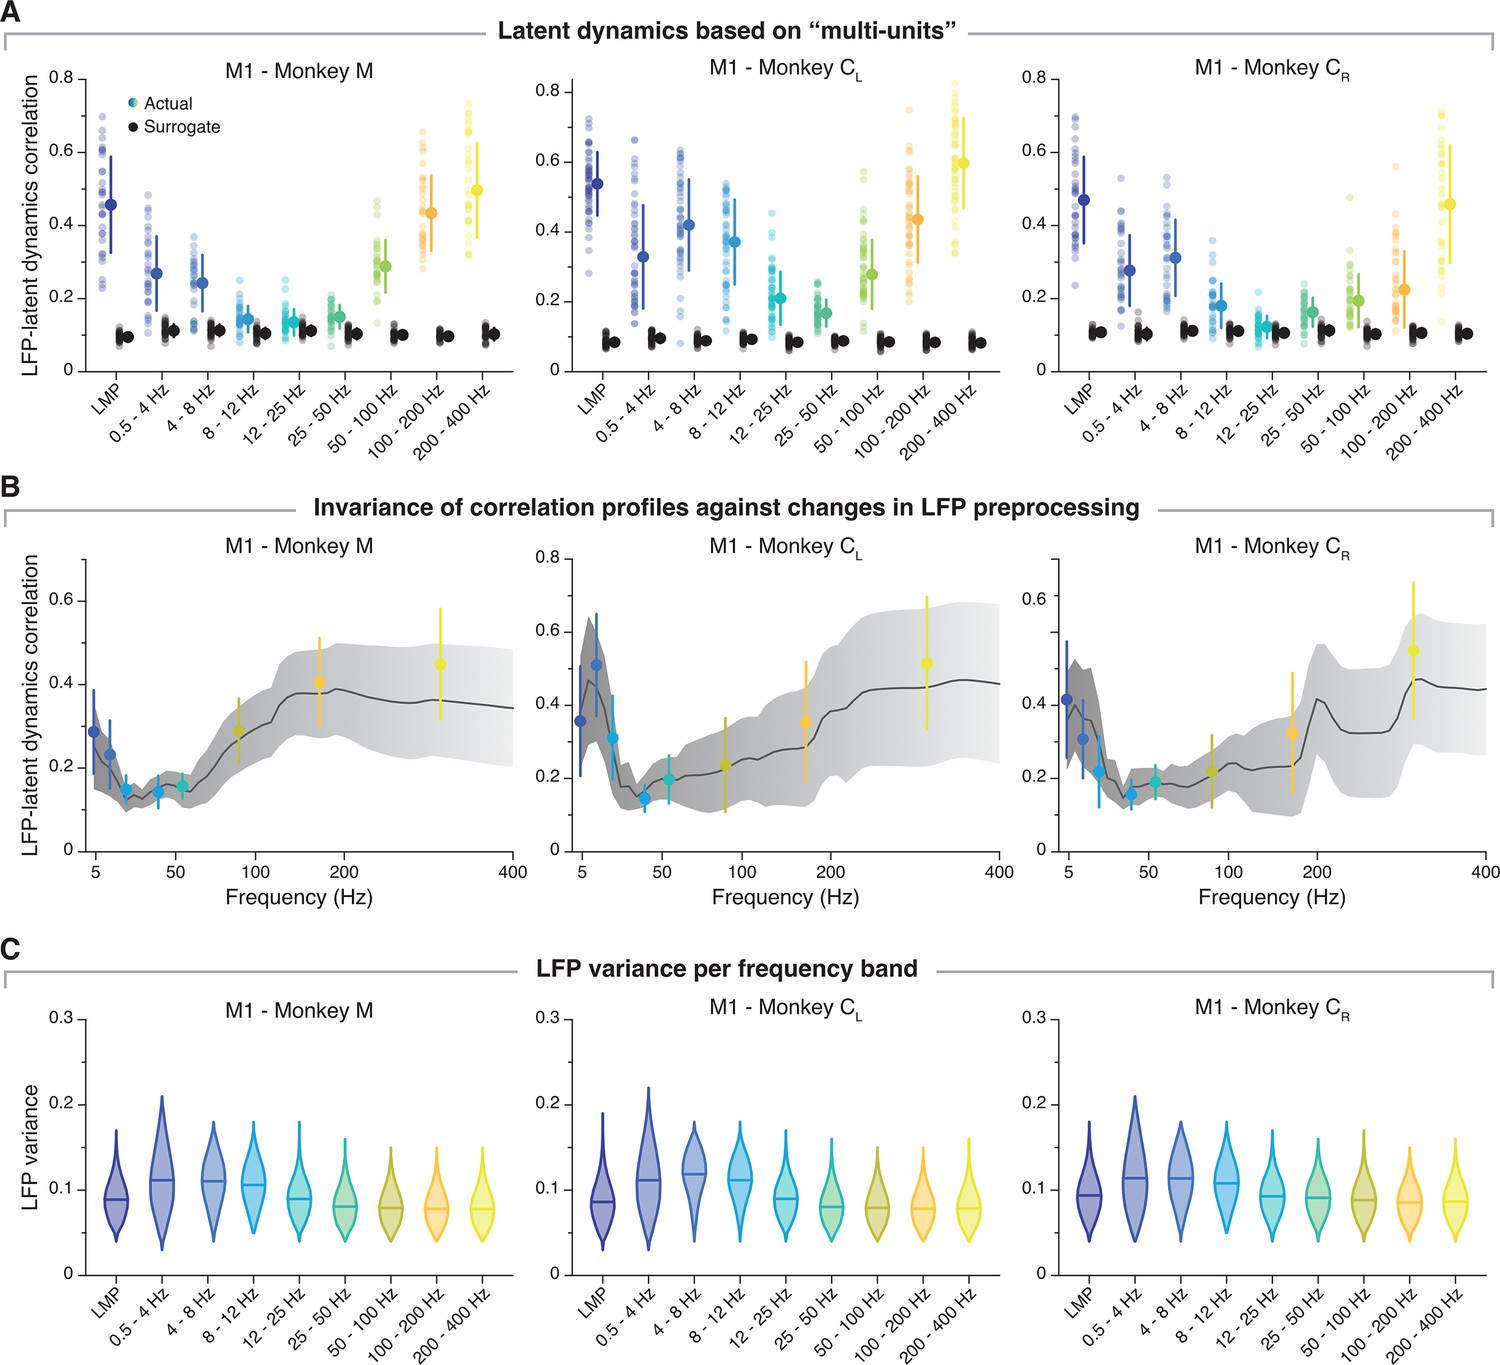
Further control analyses to illustrate the frequency-dependent relationship between primary motor cortex (M1) latent dynamics and each local field potential (LFP) band.
(A) Correlation between each LFP band and the latent dynamics (coloured markers) after pooling all single neurons on each electrode as a ‘multi-unit’. Data for the same representative sessions from each M1 monkey shown in Figure 3 and Figure 3—figure supplement 3. Black markers show the control correlation values obtained after generating surrogate neural activity using tensor maximum entropy (TME). Note that pooling single neurons into ‘multi-units’ does not alter the results: all the trends are the same as in Figure 3B. Error bars, median ± s.d. (n=31, 50, 34 for Monkeys M, CL, and CR, respectively). For all comparisons, two-sided Wilcoxon’s rank sum test, p<0.001 except when comparing the 12–25 Hz LFP band to the latent dynamics for Monkey CR (p=0.039). (B) The latent dynamics-LFP correlation profile does not depend critically on the frequency bands used for LFP pre-processing; it follows the same trend if the LFP power is computed on partly overlapping bands that sweep the entire signal spectrum (see Methods). The example sessions from each M1 monkey are the same as in Figure 3B (the coloured error bars are reproduced from that same figure). Line and shaded areas, mean ± s.d. (n=31, 50, 34 for Monkeys M, CL, and CR, respectively). (C) LFP power variance in each frequency band during the same example session from each M1 monkey shown throughout the paper. LFP variance is quite similar across bands, and the bands with highest correlations with the latent dynamics (local motor potential [LMP], 100–200 Hz, 200–400 Hz) are among those with lowest variance. Violin, probability density for one frequency band (n=677, 14,300, 6086) for Monkeys M, CL, and CR, respectively; horizontal line, median.
Figure 3—figure supplement 5

The relationship between local field potential (LFP) bands does not predict their association with the latent dynamics.
(A) Correlation between LFP bands for each of the M1 monkeys. Colour bar, correlation magnitude; upper triangle, mean correlation; bottom triangle, s.e.m. (n=31, 50, 34). Note that the cross-band correlations are quite low, even for bands that are strongly correlated with the latent dynamics such as the local motor potential (LMP) and 200–400 Hz. (B) Left: The correlation between LFP bands within the same electrode does not predict the correlation of each of these bands with the neural population latent dynamics. Data for all sessions from each of the three M1 monkeys. Right: Legend, pair of bands being compared.
Figure 3—figure supplement 6
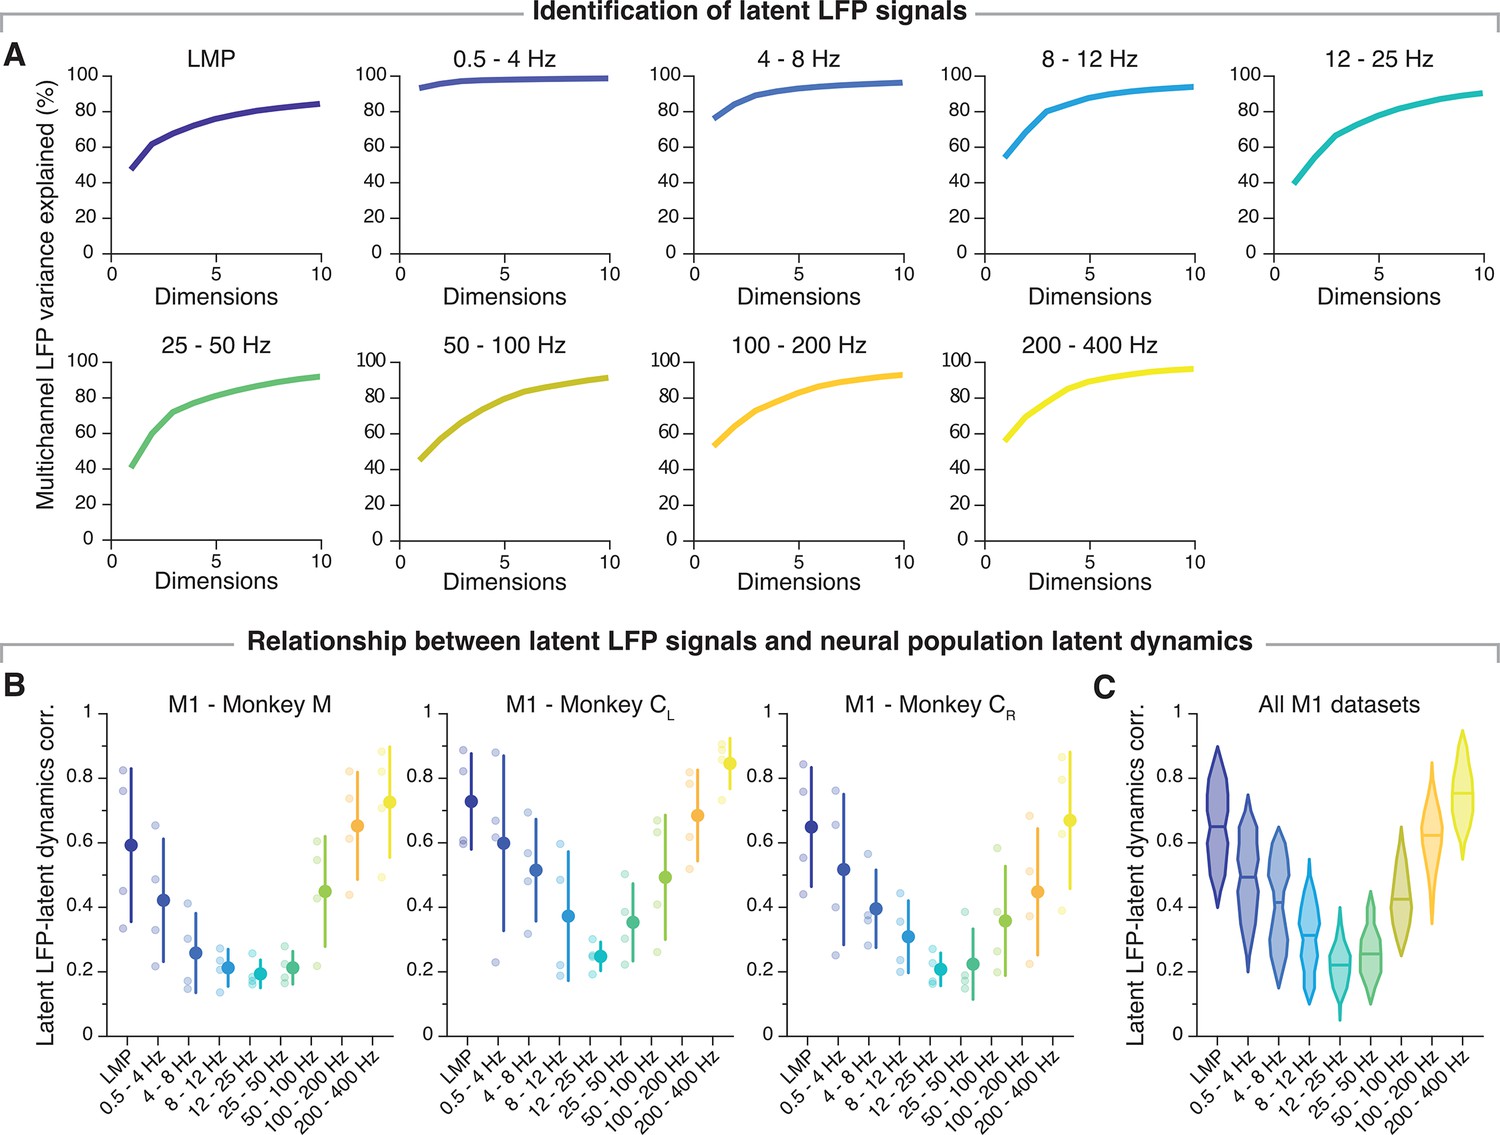
The latent local field potential (LFP) signals have a similar association with the neural population latent dynamics as the individual LFP signals do.
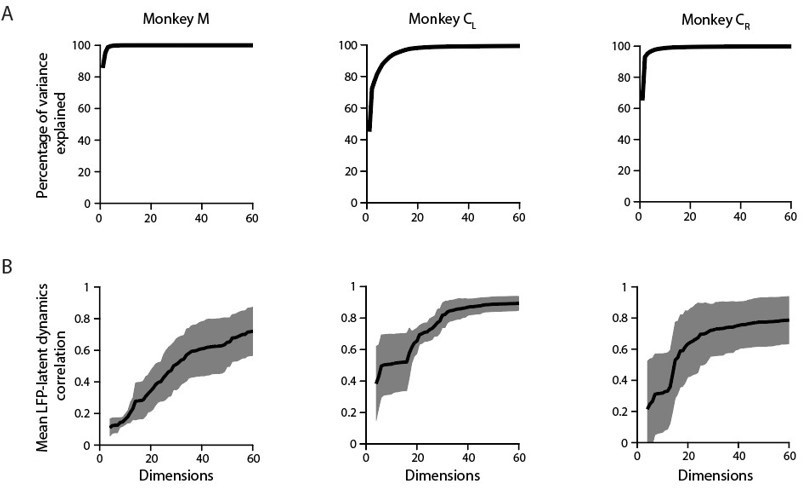
(A) Percentage multichannel LFP variance explained as number of LFP dimensions (principal components) for each frequency band. Data from the same example session from Monkey CL shown throughout the paper. Note that the apparent dimensionality does not predict the correlation with the neural population latent dynamics: frequency bands with similar eigenvalue distributions, such as the 25–50 Hz and 200–400 Hz bands, have very different correlations with the latent dynamics. (B) Frequency-dependent association between the latent LFP signals and the neural population latent dynamics. Markers, individual sessions; error bars, median ± s.d. (n=4 for each monkey). (C) Correlation between the frequency-specific latent LFP signals and the neural population latent dynamics; data pooled across all primary motor cortex (M1) sessions and monkeys. Note that the correlation profile matches well that obtained when using the individual LFP signals rather than the latent LFP signals (compare with Figure 3—figure supplement 1A). Violin, probability density for one frequency band (n=64); horizontal line, median.
Figure 4 with 1 supplement
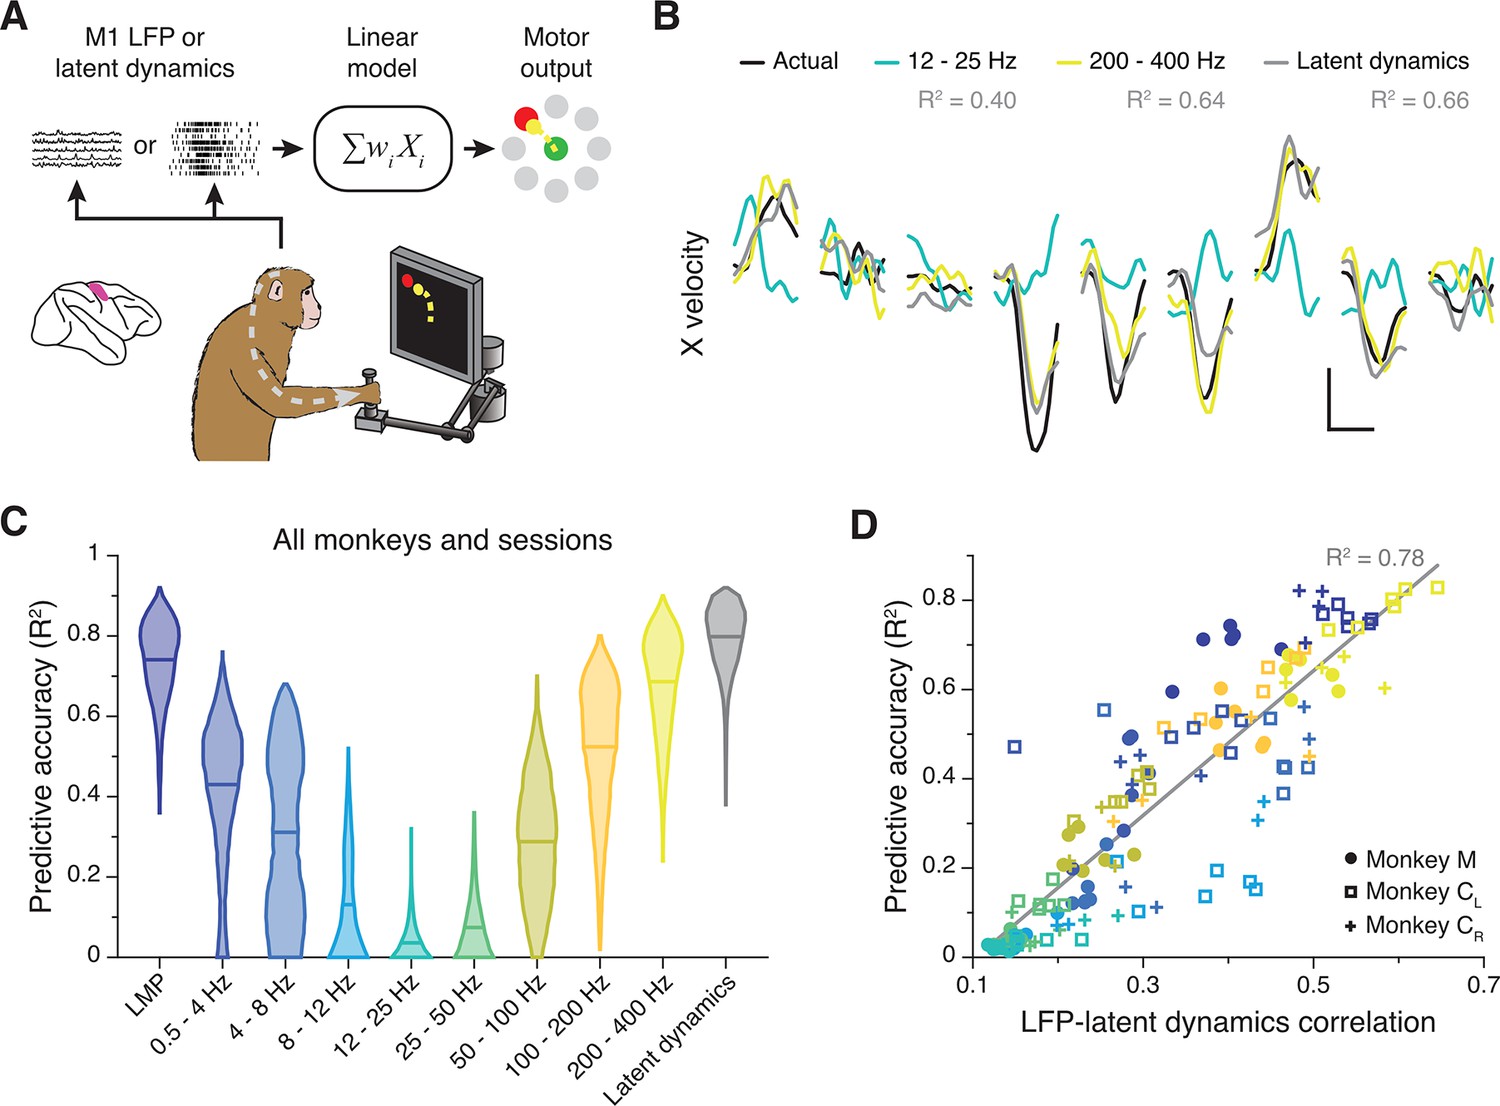
Decoding movement kinematics from primary motor cortex (M1) local field potentials (LFPs).
(A) We trained linear decoders to predict hand velocity in the x and y axes from the either the latent dynamics or the LFP power in different frequency bands. (B) Example x-axis velocity predictions during nine randomly selected trials from one session from Monkey CL. Note the clear difference in predictive accuracy between the example LFP bands (values for each input signal during the example trials shown are indicated in the legend). Scale bars: horizontal, 300 ms; vertical, 10 cm·s–1. (C) Predictive accuracy of each LFP band (colours) and the latent dynamics (grey) pooled across all M1 monkeys and sessions. Violin, probability density for one frequency band (n=1600); horizontal bars, median. (D) Linear relationship between the M1 LFP-latent dynamics correlation coefficients and LFP predictive accuracy. Each marker denotes one LFP band from one session; different monkeys are shown using different markers (legend). Markers are colour-coded as in C. Grey line, linear fit to pooled data and goodness of fit (R2).
Figure 4—figure supplement 1
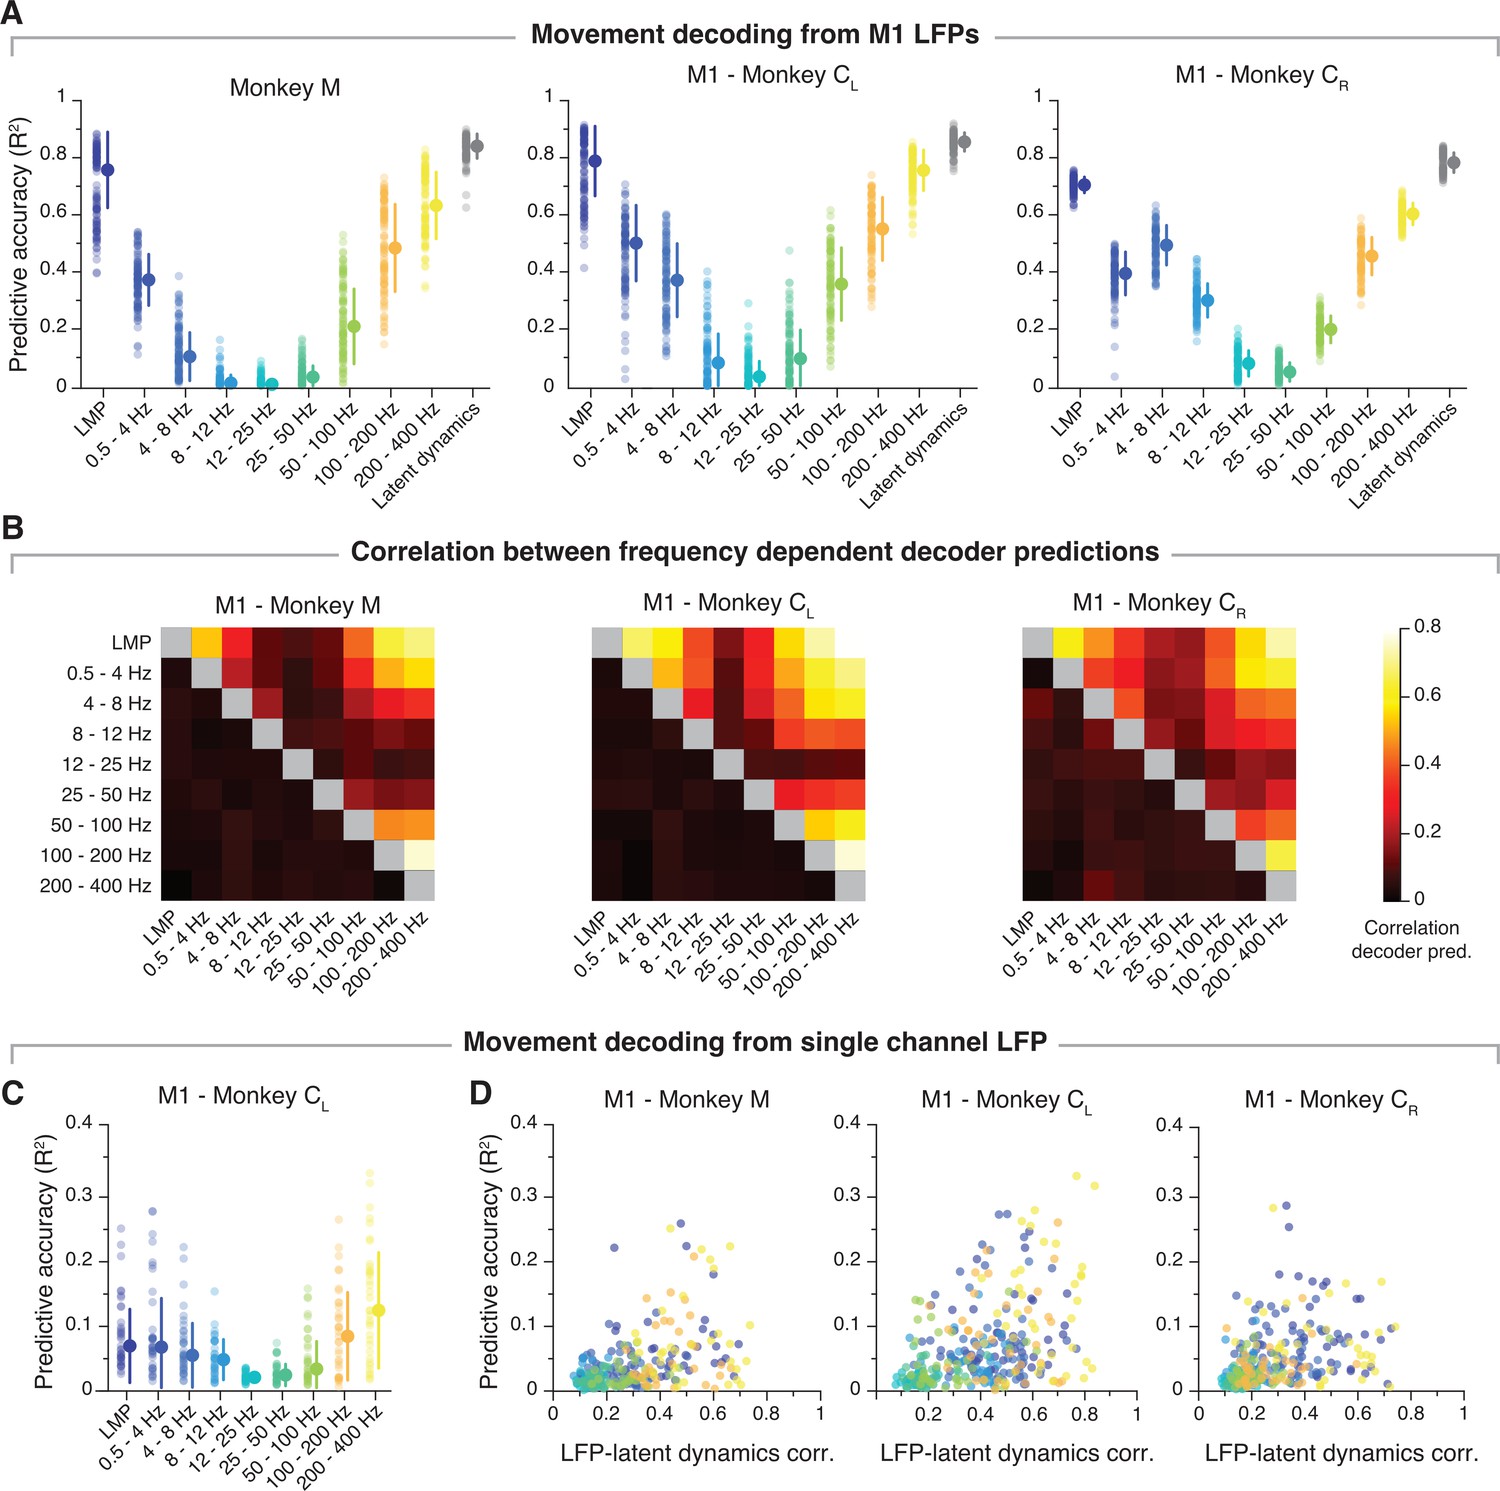
Additional analyses to illustrate movement decoding from primary motor cortex (M1) local field potential (LFP).
(A) Predictive accuracy of each LFP band (colours) and the latent dynamics (grey). Error bars, median ± s.d. (n=100). (B) Correlation between hand velocity predictions obtained from decoders trained on each LFP band. Colour bar, correlation magnitude; upper triangle, mean correlation; bottom triangle, s.e.m. (n=100). (C) Movement decoding from single channel LFP for the same example session from Monkey CL used throughout the paper. Markers, individual channels; error bars, median ± s.d. (n=50). (D) Comparison between the predictive accuracy of band-specific velocity decoders trained on single channel LFP (as in Panel C) and that band’s correlation with the neural population latent dynamics. Note the lack of a very strong association between the two. Data for the same representative sessions from each M1 monkey shown in Figure 3.
Figure 5 with 1 supplement
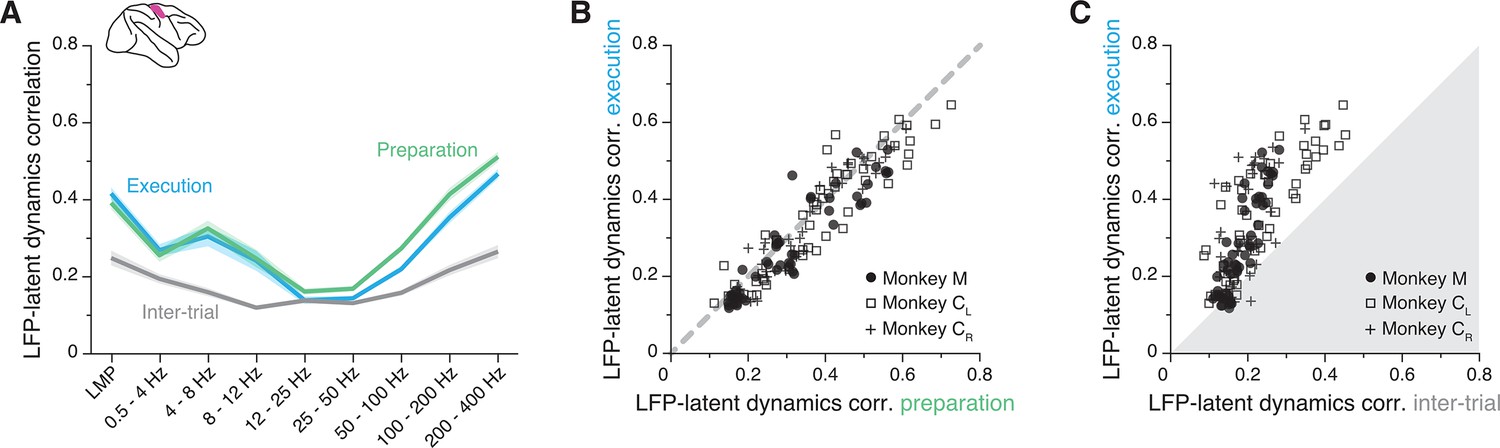
The primary motor cortex (M1) local field potential (LFP)-latent dynamics correlation profile is preserved between movement planning and execution.
(A) LFP-latent dynamics correlation profiles across all sessions from all three M1 monkeys. Line and shaded areas, mean ± s.e.m. across all session medians (n=16). Each epoch is shown in a different colour. (B) Comparison between the LFP-latent dynamics correlations during movement preparation and execution. Each marker shows one frequency band for one session; each monkey is represented using a different marker (legend). Note the very strong similarity between epochs. (C) Comparison between the LFP-latent dynamics correlations during movement execution and the inter-trial period. Data formatted as in B. Note the marked decrease in correlations during the inter-trial period.
Figure 5—figure supplement 1
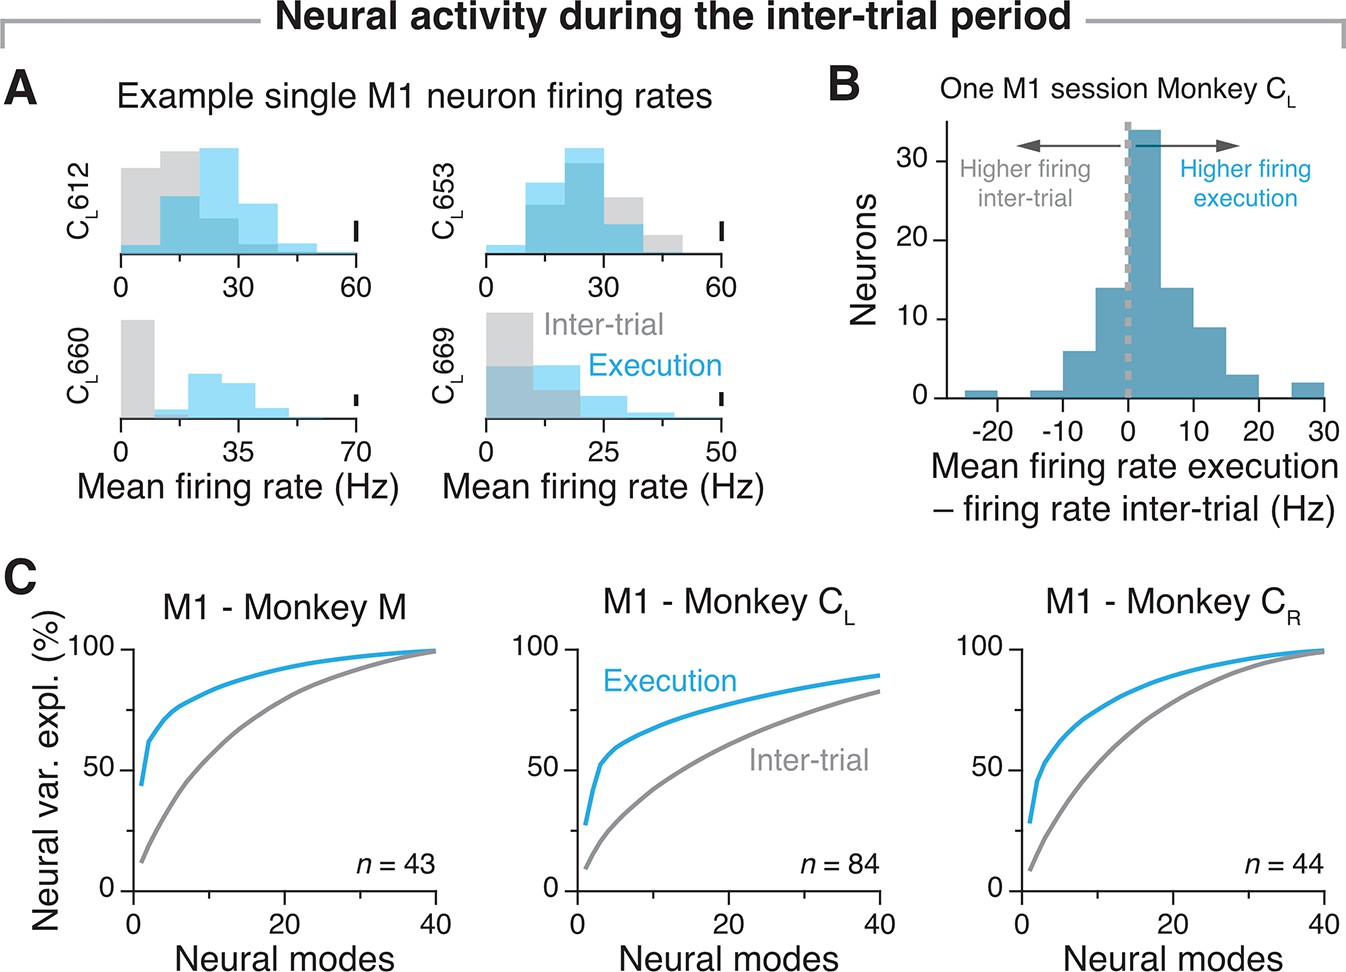
Decrease in primary motor cortex (M1) firing rates and neural correlations when monkeys are not engaged in the task.
(A) Change in mean firing rate between the movement epoch and the inter-trial epoch – when monkeys were not engaged in the task – for four example neurons. Data from the example session from Monkey CL shown throughout the paper. Each data point represents one trial. Scale bar: 20 trials. (B) Difference in average single neuron firing rates between the movement execution and inter-trial epochs for all 84 single neurons recorded during the same session as in A. As expected, the firing rate of M1 neurons tends to increase when animals are moving. (C) Percentage neural variance explained by manifolds with increased dimensionality (a ‘neural mode’ is a principal component defining the neural manifold; see Gallego et al., 2017). During the inter-trial period, neural manifolds with a given dimensionality m explain a considerably lower percentage of total variance than manifolds with the same dimensionality m do during movement. Here, n indicates the number of single neurons used to compute the manifold.
Figure 6 with 2 supplements
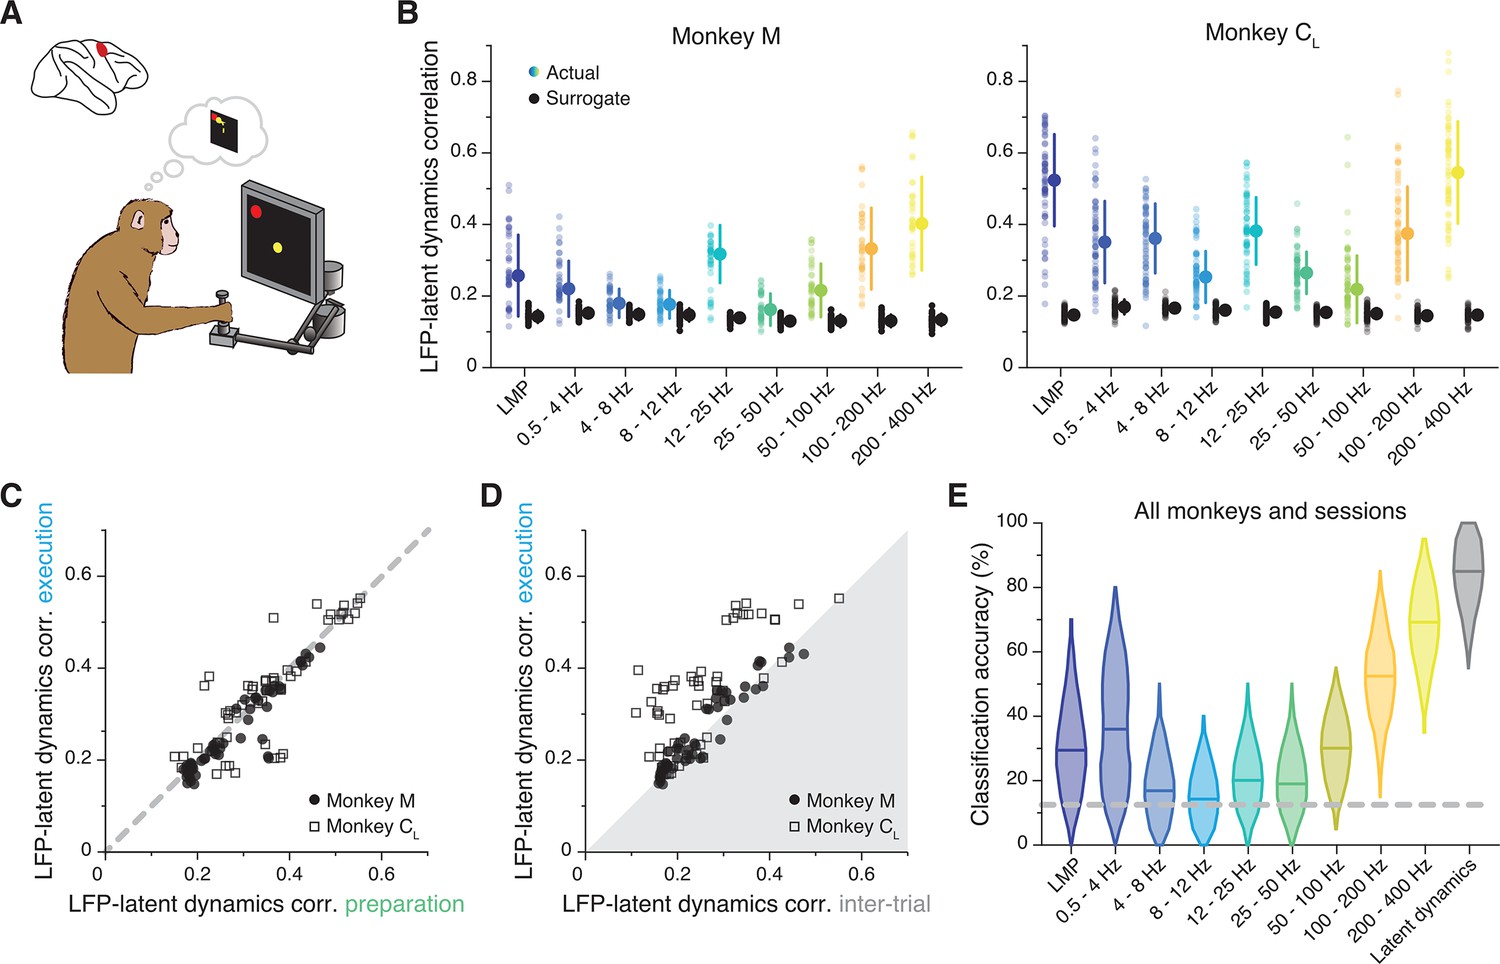
Similarity between dorsal premotor cortex (PMd) latent dynamics and each local field potential (LFP) band during movement preparation.
(A) We focus on the instructed delay period following target presentation and preceding the subsequent go cue. (B) Correlation between each LFP band and the latent dynamics (coloured markers) during one representative session from each PMd monkey. Black markers show the control correlation values obtained after generating surrogate neural activity using tensor maximum entropy (TME). Error bars, median ± s.d. (n=40, 63 for Monkeys M and CL, respectively). (C) Comparison between the LFP-latent dynamics correlations during movement preparation and execution. Each marker shows one frequency band for one session; each monkey is represented using a different marker (legend). Note again the very strong similarity between epochs. (D) Comparison between the LFP-latent dynamics correlations during movement execution and the inter-trial period. Data formatted as in C. (E) Accuracy of classifiers that predict the reach direction based on each LFP band (colours) and the latent dynamics (grey); data pooled across all PMd monkeys and sessions. Violin, probability density for one frequency band (n=600); horizontal bars, median; dashed horizontal line, chance level.
Figure 6—figure supplement 1

Similarity between dorsal premotor cortex (PMd) latent dynamics and each local field potential (LFP) band, and predicting reach direction from PMd LFPs.
(A) Correlation between each LFP band and the latent dynamics; data pooled across all PMd sessions and monkeys. Note that the correlation profile matches well the example sessions in Figure 6. Violin plot, probability density for one frequency band (n=723); horizontal line, median. (B) Accuracy of classifiers that predict the reach direction based on each LFP band (colours) and the latent dynamics (grey) during one representative session from each PMd monkey (same sessions shown in Figure 6). Error bars, median ± s.d. (n=50). (C) The relationship between the PMd LFP-latent dynamics correlation coefficients and LFP classification accuracy is not linear, in contrast to primary motor cortex (M1). Each marker denotes one LFP band from one session; different monkeys are shown using different markers (legend). Markers are colour-coded as in B.
Figure 6—figure supplement 2

Similarity of local field potential (LFP) spectral properties across frequency bands and behavioural epochs.
(A) LFP power spectral density for primary motor cortex (M1) (left), dorsal premotor cortex (PMd) (middle), and area 2 (right). Coloured traces, individual sessions colour-coded by monkey (legend); line and shaded areas, mean ± s.e.m. across all monkeys and sessions (n=16, 12, 8 for M1, PMd, and area 2, respectively). (B) Comparison between the band-specific power spectral density across all pairs of regions (X and Y axes). Data pooled across all sessions. Line and shaded areas, mean ± s.e.m. (n=16, 12, 8 for M1, PMd, and area 2, respectively). Note the strong similarity in LFP spectral content across regions. (C) LFP power variance in each frequency band for M1 (left), PMd (middle), and area 2 (right). Note that the LFP variance is quite similar across regions, and that the bands with highest correlations with the latent dynamics (LMP, 100–200 Hz, 200–400 Hz) are among those with lowest variance. Violin, probability density for one frequency band; horizontal line, median. (D) LFP power spectral density for M1 (left) and PMd (right) during movement preparation and execution (legend). Coloured traces, single sessions from all M1 (left) and PMd (right) sessions from Monkey M and Monkey CL; black traces, mean. (E) Comparison between the band-specific power spectral density across behavioural epochs. Markers, single comparisons colour-coded by frequency band as in Panel B; different markers indicate different monkeys (legend); grey dashed line indicates identity. Note that the LFP spectral properties are very well preserved between movement preparation and execution except for an outlier M1 session from Monkey CL.
Figure 7 with 2 supplements
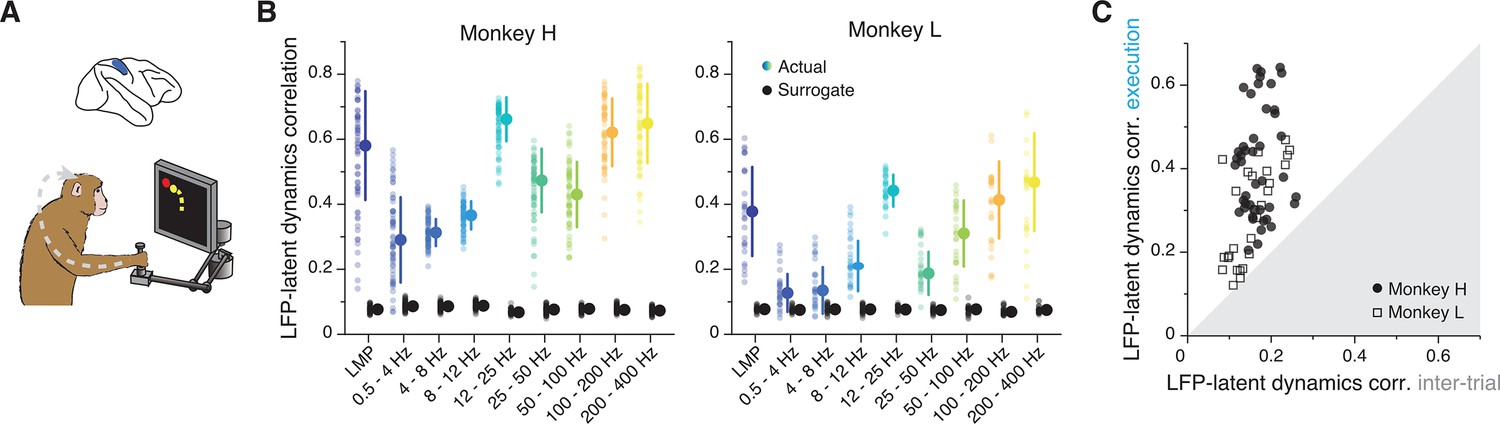
Similarity between area 2 latent dynamics and each local field potential (LFP) band during somatosensory feedback processing.
(A) We focused on movement execution, when area 2 receives proprioceptive input about the state of the limb. (B) Correlation between each LFP band and the latent dynamics (coloured markers) during one representative session from each area 2 monkey; same format as Figures 3B and 6B (n=60, 28 for Monkeys H and L, respectively). Note the clear frequency-dependent relationship between LFP and latent dynamics. Error bars, median ± s.d. (C) Comparison between the LFP-latent dynamics correlations during movement execution and the inter-trial period; same format as Figures 5C and 6D. Note the marked decrease in LFP-latent dynamics correlation during the inter-trial period.
Figure 7—figure supplement 1

Similarity between area 2 latent dynamics and each local field potential (LFP) band, and decoding hand kinematics from area 2 LFPs.
(A) Correlation between each LFP band and the latent dynamics; data pooled across all area 2 sessions and monkeys. Note that the correlation profile matches well the example sessions in Figure 7. Violin plot, probability density for one frequency band (n=305); horizontal line, median. (B) Predictive accuracy of each LFP band (colours) and the latent dynamics (grey) for one representative session from each area 2 monkey (sessions are the same used in Figure 7). Error bars, median ± s.d. (n=100). (C) Predictive accuracy of each LFP band (colours) and the latent dynamics (grey) pooled across all area 2 monkeys and sessions. Same format as A (D). The relationship between the area 2 LFP-latent dynamics correlation coefficients and LFP predictive accuracy is not linear, in contrast to M1, but similar to PMd. Each marker (colour-coded as in A) denotes one LFP band from one session; different monkeys are shown using different markers (legend).
Figure 7—figure supplement 2
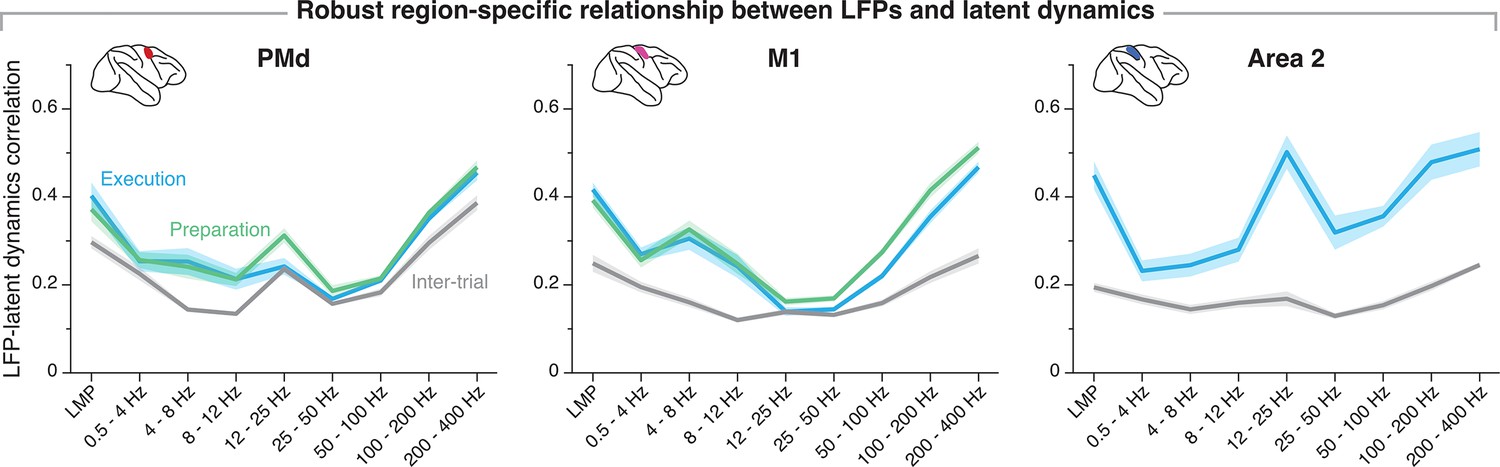
Region-specificity of the local field potential (LFP)-latent dynamics correlation profile.
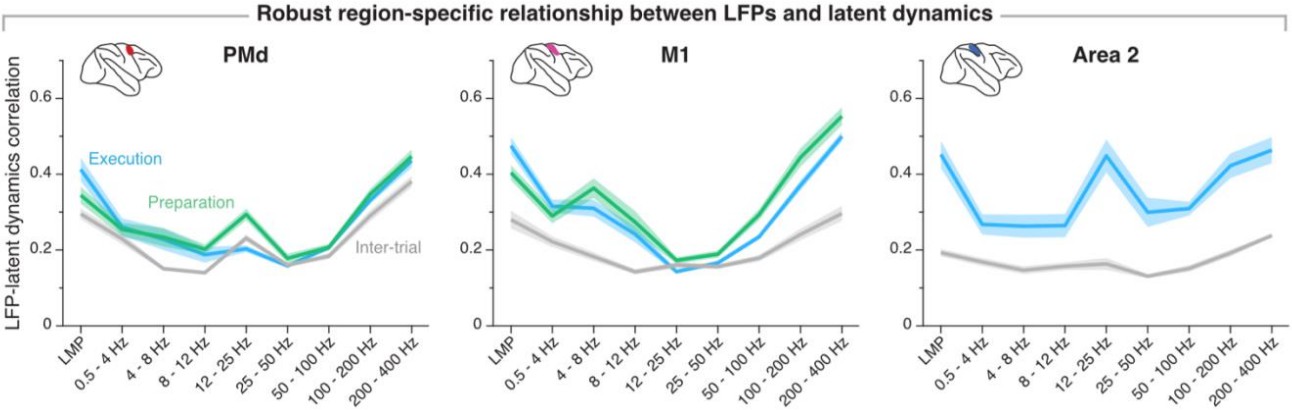
Comparison of the correlation between each LFP band and the latent dynamics across three sensorimotor cortical regions. For both dorsal premotor cortex (PMd) and primary motor cortex (M1), the correlation profiles remain virtually identical between movement preparation and movement execution. For all three regions, the LFP-latent dynamics correlation profiles decrease drastically when monkeys are not engaged in the task. Line and shaded areas, mean ± s.e.m. across all session medians from all monkeys for each area (n=16, 16, 8 for PMd, M1, and area 2, respectively). The M1 panel is reproduced from Figure 5A.
Figure 8 with 1 supplement

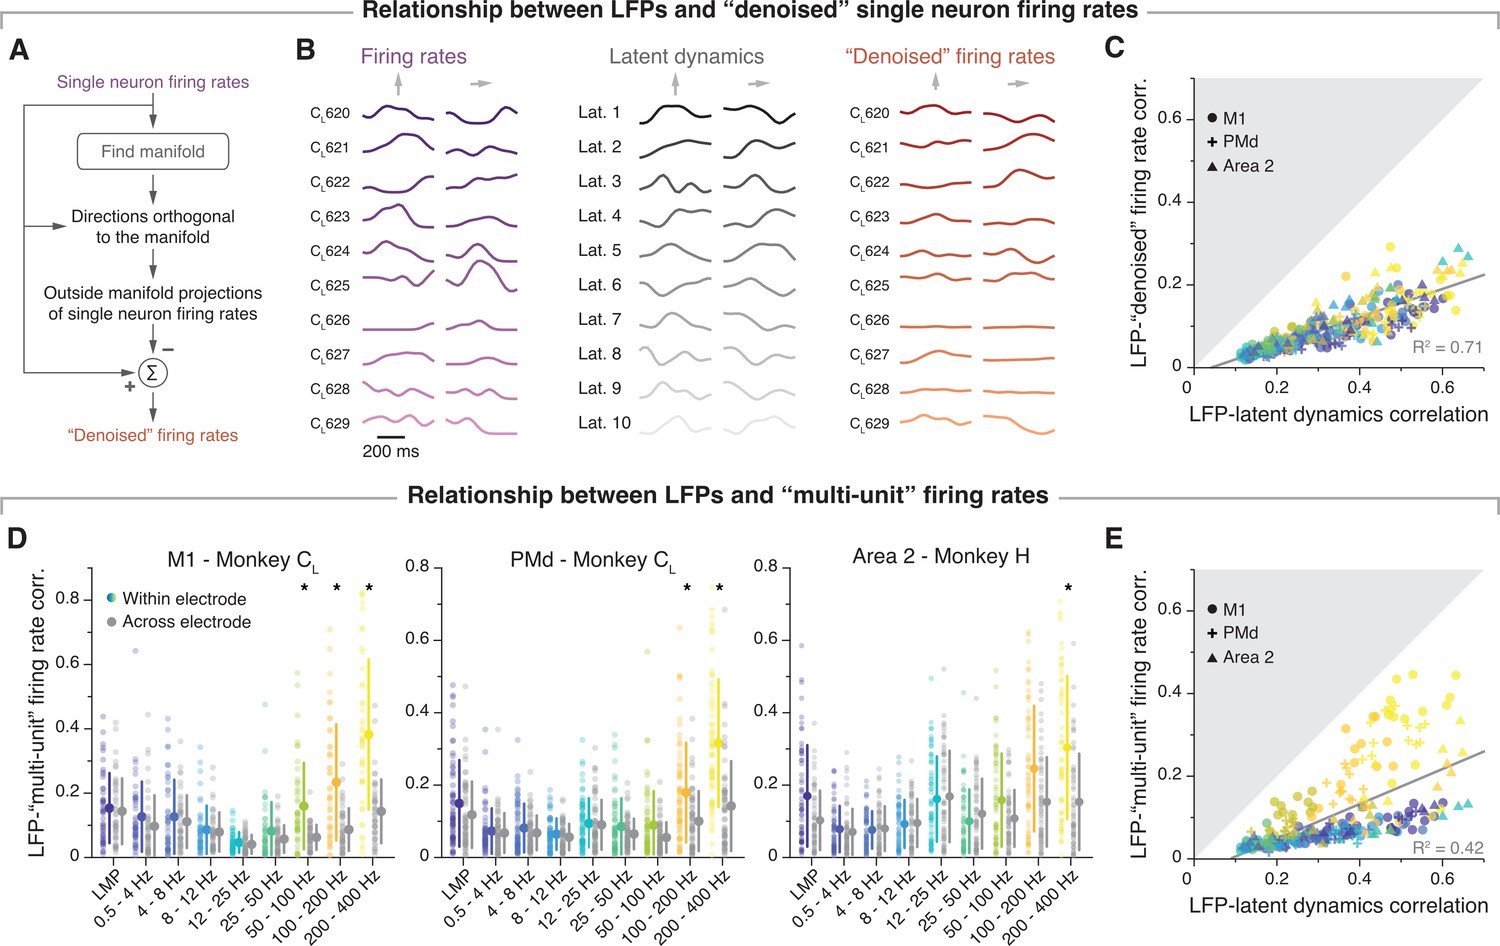
Single neuron features do not account for the local field potential (LFP)-latent dynamics correlations.
(A) Comparison between the correlation of each LFP band with the firing rate of single neurons on the same electrode (coloured), and the activity of single neurons on a different electrode (grey). Each plot shows a representative session from one monkey implanted in each of the three studied regions. Error bars, median ± s.d. (n=50, 63, 60 for the primary motor cortex (M1), dorsal premotor cortex (PMd), and area 2 session, respectively). *p<0.001 two-sided Wilcoxon’s rank sum test. (B) Comparison between the LFP-latent dynamics correlations and the correlation between the LFP and the firing rate of neurons on the same electrode. Data from all sessions and monkeys, shown using region-specific markers that indicate the session median (legend). Markers are colour-coded according to frequency as in A. Grey line, linear fit to pooled data and goodness of fit (R2). Note how the LFP-latent dynamics correlations are much stronger than the correlations between LFPs and the activity of neurons on the same electrode.
Figure 8—figure supplement 1
Additional data: Single neuron features do not account for the local field potential (LFP)-latent dynamics correlations.
(A) To match the smoothness of the single neuron firing rates to that of the latent dynamics, we ‘denoised’ the former by subtracting their projections outside the neural manifold (see Methods). (B) Examples of firing rate ‘denoising’ for two randomly selected trials from one example session from Monkey CL. Each of the three columns shows, from left to right: the single neuron firing rates for 10 randomly selected neurons, the neural population latent dynamics along each of the 10 manifold dimensions, and the denoised firing rates from the same neurons shown on the left. (C) Comparison between the LFP-latent dynamics correlations and the correlation between the LFP and the ‘denoised’ firing rate of neurons on the same electrode. Data formatted as in Figure 8B. (D) Comparison between the correlation of each LFP band with the ‘multi-unit’ activity on the same electrode (coloured), and the ‘multi-unit’ activity on a different electrode (grey). As in previous analysis, ‘multi-units’ were obtained by pooled together all single neurons detected on each electrode. Each plot shows a representative session from one monkey implanted in each of the three studied regions. Error bars, median ± s.d. (n=50, 63, 60 for Monkeys M, CL, and CR, respectively). *p<0.001 two-sided Wilcoxon’s rank sum test. (E) Comparison between the LFP-latent dynamics correlations and the correlation between the LFP and the ‘multi-unit’ activity on the same electrode. Data formatted as in C. Note that neither denoising the firing rates nor pooling the activity of single neurons into multi-units affects the conclusion that the neural population latent dynamics are more strongly related to the LFPs than single neurons (or ‘multi-units’) are.
Author response image 1
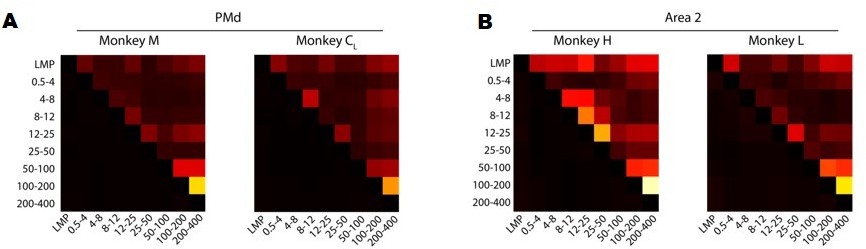
A. Correlation between LFP bands for each of the M1 monkeys. Colour bar, correlation magnitude; upper triangle, mean correlation; bottom triangle, s.e.m. Note that the cross-band correlations are quite low, even for bands that are strongly correlated with the latent dynamics such as the LMP and 200–400 Hz. B. Same as A for Area 2.
Author response image 2
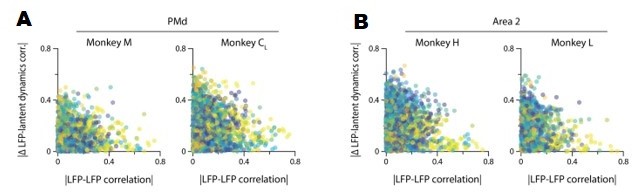
A. The correlation between LFP bands within the same electrode does not predict the correlation of each of these bands with the neural population latent dynamics. Legend, pair of bands being compared. Data for all sessions from each of the three M1 monkeys. B. Same as A for Area 2.
Author response image 3

A. Correlation between hand velocity predictions obtained from decoders trained on each LFP band. Colour bar, correlation magnitude; upper triangle, mean correlation; bottom triangle, s.e.m. B. Same as A for Area 2.
Author response image 4

Stability of the LFP-latent dynamics correlation across different sessions from each monkey.
Coloured squares represent the mean value across all LFP channels for each frequency band. Note that the frequency dependent correlations are very similar across sessions; the only noticeable change is a shift in magnitude between days seven and 100 for Monkey CR. Same as for Area 2.
Author response image 5
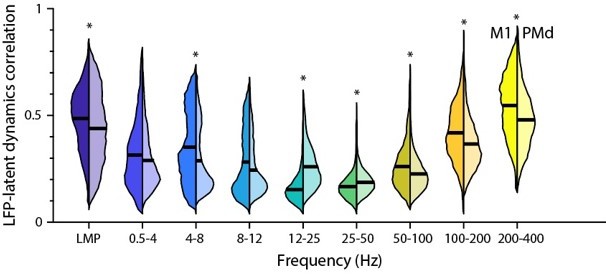
Comparison between the M1 and PMd frequency-dependent LFP-latent dynamics correlations.
The plot shows the correlation between each LFP band and the latent dynamics; data pooled across all sessions and monkeys for each region. Violin: probability density for one frequency band; left distribution shows M1 and right distribution shows PMd; horizonal line, median. * P<0.001 two-sided Wilcoxon’s rank sum test.
Author response image 6
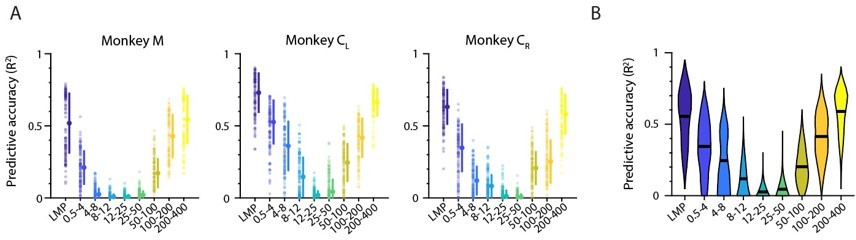
Decoding movement kinematics from M1 “latent LFP signals”.
A. Accuracy of each LFP band (colours) during an example representative session from Monkey CL. Markers: individual folds during cross-validation; error bars, median ± s.d. B. Same as A, with data pooled across all M1 monkeys and sessions. Violin, probability density for one frequency band; horizontal bars, median.
Author response image 7
A. Cumulative cross-band LFP variance explained as function of the numbers of dimensions considered. Note that as few as ten components explain most of the variance. Each plot shows the same example session from each M1 monkey shown throughout the paper. B. Canonical correlation between the ten-dimensional neural population latent dynamics and the “latent LFP bands * channels signals” as function of the number of the cross-band LFP dimensions considered. Mean (trace) ± s.d. (shaded surface) across the first four CCs for each crossband LFP manifold dimension.
Author response image 8
Region-specificity of the LFP-latent dynamics correlation profile when using non-overlapping “behavioural windows” of equal length.
Line and shaded areas, mean ± s.e.m. across all session medians from all monkeys for each area (n = 16, 16, 8 for PMd, M1, and area 2, respectively). Note the striking similarity with Figure 7–supplement 2 in the paper.
Additional files
Download links
A two-part list of links to download the article, or parts of the article, in various formats.
Downloads (link to download the article as PDF)
Open citations (links to open the citations from this article in various online reference manager services)
Cite this article (links to download the citations from this article in formats compatible with various reference manager tools)
Local field potentials reflect cortical population dynamics in a region-specific and frequency-dependent manner
eLife 11:e73155.
https://doi.org/10.7554/eLife.73155


