Telencephalic outputs from the medial entorhinal cortex are copied directly to the hippocampus
- University of Edinburgh, Centre for Discovery Brain Sciences, United Kingdom
- Simons Initiative for the Developing Brain, University of Edinburgh, United Kingdom
Figures
Figure 1 with 2 supplements

L5a but not layer 5b of the medial entorhinal cortex (MEC) projects to the hippocampus.
(A) Schematic showing the injection site of a retrograde adeno-associated viral vector (AAV) in the intermediate hippocampus (light grey) of wild-type mice. The black outline in the horizontal plane roughly corresponds to the dorso-ventral position of the horizontal section shown in B. Corresponding injection site image is shown in Figure 1—figure supplement 1A. (B) Immunostained brain section in the horizontal plane showing retrogradely labelled neurons in L3 and L5a of the MEC. ETS variant transcription factor-1 (Etv1) expression marks L5a (scale bar: 250 μm). Inset: high-magnification image of boxed region in left panel showing co-expression of green fluorescent protein (GFP) and Etv1 (scale bar: 50 μm). PaS, parasubiculum; P, posterior; A, anterior; M, medial; L, lateral. (C) Schematic showing the injection site of an AAV in the deep MEC (dark grey) of Rbp4-Cre mice for Cre-dependent expression of GFP. The black outline in the horizontal plane roughly corresponds to the dorso-ventral position of the slice shown in D. (D) Entorhinal area on an immunostained brain section in the horizontal plane showing the overlapping expression of GFP with Etv1 (scale bar: 250 μm). Inset: high magnification of boxed region in middle panel showing GFP and Etv1 expression confined mainly to L5a in MEC (scale bar: 100 μm).
Figure 1—figure supplement 1
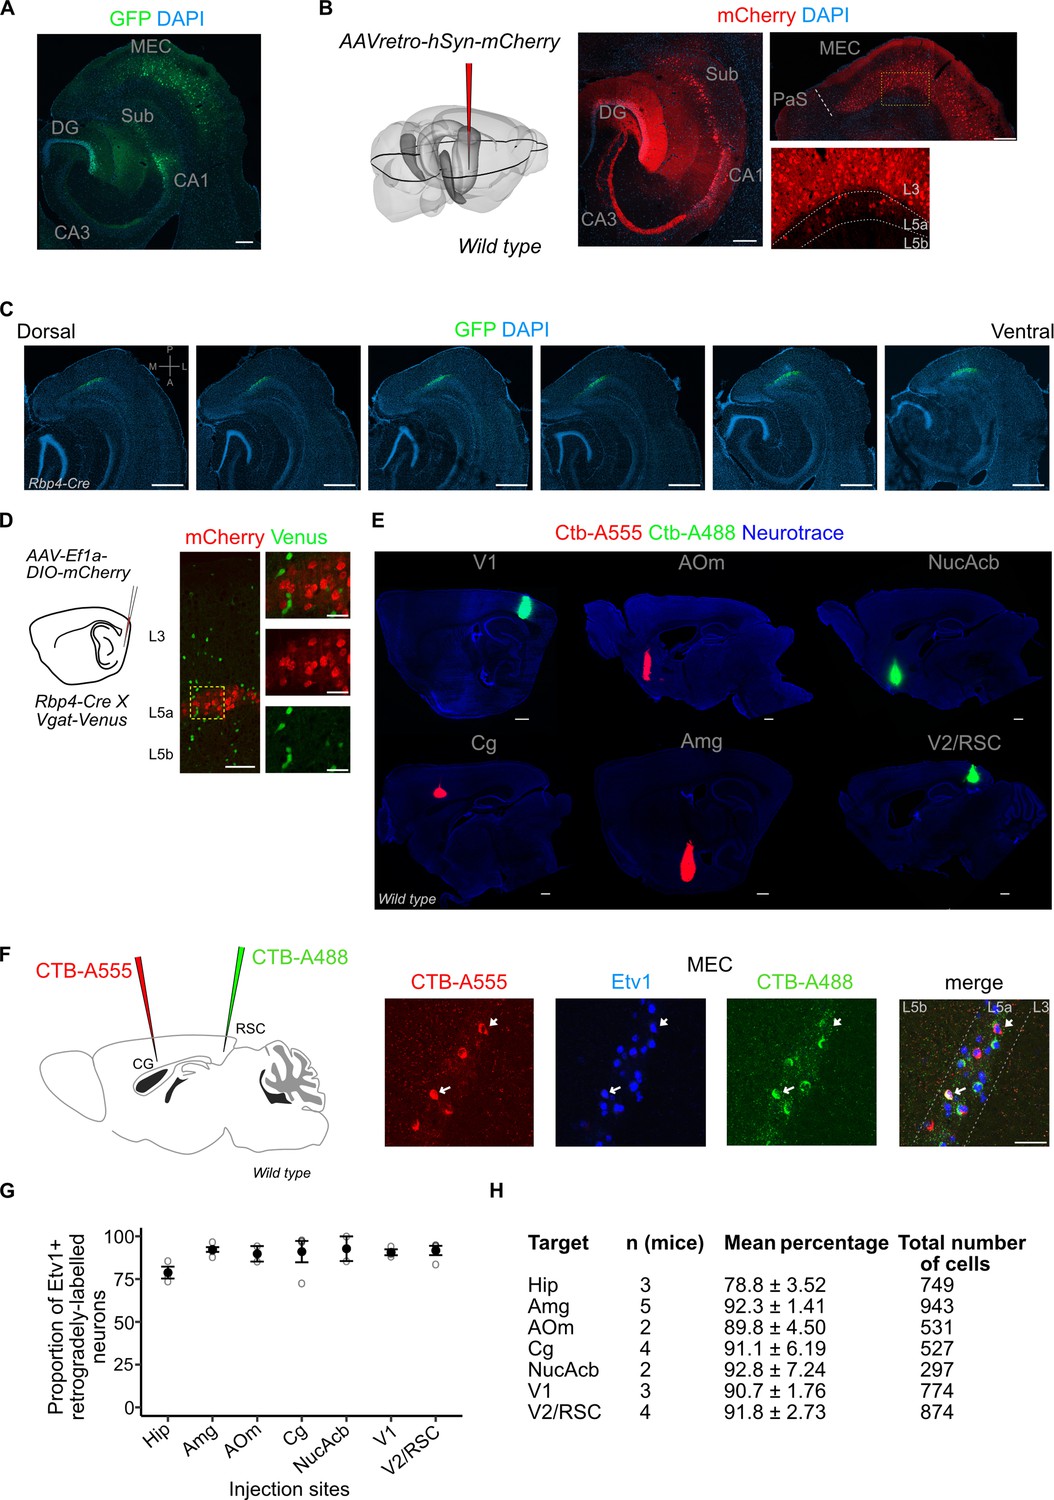
Injection site images, quantification of co-localization between retrograde markers and ETS variant transcription factor-1 (Etv1).
(A) Immunostained horizontal sections showing the injection site in the intermediate hippocampus of a retrograde adeno-associated viral vector (AAV) virus. L3 and L5a cells in the medial entorhinal cortex (MEC) were retrogradely labelled via green fluorescent protein (GFP) expression driven by the CAG (CMV early enhancer/chicken β actin) promoter (scale bar: 200 μm). (B) Results in (A) were replicated with an AAV virus that enables retrograde labelling of cells via expression of mCherry driven by the human synapsin (hSyn) promoter (scale bar: 200 μm). (C) Immunostained brain sections in horizontal plane from a single brain showing the dorso-ventral spread of virus-mediated reporter gene expression in the Rbp4-Cre mice (scale bar: 500 μm). (D) Schemmatic of a Cre-dependent mCherry expressing virus injection in the deep MEC of Rbp4-Cre X Vgat-Venus mouse line (left). Immunostained brain sections in the MEC showing absence of overlap between mCherry and Venus which marks GABAergic interneurons (right). Scale bar: 100 μm, inset scale bar: 30 μm. (E) Immunostained brain sections in the sagittal plane showing injection sites of fluorophore-coupled CTB (Cholera toxin beta subunit; scale bar: 500 μm). (F) Schematic of a two-colour retrograde dye injection in the cingulate and retrosplenial cortices of wild-type mice (left). Immunostaining in the MEC shows overlap between Etv1 expression and retrograde dyes (right; scale bar: 50 μm) (G, H) Quantification of overlap between retrograde labelling from cortical target areas and Etv1 expression in L5a of the MEC. The number of mice, mean proportion, and total cells counted for each area are shown in the table. Hip, hippocampus; Amg, amygdala; AOm, medial anterior olfactory area; Cg, cingulate area; NucAcb, nucleus accumbens; V1, primary visual cortex; V2, secondary visual areas; RSC, retrosplenial cortex.
Figure 1—figure supplement 2
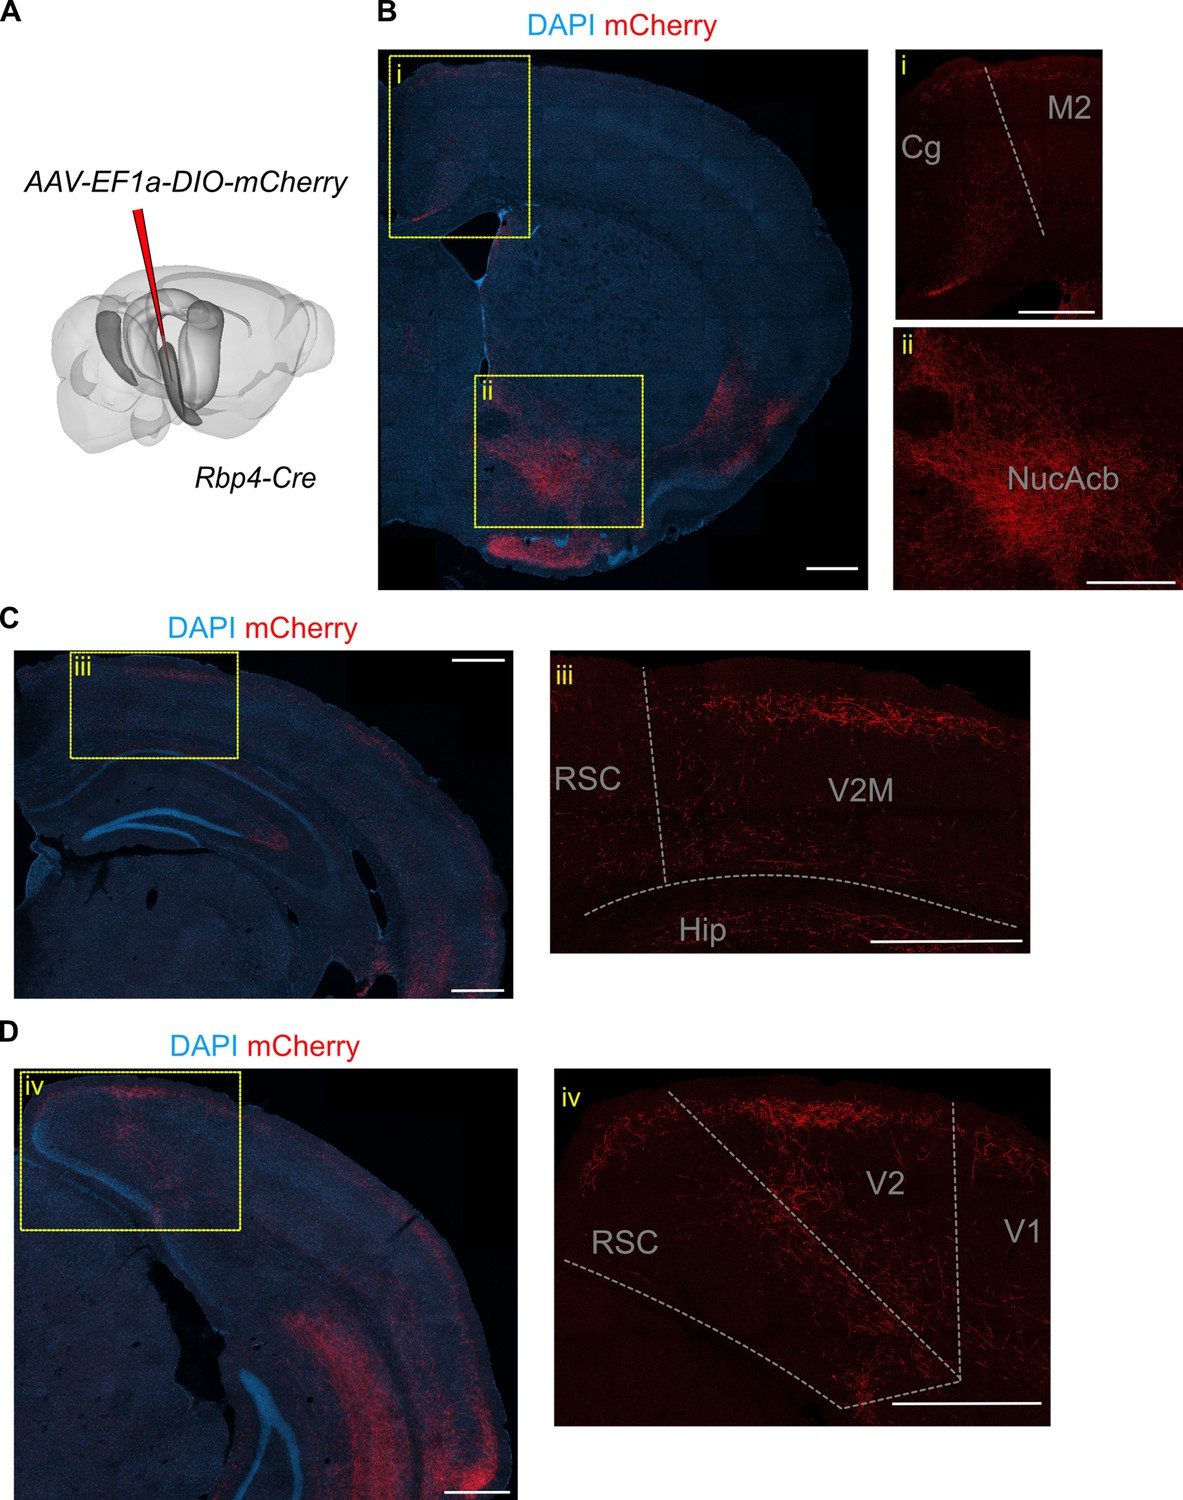
L5a neurons of the medial entorhinal cortex (MEC) innervate neocortical and subcortical areas.
(A) Schematic showing the injection site of a Cre-dependent virus in the deep MEC of Rbp4-Cre mice. (B) Confocal image of a coronal brain slice showing axons originating from entorhinal L5a in the anterior telencephalon. Insets show higher magnification images of boxed areas. (C) Confocal image of a coronal brain slice showing axons originating from entorhinal L5a in the mid-telencephalon. Inset shows higher magnification image of boxed area. (D) Confocal image of a coronal brain slice showing axons originating from entorhinal L5a in the posterior telencephalon. Inset shows higher magnification image of boxed area. Cg, cingulate area; M2, secondary motor area; V1, primary visual cortex; V2M, secondary visual area (medial); RSC, retrosplenial cortex; Hip, hippocampus; NucAcb, nucleus accumbens.
Figure 2 with 1 supplement
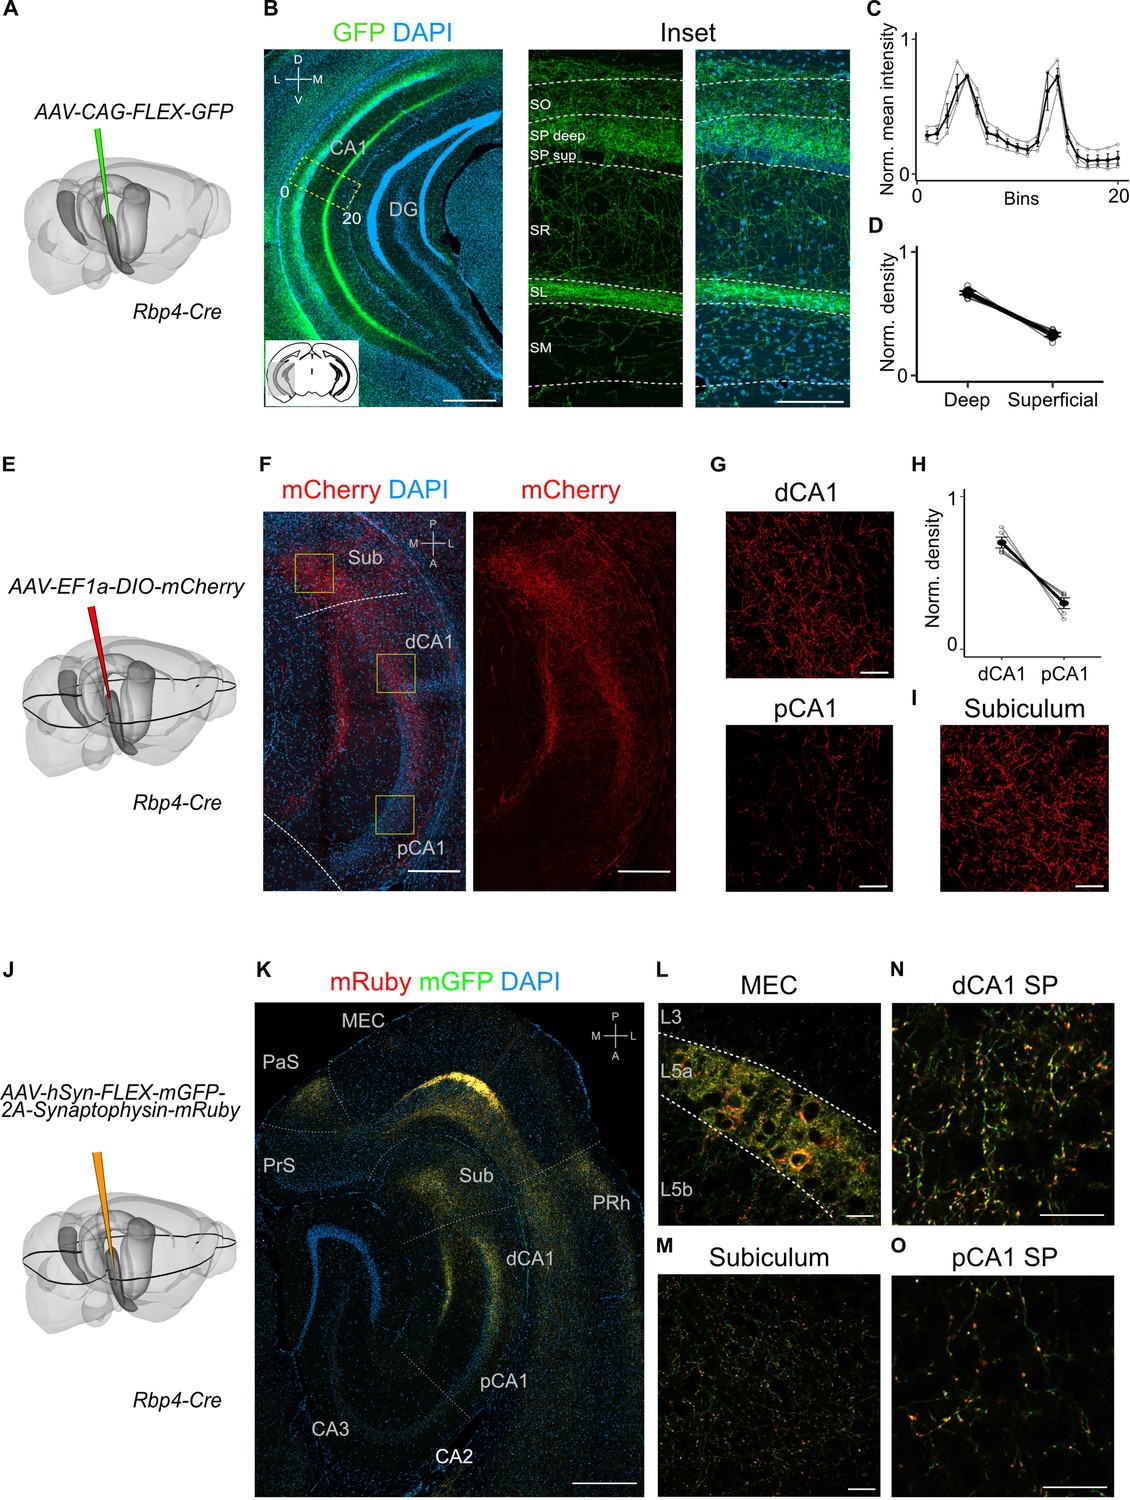
Projections to CA1 of L5a neurons of the medial entorhinal cortex (MEC) have distinct topography.
(A) Schematic showing the injection strategy of a Cre-dependent virus in the deep MEC of Rbp4-Cre mice. (B) Immunostained coronal brain section showing the distribution of axons of MEC L5a cells in CA1 (scale bar: 500 μm). Inset: high-magnification image of boxed region in left panel (scale bar: 100 μm). Bottom-left schematic indicates the antero-posterior position of the slice. Corresponding injection site image is shown in Figure 2—figure supplement 1A. SO, stratum oriens; SP, stratum pyramidale; SR, stratum radiatum; SL, stratum lacunosum; SM, stratum moleculare; D, dorsal; V, ventral; M, medial; L, lateral. (C) Quantification of fluorescence intensity of green fluorescent protein (GFP) across the layers of CA1. The area between 0 and 20 in (B) was divided into 20 equally sized bins, and the mean fluorescence intensity was calculated for each bin. Values shown are normalized mean fluorescence intensity values (n = 6 mice, 2 sections per brain). (D) Normalized mean fluorescence density values in deep versus superficial SP (n = 6 mice). Within SP, axon density in deep SP was significantly higher than density in superficial SP (paired one-tailed Wilcoxon signed rank test, p = 0.0156, n = 6). (E) Schematic showing the injection strategy of a Cre-dependent virus in the deep MEC of Rbp4-Cre mice. The black outline in the horizontal plane roughly corresponds to the dorso-ventral position of the horizontal slice shown in (F).( F) Immunostaining of a horizontal brain section showing the distribution of axons of MEC L5a cells in the subiculum (Sub), distal CA1 (dCA1), and proximal CA1 (pCA1; scale bar: 200 μm). Corresponding injection site image is shown in Figure 2—figure supplement 1B. (G) High-magnification images of the pyramidal cell layer in distal (top) and proximal (bottom) CA1 showing axonal labelling (scale bar: 20 μm). (H) Normalized mean fluorescence density values in distal versus proximal CA1 (n = 5 mice). (I) High-magnification image of the subiculum showing axonal labelling (scale bar: 20 μm). (J) Schematic showing the injection strategy of an adeno-associated viral vector (AAV) for Cre-dependent expression of a membrane-bound form of GFP and a synaptophysin–mRuby conjugate in L5a of the MEC in the Rbp4-Cre mice. The black outline in the horizontal plane roughly corresponds to the dorso-ventral position of the slice shown in (K). (K) Immunostained brain section in the horizontal plane showing the distribution of axons (green) and synaptic terminals (red) in the hippocampus as well as the parasubiculum (PaS) and perirhinal cortex (PRh). Injection site in the MEC is distinguishable by the strong fluorescent labelling of L5a cell bodies (scale bar: 400 μm). (L) High-magnification image of the injection site in the MEC showing cell membrane and synaptic labelling specifically in L5a (scale bar: 20 μm). (M) High-magnification image of the subiculum showing axonal and synaptic labelling (scale bar: 20 μm). High-magnification images of the pyramidal cell layer in distal (N) and proximal (O) CA1 showing axonal and synaptic labelling (scale bar: 20 μm).
Figure 2—figure supplement 1
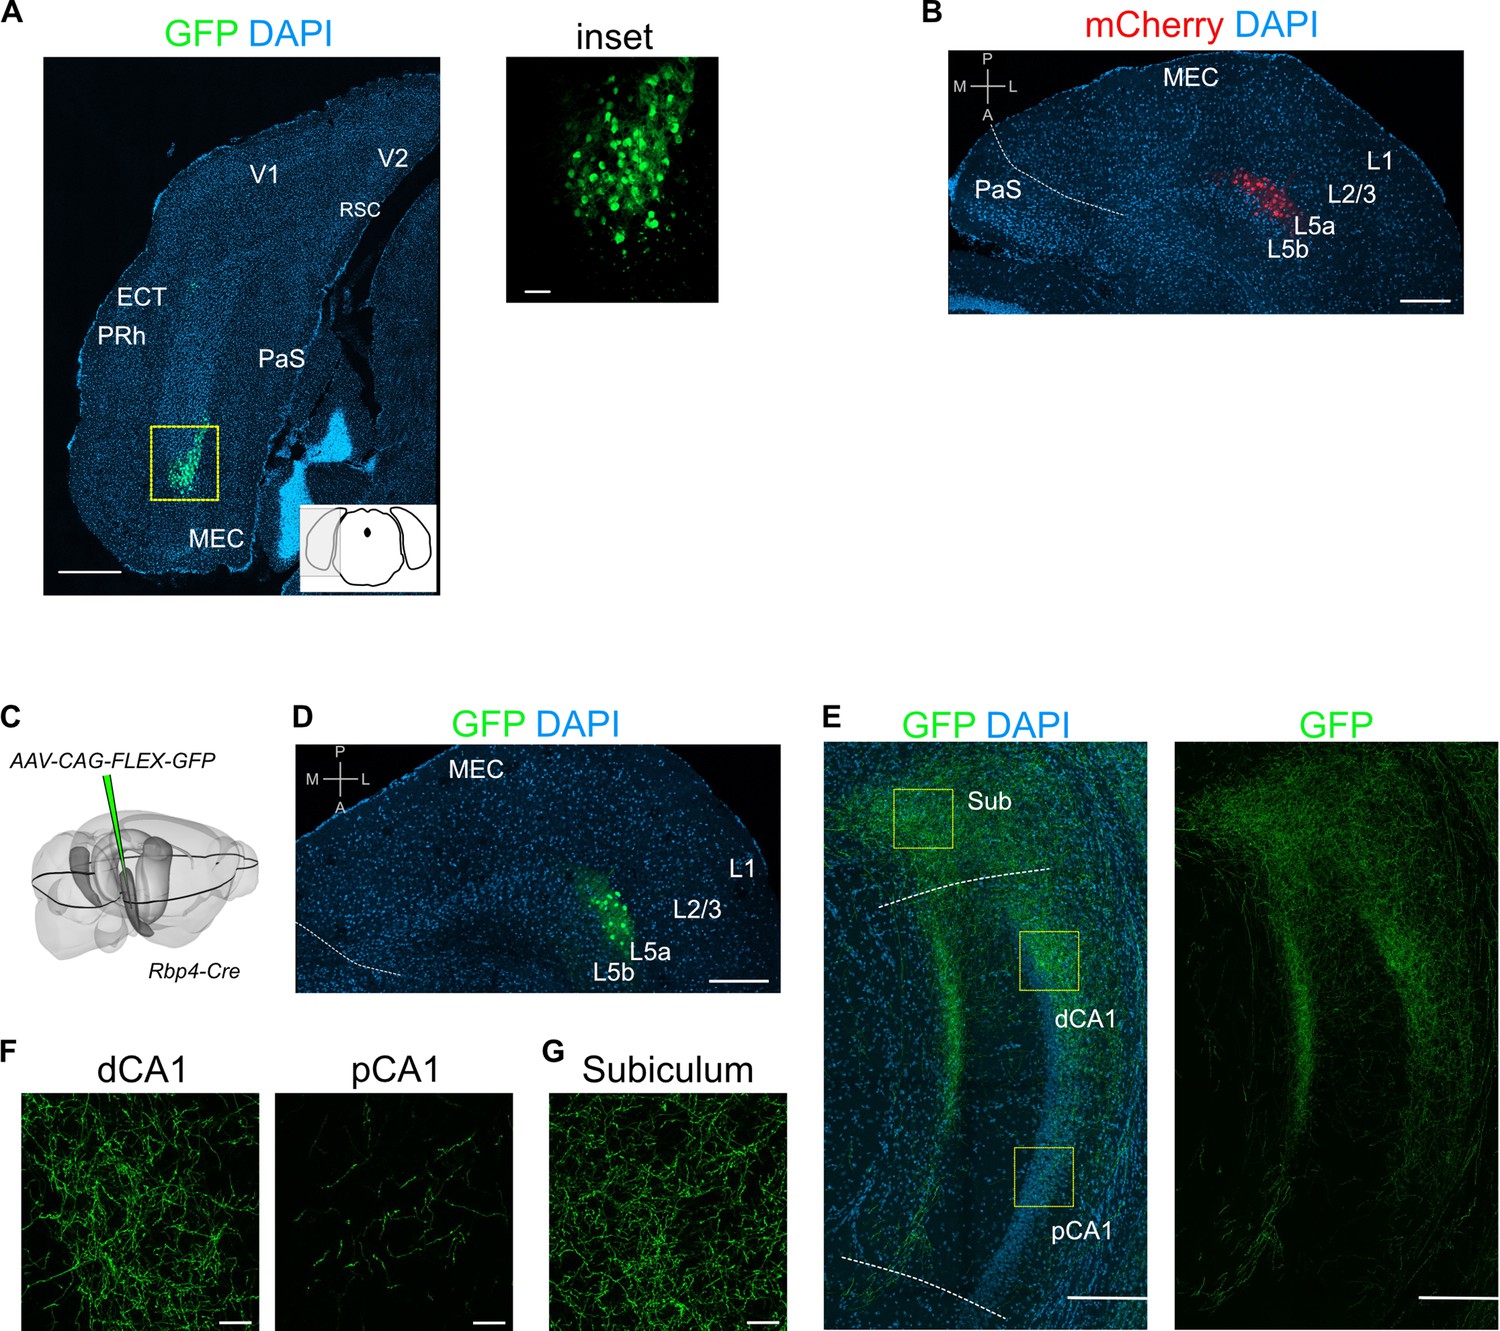
Injection site images and additional examples of axon labelling in CA1.
(A) Immunostained brain section in the coronal plane showing cell body labelling at the injection site in medial entorhinal cortex (MEC; scale bar: 500 μm). Inset shows a higher magnification view of the boxed area (scale bar: 50 μm). Schematic of a coronal brain section indicates the antero-posterior position of the section. (B) Immunostained brain section in the horizontal plane showing cell body labelling at the injection site in MEC (scale bar: 200 μm). (C) Schematic showing the injection site of a Cre-dependent virus in the deep MEC of Rbp4-Cre mice. The black outline in the horizontal plane roughly corresponds to the dorso-ventral position of the slice shown in (D). (D) Immunostained brain section in the horizontal plane showing cell body labelling at the injection site in MEC (scale bar: 200 μm). (E) Immunostained brain section in the horizontal plane showing the distribution of axons of MEC L5a cells in the subiculum (Sub), distal CA1 (dCA1), and proximal CA1 (pCA1) (scale bar: 200 μm). (F) High-magnification images of the pyramidal cell layer in dCA1 and pCA1 showing axonal and synaptic labelling (scale bar: 20 μm). (G) High-magnification image of the subiculum showing axonal labelling (scale bar: 20 μm). Prh, perirhinal cortex; ECT, ectorhinal cortex; V1, primary visual cortex; V2, secondary visual cortex; RSC, retrosplenial cortex; PaS, parasubiculum.
Figure 3 with 1 supplement
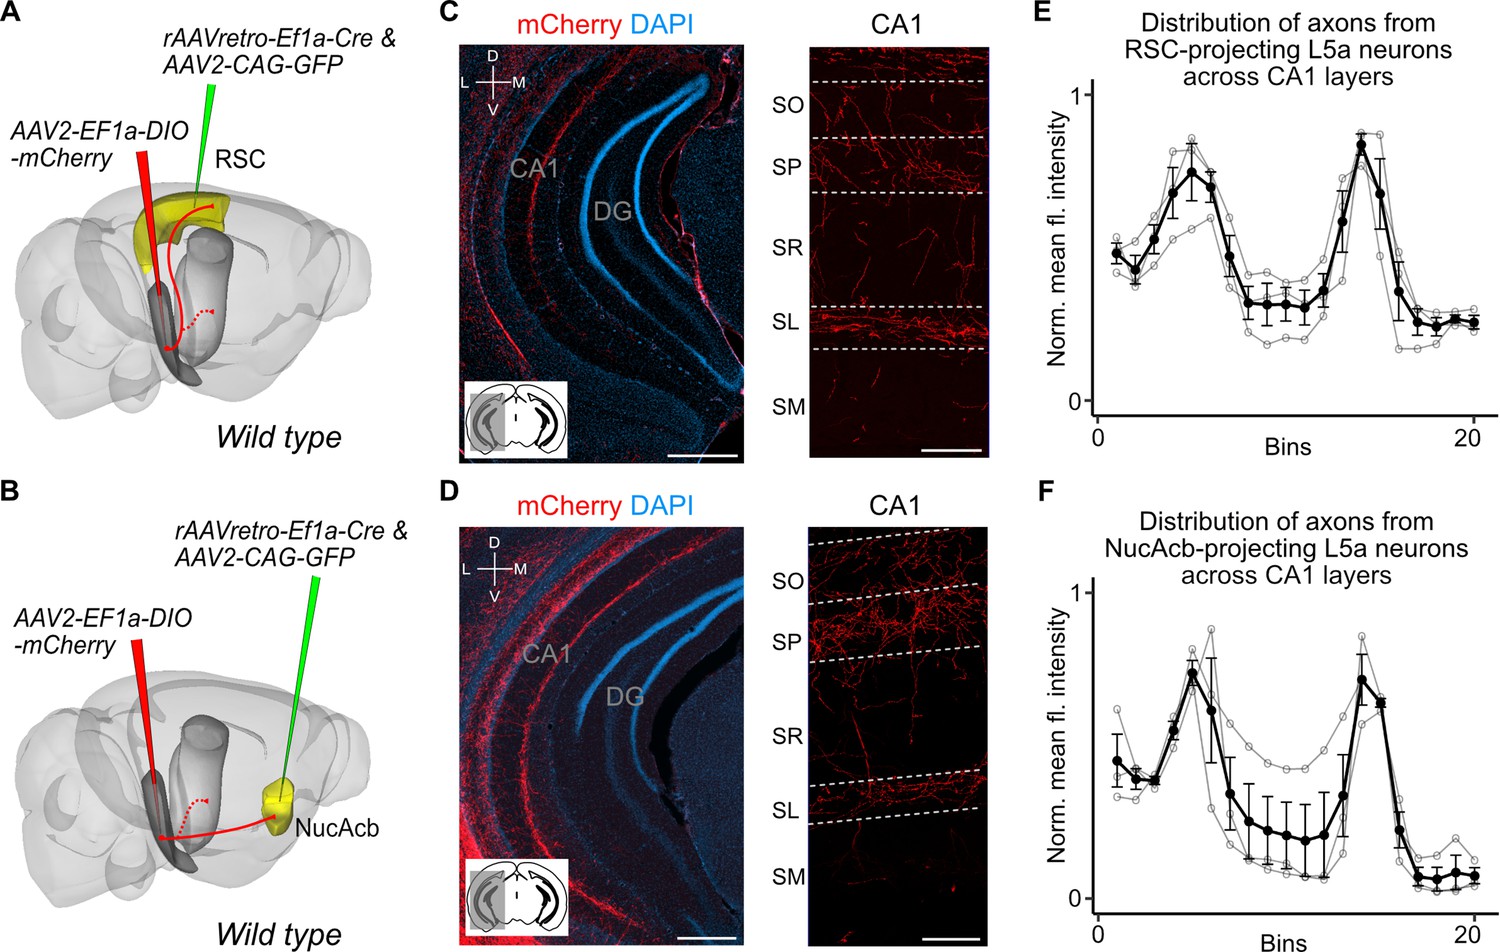
Retrosplenial cortex (RSC) and nucleus accumbens (NucAcb) outputs of the medial entorhinal cortex (MEC) are copied to CA1.
Experimental strategy. In wild-type mice, a retrogradely transported virus expressing Cre was injected in either the RSC (A) or NucAcb (B), while a Cre-dependent reporter virus was injected in the deep MEC. Hippocampal axon collaterals of RSC- (C) or NucAcb-projecting MEC neurons (D; scale bar: 250 μm). Insets: high-magnification images from CA1 showing distribution of axons across CA1 layers (scale bar: 100 μm). Bottom-left schematic indicates the antero-posterior position of the slice. Corresponding injection site images are shown in Figure 3—figure supplement 1A, B. (E, F) Quantification of mean fluorescence intensity across the layers of CA1 when only RSC- (E) or NucAcb-projecting (F) MEC neurons were labelled (n = 3 mice for each group). Axon topography is similar to when L5a neurons are marked globally in the Rbp4-Cre mice (Figure 2C).
Figure 3—figure supplement 1
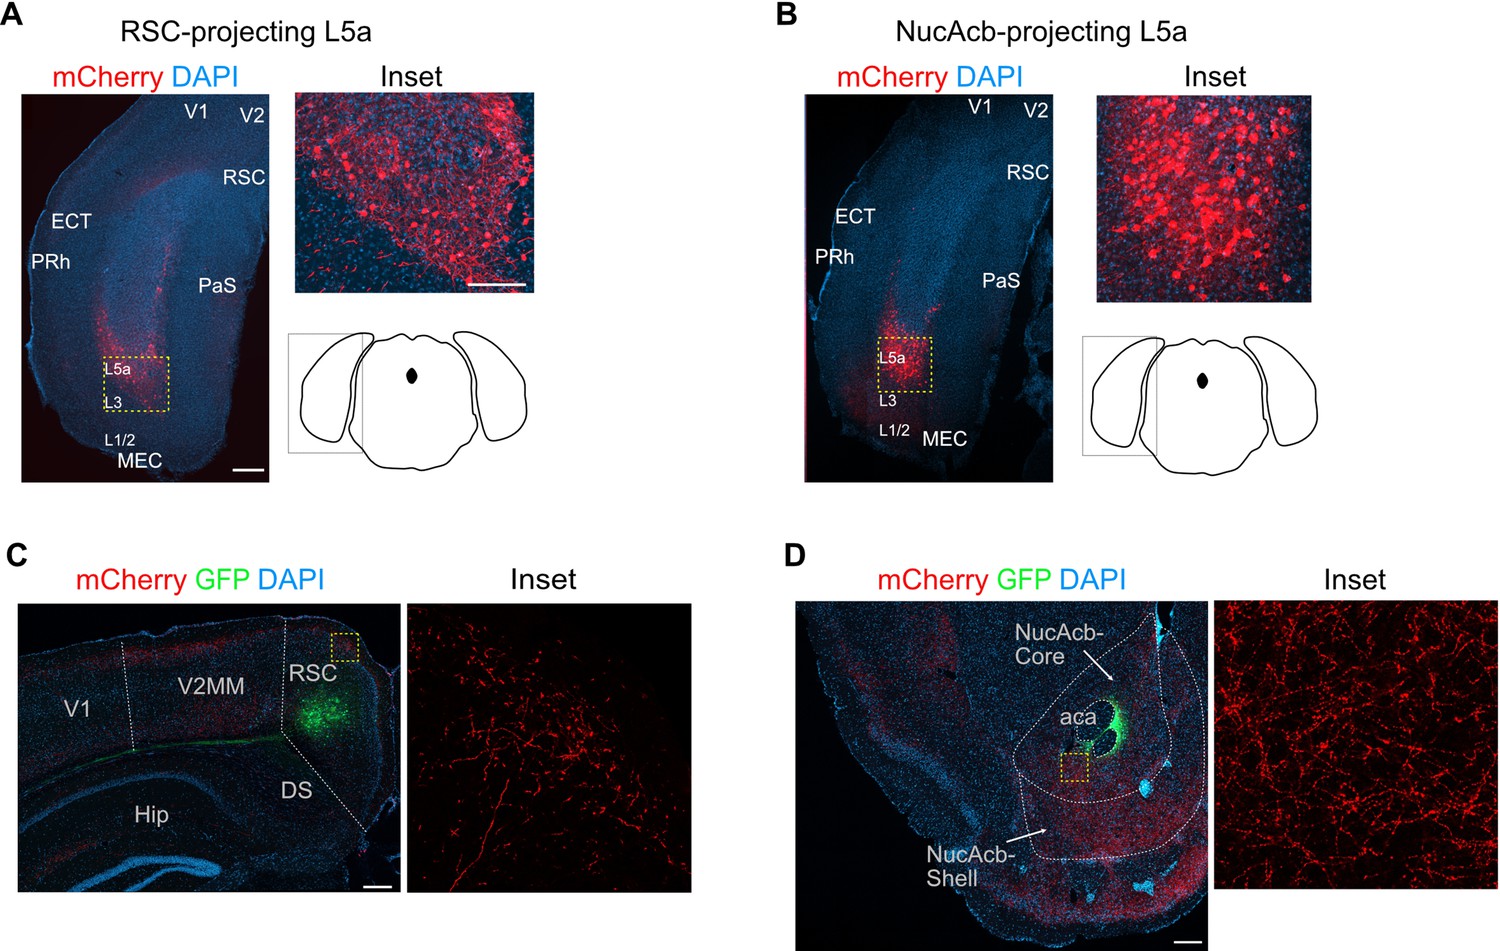
Combinatorial viral strategy effectively labels L5a cells of the medial entorhinal cortex (MEC) and their cortical projections.
(A, B) Coronal brain sections showing labelled neurons in MEC with the combinatorial viral strategy (scale bar: 500 μm). Note that the conventional layer organization is distorted in coronal sections due to the curved geometry of the MEC. For comparison with results of the same experiment in sagittal plane please refer to Sürmeli et al., 2015. Inset: high-magnification confocal image of boxed region in left panel showing cell bodies in MEC expressing mCherry. Schematic of a coronal brain section indicates the antero-posterior position of the sections. (C, D) Coronal brain sections showing green fluorescent protein (GFP) expression and mCherry-labelled axon terminals at the injection sites in retrosplenial cortex (C) and nucleus accumbens (D) (scale bar: 500 μm). Inset: high magnification of boxed region in left panel. RSC, retrosplenial cortex; NucAcb, nucleus accumbens; DS, dorsal subiculum; aca, anterior commissure anterior part; V2, secondary visual area medial part.
Figure 4 with 1 supplement

Telencephalic outputs are widely copied onto the hippocampus.
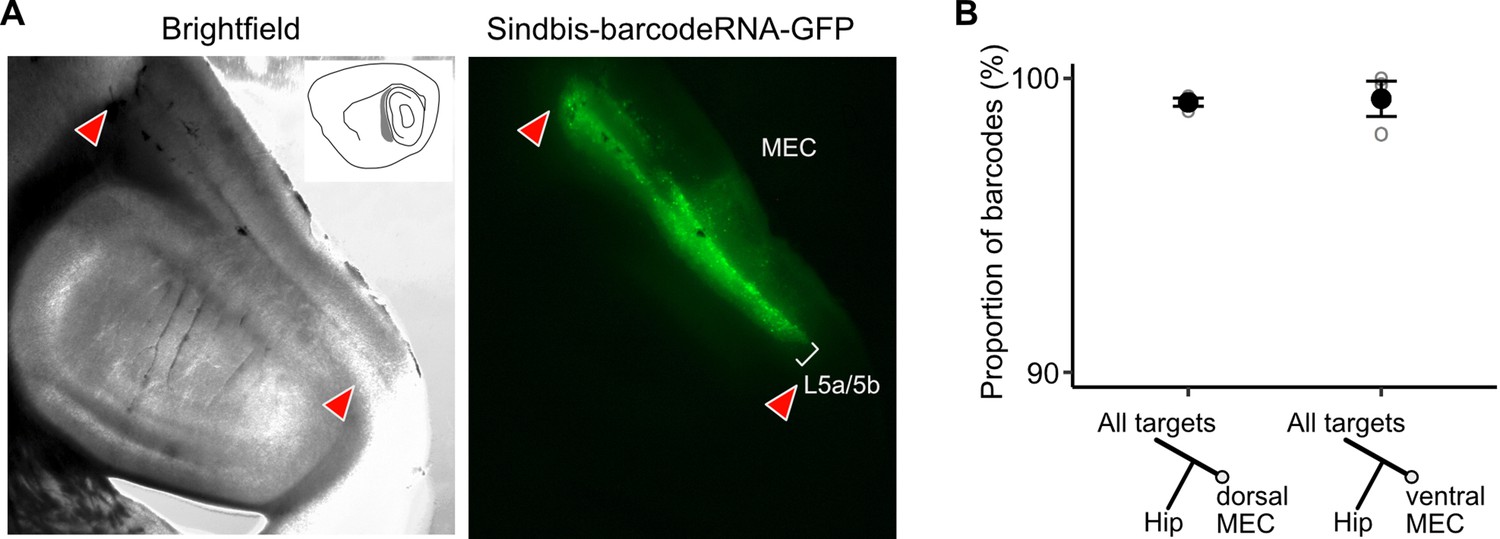
(A) Experimental strategy. A MAPseq virus library was injected into deep medial entorhinal cortex (MEC; n = 3 mice). Forty-four hours later, mice were sacrificed and brains were serially sectioned in the sagittal plane at 400 μm thickness. Tissue from five major divisions (isocortex, CNU, Olf/Ctxsp, dHip, and vHip), as well as dorsal and ventral MEC were then dissected and collected in tubes. Brainstem and spinal cord tissue was collected as a negative control. Tissue was further processed for RNA extraction and next generation sequencing. (B) Nearly all barcodes detected in CNU, Olf/Ctxsp, and isocortex were also detected in the hippocampus (isocortex: 98.6% ± 0.06%; CNU: 99.2% ± 0.08%; Olf/Ctxsp: 99.0% ± 0.4%; n = 3 mice, 1603, 3493, and 1677 barcodes from brains 1, 2, and 3, respectively). (C) Dorso-ventral topography of projections revealed by relative barcode counts. For each barcode, counts were normalized to show the relative projection strength of each neuron to dorsal and ventral hippocampus (n = 3 mice).
Figure 4—figure supplement 1
Verification of viral expression and further MAPseq data visualization.
(A) Brightfield and epifluorescence microscope images of the injection site on a sagittal brain section showing the spread of neurons infected by the MAPseq virus library in wild-type mice. (B) A neuron’s position in the dorso-ventral axis does not affect the likelihood of collateralization of its axons to the hippocampus (paired two-tailed Wilcoxon signed rank test, p = 1, median proportion of collateralizing barcodes in dEC = 99.3%, vEC = 99.8%, n = 3 mice).
Figure 5 with 1 supplement
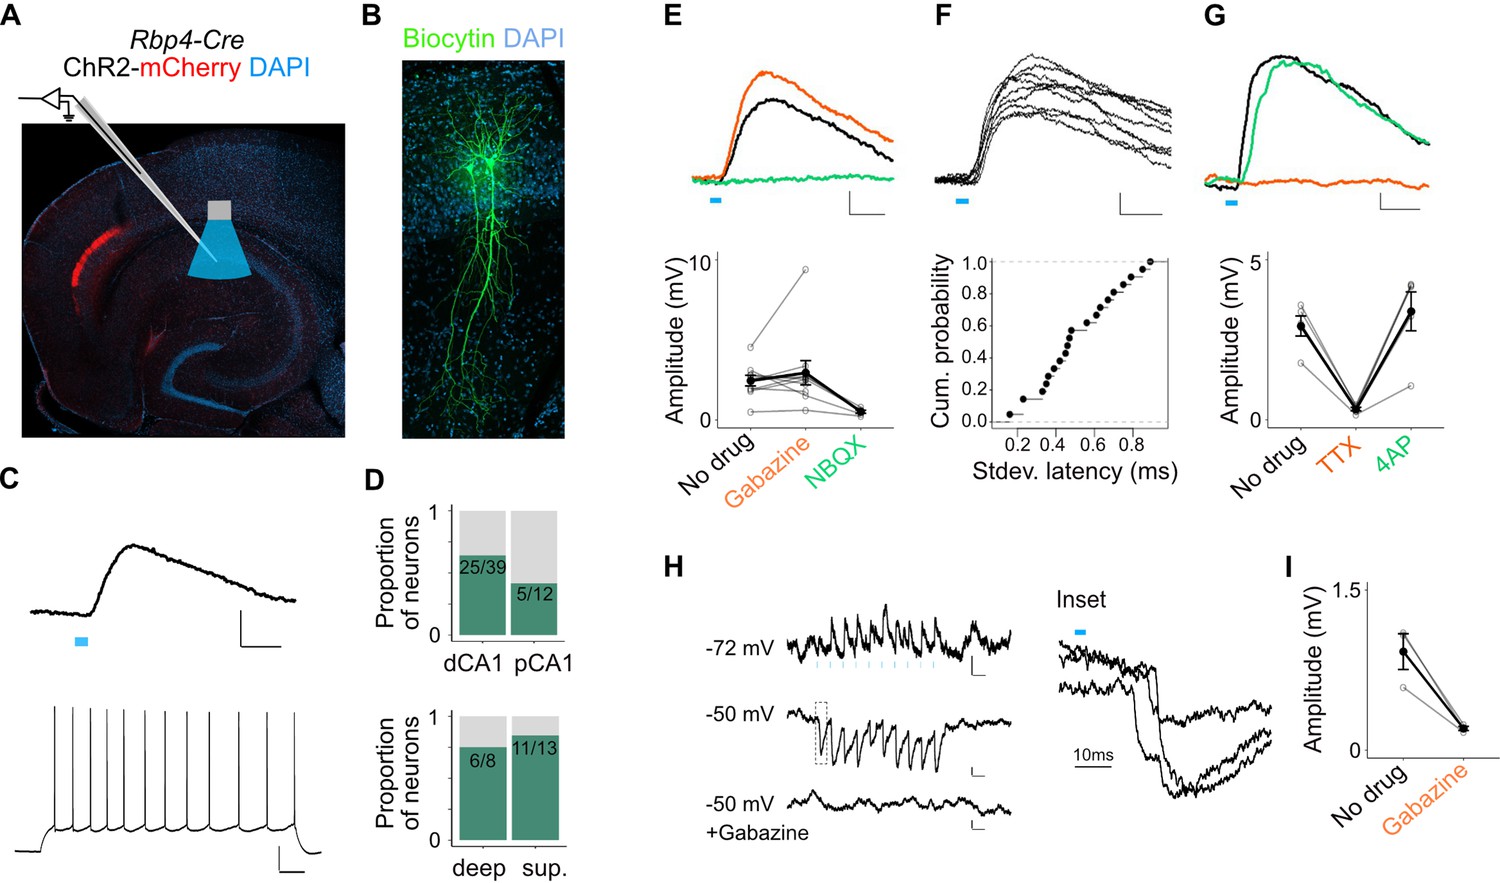
L5a neurons of the medial entorhinal cortex (MEC) provide direct excitatory and indirect inhibitory inputs to pyramidal cells in CA1.
(A) Experimental design showing viral expression, placement of patch-clamp electrode, and light delivery over CA1. (B) Examples of biocytin filled pyramidal neurons recorded in CA1. (C) An example electrical recording of a pyramidal neuron at rest (−67 mV) showing depolarizing responses upon 3-ms light stimulation (top) (blue line, scale bar: 1 mV, 10 ms). Train of action potentials upon 200 pA step-current injection (bottom; scale bar: 20 mV, 100 ms). (D) Proportion of responsive pyramidal neurons located in the distal and proximal halves of CA1 (top). The difference in proportions was not significant (X-squared = 1.9071, df = 1, p value = 0.167291, chi-squared test, n = 12 cells in proximal and n = 39 cells in distal CA1). Proportion of responsive pyramidal neurons located in the deep versus superficial locations of CA1 pyramidal cell layer (bottom) (X-squared = 0.2969, df = 1, p value = 0.585804, chi-squared test, n = 8 cells in deep SP and n = 13 cells in superficial SP). (E) Effects of bath application of Gabazine (orange, n = 10 cells, 9 mice) and NBQX (green, n = 5 cells) on postsynaptic potentials (PSPs) recorded from a pyramidal neuron (scale bar: 0.5 mV, 10 ms) and a summary plot of PSP amplitude measurements for all tested pyramidal neurons. Note that some neurons were only treated with Gabazine which did not cause a significant change in amplitudes (p = 0.97, two-tailed Student’s t-test, n = 10 cells, 9 mice). (F) An example of ten consecutive PSP responses recorded from a single pyramidal neuron illustrates the short and invariant latency of PSPs (scale bar: 0.5 mV, 10 ms) and a cumulative probability plot of standard deviation of latencies for neurons with PSP responses that were >1 mV in amplitude (n = 20 cells). (G) Effects of bath application of tetrodotoxin (TTX; orange) and 4-aminopyridine (4-AP; green) on PSPs recorded from a pyramidal neuron (scale bar: 0.5 mV, 10 ms) and a summary plot of changes in PSP amplitudes for all tested pyramidal neurons. TTX application abolished responses (n = 5 cells, 5 mice, p = 0.01, two-tailed Student’s t-test). (H, I) An example inhibitory PSP response recorded from a pyramidal neuron upon 10 Hz light stimulation (blue bars). Response polarity reversed when the neuron’s membrane potential was adjusted to –50 mV and was abolished after application of Gabazine (scale bars: 0.2 mV, 100 ms). Inset shows the long latency (>10 ms) of PSP onset indicating polysynaptic connectivity.
Figure 5—figure supplement 1
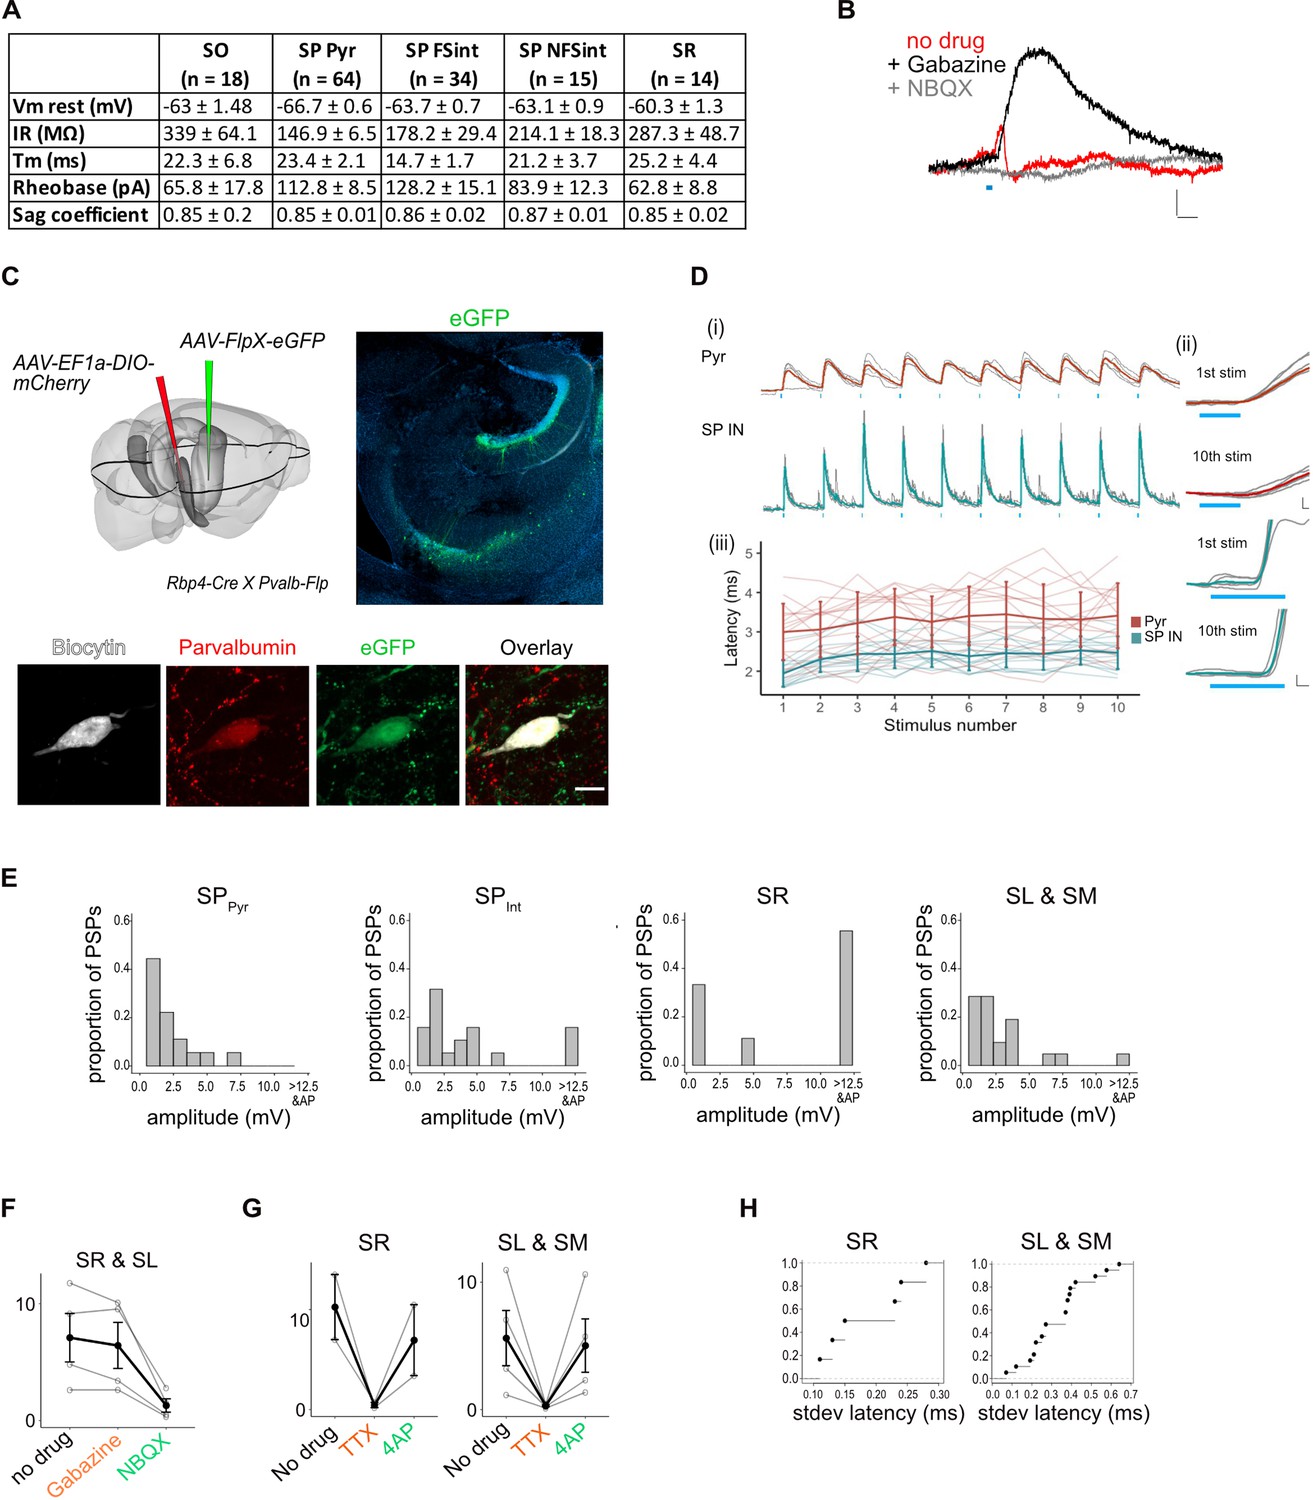
Experimental design and properties of responses to optogenetic stimulation of axons originating from L5a of the medial entorhinal cortex (MEC).
(A) Summary table for biophysical properties of neurons recorded in the study. (B) An example of a biphasic response recorded from a pyramidal neuron upon 3-ms stimulation of axons of MEC L5a neurons in CA1. A late hyperpolarizing (red) response was abolished by application of Gabazine to reveal a larger depolarizing postsynaptic potential (PSP; black) which was abolished by application of NBQX (grey) (scale bar: 10 ms, 0.5 mV). (C) Experimental strategy for fluorescence guided patch-clamp recordings made from parvalbumin-expressing neurons. Left: a FlpX-dependent green fluorescent protein (GFP)-expressing virus was injected in the hippocampus in Rbp4-Cre X Pvalb-Flp mice. Right: confocal image of horizontal slice showing labelled interneurons in the hippocampus. Bottom: an example fast-spiking interneuron marked as described in (C), that showed depolarizing PSP upon light stimulation. During recording, the neuron was filled with biocytin and later stained with streptavidin and anti-parvalbumin antibody. (D) (i) Traces of responses to a train of 10 light stimulation (blue lines), showing relatively stable EPSP amplitude across simulations (scale bar: 30 ms, 1 mV). (ii) Magnified images of 1st and 10th pulse illustrate the invariant latency in one example cell (scale bars: 0.5 ms, 0.5 mV). (iii) Quantification of latency across the train in all cells. Error bars represent standard error of the mean (SEM). (E) Plots showing the frequency distribution of PSP amplitudes in pyramidal neurons and interneurons. PSPs over 12.5 mV were detected in interneurons and often resulted in spiking responses (SPPyr: n = 19, SPint: n = 19, SR: n = 9, SL and SM: n = 22 cells). (F) Effects of bath application of Gabazine and NBQX on PSPs recorded from interneurons in SR and SL. The PSP amplitudes were largely unaffected by application of Gabazine (SR: n = 2 cells and SL: n = 2 cells, p = 0.28, two-tailed Student’s t-test) but were largely blocked by NBQX (SR: n = 2 cells and SL: n = 2 cells, p = 0.04, two-tailed Student’s t-test) indicating AMPA receptor-mediated glutamatergic synaptic transmission. (G) Effects of bath application of tetrodotoxin (TTX) and 4-aminopyridine (4-AP) on the response amplitude PSPs recorded from interneurons in SR, SL, and SM (SR: n = 2, SL: n = 3, SM: n = 1 cells). (H) Cumulative probability plots of standard deviation of latencies for neurons with PSP responses that were >1 mV in amplitude (SR: n = 6 cells, SL: n = 15 cells, SM: n = 4 cells). EPSPs of interneurons in all layers except SO had a short latency after light stimulation (mean latency SR: 2.00 ± 0.08 ms, n = 6 cells; SL and SM: 2.12 ± 0.21 ms, n = 23 cells). In SO, two out of three of the evoked PSPs had a larger latency of onset (mean latency = 8.5 ± 0.63 ms, n = 2 cells, 2 mice, data not shown).
Figure 6
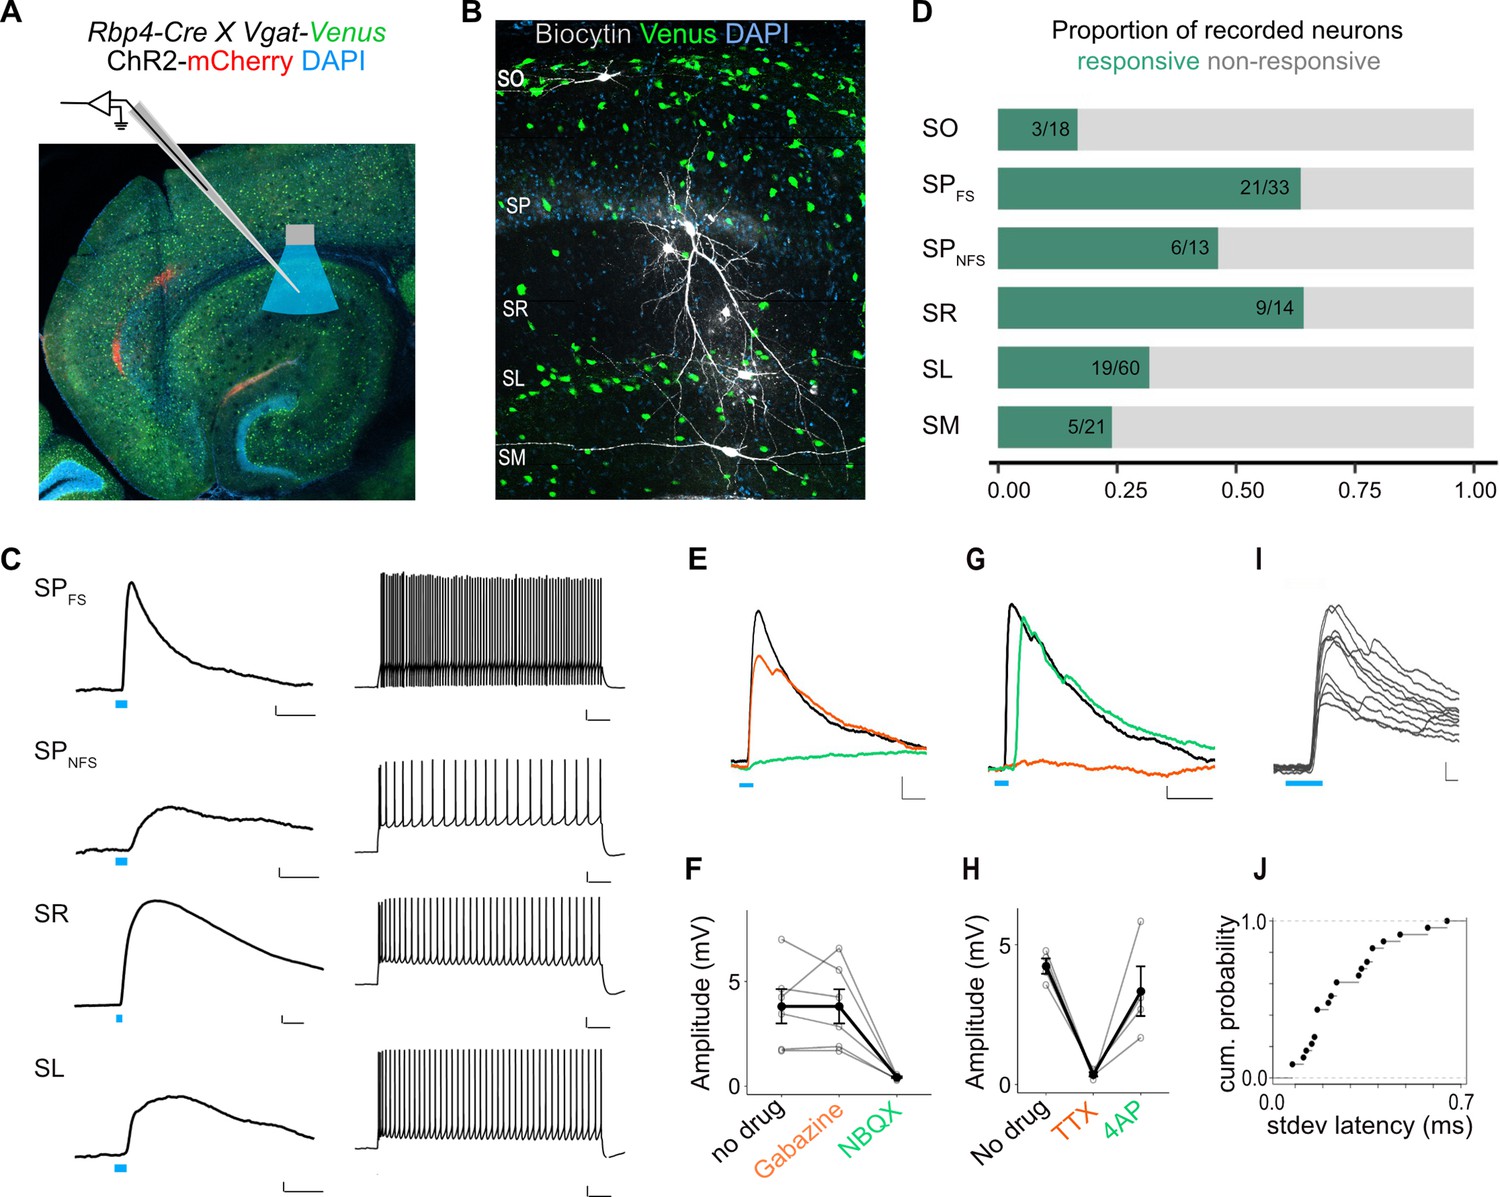
L5a neurons of the medial entorhinal cortex (MEC) provide direct excitatory inputs to interneurons in CA1.
(A) Experimental design showing viral expression, patch pipette, and light stimulation. Interneurons are marked by the expression of venus fluorescent protein driven by the vesicular GABA transporter (Vgat) gene’s promoter. (B) Biocytin filled neurons in the Rbp4-Cre X Vgat-Venus double transgenic mouse line. Fluorescent labelling facilitated patch-clamp recordings made from GABAergic interneurons and distinguishing SR, SL, and SM layers. (C) Representative examples of depolarizing responses recorded at resting membrane potential following 3ms blue light stimulation (blue line) of L5a axons in CA1 (left) (scale bar: 1 mV, 10 ms). Neurons in SO and SM were typically not responsive (<30%). Responses from SR neurons were on average larger than the responses from neurons in other layers (scale bar: 1 mV, 10 ms). Neurons’ spiking response to injecting 200 pA current (right) (scale bar: 10 mV, 100 ms). (D) Proportion of responsive interneurons in all layers of CA1 recorded at resting membrane potential. Green highlighted segment corresponds to the proportion of cells with depolarizing membrane potentials; grey highlighted segment corresponds to neurons with no change in their membrane potential. SO: n = 18 cells, 10 mice; SPFSint: n = 33 cells, 8 Rbp4-Cre X Pvalb-Flp mice, 5 Rbp4-Cre X Vgat-Venus mice, 8 Rbp4-Cre mice; SPNSFint: n = 13 cells, 11 Rbp4-Cre mice, 1 Rbp4-Cre X Vgat-Venus mouse; SR: n = 14 cells, 6 mice; SL: n = 60 cells, 15 mice; SM: n = 21 cells, 10 mice. (E, F) Effects of bath application of Gabazine (orange) and NBQX (green) on postsynaptic potentials (PSPs) recorded from a fast-spiking pyramidal layer interneuron (left) (scale bar: 1 mV, 5 ms). Summary quantification of PSP amplitudes for multiple cells (right). The PSP amplitudes were largely unaffected by application of Gabazine (SPint: n = 6 cells, p = 0.99 two-tailed Student’s t-test) but were largely blocked by NBQX (SPint: n = 5 cells, p = 0.03, two-tailed Student’s t-test) indicating AMPA receptor-mediated glutamatergic synaptic transmission. (G, H) Effects of bath application of tetrodotoxin (TTX; orange) and 4-aminopyridine (4-AP; green) on the response amplitude PSPs recorded from pyramidal layer interneurons. Example traces from a fast-spiking pyramidal layer interneuron (scale bar: 1 mV, 5 ms). Summary plots of response amplitude measurements from multiple recordings (SPint: n = 4 cells). (I, J) An example of ten consecutive PSP responses recorded from a single fast-spiking interneuron in SP illustrates the short and invariant latency of PSPs. Cumulative probability plots of standard deviation of latencies for neurons with PSP responses that were >1 mV in amplitude (mean latency SP: 2.08 ± 0.08 ms, n = 21 cells).
Additional files
-
Transparent reporting form
- https://cdn.elifesciences.org/articles/73162/elife-73162-transrepform1-v2.docx
-
Source data 1
MAPseq barcode count matrix.
Source data used to generate all plots in Figure 4, Figure 4—figure supplement 1. Barcode counts were filtered and normalized by spike-in counts as described in methods. Column names are abbreviations of brain area names as explained in figure legends.
- https://cdn.elifesciences.org/articles/73162/elife-73162-data1-v2.csv
Download links
A two-part list of links to download the article, or parts of the article, in various formats.
Downloads (link to download the article as PDF)
Open citations (links to open the citations from this article in various online reference manager services)
Cite this article (links to download the citations from this article in formats compatible with various reference manager tools)
Telencephalic outputs from the medial entorhinal cortex are copied directly to the hippocampus
eLife 11:e73162.
https://doi.org/10.7554/eLife.73162


