Critical role for isoprenoids in apicoplast biogenesis by malaria parasites
- Department of Biochemistry, University of Utah School of Medicine, United States
- Department of Molecular Microbiology and Immunology, Johns Hopkins School of Public Health, United States
- Metabolomics Core, University of Utah Health Sciences Center, United States
Figures
Figure 1 with 4 supplements
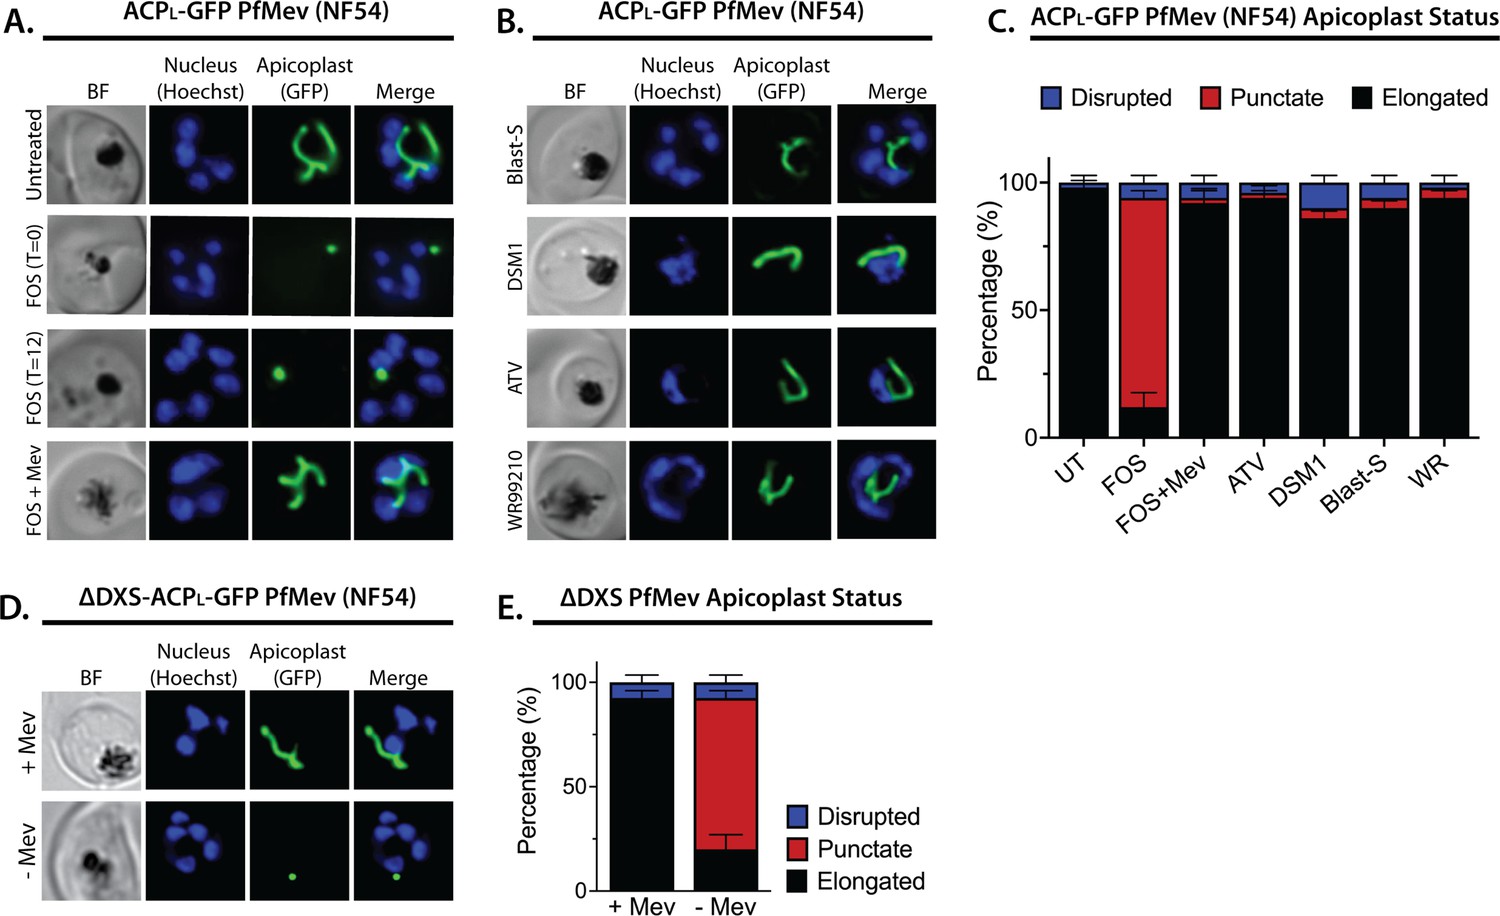
Inhibition of isoprenoid precursor biosynthesis specifically blocks apicoplast elongation and branching.
Bright-field (BF) and fluorescent microscopy images of live NF54 PfMev parasites that were (A) untreated or treated with 10 µM fosmidomycin (FOS) in the absence or presence of 50 µM DL-mevalonate (Mev), or (B) treated with 6 µM blasticidin-S (Blast-S), 2 µM DSM1, 100 nM atovaquone (ATV), or 5 nM WR99210. (C) Population analysis of apicoplast morphology for 50 total parasites imaged for each condition in panels A and B from two independent experiments. Apicoplast morphologies were scored as punctate (focal), elongated, or disrupted (dispersed); counted; and plotted by histogram as the fractional population with the indicated morphology (UT = untreated). Error bars represent standard deviations from replicate experiments. (D) Live-cell imaging of ∆DXS PfMev parasites in the presence or absence of 50 µM Mev. (E) Population analysis of parasites imaged in panel D and performed as in panel C. In all experiments, synchronized ring-stage parasites were incubated with the indicated treatments for 36 hr prior to live-cell imaging. Parasite nuclei were visualized using 1 µg/mL Hoechst 33342. The parasite apicoplast was visualized using the ACPL-GFP encoded by the PfMev line. Absolute parasite counts for microscopy experiments are shown in Figure 1—source data 1.
-
Figure 1—source data 1
Absolute parasite counts for microscopy experiments.
- https://cdn.elifesciences.org/articles/73208/elife-73208-fig1-data1-v2.xlsx
Figure 1—figure supplement 1

Additional epifluorescence images of PfMev ACPL-GFP NF54 parasites treated with fosmidomycin (FOS) and other drugs at the indicated concentrations.
Parasites were synchronized to the ring stage with 5% D-sorbitol and incubated with the indicated treatments for 38 hr prior to live-cell imaging.
Figure 1—figure supplement 2

Epifluorescence images and analysis of D10 ACPL-GFP parasites treated with fosmidomycin (FOS) and other drugs.
Bright-field (BF) and fluorescent microscopy images of live ACPL-GFP D10 parasites that were (A) untreated or treated with 10 µM FOS in the absence or presence of 200 µM isopentenyl pyrophosphate (IPP), or (B) treated with 6 µM blasticidin-S (Blast-S), 2 µM DSM1, or 100 nM atovaquone (ATV). (C) Population analysis of apicoplast morphology for 50 total parasites imaged for each condition in panels A and B from two independent experiments. Apicoplast morphologies were scored as punctate (focal), elongated, or disrupted (dispersed); counted; and plotted by histogram as the fractional population with the indicated morphology (UT = untreated). Error bars represent standard deviations from replicate experiments. In all experiments, synchronized ring-stage parasites were incubated with the indicated treatments for 36 hr prior to live-cell imaging. Parasite nuclei were visualized using 1 µg/mL Hoechst 33342. The parasite apicoplast was visualized using the ACPL-GFP encoded by the D10 line.
Figure 1—figure supplement 3

Additional epifluorescence images of D10 parasites treated with fosmidomycin (FOS) and other drugs.
Figure 1—figure supplement 4
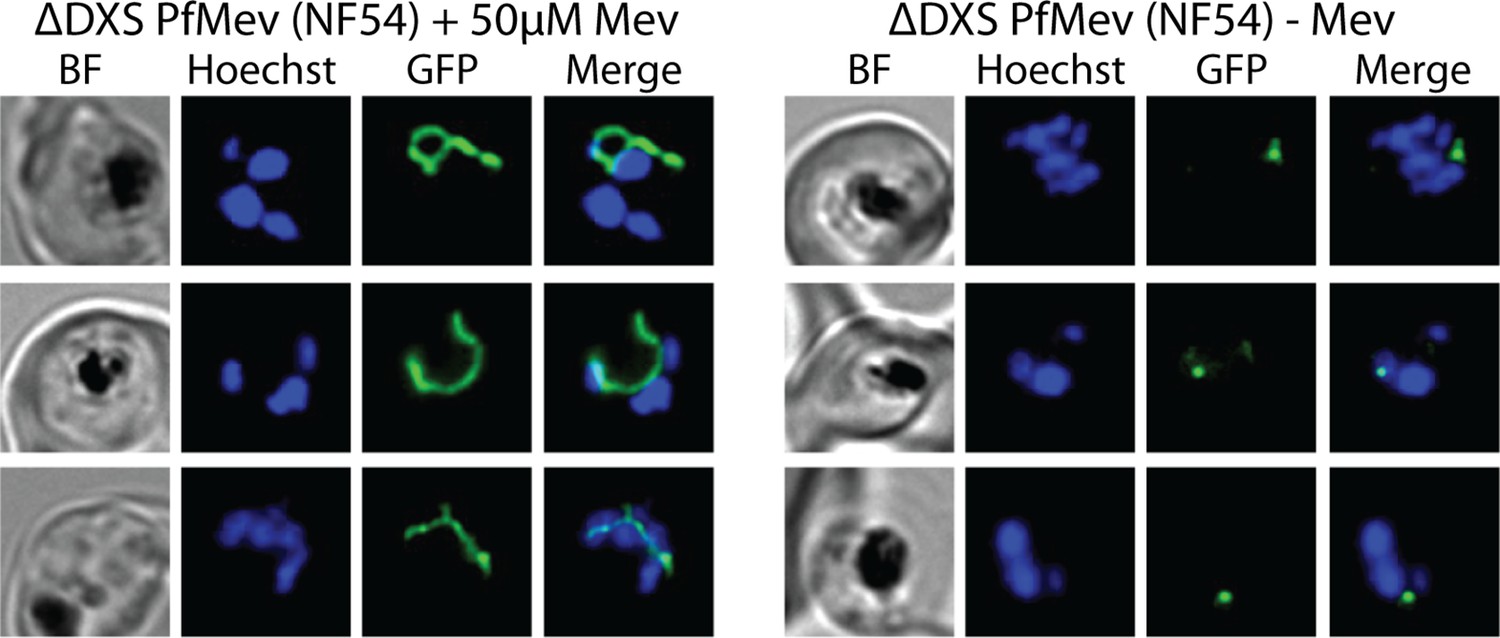
Additional epifluorescence images of ∆DXS PfMev parasites that were synchronized to ring stage with 5% D-sorbitol and incubated for 36 hr ± Mev hours prior to live-cell imaging.
Parasite nuclei were visualized using 1 µg/mL Hoechst 33342. The parasite apicoplast was visualized using the ACPL-GFP encoded by the PfMev line.
Figure 2 with 4 supplements
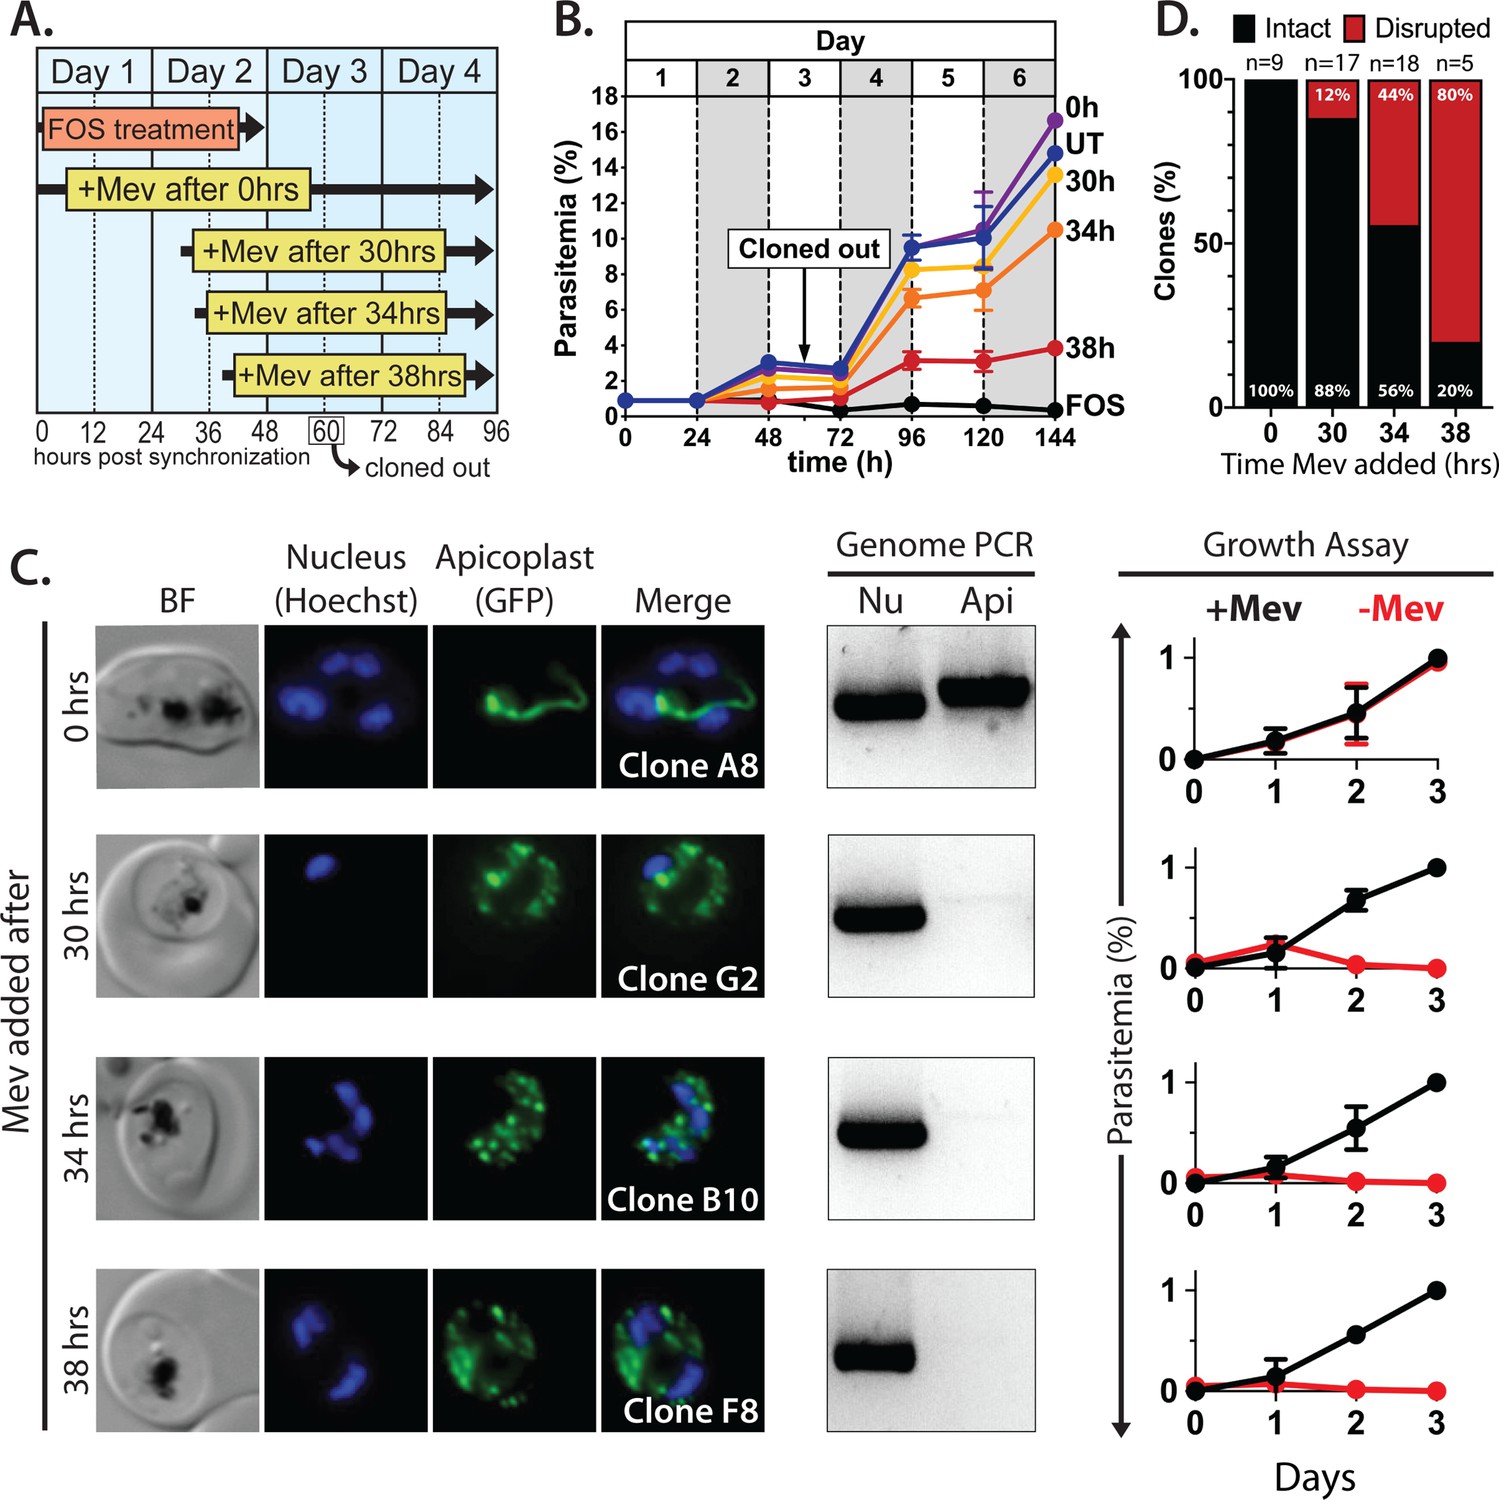
Inhibiting isoprenoid precursor biosynthesis prevents apicoplast inheritance by daughter parasites.
(A) Schematic summary of delayed mevalonate rescue of fosmidomycin (FOS) treatment. PfMev parasites were synchronized with 5% D-sorbitol and cultured in 10 µM FOS (washed out after 48 hr in second-cycle rings) without or with addition of 50 µM DL-mevalonate (Mev) at 0, 30, 34, or 38 hr after synchronization. Clonal parasites from all growth conditions were isolated at 60 hr post-synchronization by limiting dilution and growth in 50 µM Mev. (B) Parasite growth was monitored for 6 days by flow cytometry using acridine orange staining (FOS = treated only with FOS, UT = untreated, 0–38 hr time delay of Mev addition after synchronization and initiation of FOS treatment). (C) Bright-field (BF) and fluorescence microscopy images of representative live clonal parasites with disrupted apicoplast (if observed) isolated after 60 hr of growth under the conditions described in panel A. Images of all clones are shown in Figure 2—figure supplements 1–4. Parasite nuclei were visualized using 1 µg/mL Hoechst 33342. To the right of each clonal image panel is a gel image showing the result of PCR analysis to amplify a (Nu) nuclear (PPS, PF3D7_0202700) and (Api) apicoplast (SufB, PF3D7_API04700) gene and a growth assay to monitor the ability of each indicated clone to grow in the presence or absence of 50 µM Mev. Data points are the average± SD of three biological replicates and were normalized to the parasitemia on day 3 of growth in +Mev conditions. (D) Graphical representation of the number of clones isolated under each growth condition and the clonal percentage with an intact or disrupted apicoplast (determined by microscope analysis of ACPL-GFP signal and genomic PCR).
-
Figure 2—source data 1
Uncropped gel images of clonal PCR analyses.
- https://cdn.elifesciences.org/articles/73208/elife-73208-fig2-data1-v2.pdf
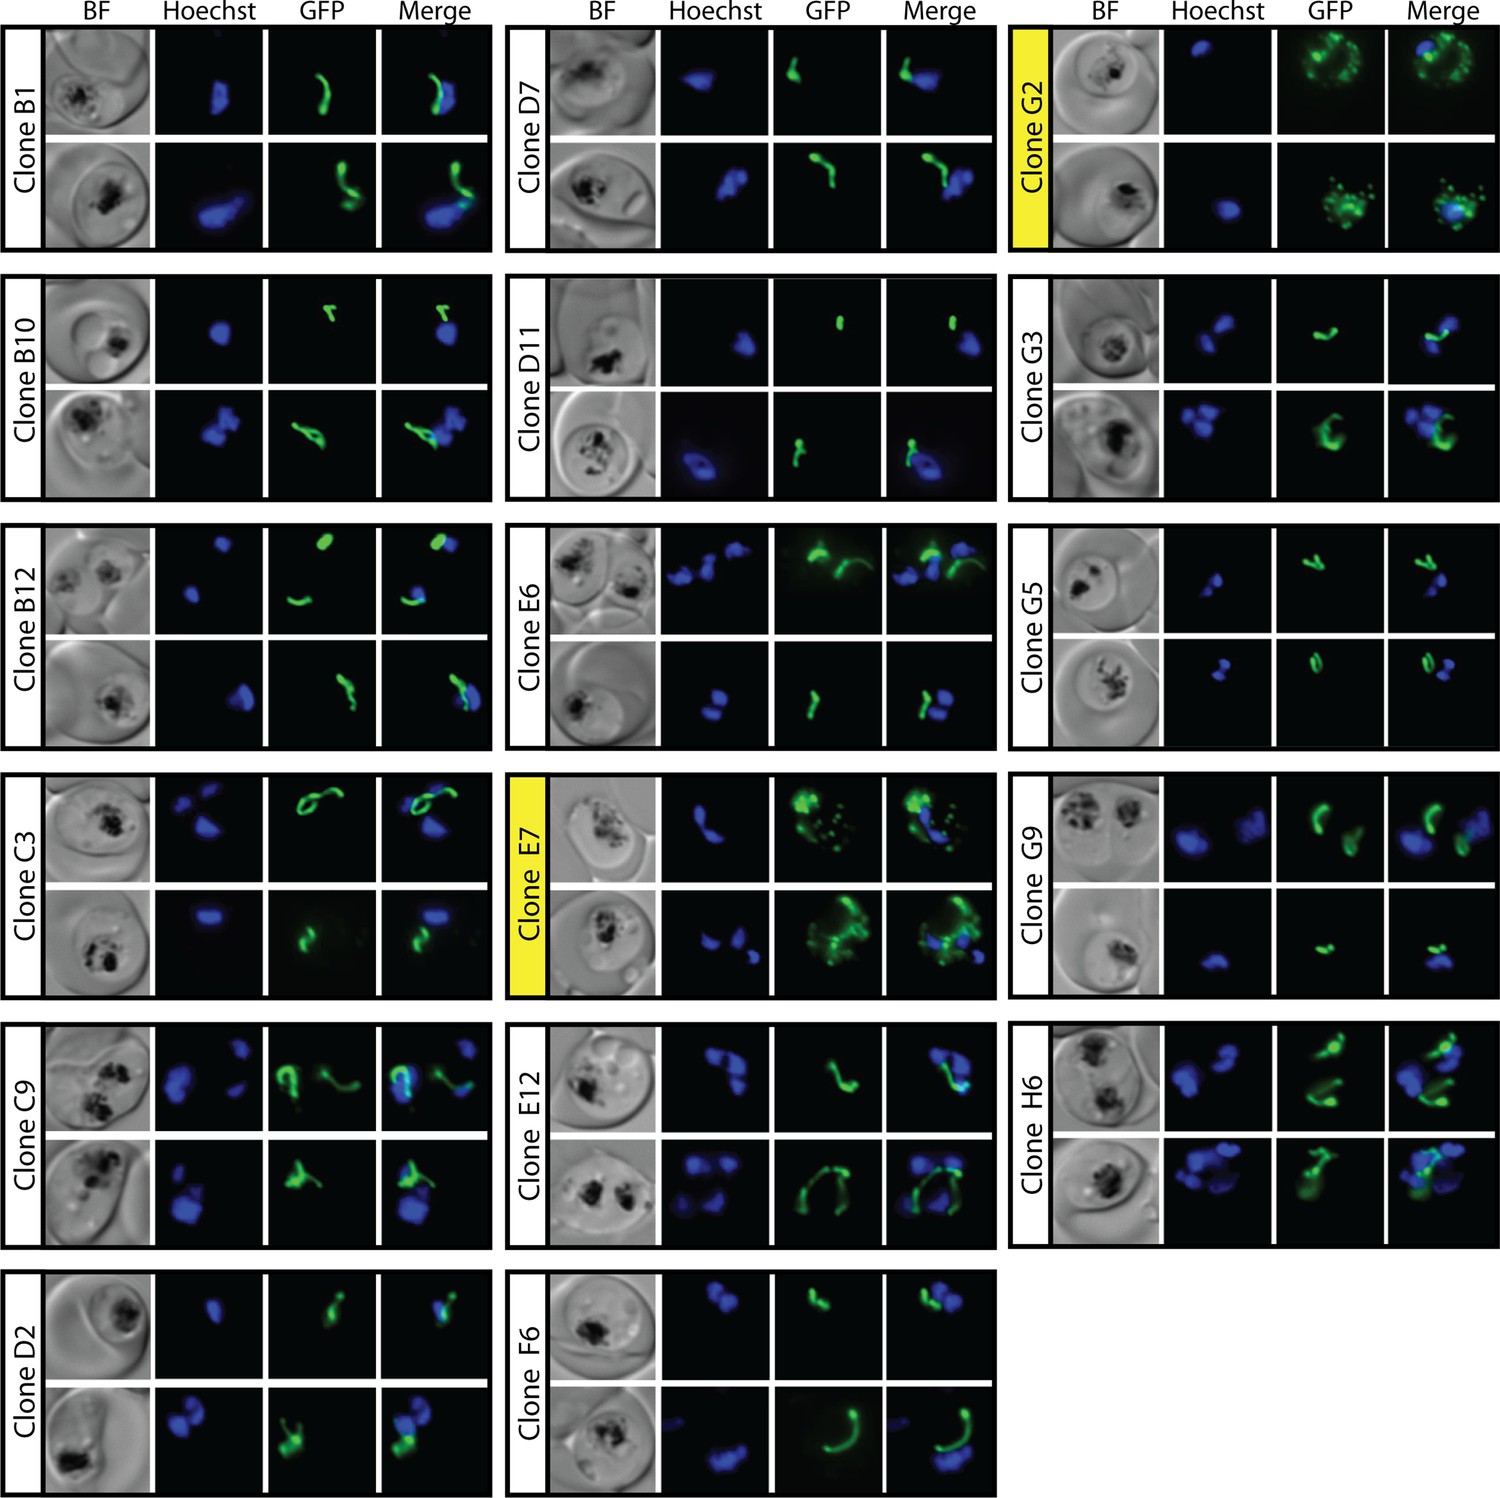
Figure 2—figure supplement 1
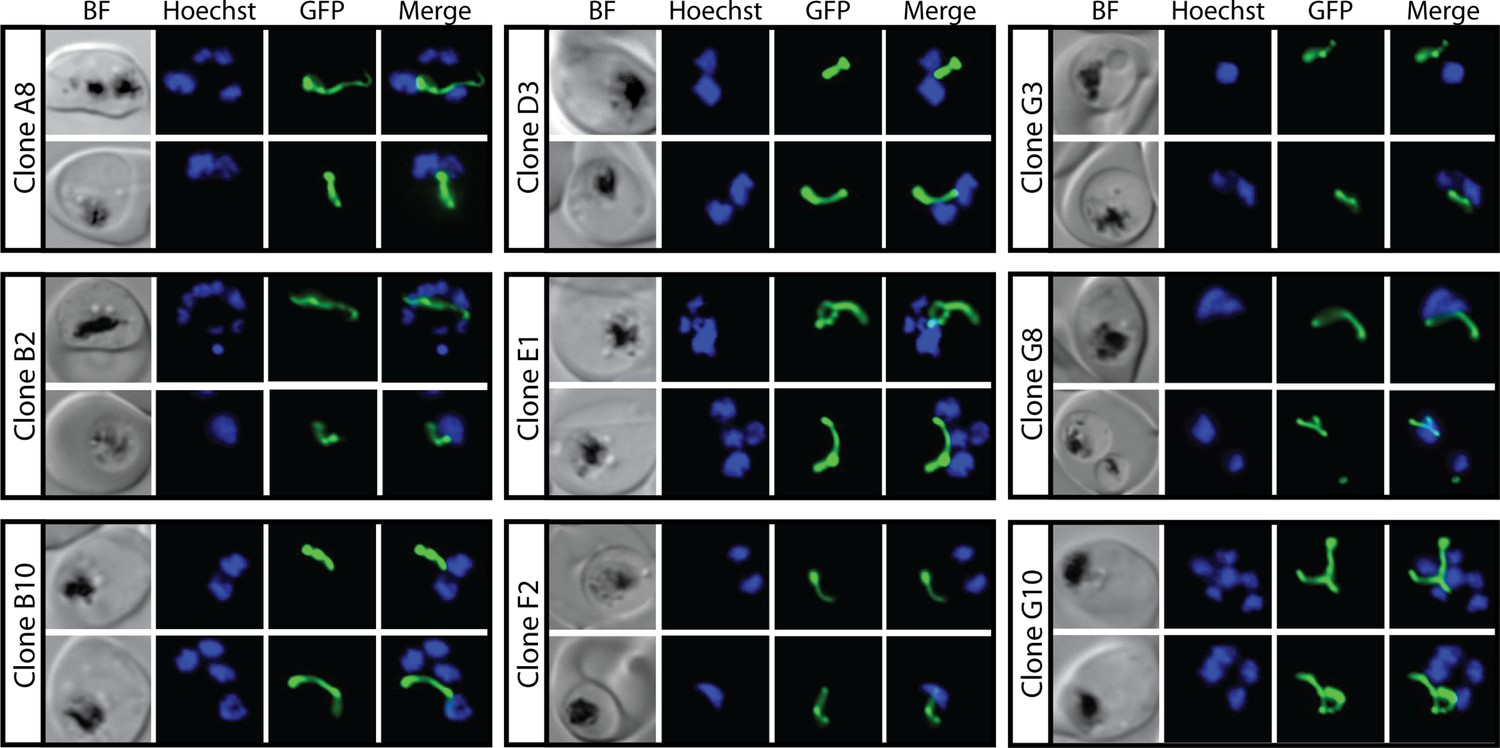
Epifluorescence microscopy images of clonal parasites isolated after fosmidomycin (FOS) treatment and rescue by mevalonate addition at 0 hr after synchronization.
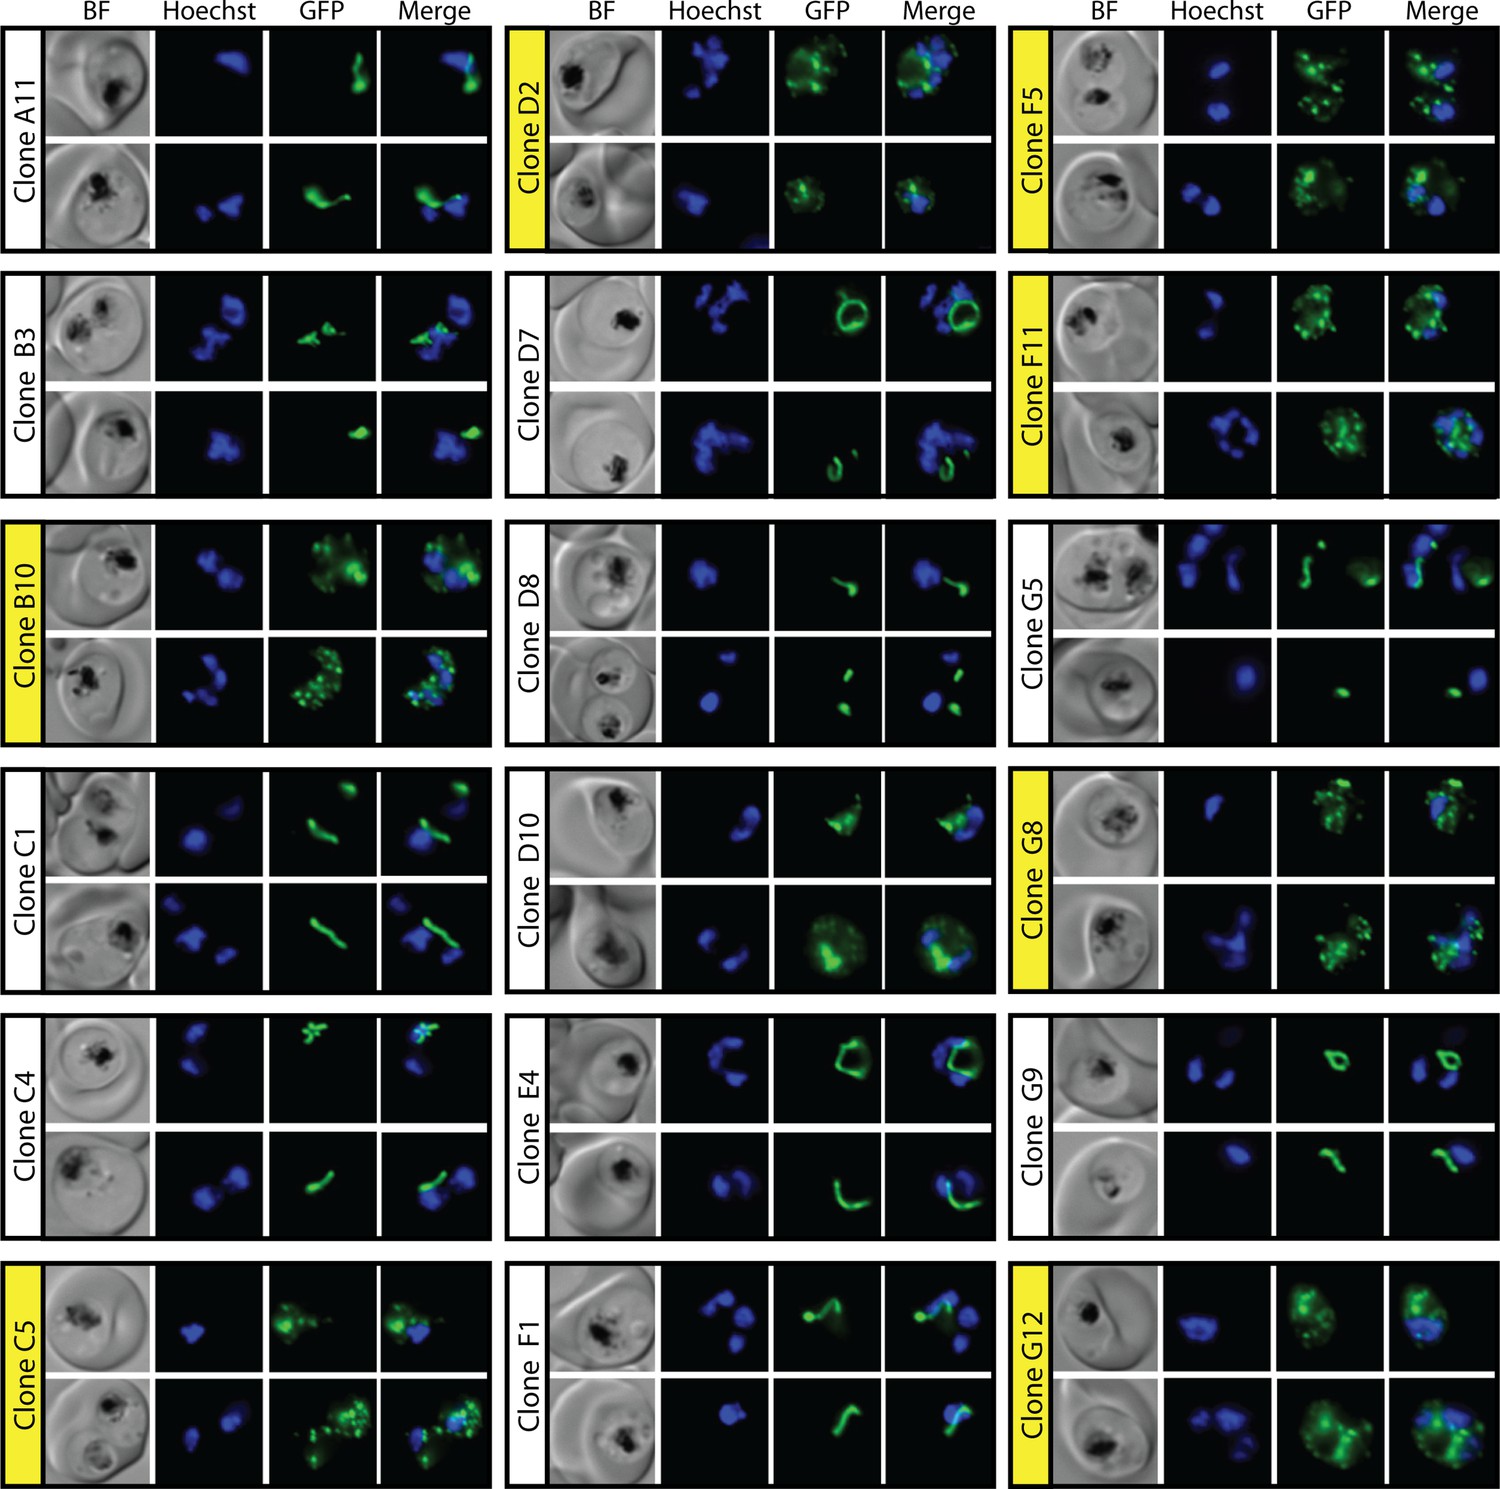
Figure 2—figure supplement 2
Epifluorescence microscopy images of clonal parasites isolated after fosmidomycin (FOS) treatment and rescue by mevalonate addition at 30 hr after synchronization.
Clone headers for parasites with a disrupted apicoplast are yellow.
Figure 2—figure supplement 3
Epifluorescence microscopy images of clonal parasites isolated after fosmidomycin (FOS) treatment and rescue by mevalonate addition at 34 hr after synchronization.
Clone headers for parasites with a disrupted apicoplast are yellow.
Figure 2—figure supplement 4
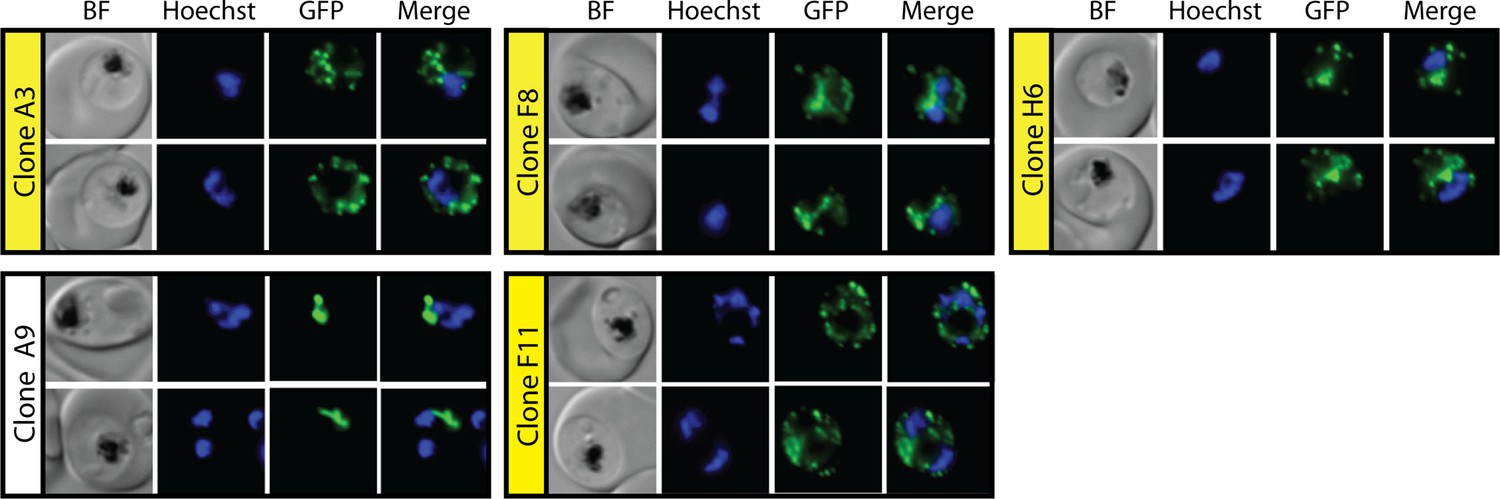
Epifluorescence microscopy images of clonal parasites isolated after fosmidomycin (FOS) treatment and rescue by mevalonate addition at 38 hr after synchronization.
Clone headers for parasites with a disrupted apicoplast are yellow.
Figure 3 with 1 supplement

Genetic disruption of MiaA has no effect on parasite growth or apicoplast biogenesis.
(A) Growth analysis indicates that parental PfMev NF54 parasites and ∆MiaA parasites cultured in the absence or presence of 50 µM Mev grow indistinguishably with identical rate constants (kobs) for asynchronous culture expansion. Parasitemia values for each sample are the average ± SD of three biological replicates and were normalized to the parasitemia on day 4 and fit with an exponential growth model. (B) Live parasite imaging and genomic PCR analysis indicate normal apicoplast morphology and retention of the apicoplast genome in parental PfMev and ∆MiaA parasites. BF = bright field, Nu = nuclear gene (LDH, PF3D7_1324900), and Api = apicoplast gene (SufB, PF3D7_API04700).
-
Figure 3—source data 1
Uncropped gel images of PCR analyses of nuclear and apicoplast genomes.
- https://cdn.elifesciences.org/articles/73208/elife-73208-fig3-data1-v2.pdf
-
Figure 3—source data 2
Uncropped gel images of PCR analysis to confirm disruption of MiaA gene.
- https://cdn.elifesciences.org/articles/73208/elife-73208-fig3-data2-v2.pdf
Figure 3—figure supplement 1
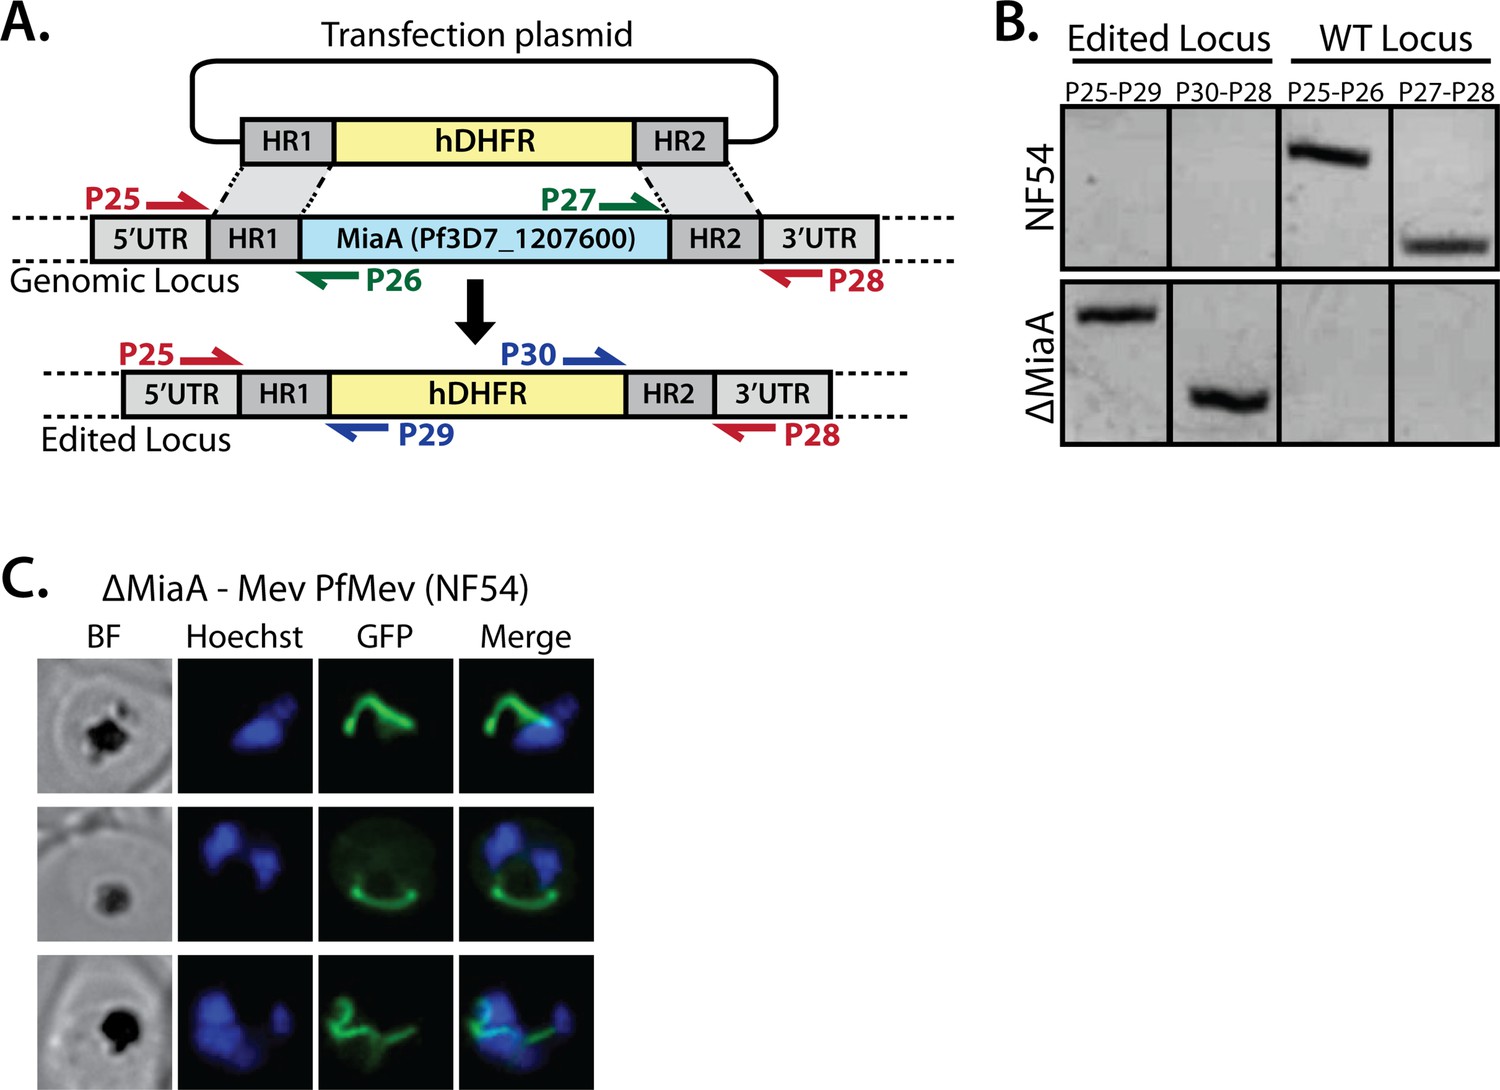
PCR genotyping of PfMev ∆MiaA parasites and additional epifluorescence images of apicoplast morphology.
(A) Schematic depiction of the MiaA gene-disruption strategy using CRISPR/Cas9 and positive selection with human DHFR. Colored arrows depict PCR primer pairs used in panel B to test for retention or disruption of the MiaA gene. (B) Genomic PCR analysis of parental NF54 PfMev parasites and polyclonal transfected parasite progeny confirmed successful disruption of the MiaA gene. (C) Additional images of ∆MiaA parasites.
Figure 4 with 3 supplements
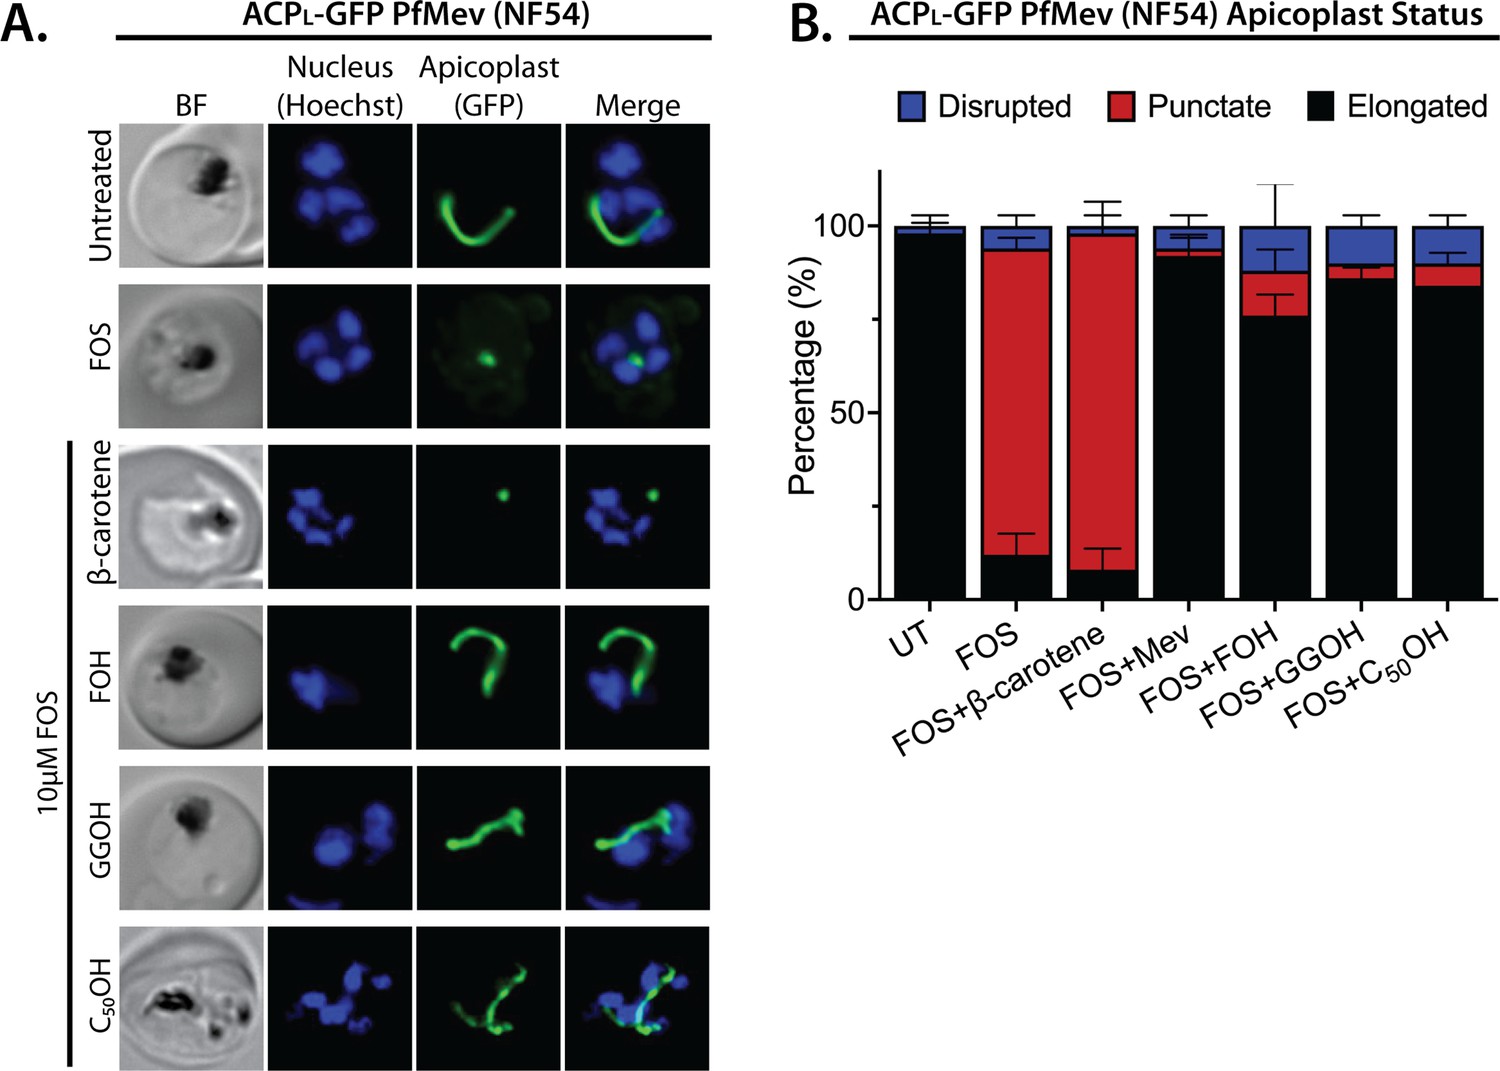
Apicoplast biogenesis requires linear polyprenyl isoprenoid synthesis.
(A) Five µM farnesol (FOH), geranylgeraniol (GGOH), or decaprenol (C50-OH), but not β-carotene rescues apicoplast biogenesis from inhibition by 10 µM fosmidomycin (FOS) in PfMev parasites. Synchronized ring-stage parasites were incubated with the indicated treatments for 36 hr and imaged by bright-field (BF) or fluorescence microscopy, with visualization of parasite nuclei by Hoechst staining and the apicoplast by ACPL-GFP signal. (B) Population analysis of apicoplast morphology for 50 total parasites imaged for each condition in panel A from two independent experiments. Apicoplast morphologies were scored as punctate (focal), elongated, or disrupted (dispersed); counted; and plotted by histogram as the fractional population with the indicated morphology (UT = untreated). Error bars represent standard deviations from replicate experiments.
-
Figure 4—source data 1
Absolute parasite counts for microscopy experiments.
- https://cdn.elifesciences.org/articles/73208/elife-73208-fig4-data1-v2.xlsx
Figure 4—figure supplement 1

5 µM geranylgeraniol (GGOH) but not farnesol (FOH) partially rescues parasite growth from inhibition by 10 µM fosmidomycin (FOS) in continuous-growth assays with PfMev parasites.
Data points are the average ± SD of three biological replicates. Parasites were synchronized to ring stage with 5% D-sorbitol and incubated with the indicated treatments. Daily parasitemia values were determined by flow cytometry.
Figure 4—figure supplement 2

Additional epifluorescence microscopy images of PfMev parasites treated with fosmidomycin (FOS) and farnesol (FOH), geranylgeraniol (GGOH), C50-OH, or β-carotene.
Synchronized ring-stage parasites were incubated with the indicated treatments for 36 hr and imaged by bright-field (BF) or fluorescence microscopy, with visualization of parasite nuclei by Hoechst staining and the apicoplast by ACPL-GFP signal.
Figure 4—figure supplement 3

Epifluorescence microscopy images of D10 ACPL-GFP parasites treated with fosmidomycin (FOS) and farnesol (FOH), geranylgeraniol (GGOH), C50-OH, or β-carotene.
(A) Five µM FOH, GGOH, or decaprenol (C50–OH) but not β-carotene rescues apicoplast biogenesis from inhibition by 10 µM FOS. (B) Statistical analysis (average ± SD) of apicoplast status in D10 parasites treated with 10 µM FOS. (C) Additional images of D10 parasites treated with FOS and FOH, GGOH, C50OH, or β-carotene.
Figure 5 with 4 supplements
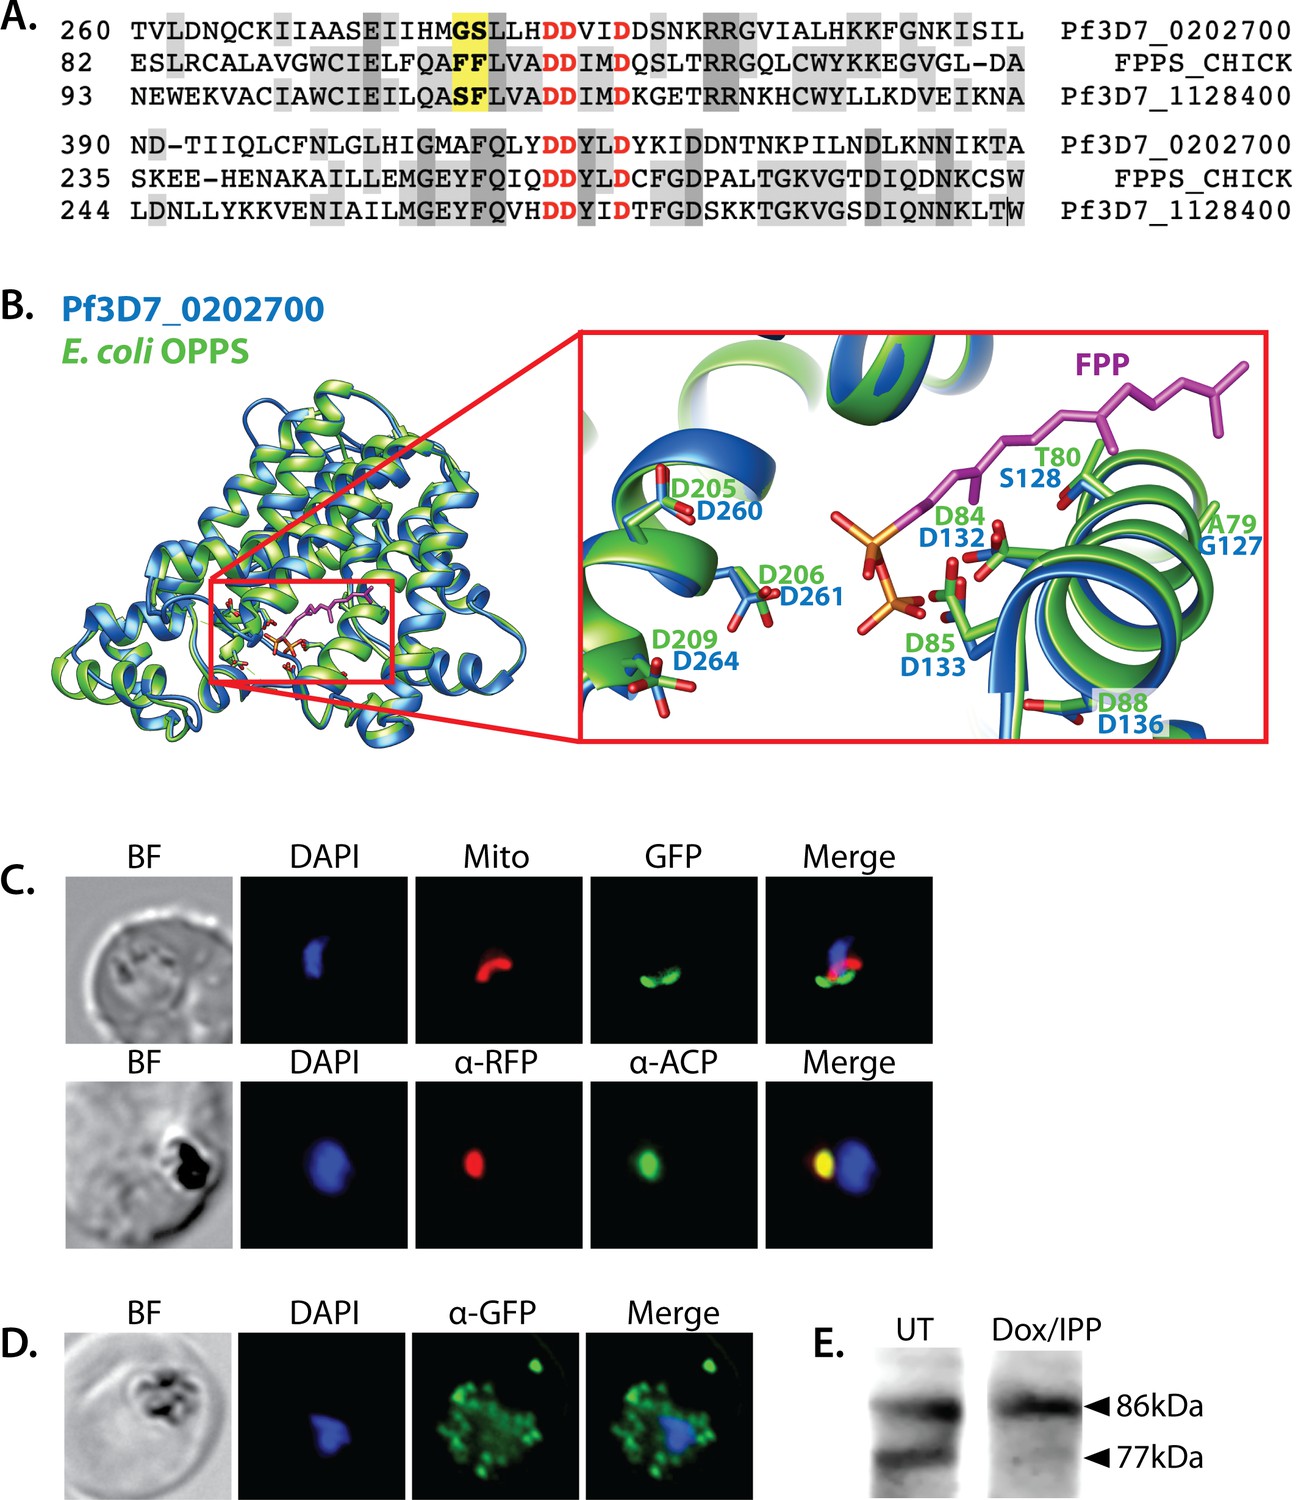
Sequence alignment and localization of the polyprenyl synthase (PPS) PF3D7_0202700 to the apicoplast.
(A) Focal sequence alignment of avian farnesyl pyrophosphate synthase (FPPS, Uniprot P08836) with its two Plasmodium falciparum homologs reveals the presence of conserved metal-binding DDXXD motifs (red) expected for PPS activity and chain-length determination residues (yellow) upstream of the first DDXXD. (B) Homology model of PF3D7_0202700 using Escherichia coli octaprenyl pyrophosphate synthase (PDB 3WJK) as a structural template. The inset box is an enlargement of the active-site pocket showing the conserved Asp residues, bound FPP substrate, and product length-determining residues just upstream of the first DDXXD motif. (C) Bright-field (BF), fluorescence images (top) of live parasites episomally expressing PPS-GFP and stained with 10 nM Mitotracker Red and (bottom) immunofluorescence analysis (IFA) images of fixed parasites episomally expressing PPS-RFP stained with anti-RFP and anti-apicoplast ACP antibodies. (D) IFA images of fixed parasites expressing PPS-GFP that had been treated for >7 days with 2 µM doxycycline (Dox) and 200 µM isopentenyl pyrophosphate (IPP) (to stably induce apicoplast loss) and stained with anti-GFP antibody to visualize PPS distribution. (E) Western blot analysis of untreated (UT) or Dox/IPP-treated parasites episomally expressing PPS-RFP. PPS-RFP expression was visualized using an anti-RFP antibody. The full western blot image is included in Figure 5—source data 1.
-
Figure 5—source data 1
Uncropped western blot image detecting polyprenyl synthase (PPS)-RFP expression in parasites.
- https://cdn.elifesciences.org/articles/73208/elife-73208-fig5-data1-v2.pdf
Figure 5—figure supplement 1
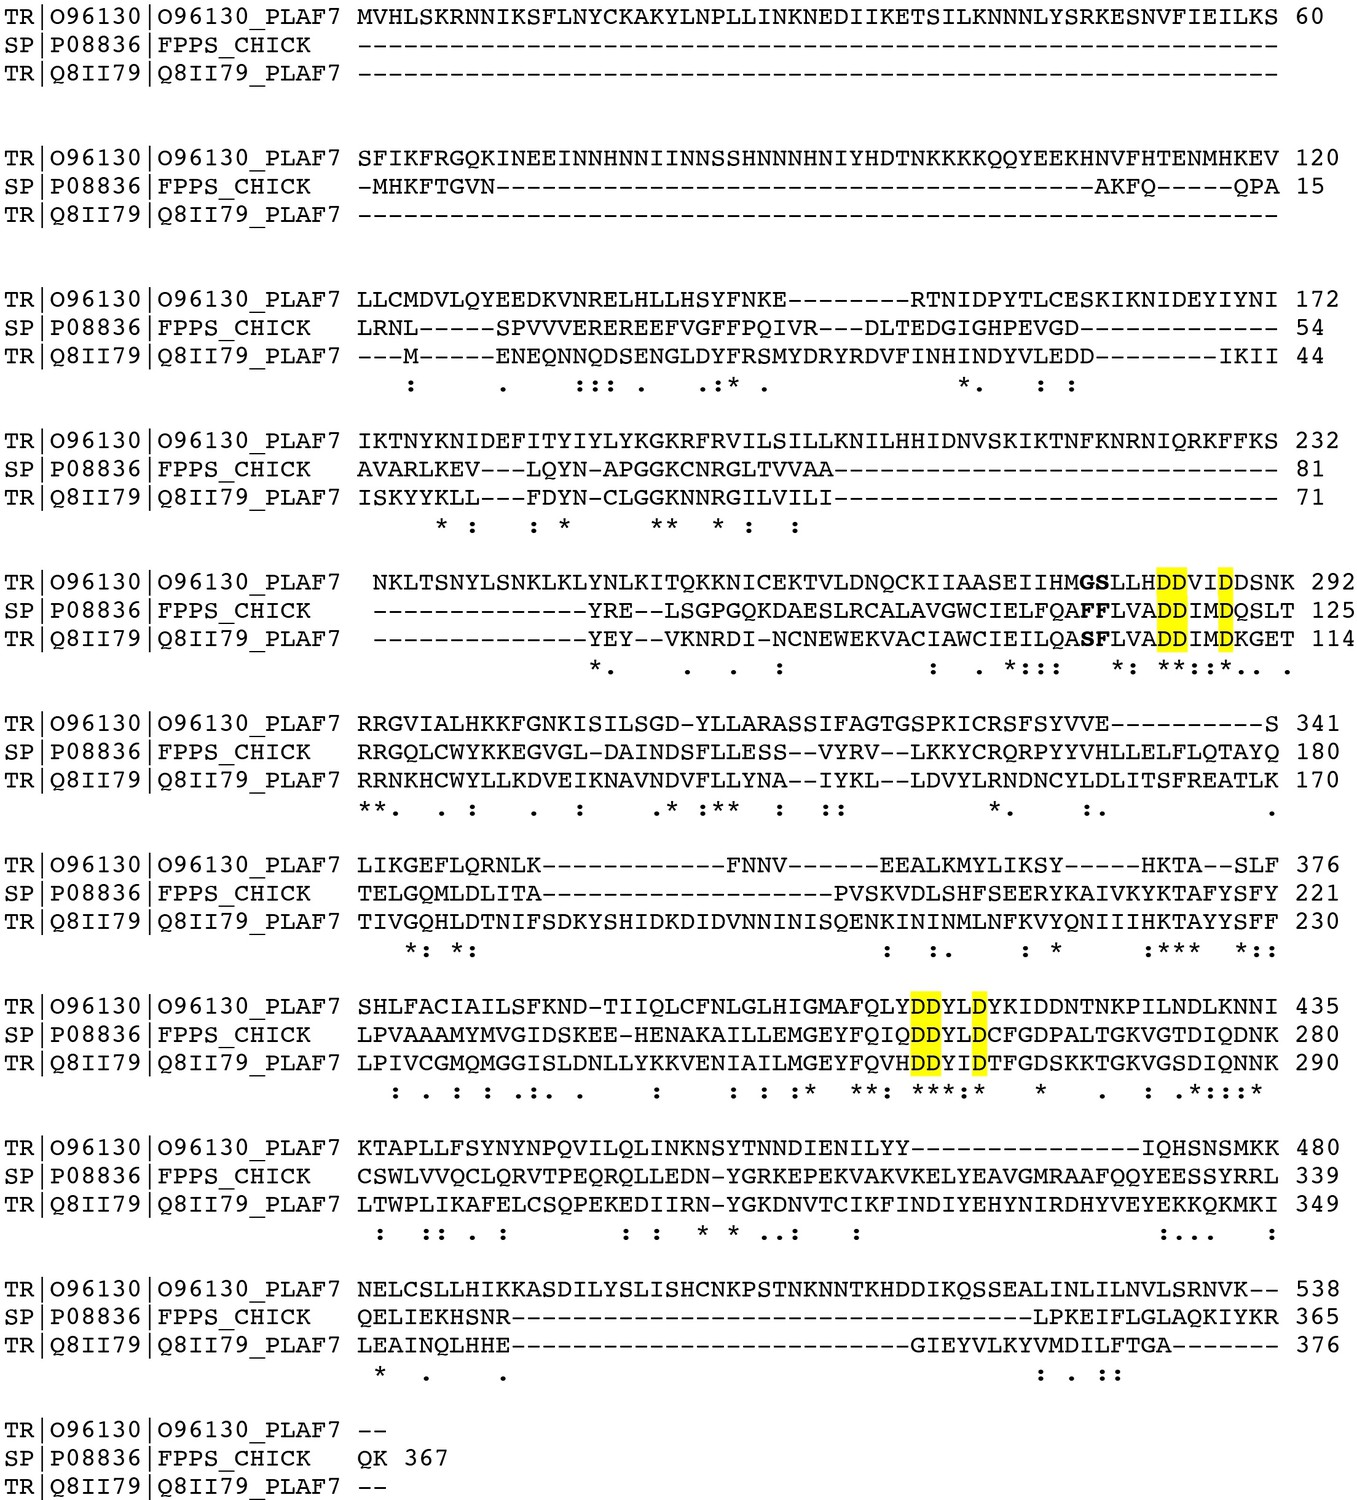
Full sequence alignment of PF3D7_0202700, PF3D7_1128400, and avian farnesyl pyrophosphate synthase (FPPS) (Uniprot P08836).
Figure 5—figure supplement 2
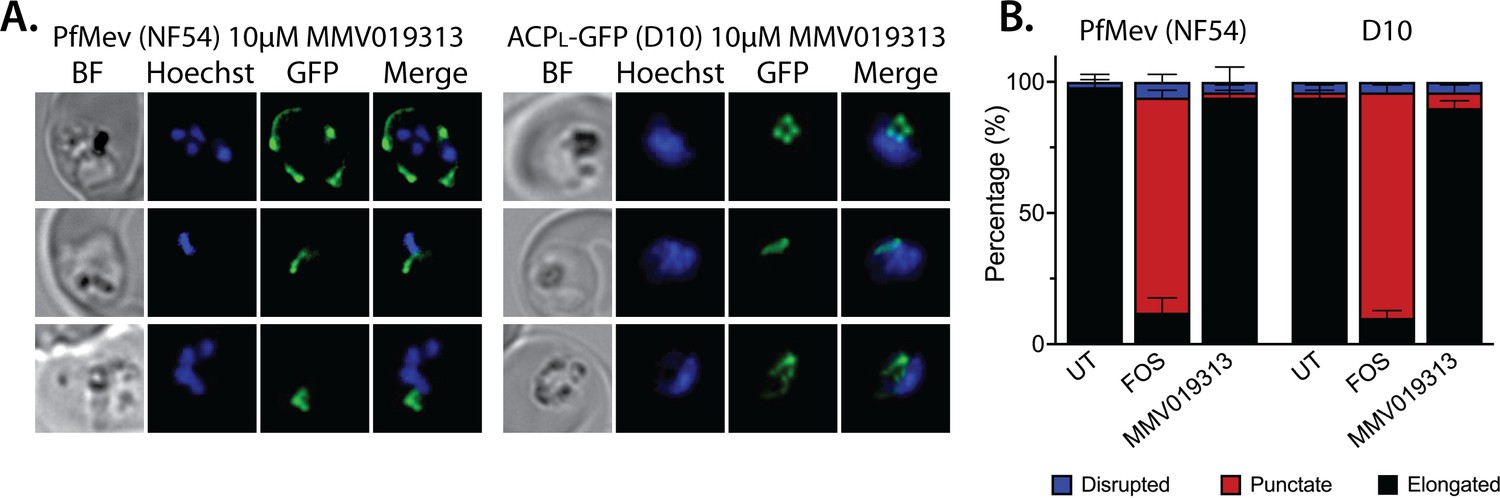
Epifluorescence microscopy images and statistical analysis of PfMev and D10 parasites treated with 10 µM MMV091313.
(A) Synchronized ring-stage parasites were incubated with 10 µM MMV091313 for 36 hrs and imaged by bright-field (BF) or fluorescence microscopy, with visualization of parasite nuclei by Hoechst staining and the apicoplast by ACPL-GFP signal. (B) Population analysis of apicoplast morphology for 50 total parasites imaged for each condition in panel A from two independent experiments (UT = untreated). Apicoplast morphologies were scored as punctate (focal), elongated, or disrupted (dispersed); counted; and plotted by histogram as the fractional population with the indicated morphology. Error bars represent standard deviations from replicate experiments.
Figure 5—figure supplement 3

Results of sequence-similarity searches for PF3D7_0202700 using NCBI BLAST and MPI HHpred.
Figure 5—figure supplement 4

Additional epifluorescence microscopy images of Dd2 parasite episomally expressing polyprenyl synthase (PPS)-GFP or PPS-RFP.
(A) Additional images of live parasite expressing PPS-GFP. Additional immunofluorescence images of Dd2 parasites episomally expressing, (B) PPS-RFP and stained with anti-apicoplast ACP and an anti-RFP antibody, and (C) PPS-GFP, cultured for 7 days in 2 µM doxycycline and 200 isopentenyl pyrophosphate (IPP), and stained with an anti-GFP antibody.
Figure 6 with 3 supplements
Polyprenyl synthase (PPS) (PF3D7_0202700) is essential for parasite viability and apicoplast function.
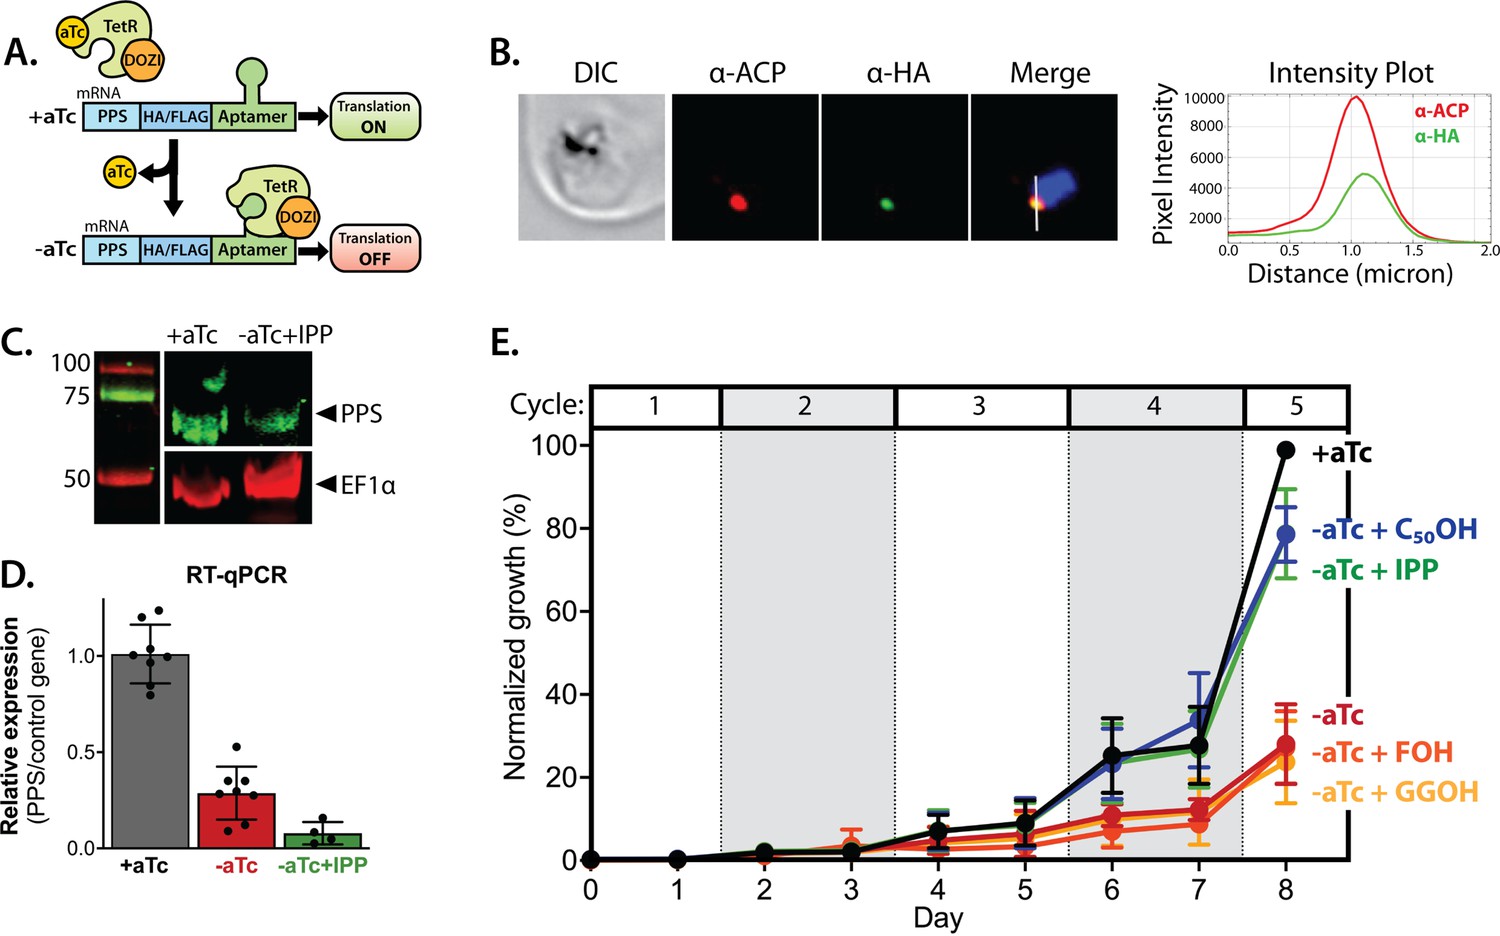
(A) Schematic depiction of the aptamer/TetR-DOZI system for ligand-dependent protein expression. (B) Immunofluorescence analysis of fixed parasites endogenously expressing PPS-HA-FLAG and stained with anti-acyl carrier protein (ACP) and anti-hemagglutinin (HA)-tag antibodies. The intensity plot displays the overlap in pixel intensity for ACP and HA signals as a function of distance along the white line in the merged image. (C) Western blot of endogenously tagged PPS-HA/FLAG showing detection of tagged PPS at the expected size for mature PPS of ~60 kDa for growth in +aTc conditions but diminished signal for parasites grown -aTc + isopentenyl pyrophosphate (IPP) for 5 days. Densitometry of the PPS signal relative to the EF1α loading control indicated a threefold signal reduction in +aTc versus -aTc/ + IPP conditions. (D) RT-qPCR analysis of PPS transcript levels (normalized to the average of two nuclear control genes) in biological replicate samples of synchronous parasites cultured for 72 hr ± aTc or -aTc/ + IPP. (E) Synchronous growth assay of Dd2 parasites tagged at the PPS locus with the aptamer/TetR-DOZI system and grown ±aTc and ± 200 µM IPP or 5 µM farnesol (FOH), geranylgeraniol (GGOH), or decaprenol (C50-OH). Parasitemia values for each condition are the average ± SD of three biological replicates.
-
Figure 6—source data 1
Uncropped western blot image detecting endogenous polyprenyl synthase (PPS)-hemagglutinin (HA)/FLAG in parasites.
- https://cdn.elifesciences.org/articles/73208/elife-73208-fig6-data1-v2.pdf
-
Figure 6—source data 2
Uncropped Southern blot image to probe editing of polyprenyl synthase (PPS) gene.
- https://cdn.elifesciences.org/articles/73208/elife-73208-fig6-data2-v2.pdf
Figure 6—figure supplement 1

Scheme for modification of the polyprenyl synthase (PPS) genomic locus to integrate the aptamer/TetR-DOZI system and Southern blot confirming correct integration.
Figure 6—figure supplement 2

Additional immunofluorescence microscopy images showing co-localization of endogenous polyprenyl synthase (PPS) and apicoplast acyl carrier protein (ACP).
Figure 6—figure supplement 3

Blood-smear images of Dd2 parasites tagged at the polyprenyl synthase (PPS) locus with the aptamer/TetR-DOZI system and grown ±aTc for 8 days.
Figure 7 with 3 supplements
Polyprenyl synthase (PPS) is required for apicoplast biogenesis.
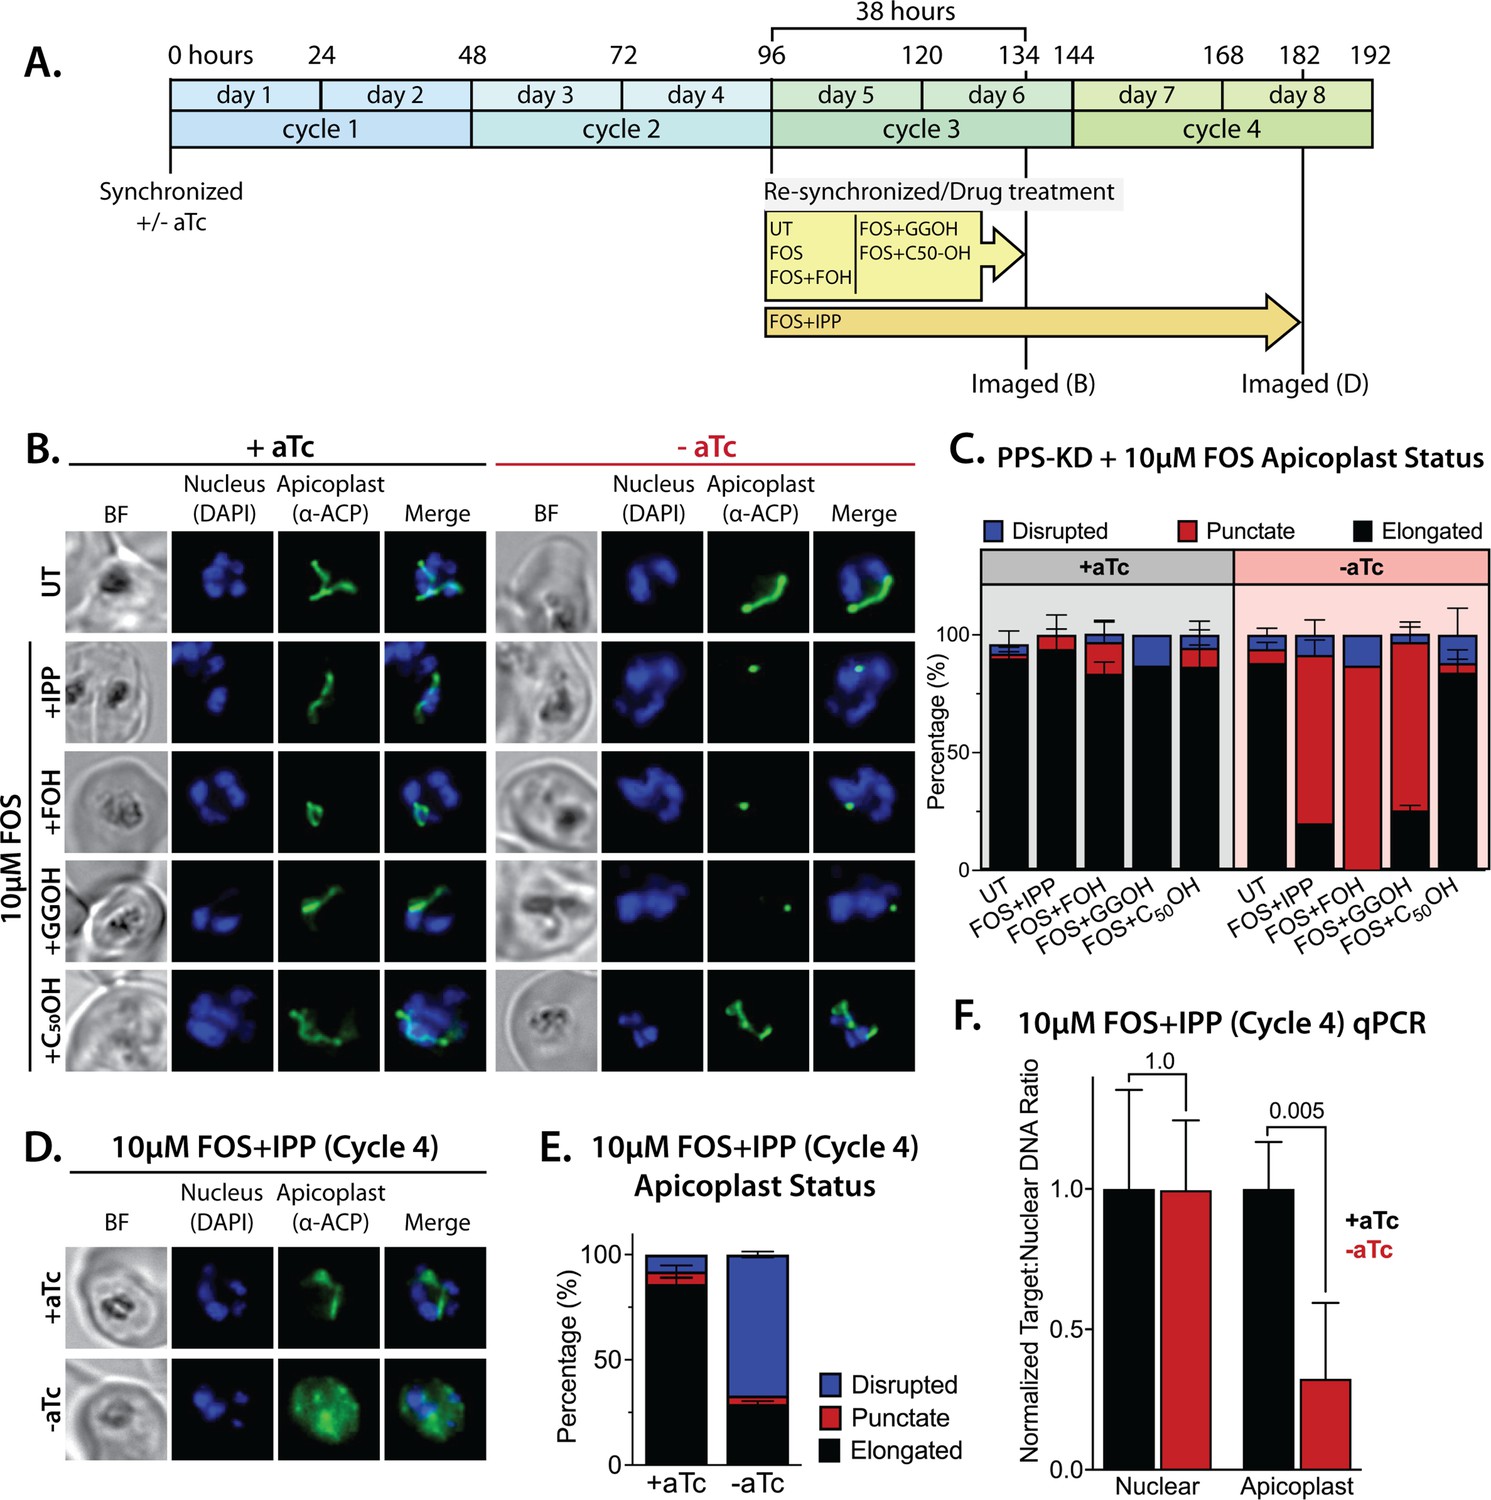
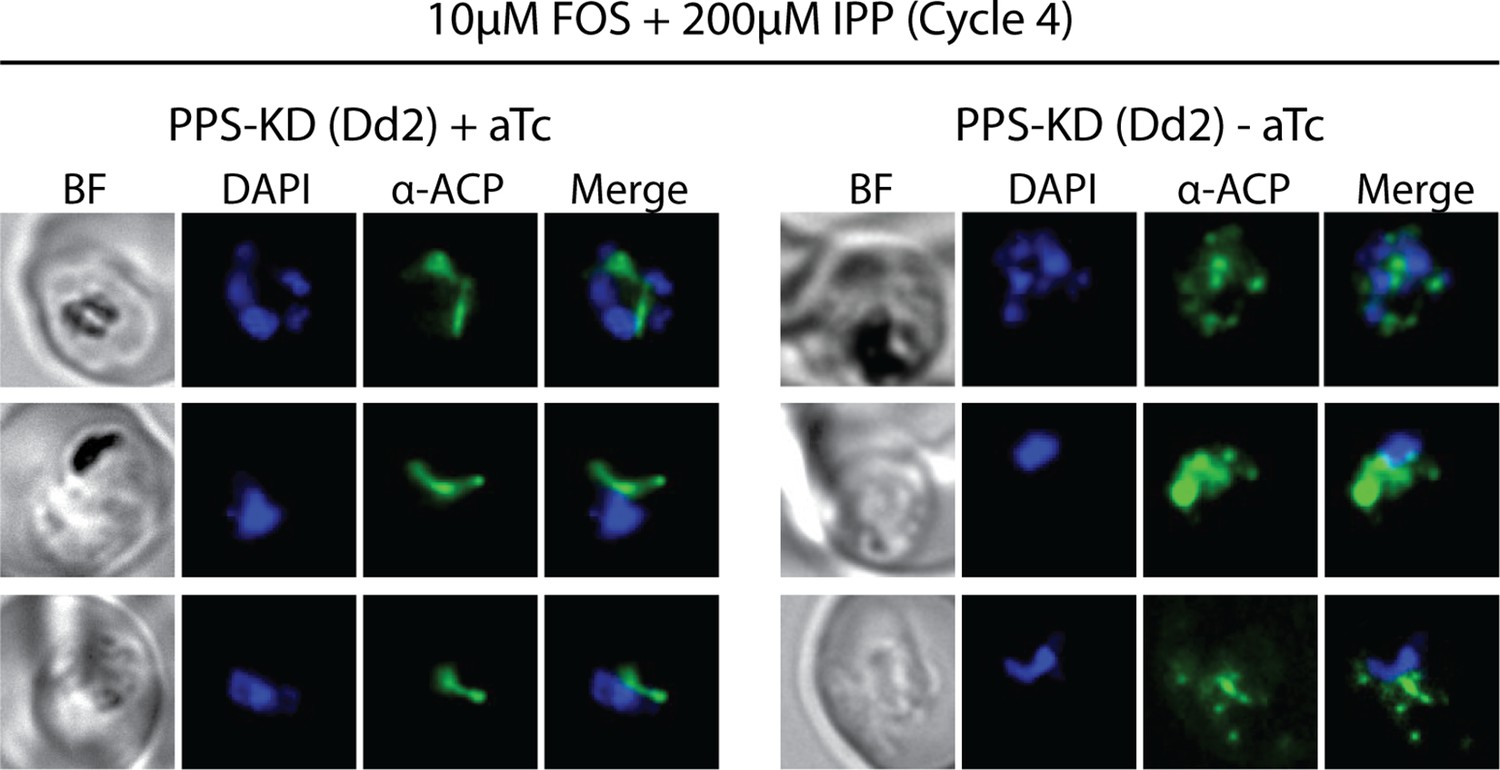
(A) Scheme summarizing growth of synchronized PPS knockdown parasites cultured ±aTc, re-synchronized and treated with 10 µM fosmidomycin (FOS) ±200 µM isopentenyl pyrophosphate (IPP) or 5 µM farnesol (FOH), geranylgeraniol (GGOH), or decaprenol (C50-OH) at 96 hr after initial synchronization, and imaged at 134 and 182 hr after initial synchronization. (B) Immunofluorescence analysis (IFA) of PPS knockdown parasites cultured as described in panel A and imaged at 134 hr (day 6) after initial synchronization to assess apicoplast morphology ±aTc. (C) Population analysis of apicoplast morphology for 50 total parasites imaged for each condition in panel A from two independent experiments. Apicoplast morphologies were scored as punctate (focal), elongated, or disrupted (dispersed); counted; and plotted by histogram as the fractional population with the indicated morphology (UT = untreated). Error bars represent standard deviations from replicate experiments. (D) IFA of PPS knockdown parasites cultured ±aTc + FOS + IPP and imaged at 182 hr (day 8) after initial synchronization to assess apicoplast morphology ±aTc. (E) Population analysis of apicoplast morphology for 50 total parasites imaged for each condition in panel D and analyzed as in panel C. (F) Quantitative PCR analysis of the apicoplast:nuclear (Api:Nu) genome ratio for parasites cultured ±aTc and imaged in panel D, based on amplification of apicoplast TufA (PF3D7_API02900) or nuclear ADSL (PF3D7_0206700) relative to nuclear I5P (PF3D7_0802500) genes. Indicated qPCR ratios were normalized to +aTc in each case and are the average ± SD of three biological replicates. Significance of ±aTc differences was analyzed by two-tailed unpaired t-test to determine the stated p value. All parasite samples collected for IFA were imaged by bright-field (BF) and epifluorescence microscopy, with visualization of parasite nuclei by DAPI staining and apicoplast by an anti-apicoplast acyl carrier protein (ACP) antibody.
-
Figure 7—source data 1
Absolute parasite counts for microscopy experiments.
- https://cdn.elifesciences.org/articles/73208/elife-73208-fig7-data1-v2.xlsx
Figure 7—figure supplement 1
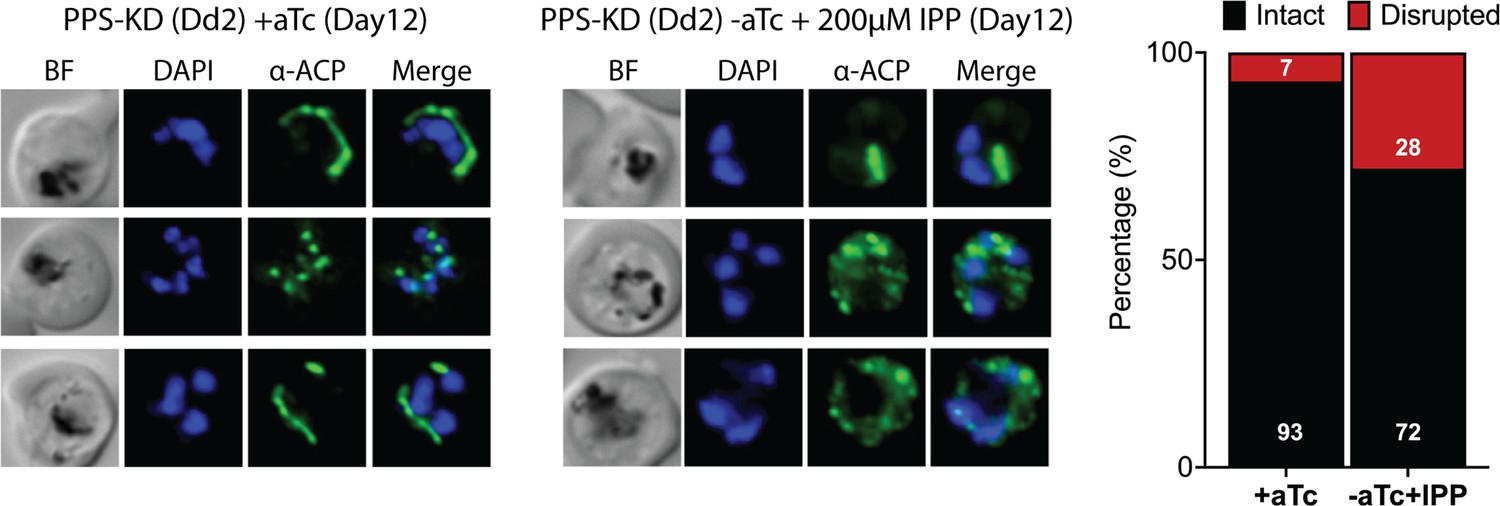
Immunofluorescence analysis (IFA) images and analysis of apicoplast morphology in polyprenyl synthase (PPS) knockdown parasites grown +aTc or -aTc/ + isopentenyl pyrophosphate (IPP) (200 µM) for 12 days.
Figure 7—figure supplement 2
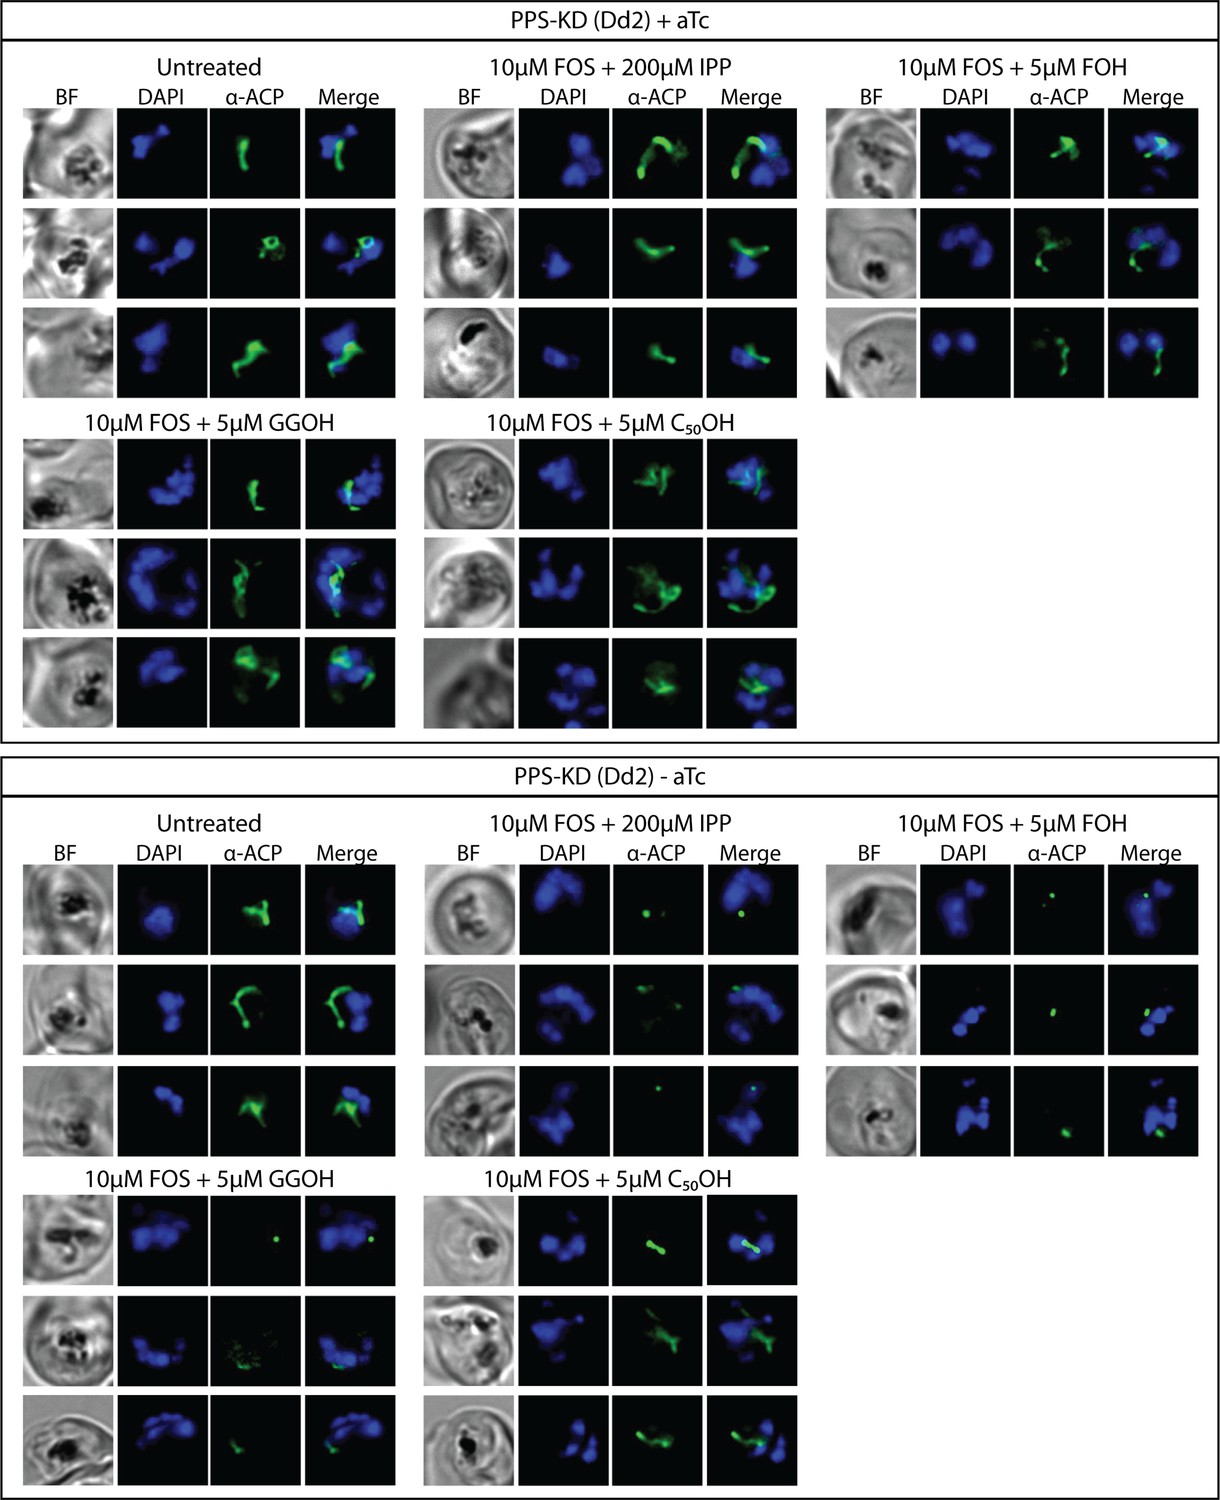
Additional immunofluorescence analysis (IFA) images of polyprenyl synthase (PPS) knockdown parasites treated as in Figure 7B.
Figure 7—figure supplement 3
Additional immunofluorescence analysis (IFA) images of polyprenyl synthase (PPS) knockdown parasites treated as in Figure 7D.
Figure 8 with 4 supplements
No evidence that polyprenyl synthase (PPS) contributes to carotenoid synthesis by Plasmodium falciparum.
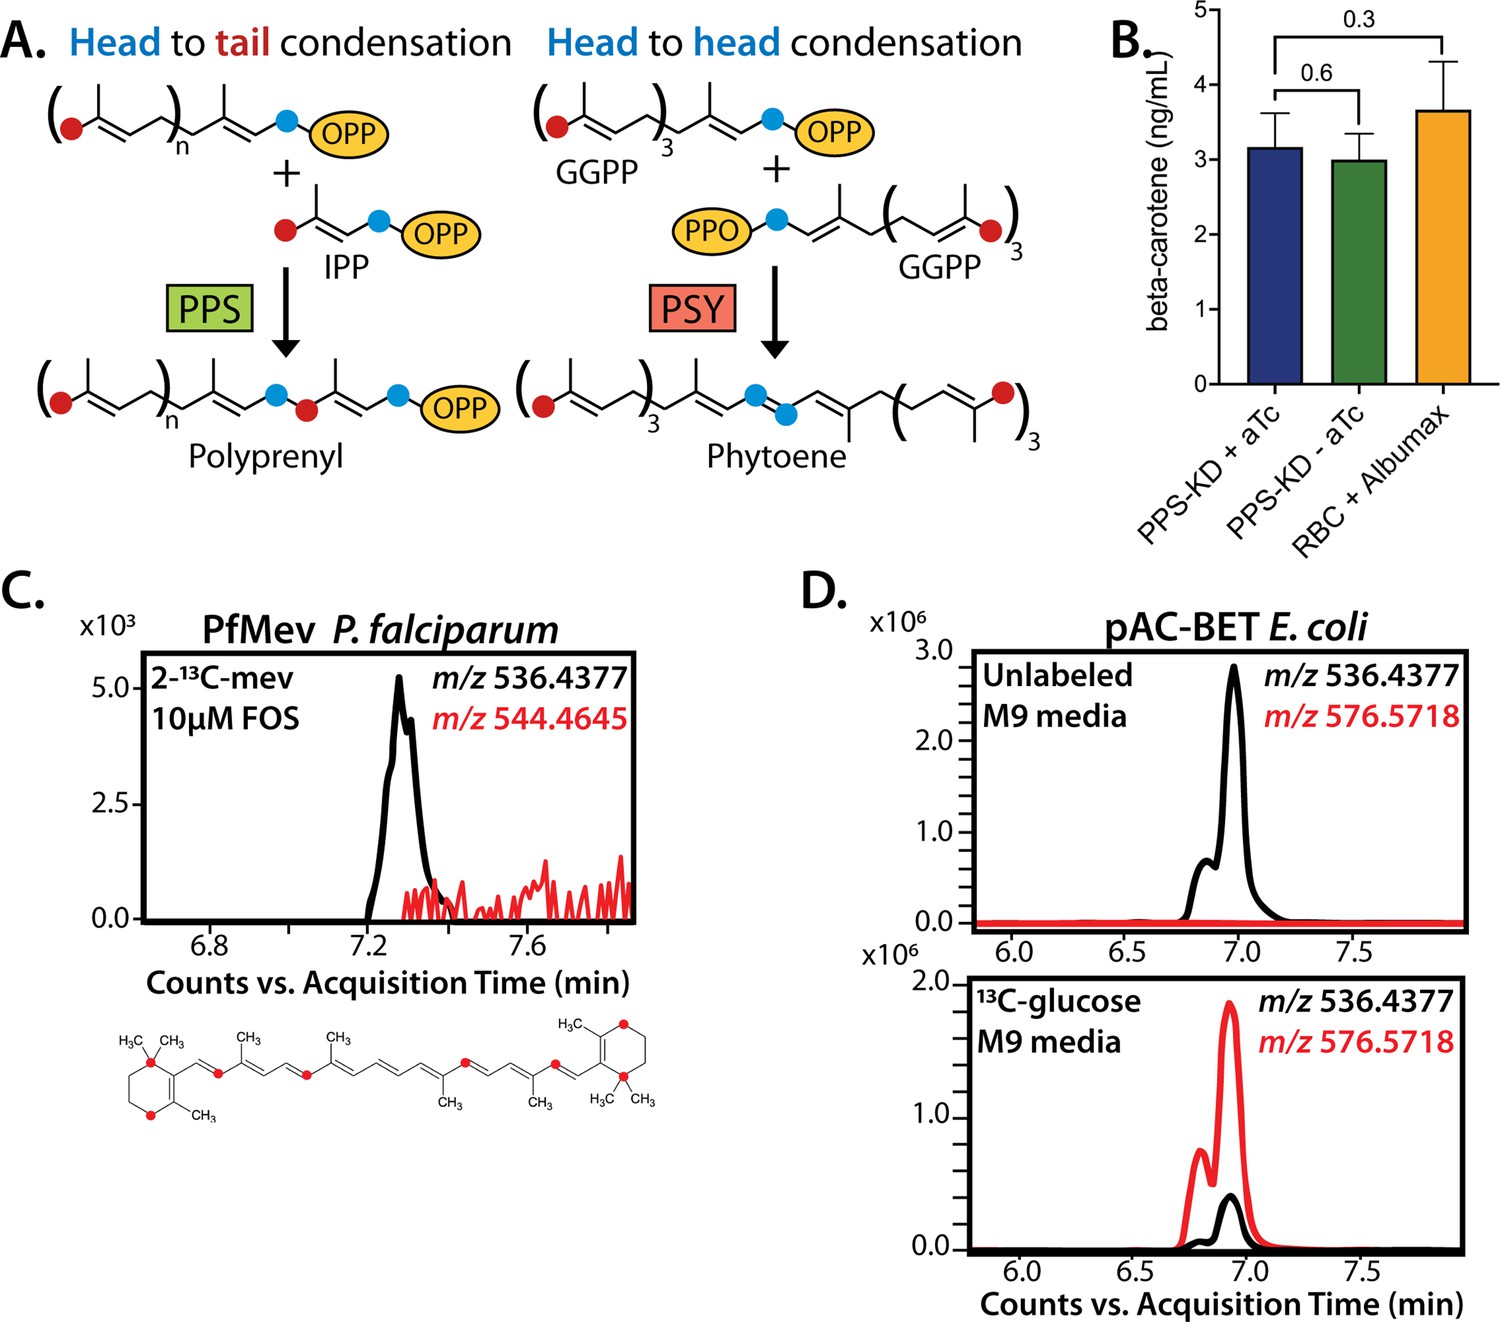
(A) Schematic depiction of head-to-tail arrangement of prenyl groups during polyprenyl-PP synthesis versus head-to-head arrangement of geranylgeranyl-PP groups during phytoene synthesis. (B) Mass spectrometry determination of unlabeled β-carotene levels in PPS knockdown parasites grown for 6 days ± aTc or in uninfected red blood cells incubated in complete media containing Albumax. Measured β-carotene levels are the average ± SD of three biological replicates, whose differences were analyzed by two-tailed unpaired t-test for significance (p values given relative to +aTc sample). (C) Intensity versus retention time plot for liquid chromatography-mass spectrometry determination of unlabeled and 13C-labeled β-carotene in NF54 PfMev parasites cultured for 6 days in 50 µM 2-13C-mevalonate and 10 µM fosmidomycin. Below: schematic depiction of the eight carbon atoms in β-carotene expected to be labeled with 13C for synthesis from isopentenyl pyrophosphate (IPP) derived from 2-13C-mevalonate in PfMev parasites. (D) Intensity versus retention time plot for liquid chromatography-mass spectrometry determination of unlabeled and 13C-labeled β-carotene in pAC-BETAipi Escherichia coli grown in unlabeled or fully 13C-labeled glucose as the sole carbon source in M9 minimal media. The two peaks reflect the presence of an isomeric mix of all-trans and cis β-carotene produced by the pAC-BETAipi E. coli, as previously reported (Cunningham and Gantt, 2005).
Figure 8—figure supplement 1

Forty-eight hour growth inhibition curves for treatment of Dd2 parasites with zaragozic acid without or with episomal expression of polyprenyl synthase (PPS)-RFP or 200 µM isopentenyl pyrophosphate (IPP).
Figure 8—figure supplement 2
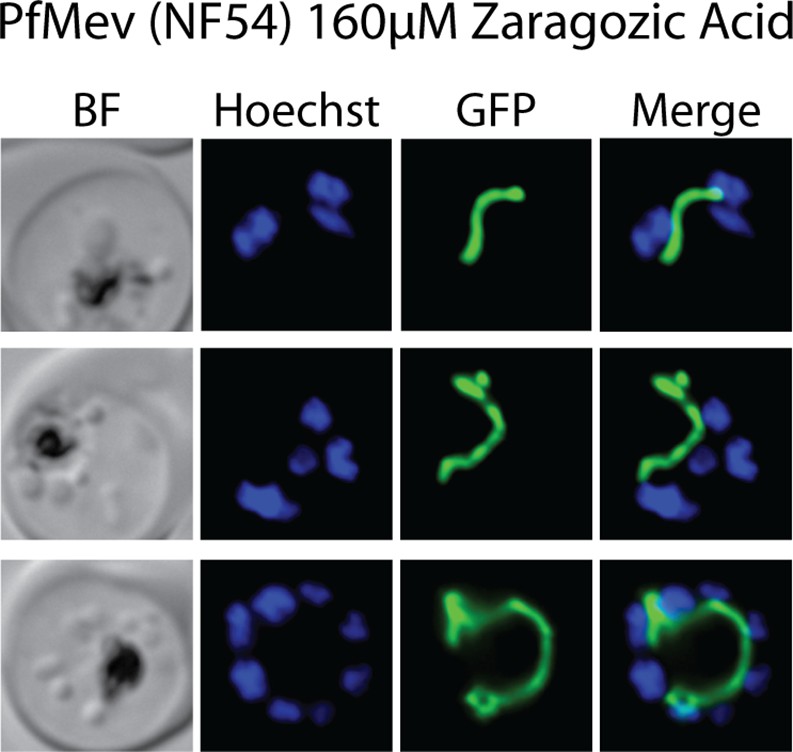
Epifluorescence microscopy images of D10 parasites treated with 160 µM zaragozic acid as synchronized rings and imaged for ACPL-GFP and Hoescht 36 hr later as multinuclear schizonts.
Figure 8—figure supplement 3
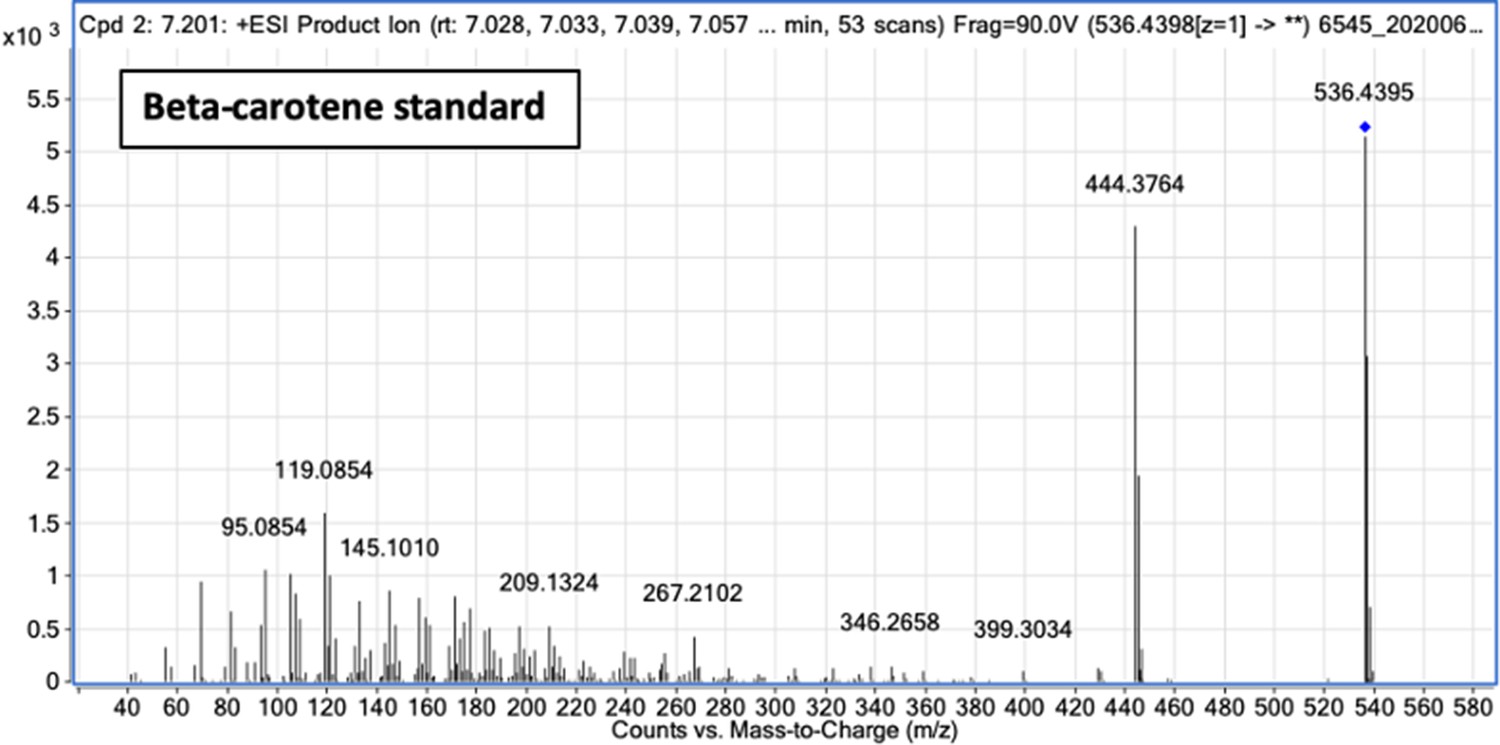
Fragment ion spectrum for unlabeled β-carotene determined by tandem mass spectrometry of β-carotene commercial standard.
Figure 8—figure supplement 4

Intensity versus retention time plot for liquid chromatography-mass spectrometry determination of unlabeled β-carotene in Albumax I.
Figure 9
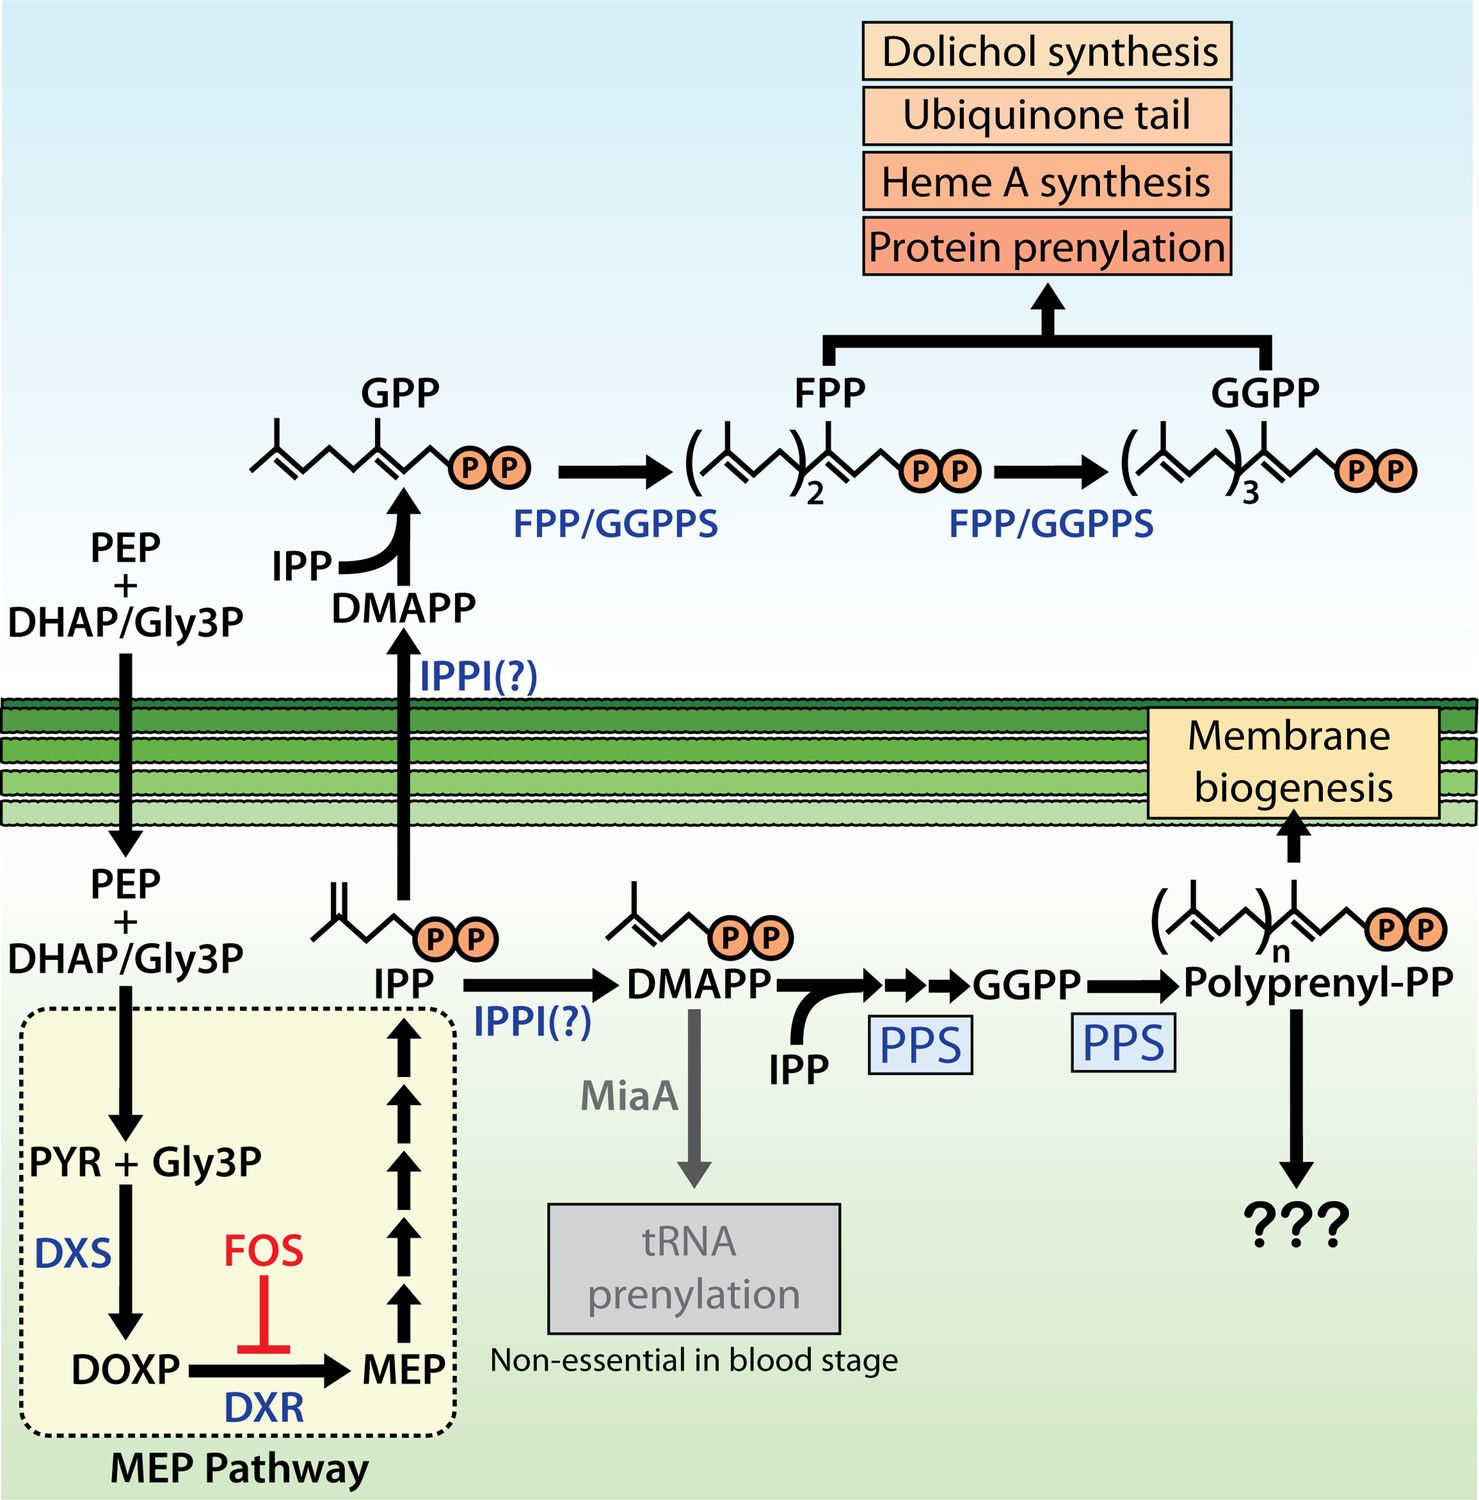
Schematic diagram of apicoplast isoprenoid metabolism in blood-stage Plasmodium falciparum parasites.
IPPI = isopentenyl pyrophosphate (IPP) isomerase, PEP = phosphoenolpyruvate, DHAP = dihydroxyacetone phosphate, PYR = pyruvate, Gly3P = glyceraldehyde-3-phosphate. Question marks indicate uncertainty in the identity of the proposed IPP isomerase and in the role of polyprenyl isoprenoid products of polyprenyl synthase (PPS) in apicoplast biogenesis. For simplicity, we have depicted PPS targeting to the apicoplast matrix. However, further experiments will be needed to test and specify sub-organellar targeting of PPS to the apicoplast matrix and/or intermembrane spaces.
Tables
Key resources table
| Reagent type (species) or resource | Designation | Source or reference | Identifiers | Additional information |
|---|---|---|---|---|
| Cell line (Plasmodium falciparum) | D10ACPL-GFP | PMID:10775264 | ||
| Cell line (Plasmodium falciparum) | NF54-PfMevACPL-GFP | PMID:32059044 | ||
| Cell line (Plasmodium falciparum) | NF54-PfMev∆DXS | PMID:32815516 | ||
| Cell line (Plasmodium falciparum) | Dd2PPS-RFP (pTyEOE) | This study | Described in Materials and methods. Can be obtained from Sigala lab. | |
| Cell line (Plasmodium falciparum) | Dd2PPS-GFP (pTEOE) | This study | Described in Materials and methods. Can be obtained from Sigala lab. | |
| Cell line (Plasmodium falciparum) | Dd2PPS-HA/FLAG9xAptamer/ TetR-DOZI | This study | Described in Materials and methods. Can be obtained from Sigala lab. | |
| Cell line (Plasmodium falciparum) | NF54-PfMevMiaA-KO | This study | Described in Materials and methods. Can be obtained from Prigge lab. | |
| Cell line(Escherichia coli) | Top10pAC-BETAipi | PMID:15659105 | ||
| Software, algorithm | Prism | GraphPad | RRID: SCR_002798 | |
| Chemical compound, drug | Doxycycline | Sigma-Aldrich | Cat. No. D3447 | |
| Chemical compound, drug | Fosmidomycin | Invitrogen Life Technologies | Cat. No. F23103 | |
| Chemical compound, drug | Isopentenyl pyrophosphate | Isoprenoids | Cat. No. IPP001 | |
| Chemical compound, drug | Farnesol | Sigma-Aldrich | Cat. No. F203 | |
| Chemical compound, drug | Geranylgeraniol | Sigma-Aldrich | Cat. No. G3278 | |
| Chemical compound, drug | Decaprenol | Isoprenoids | Cat. No. polyprenol C50 | |
| Chemical compound, drug | DL-mevalonolactone | Cayman Chemicals | Cat. No. 20348 | |
| Chemical compound, drug | Zaragozic acid | Cayman Chemicals | Cat. No.17452 | |
| Chemical compound, drug | MMV019313 | ChemDiv | Cat. No. C498-0579 | |
| Chemical compound, drug | β-Carotene | Sigma-Aldrich | Cat. No. F203 | |
| Antibody | Anti-EF1α(rabbit polyclonal) | PMID:11251817 | (1:1000) | |
| Antibody | Anti-ACP(rabbit polyclonal) | PMID:19768685 | (1:1000) | |
| Antibody | Anti-GFP (3E6)(mouse, monoclonal) | Invitrogen Life Technologies | Cat. No. A11120 | (1:1000) |
| Antibody | Anti-RFP (RF5R)(mouse monoclonal) | Invitrogen Life Technologies | Cat. No. MA5-15257 | (1:1000) |
| Antibody | Anti-GFP(goat, polyclonal) | Abcam | Cat. No.Ab5450 | (1:1000) |
| Antibody | Anti-HA (3F10)(rat, monoclonal) | Roche | Cat. No. 11 867 423 001 | (1:1000) |
Additional files
-
Transparent reporting form
- https://cdn.elifesciences.org/articles/73208/elife-73208-transrepform1-v2.docx
-
Supplementary file 1
Primers used in this study.
- https://cdn.elifesciences.org/articles/73208/elife-73208-supp1-v2.docx
Download links
A two-part list of links to download the article, or parts of the article, in various formats.
Downloads (link to download the article as PDF)
Open citations (links to open the citations from this article in various online reference manager services)
Cite this article (links to download the citations from this article in formats compatible with various reference manager tools)
Critical role for isoprenoids in apicoplast biogenesis by malaria parasites
eLife 11:e73208.
https://doi.org/10.7554/eLife.73208


