The IRE1/XBP1 signaling axis promotes skeletal muscle regeneration through a cell non-autonomous mechanism
- Department of Pharmacological and Pharmaceutical Sciences, University of Houston, United States
- Kinesiology Department, St Ambrose University, United States
- Division of Cell Medicine, Department of Life Science, Medical Research Institute, Kanazawa Medical University, Japan
Figures
Figure 1 with 1 supplement

IRE1α is required for muscle regeneration.
(A) Left side TA muscle of wild-type mice was injected with 50 µl of 1.2 % BaCl2 solution, whereas contralateral TA muscle was injected with normal saline to serve as uninjured control. After 5d, the TA muscles were harvested and analyzed by performing western blotting. Representative immunoblots presented here demonstrate the levels of p-IRE1, IRE1, and sXBP1 protein in uninjured and injured TA muscle. Ponceau S staining confirmed equal loading of protein in each lane (n = 4 mice per group). (B) Immunoblots presented here show levels of IRE1α protein in TA and soleus muscle and liver of Ern1fl/fl and Ern1cKO mice. GAPDH was used as loading control (n = 3 mice per group). (C) Representative photomicrographs of Hematoxylin and Eosin (HE)-stained sections of TA muscles of Ern1fl/fl and Ern1cKO mice at days 0, 5, and 14 after intramuscular injection of BaCl2 solution. Scale bar: 50 µm. Quantification of average myofiber (D) cross-sectional area (CSA) (n = 9 mice per group) and (E) Minimal Feret’s diameter in TA muscle at day 5 post-injury (n = 6-8 mice per group). (F) Average myofiber CSA in TA muscle of Ern1fl/fl and Ern1cKO mice after 14 days of BaCl2-mediated injury (n = 3 mice per group). (G) Percentage of myofibers containing two or more centrally located nuclei in TA muscle at day 5 (n = 4 mice per group) and day 14 (n = 3 mice per group) after BaCl2-mediated injury. After 21 days of first injury, TA muscle of Ern1fl/fl and Ern1cKO mice was again given intramuscular injection of 50 µl of 1.2 % BaCl2 solution, and the muscle was analyzed at day 5. Representative photomicrograph of (H) H&E-stained TA muscle sections and quantitative estimation of (I) average myofiber CSA and (J) percentage of myofibers containing two or more centrally located nuclei. Scale bar: 50 µm. n = 3 mice per group. Data are presented as mean ± SEM. *p ≤ 0.05, values significantly different from corresponding injured TA muscle of Ern1fl/fl mice by unpaired t test.
Figure 1—figure supplement 1
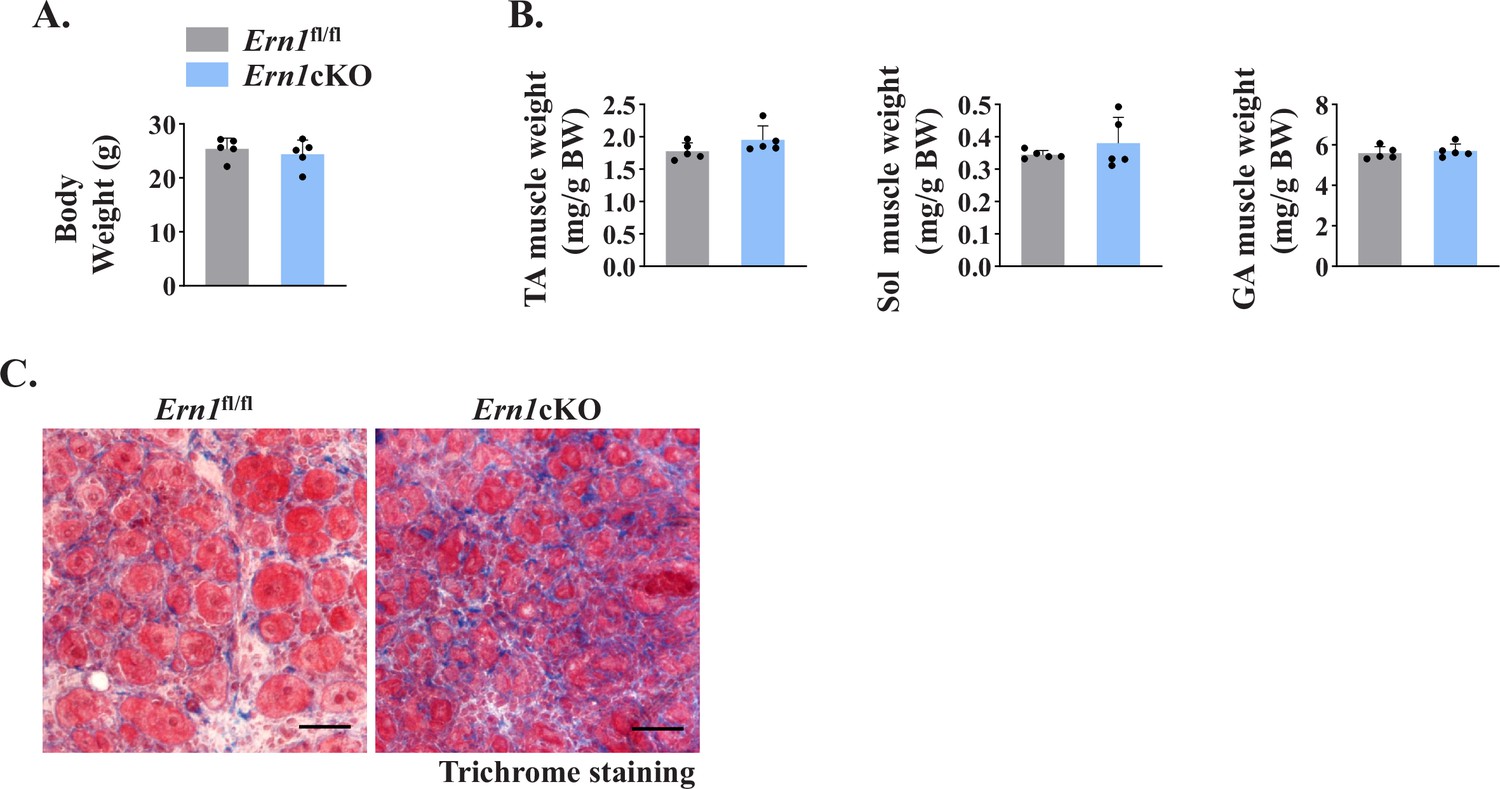
Myofiber-specific Ern1 gene deletion delays skeletal muscle regeneration in adult mice.
(A) Average body weight and (B) average wet weight of tibialis anterior (TA), soleus (Sol), and gastrocnemius (GA) muscle normalized with body weight (BW) of 3-month-old Ern1fl/fl and Ern1cKO mice.(C) After 21 days of first injury, TA muscle of Ern1fl/fl and Ern1cKO mice again given intramuscular injection of 1.2 % BaCl2 solution, and the muscle was analyzed after 5 days. Representative photomicrograph of TA muscle sections after Masson’s trichrome staining. Scale bar: 50 µm. n = 3 mice per group.
Figure 2
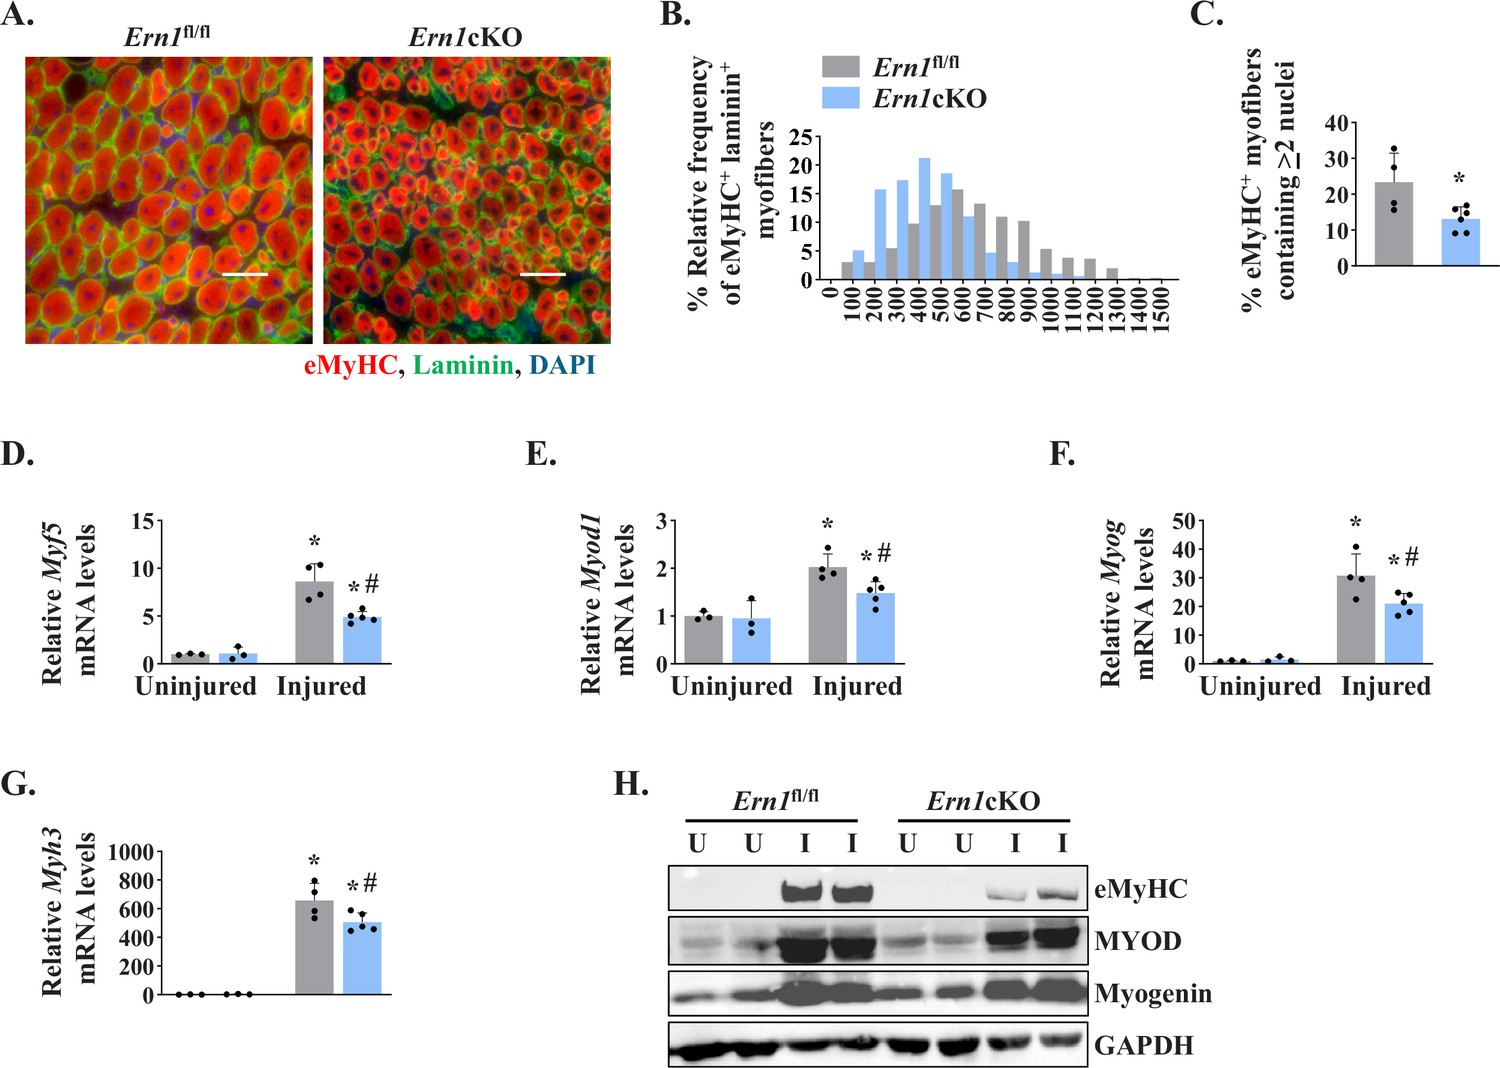
Myofiber-specific ablation of IRE1α inhibits early markers of muscle regeneration.
(A) Representative photomicrographs of 5d-injured TA muscle sections of Ern1fl/fl and Ern1cKO mice after immunostaining for eMyHC (red) and laminin (green) protein. Nuclei were counterstained with DAPI (blue). (B) Frequency distribution of eMyHC+ Laminin+ myofiber CSA in 5d-injured TA muscle of Ern1cKO and Ern1fl/fl mice (n = 4 for Ern1fl/fl and n = 3 for Ern1cKO group). (C) Percentage of eMyHC+ myofibers with two or more centrally located nuclei in 5d-injured TA muscle sections of Ern1fl/fl and Ern1cKO mice (n = 4 for Ern1fl/fl and n = 6 for Ern1cKO group). Data expressed as mean ± SEM. *p ≤ 0.05, values significantly different from 5d-injured TA muscle of Ern1fl/fl mice by unpaired t test. Relative mRNA levels of (D) Myf5, (E) Myod1, (F) Myog, and (G) Myh3 in uninjured and 5d-injured TA muscle of Ern1fl/fl and Ern1cKO mice. n = 3-5 mice per group (H) Representative western blot showing levels of eMyHC, MyoD, myogenin, and GAPDH in uninjured and 5d-injured TA muscle of Ern1fl/fl and Ern1cKO mice (n = 3 for Uninjured Ern1fl/fl, n = 3 for Uninjured Ern1cKO, n = 4 for Injured Ern1fl/fl and n = 5 for Injured Ern1cKO group). Data are presented as mean ± SEM and analyzed by one-way analysis of variance (ANOVA) followed by Tukey’s multiple comparison test. *p ≤ 0.05, values significantly different from contralateral uninjured TA muscle of Ern1fl/fl or Ern1cKO mice. #p ≤ 0.05, values significantly different from 5d-injured TA muscle of Ern1fl/fl mice. U, uninjured; I, injured.
Figure 3
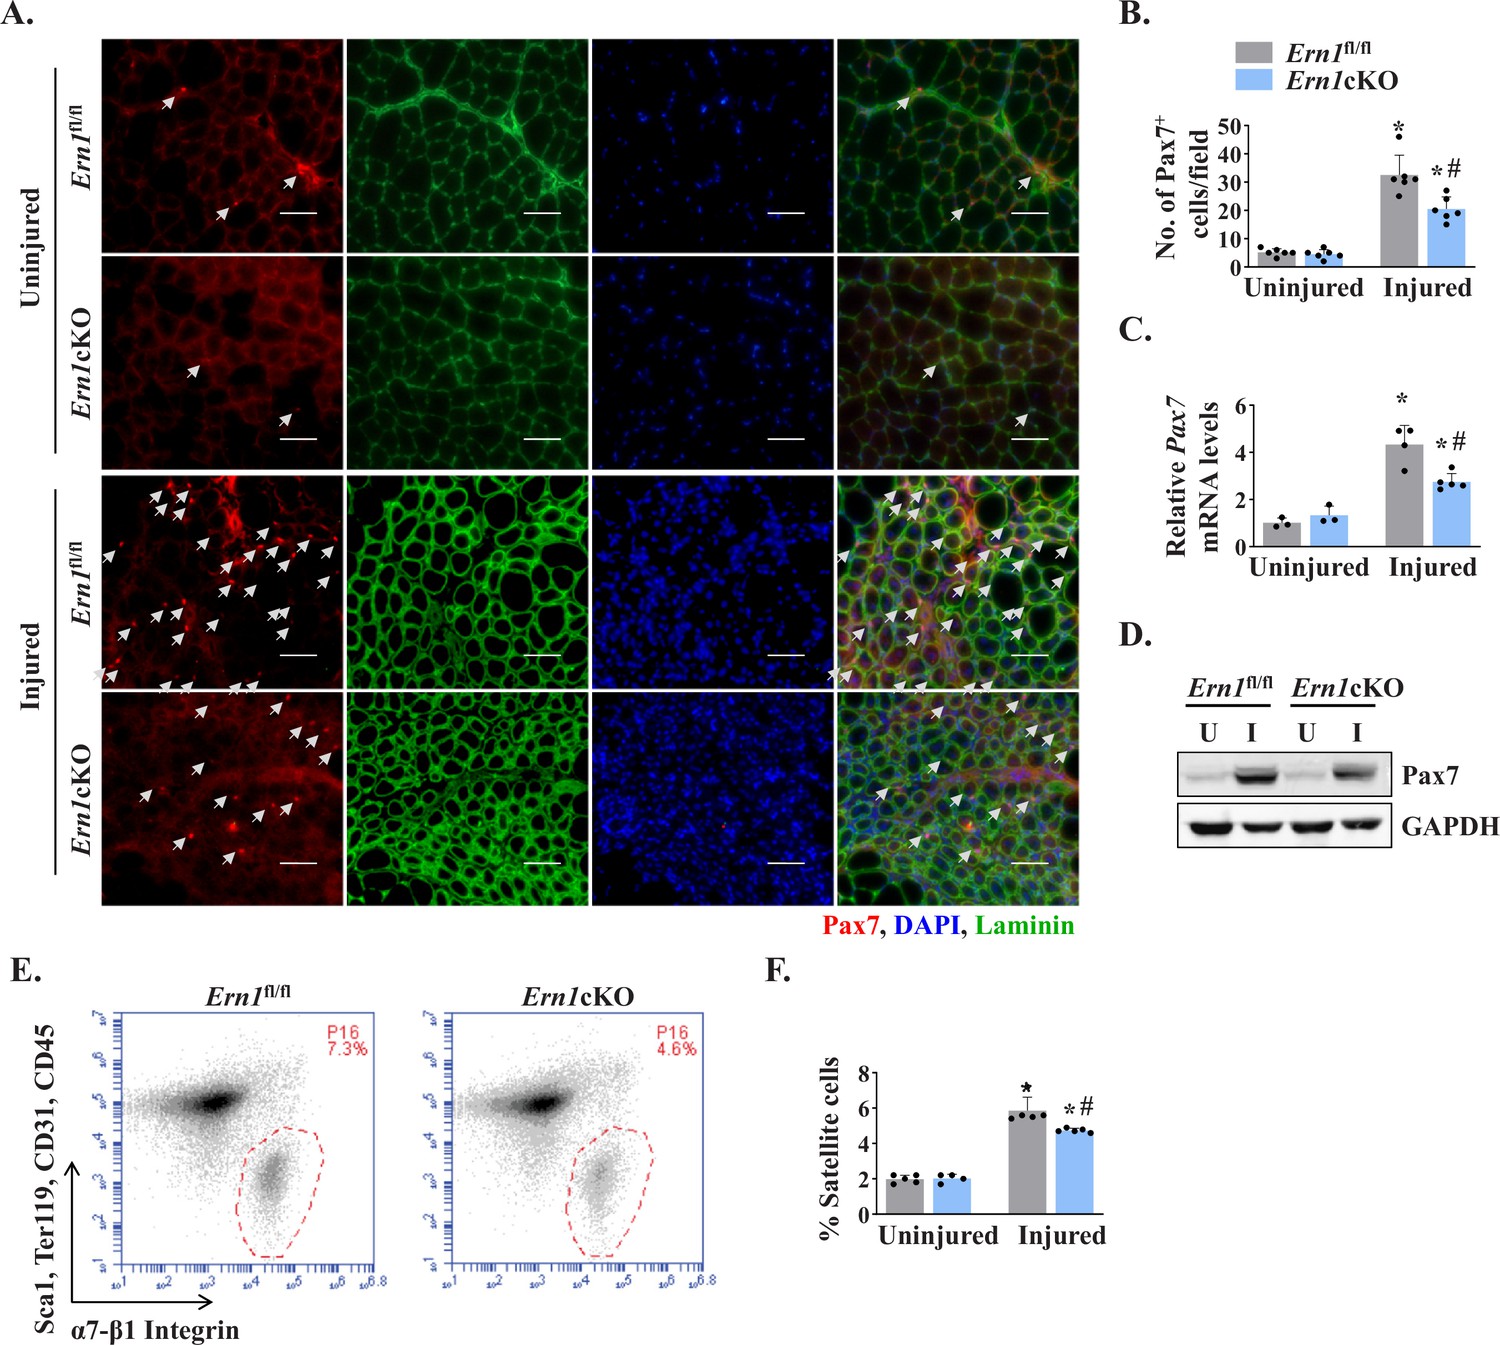
Myofiber-specific ablation of IRE1α reduces abundance of satellite cells in injured muscle.
(A) Representative photomicrographs of uninjured and 5d-injured TA muscle sections of Ern1fl/fl and Ern1cKO mice after immunostaining for Pax7 (red) and laminin (green) protein. Nuclei were identified by staining with DAPI. Scale bar: 50 µm. White arrows point to Pax7+ satellite cells. (B) Average number of Pax7+ cells per field (∼0.15 mm2) in uninjured and 5d-injured TA muscle of Ern1fl/fl and Ern1cKO mice. n = 6 mice per group. (C) Relative mRNA levels of Pax7 in uninjured and 5d-injured TA muscle of Ern1fl/fl and Ern1cKO mice assayed by performing qPCR (n = 3-5 mice in each group). (D) Representative immunoblots showing levels of Pax7 and unrelated protein GAPDH in uninjured and 5d-injured TA muscle of Ern1fl/fl and Ern1cKO mice. (E) Primary mononuclear cells were isolated from TA muscle of Ern1fl/fl and Ern1cKO mice and subjected to FACS analysis for satellite cells. Representative FACS dot plots demonstrating the percentage of α7-integrin+ cells in 5d-injured TA muscle of Ern1fl/fl and Ern1cKO mice. (F) Quantification of α7-integrin+ satellite cells in uninjured and 5d-injured TA muscle of Ern1fl/fl and Ern1cKO mice assayed by FACS (n = 4 or 5 mice in each group). Data are expressed as mean ± SEM and analyzed by one-way analysis of variance (ANOVA) followed by Tukey’s multiple comparison test. *p ≤ 0.05, values significantly different from contralateral uninjured TA muscle of Ern1fl/fl or Ern1cKO mice. #p ≤ 0.05, values significantly different from 5d-injured TA muscle of Ern1fl/fl mice. U, uninjured; I, injured.
Figure 4 with 1 supplement
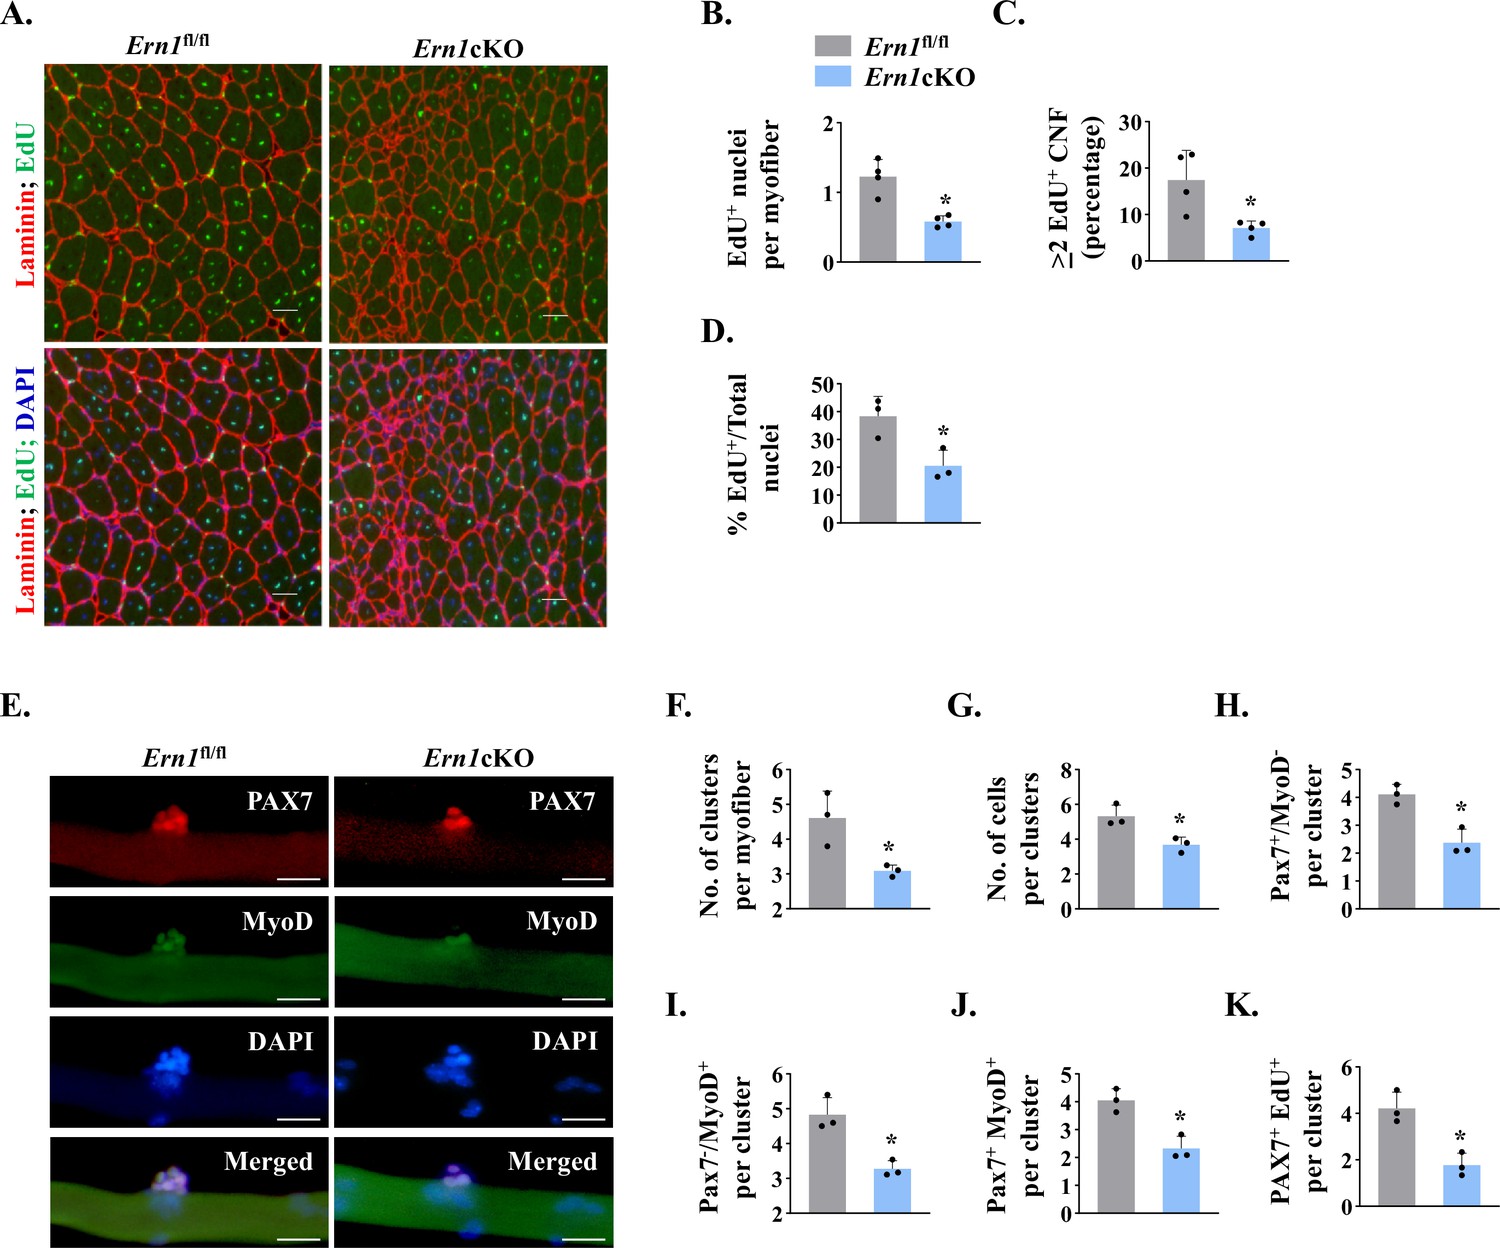
IRE1α promotes proliferation of satellite cells.
(A) Left side TA muscle of Ern1fl/fl and Ern1cKO mice was given intramuscular injection of 1.2 % BaCl2 solution. After 3 days, the mice were given an intraperitoneal injection of EdU and 11 days later, the TA muscles were collected and muscle sections prepared were stained to detect EdU, laminin, and nuclei. Representative photomicrographs of TA muscle sections after EdU, anti-laminin, and DAPI staining are presented here. Scale bar: 50 µm. (B) Average number of EdU+ nuclei per myofiber, (C) percentage of myofibers containing two or more centrally located EdU+ nuclei (D) percentage of EdU+ nuclei to total nuclei in TA muscle of Ern1fl/fl and Ern1cKO mice (n = 3-4 mice per group). Data are presented as mean ± SEM. *p ≤ 0.05, values significantly different from corresponding TA muscle of Ern1fl/fl mice by unpaired t test. (E) Single myofibers were isolated from the EDL muscle of Ern1fl/fl and Ern1cKO mice and cultured for 72 hr. Representative images of myofiber-associated cells after immunostaining for Pax7 (red) and MyoD (green) protein. Nuclei were counterstained with DAPI (blue). Scale bar: 20 μm. Average number of (F) cellular clusters per myofiber, (G) cells per cluster, (H) Pax7+/MyoD- cells per cluster, (I) Pax7-/MyoD+ cells per cluster, and (J) Pax7+/MyoD+ cells per cluster in Ern1fl/fl and Ern1cKO cultures. (K) In a separate experiment, single myofibers after being cultured for 72 hr were pulse labelled with EdU for 90 min and then immunostained for Pax7 protein and detection of EdU incorporation. Average number of Pax7+/EdU+ cells per cluster on Ern1fl/fl and Ern1cKO myofibers (n = 3 mice per group). Data are presented as mean ± SEM. *p ≤ 0.05, values significantly different from myofiber cultures prepared from Ern1fl/fl mice.
Figure 4—figure supplement 1
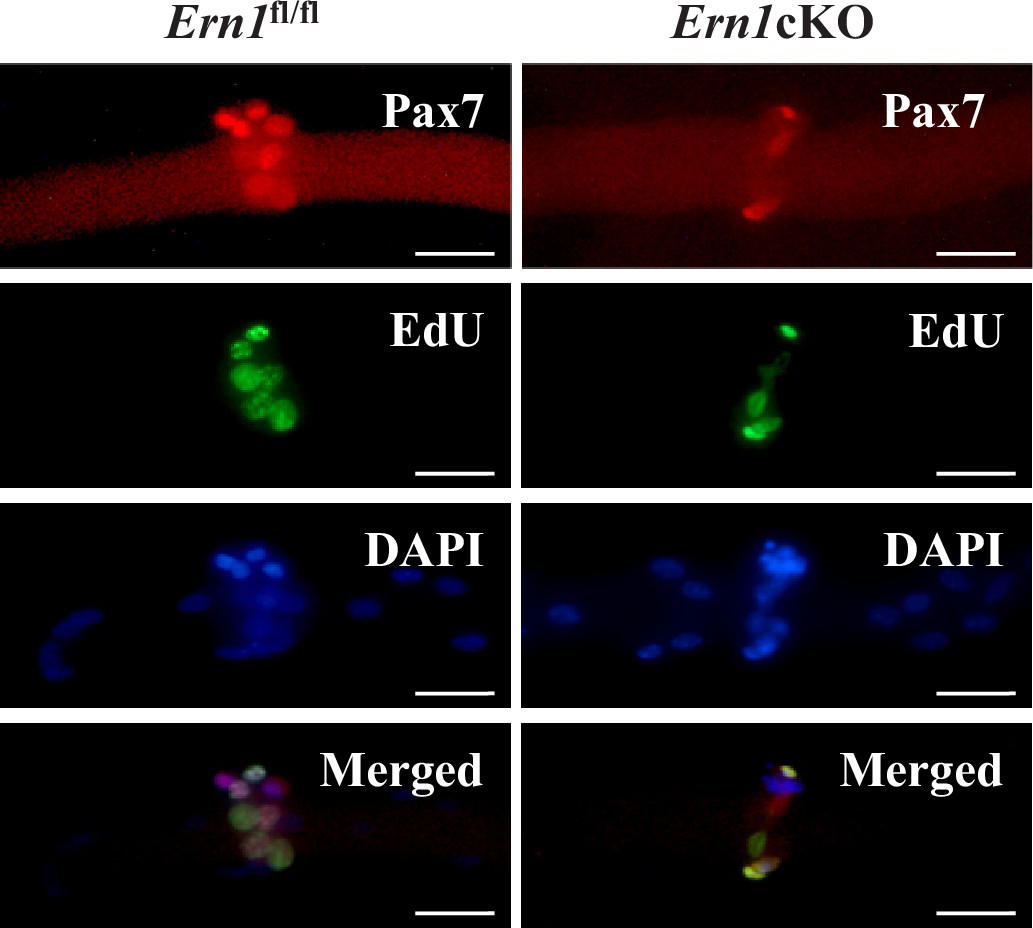
Deletion of Ern1 gene inhibits proliferation of myofiber-associated satellite cells.
Single myofibers were isolated from the EDL muscle of Ern1fl/fl and Ern1cKO mice and cultured for 72 hr. Following pulse labelling with EdU for 90 min, the myofibers were immunostained for Pax7 protein and EdU. Representative images of myofibers immunostained for Pax7 (red) and EdU (green). Nuclei were counterstained with DAPI (blue). Scale bar: 20 μm.
Figure 5 with 1 supplement
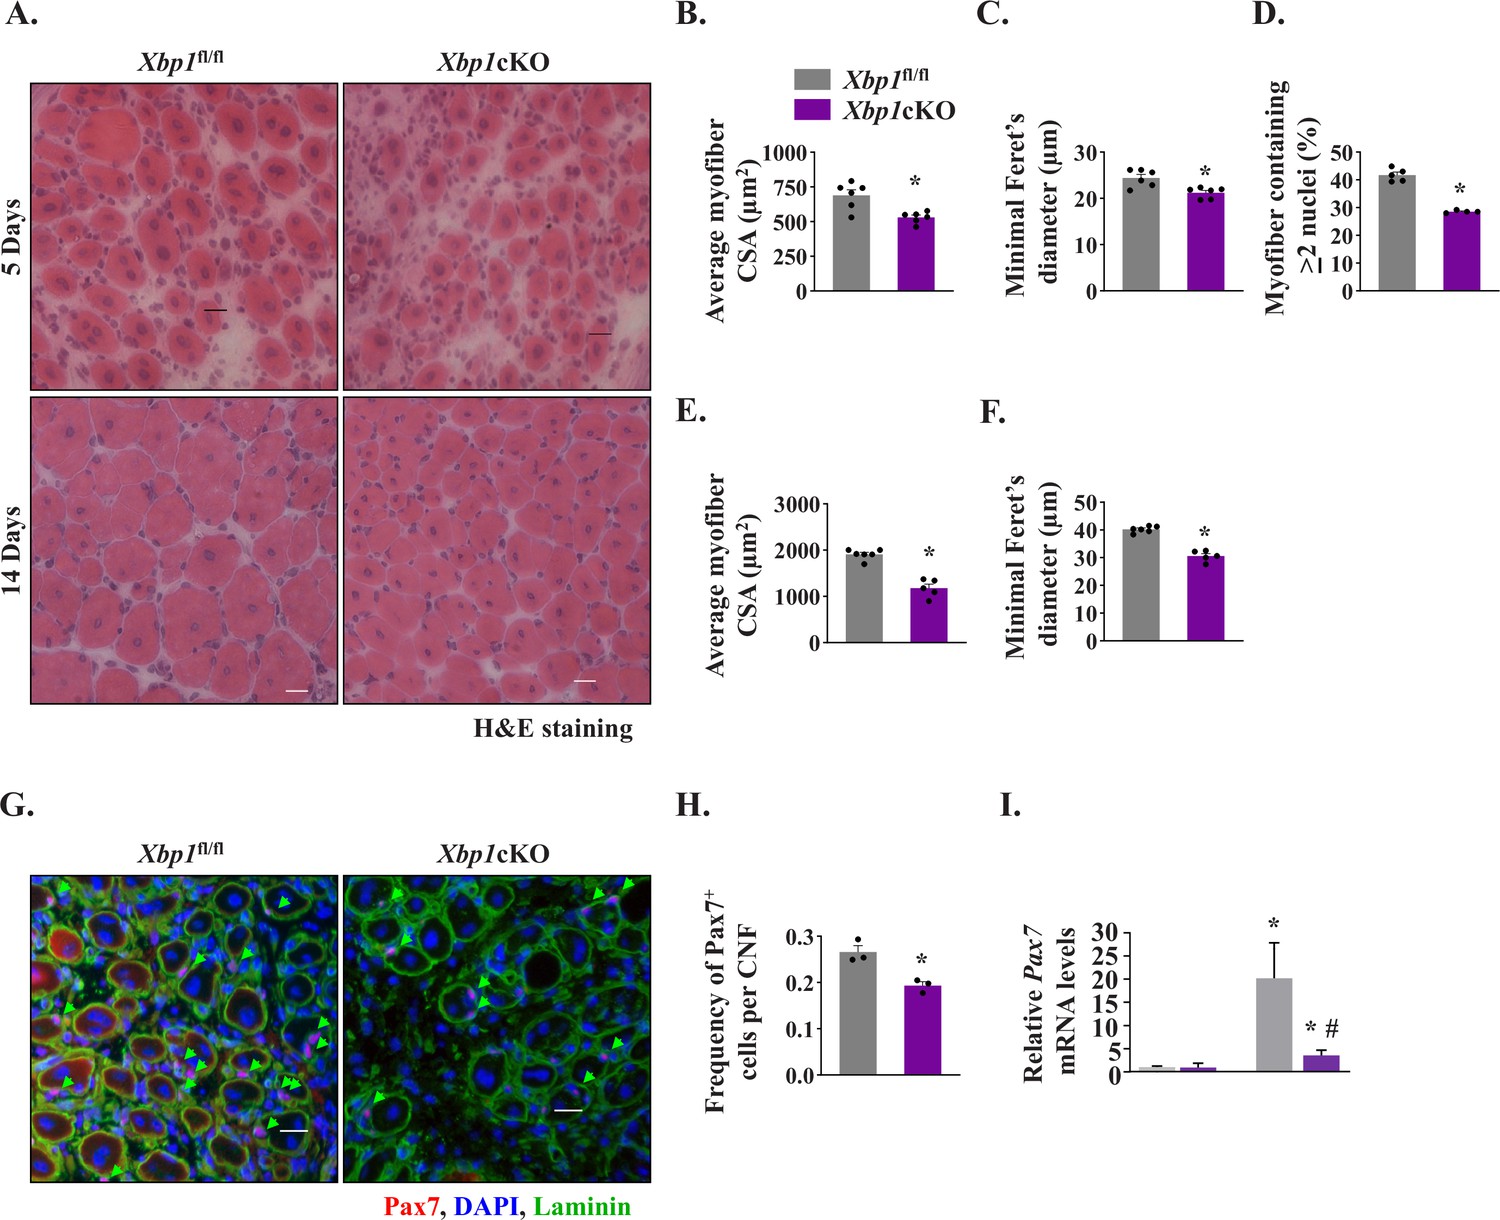
Myofiber-specific ablation of XBP1 in mice inhibits skeletal muscle regeneration.
Left side TA muscle of Xbp1fl/fl and Xbp1cKO mice was injured by intramuscular injection of 50 µl of 1.2 % BaCl2 solution whereas right side TA muscle was injected with saline and served as control. The muscles were harvested at day 5 and 14 post-BaCl2 injection. (A) Representative photomicrographs of H&E-stained sections of 5d- and 14d-injured TA muscle of Xbp1fl/fl and Xbp1cKO mice. Scale bar: 20 µm. Quantification showing (B) Average myofiber CSA (n = 4-6 mice per group) (C) average minimal Feret’s diameter (n = 4-6 mice per group), and (D) Percentage of myofibers containing two or more centrally located nuclei in TA muscle sections of Xbp1fl/fl and Xbp1cKO mice at day 5 post-injury. Quantification of average (E) myofiber CSA and (F) minimal Feret’s diameter in TA muscle of Xbp1fl/fl and Xbp1cKO mice at day 14 post-injury. (n = 4-5 mice per group) (G) Representative photomicrographs of 5d-injured TA muscle sections from Xbp1fl/fl and Xbp1cKO mice after immunostaining for Pax7 (red) and laminin (green) protein. Nuclei were stained with DAPI (blue). Scale bar: 20 µm. (H) Average number of Pax7+ cells per centrally nucleated myofiber in 5d-injured TA muscle of Xbp1fl/fl and Xbp1cKO mice. n = 3 mice per group. Data are presented as mean ± SEM. *P ≤ 0.05, values significantly different from Xbp1fl/fl mice. (I) Relative levels of Pax7 mRNA in uninjured and 5d-injured TA muscle of Xbp1fl/fl and Xbp1cKO mice. n = 3 per group. Data are presented as mean ± SEM and analyzed by one-way analysis of variance (ANOVA) followed by Tukey’s multiple comparison test. *p ≤ 0.05, values significantly different from uninjured TA muscle of Xbp1fl/fl mice. #p ≤ 0.05, values significantly different from 5d-injured TA muscle of Xbp1fl/fl mice.
Figure 5—figure supplement 1
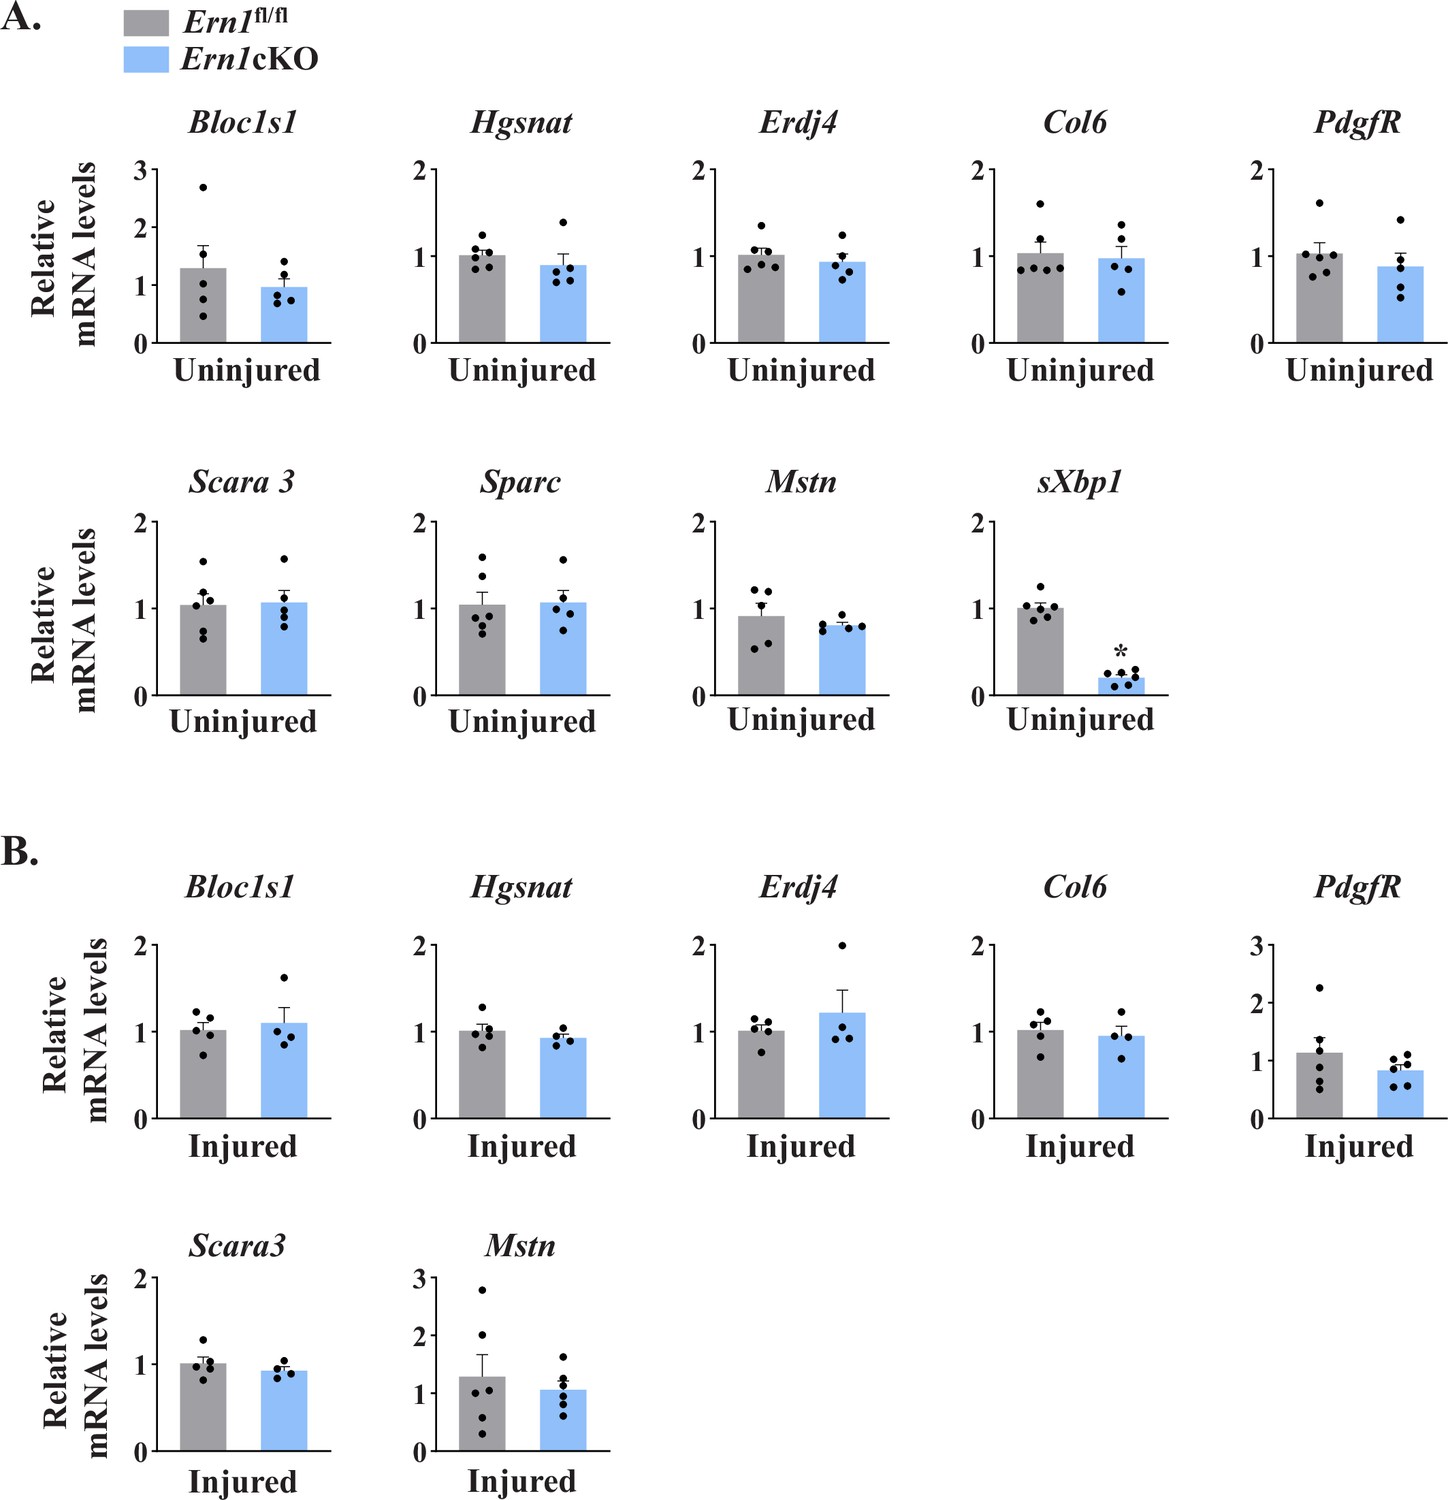
Myofiber-specific deletion of Ern1 does not affect RIDD pathway in skeletal muscle.
(A) Relative mRNA levels of Bloc1s1, Hgsnat, Erdj4, Col6, PdgfR, Scara3, Sparc, Mstn, and sXbp1 in uninjured TA muscle of Ern1fl/fl and Ern1cKO mice (n = 5-6 mice per group).(B) Relative mRNA levels of Bloc1s1, Hgsnat, Erdj4, Col6, PdgfR, Scara3, and Mstn in 5d-injured TA muscle of Ern1fl/fl and Ern1cKO mice (n = 4-6 mice per group). Data are presented as mean ± SEM. *p ≤ 0.05, values significantly different from corresponding uninjured or injured TA muscle of Ern1fl/fl mice.
Figure 6 with 1 supplement
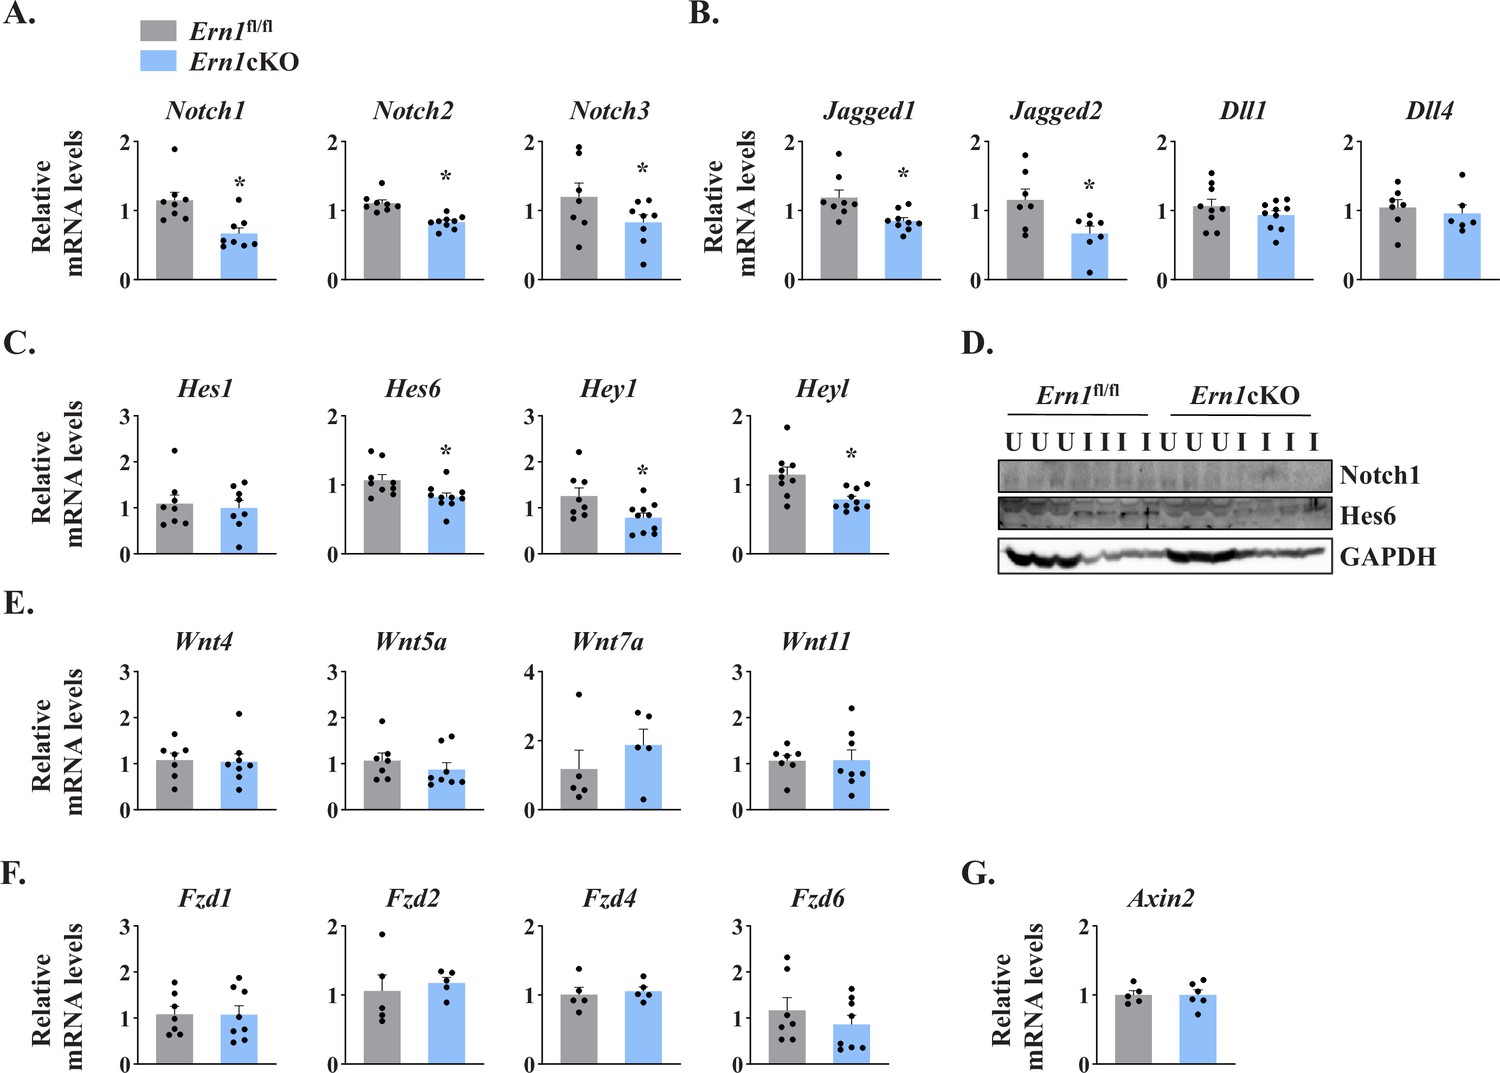
IRE1α regulates Notch signaling during skeletal muscle regeneration.
TA muscle of Ern1fl/fl and Ern1cKO mice were injected with 1.2 % BaCl2 solution. After 5d, the muscles were isolated and processed for qPCR and western blot analysis. Relative mRNA levels of (A) Notch receptors Notch1, Notch2, and Notch3; (B) Notch ligands Jagged1, Jagged2, Dll1, and Dll4; and (C) Notch targets Hes1, Hes6, Hey1, and Heyl in 5d-injured TA muscle of Ern1fl/fl and Ern1cKO mice (n = 6–9 mice per group). (D) Immunoblot presented here demonstrate protein levels of Notch1, Hes6, and unrelated protein GAPDH in uninjured and 5d-injured TA muscle of Ern1fl/fl and Ern1cKO mice. Relative mRNA levels of (E) Wnt ligands Wnt4, Wnt5A, Wnt7A and Wnt11; (F) Wnt receptors Fzd1, Fzd2, Fzd4, and Fzd6, and (G) Wnt targets Axin2 in 5d-injured TA muscle of Ern1fl/fl and Ern1cKO mice (n = 5-7 per group). Data are presented as mean ± SEM. *p ≤ 0.05, values significantly different from corresponding 5d-injured TA muscle of Ern1fl/fl mice.
Figure 6—figure supplement 1

Role of IRE1α in expression of satellite cell growth factors.
Relative mRNA levels of Igf1, Fgf1, Fgf2, Hgf, and Sdf1 in 5d-injured TA muscle of Ern1fl/fl and Ern1cKO mice (n = 4–8 mice per group). Data are presented as mean ± SEM. *p ≤ 0.05, values significantly different from 5d-injured TA muscle of Ern1fl/fl mice.
Figure 7
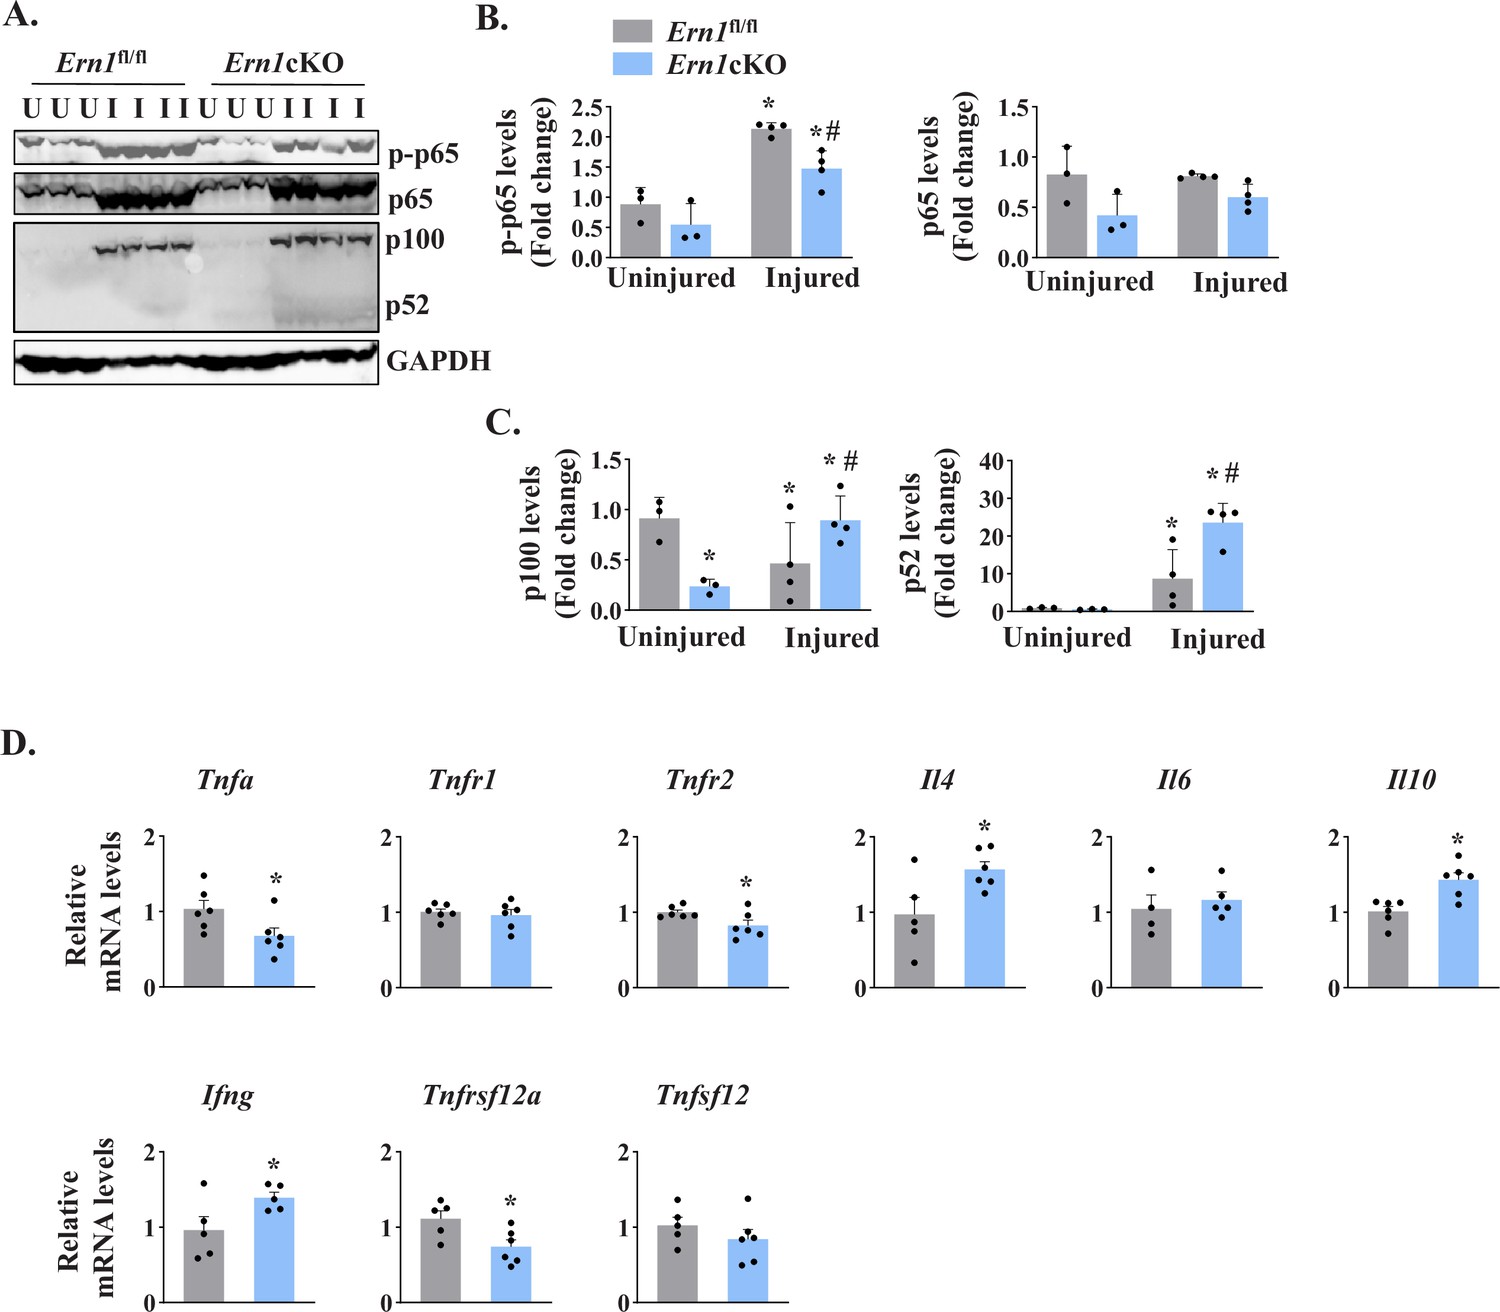
IRE1α regulates NF-κB signaling in regenerating myofibers.
Left side TA muscle of Ern1fl/fl and Ern1cKO mice was given intramuscular injection of 1.2 % BaCl2 solution whereas right side TA muscle was injected with saline alone. After 5 days, the TA muscles were harvested and processed for western blotting and qPCR. (A) Representative immunoblots presented here demonstrate the levels of p-p65, p65, p100, p52 and unrelated protein GAPDH in uninjured and 5d-injured TA muscle of Ern1fl/fl and Ern1cKO mice. Quantification of levels of (B) p-p65 and p65 (C) p100 and p52 protein (n = 3 or 4 mice per group). Data are presented as mean ± SEM and analyzed by one-way analysis of variance (ANOVA) followed by Tukey’s multiple comparison test. *p ≤ 0.05, values significantly different from uninjured TA muscle of Ern1fl/fl mice. #p ≤ 0.05, values significantly different from 5d-injured TA muscle of Ern1fl/fl mice. (D) Relative mRNA levels of Tnfa, Tnfr1, Tnfr2, Il4, Il6, Il10, Ifng, Tnfsf12, Tnfrsf12a in 5d-injured TA muscle of Ern1fl/fl and Ern1cKO mice (n = 4-6 mice per group). Data are presented as mean ± SEM. *p ≤ 0.05, values significantly different from 5d-injured TA muscle of Ern1fl/fl mice. U, uninjured; I, injured.
Figure 8 with 1 supplement
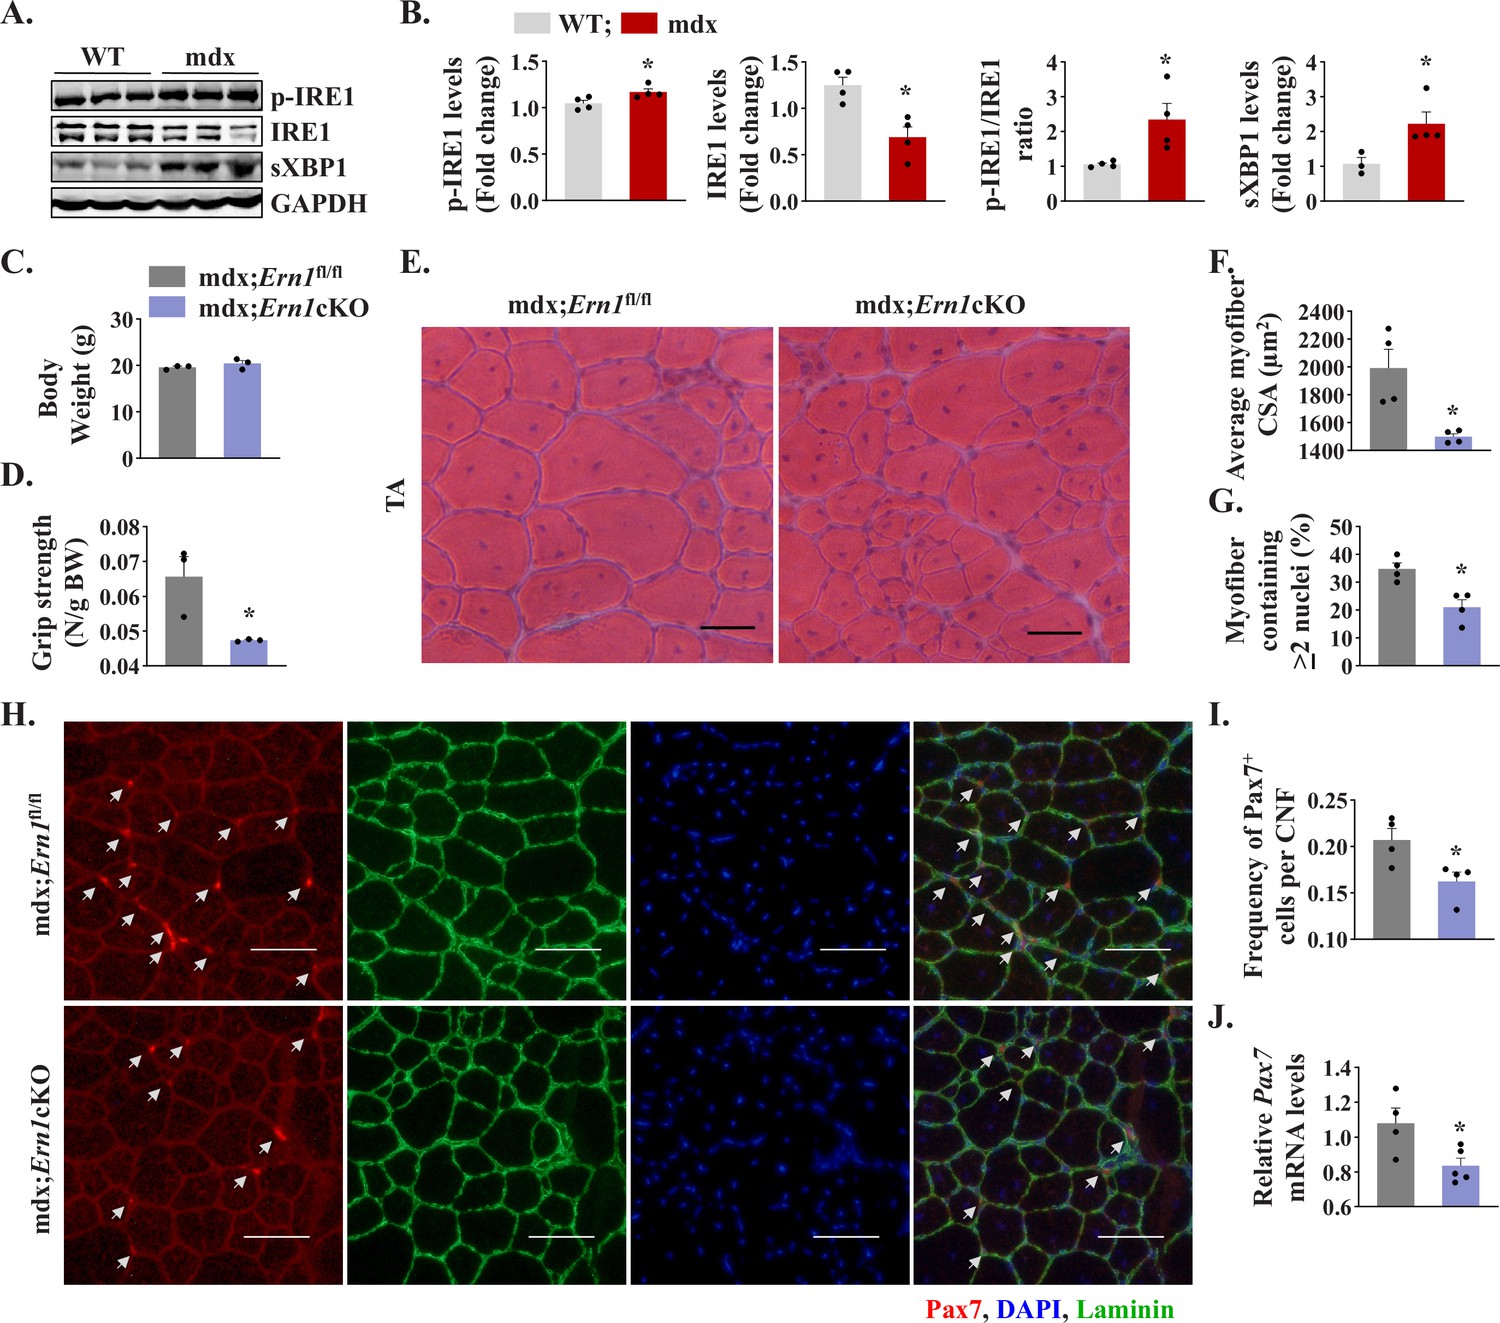
Myofiber-specific ablation of IRE1α exacerbates myopathy in mdx mice.
(A) Western blots showing the levels of p-IRE1, IRE1, sXBP1 and unrelated protein GAPDH in TA muscle of 12-week-old wild-type (WT) and mdx mice. (B) Densitometry analysis showing levels of p-IRE1, IRE1, sXBP1 and GAPDH protein in TA muscle of wild-type and mdx mice (n = 3-4 mice in each group). *p < 0.05, values significantly different from WT mice. (C) Average body weight (BW), and (D) Four limb grip strength normalized with body weight of 10-week-old mdx;Ern1fl/fl and mdx;Ern1cKO mice (n = 3 in each group). (E) Representative photomicrographs of H&E-stained TA muscle section from 10-week-old mdx;Ern1fl/fl and mdx;Ern1cKO mice. Scale bar: 50 µm. (F) Average myofiber CSA and (G) percentage of myofibers containing ≥2 centrally located nuclei in TA muscle sections of mdx;Ern1fl/fl and mdx;Ern1cKO mice (n = 4 in each group). (H) Representative photomicrographs of TA muscle sections after immunostaining for Pax7 (red) and laminin (green) protein. Nuclei were stained with DAPI (blue). Scale bar: 50 µm. White arrows point to Pax7+ satellite cells. (I) Frequency of Pax7+ cells per centrally nucleated myofibers in TA muscle of mdx;Ern1fl/fl and mdx;Ern1cKO mice (n = 4 in each group). (J) Relative mRNA levels of Pax7 in TA muscle of mdx;Ern1fl/fl and mdx;Ern1cKO mice assayed by performing qPCR (n = 4-5 mice in each group). Data are presented as mean ± SEM. *p ≤ 0.05, values significantly different from TA muscle of mdx;Ern1fl/fl mice.
Figure 8—figure supplement 1
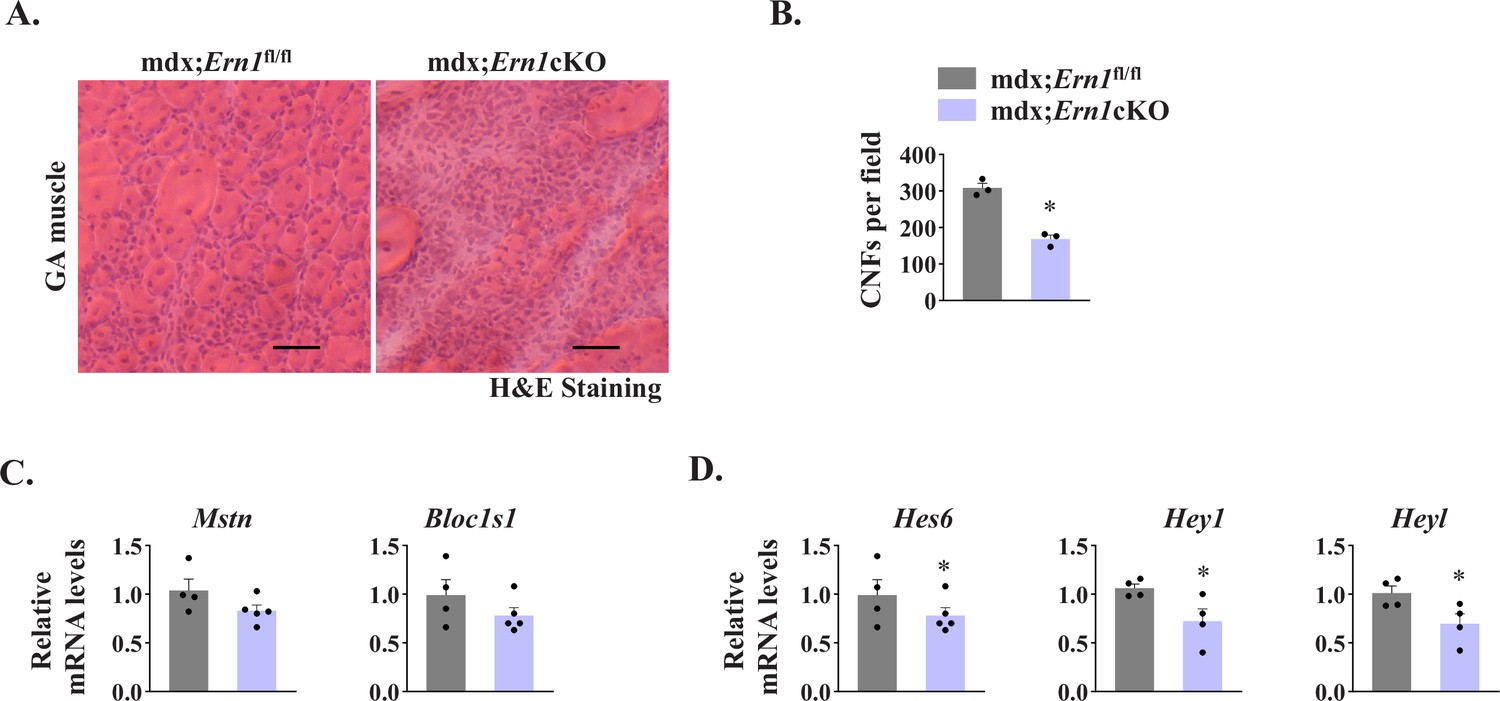
Effect of targeted ablation of IRE1α on muscle pathology in mdx mice.
(A) Representative photomicrographs of H&E-stained GA muscle sections prepared from 10-month-old mdx;Ern1fl/fl and mdx;Ern1cKO mice. Scale bar: 50 μm. (B) Number of centrally nucleated myofibers (CNFs) per field (∼0.15 mm2) in GA muscle of mdx;Ern1fl/fl and mdx;Ern1cKO mice (n = 3 mice per group). Relative mRNA levels of (C) Mstn and Bloc1s1 (n = 4 mice for mdx;Ern1fl/fl group and n = 5 mice for mdx;Ern1cKO group), and (D) Notch target genes Hes6, Hey1 and Heyl in GA muscle of mdx;Ern1fl/fl and mdx;Ern1cKO mice (n = 4 mice per group). Data are presented as mean ± SEM. *p ≤ 0.05, values significantly different from mdx;Ern1fl/fl mice by unpaired t test.
Tables
Key resources table
| Reagent type (species) or resource | Designation | Source or reference | Identifiers | Additional information |
|---|---|---|---|---|
| Genetic reagent(Mus musculus) | Wild type mice/C57BL/6 | The Jackson Laboratory | RRID:IMSR_JAX:000664 | Also known as B6, B6J, B6/J mice |
| Genetic reagent(Mus musculus) | Mdx mice/C57BL/10ScSn-Dmdmdx/J | The Jackson Laboratory | RRID:IMSR_JAX:001801 | Also known as mdx mice |
| Genetic reagent(Mus musculus) | MCK-Cre Mice/Tg(Ckmm-cre)5Khn | The Jackson Laboratory | RRID:IMSR_JAX:006475 | Also known Ckmm-cre mice |
| Genetic reagent (Mus musculus) | Ern1fl/fl Mice/B6;129S4-Ern1tm2.1Tiw | Kanazawa Medical University, Japan | RRID:IMSR_RBRC05515 | Also known as floxed Ern1 mice |
| Genetic reagent(Mus musculus) | Xbp1fl/fl mice/Xbp1tm2Glm | Dana-Farber Cancer Institute, Boston, MA | RRID:MGI:3774017 | Also known as floxed Xbp1 mice |
| Antibody | Anti-phospho-IRE1α(rabbit monoclonal) | Novus Biologicals,Cat# NB 100–2323 | RRID:AB_10145203 | Dilution used (1:500) |
| Antibody | Anti-IRE1α(rabbit monoclonal) | Cell Signaling Technology,Cat #3,294 | RRID:AB_823545 | (1:500) |
| Antibody | Anti-sXBP-1(rabbit monoclonal) | Cell Signaling Technology,Cat #12,782 | RRID:AB_2687943 | (1:500) |
| Antibody | Anti-Pax7(mouse monoclonal) | Developmental Studies Hybridoma Bank (DSHB), Cat# pax7, | RRID:AB_528428 | (1:100) |
| Antibody | Anti-eMyHC(mouse monoclonal) | DSHB.Cat# F1.652 | RRID:AB_528358 | (1:500) |
| Antibody | Anti-MyoD(mouse monoclonal) | SantaCruz Biotechnology, sc-377460 | RRID:AB_2813894 | (1:500) |
| Antibody | Anti-Myogenin(mouse monoclonal) | DSHB,Cat# F5D | RRID:AB_528355 | (1:500) |
| Antibody | Anti-phospho-p65 (rabbit monoclonal) | Cell Signaling Technology,Cat #3,033 | RRID:AB_331284 | (1:500) |
| Antibody | Anti-p65(rabbit monoclonal) | Cell Signaling Technology,Cat # 8,242 | RRID:AB_10859369 | (1:500) |
| Antibody | Anti-p100/p52(rabbit polyclonal) | Cell Signaling Technology,Cat #4,882 | RRID:AB_10695537 | (1:500) |
| Antibody | Anti-Notch1(mouse monoclonal) | Santa Cruz Biotechnology,Cat # sc-6015 | RRID:AB_831604 | (1:250) |
| Antibody | Anti-Hes6(mouse monoclonal) | Santa Cruz Biotechnology,Cat # sc-133196 | RRID:AB_2118109 | (1:250) |
| Antibody | Anti-GAPDH(rabbit monoclonal) | Cell Signaling Technology,Cat. #2,118 | RRID:AB_561053 | (1:1000) |
| Antibody | Anti-laminin(rabbit polyclonal) | Sigma-Aldrich,Cat# L9393 | RRID:AB_477163 | (1:1000) |
| Antibody | Anti-Integrin α7-APC (mouse monoclonal) | Miltenyi Biotec, Cat# 130-102-717 | RRID:AB_2652466 | (1:100) |
| Antibody | Anti-CD45 Antibody (30-F11), PE, (mouse monoclonal) | ThermoFisher Scientific,Cat # 12-0451-82 | RRID:AB_465668 | (1:400) |
| Antibody | Anti-CD31 (PECAM-1) (390), PE, (mouse monoclonal) | ThermoFisher Scientific,Cat # 12-0311-82 | RRID:AB_465632 | (1:400) |
| Antibody | Anti-TER-119 (TER-119), PE, (mouse monoclonal) | ThermoFisher Scientific,Cat# 12-5921-82 | RRID:AB_466042 | (1:400) |
| Antibody | Anti-Ly-6A/E (Sca-1) (D7), PE, (mouse monoclonal) | ThermoFisher Scientific,Cat # 12-5981-83 | RRID:AB_466087 | (1:400) |
Additional files
-
Transparent reporting form
- https://cdn.elifesciences.org/articles/73215/elife-73215-transrepform1-v2.pdf
-
Source data 1
The file contains raw data for all the figures.
- https://cdn.elifesciences.org/articles/73215/elife-73215-supp1-v2.zip
Download links
A two-part list of links to download the article, or parts of the article, in various formats.
Downloads (link to download the article as PDF)
Open citations (links to open the citations from this article in various online reference manager services)
Cite this article (links to download the citations from this article in formats compatible with various reference manager tools)
The IRE1/XBP1 signaling axis promotes skeletal muscle regeneration through a cell non-autonomous mechanism
eLife 10:e73215.
https://doi.org/10.7554/eLife.73215


