Corticofugal regulation of predictive coding
- Department of Otorhinolaryngology, University of Pennsylvania, United States
- Department of Psychology, University of Pennsylvania, United States
- Department of Neurobiology and Behavior, Stony Brook University, United States
- Department of Psychiatry, University of Pennsylvania, United States
- Department of Systems Pharmacology and Experimental Therapeutics, University of Pennsylvania, United States
- Department of Neuroscience, University of Pennsylvania, United States
- Department of Neurology, University of Pennsylvania, United States
Figures
Figure 1 with 2 supplements
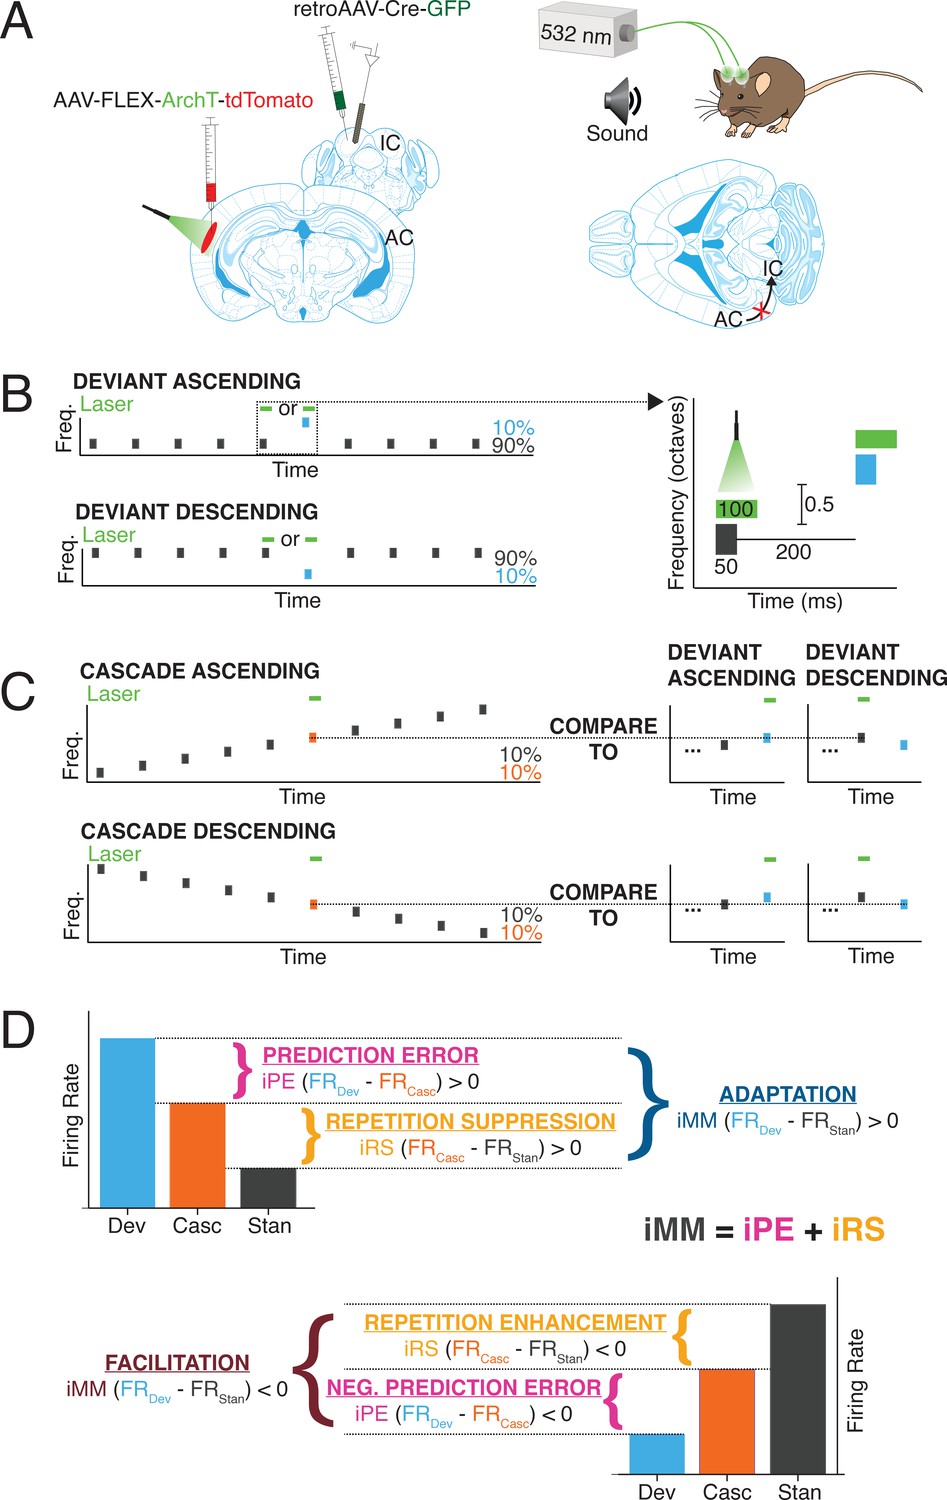
Experimental design.
(A) Cre/FLEX dual injections for selective ArchT expression in cortico-collicular neurons. Recordings were performed in the inferior colliculus (IC) while inactivation was mediated by a 532 nm laser connected to cannulas implanted over the auditory cortex (AC). (B) Oddball stimuli consisted of pairs of pure tones separated by 0.5 octave with a 90:10 standard-to-deviant ratio. Two sequences were constructed such that each frequency is represented as both the standard and the deviant. (C) Cascade sequences consisted of 10 evenly spaced tones separated by 0.5 octaves, with both frequencies from the oddball sequence included in the sequence. Responses to tones in the cascade context were compared to responses in the standard and deviant context to analyze repetition and prediction effects, respectively. (D) A positive index of neuronal mismatch (iMM) (top diagram) indicates a stronger response to the deviant than the standard (adaptation), while a negative iMM (bottom diagram) indicates a stronger response to the standard than to the deviant (facilitation). The iMM can be further decomposed into an index of prediction error (iPE) and an index of repetition suppression (iRS). Positive iPE values represent prediction error, and negative values convey negative prediction error. Positive iRS indices indicate repetition suppression, while repetition enhancement is represented by negative values.
Figure 1—figure supplement 1
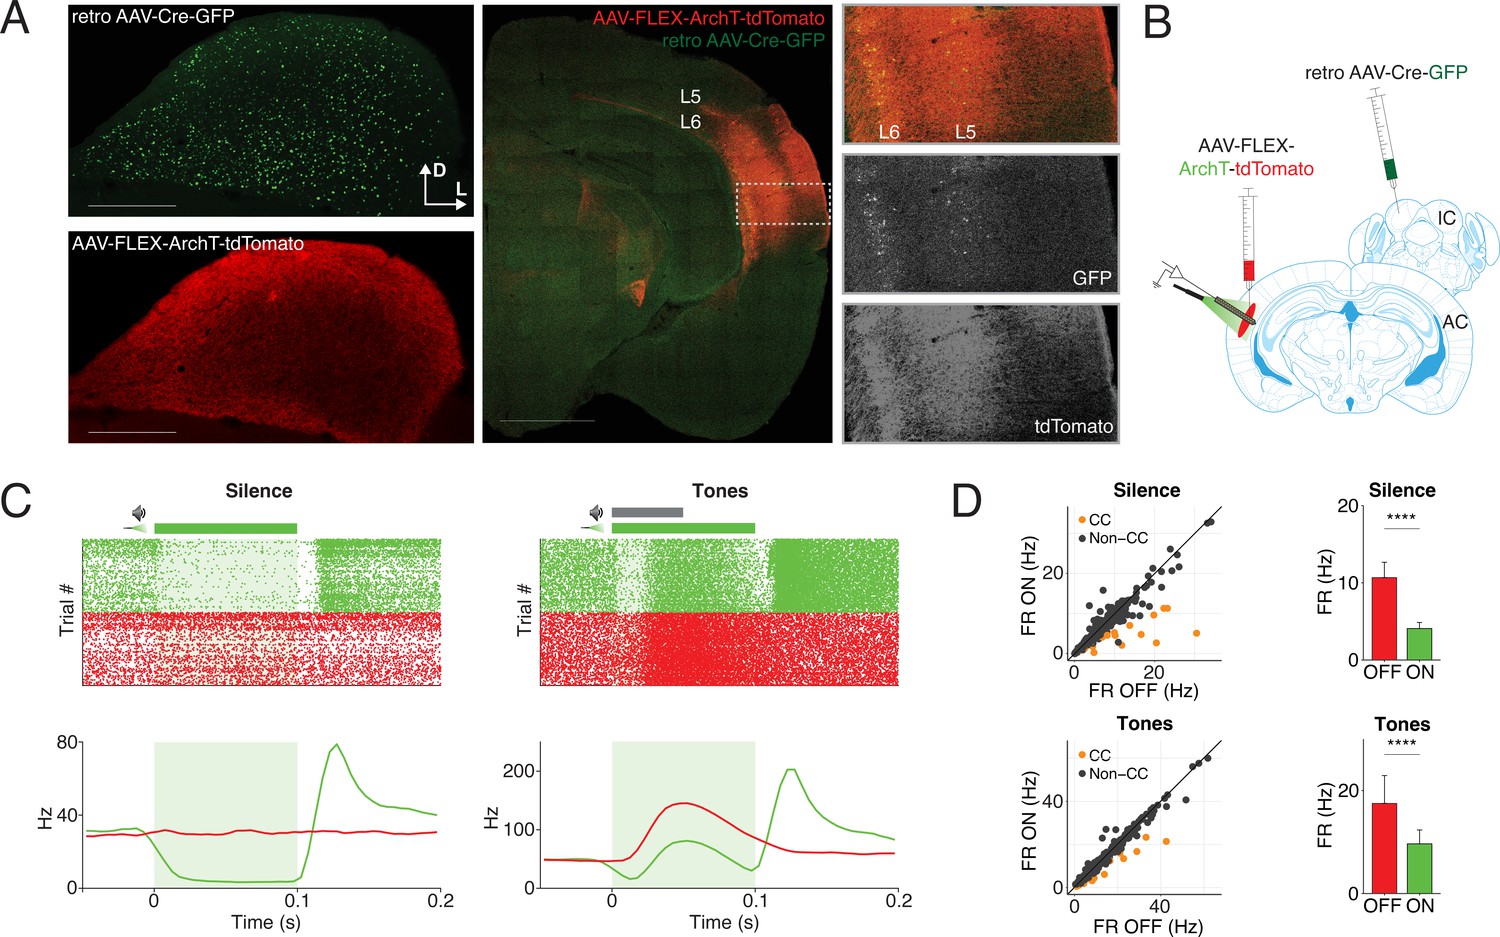
Cre/FLEX viral injection strategy enables selective inactivation of cortico-collicular neurons.
(A) Expression of the retroAAV-Cre-GFP construct at the injection site is restricted to the inferior colliculus (IC) (top left). tdTomato-labeled axons are found in a pattern matching the known topographical distribution of cortico-collicular neurons in IC (left bottom). Somatic AAV9-FLEX-ArchT-tdTomato expression is present in layers 5 and 6 of the auditory cortex (AC) (right, inset). (B) Experimental design for recording from AC to confirm the presence of inactivated units. (C) Example of an inactivated unit (i.e., putative cortico- collicular unit) exhibiting a strong reduction in firing during silence and during the presentation of pure tones. (D) Population data demonstrating reduced firing rates during silence and in response to pure tone stimuli in putative cortico-collicular units. Dots represent recorded units. Bar plots represent means over the population n = 20 CC units. Error bars are standard error of the mean.
Figure 1—figure supplement 2

Parsing of recording sites into central and shell locations.
(A) Experimental design for awake inferior colliculus (IC) recordings in the central and shell regions of IC. (B) Linear fits for best frequency vs. depth in central (left) and shell (right) IC. (C) Sparseness vs. R2 value for linear fit. K-means clustering was performed using these parameters to classify recording sites as either in the shell or central nucleus of IC. Each dot represents a recording site. (D) Left: DiA labeling from an electrode penetration in a recording site classified as a central site. Atlas image overlay confirms that the dye track runs through the central IC (CIC) (Paxinos and Franklin, 2019). Right: DiD labeling from an electrode penetration in a recording site classified as a shell site. Atlas image overlay confirms that the dye track runs through the shell IC (here denoted as ECIC/DCIC). (E) Example raster plots and peristimulus time histograms showing different firing types in the awake IC. Examples of inhibited and mixed types are from single units, while all others are from multiunits. (F) Example tuning curves in central (left) and shell (right) IC. (G) Example of a tuning curve with inhibited side bands.
Figure 2
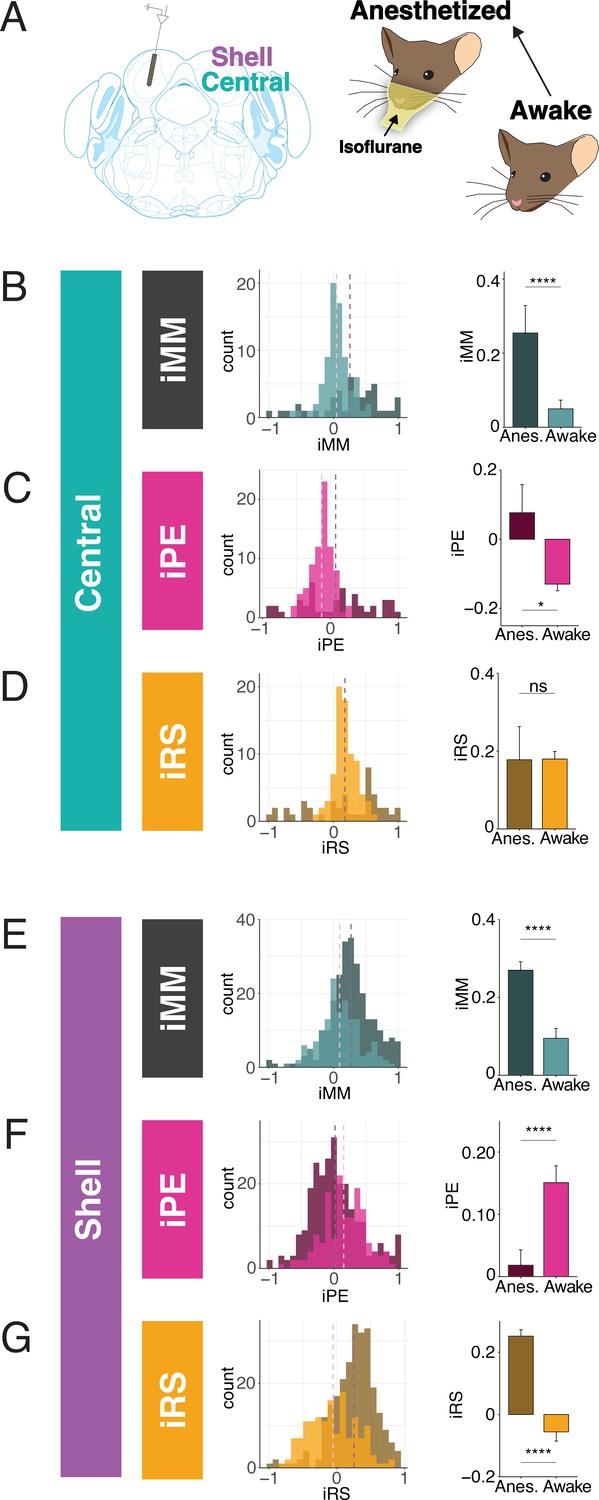
Inferior colliculus (IC) units encode different aspects of prediction and repetition in awake and anesthetized states.
(A) Experimental design for recording in the awake and isoflurane anesthetized IC in the same population of units. (B) Distribution of index of neuronal mismatch (iMM) in the awake vs. anesthetized central IC. Bar plots represent means over the population of n = 39 units. Error bars are standard error of the mean. (C) Index of prediction error (iPE) distribution in the awake vs. anesthetized central IC. (D) Index of repetition suppression (iRS) distribution in the awake vs. anesthetized central IC. (E) Distribution of iMM in the awake vs. anesthetized shell IC. Bar plots represent means over the population of n = 165 units. Error bars are standard error of the mean. (F) iPE distribution in the awake vs. anesthetized shell IC. (G) iRS distribution in the awake vs. anesthetized shell IC. Data is from four recording sessions in one mouse.
Figure 3 with 3 supplements
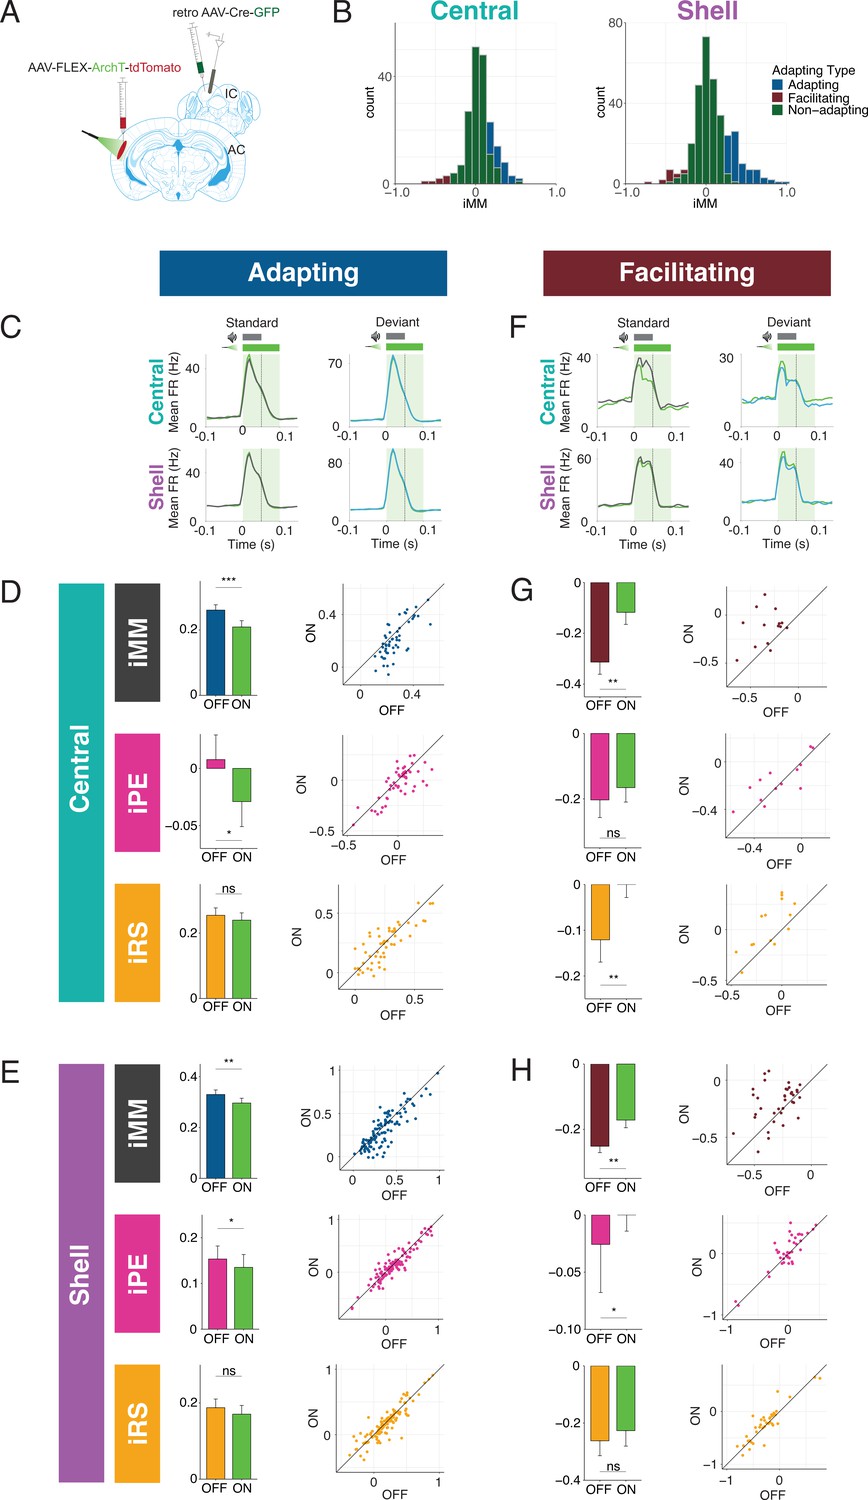
Adapting and facilitating inferior colliculus (IC) units are differentially affected by cortico-collicular inactivation.
(A) Experimental design for recording in awake IC during laser inactivation of the cortico-collicular pathway. (B) Categorization of units according to whether they displayed significant adaptation, facilitation, or neither (nonadapting). (C) Average peristimulus time histogram for adapting units in central (top) and shell (bottom) IC. Green = during laser inactivation. (D) Index of neuronal mismatch (iMM) (top), index of prediction error (iPE) (middle), and index of repetition suppression (iRS) (bottom) for adapting units in the central nucleus. Dots represent recorded units. Bar plots represent means over the population of n = 52 units. Error bars are standard error of the mean. (E) iMM (top), iPE (middle), and iRS (bottom) for adapting units in shell regions of IC. Dots represent recorded units. Bar plots represent means over the population of n = 113 units. Error bars are standard error of the mean. (F) Average peristimulus time histogram for facilitating units in central (top) and shell (bottom) IC. Green = during laser inactivation. (G) iMM (top), iPE (middle), and iRS (bottom) for facilitating units in the central nucleus. Dots represent recorded units. Bar plots represent means over the population of n = 14 units. Error bars are standard error of the mean. (H) iMM (top), iPE (middle), and iRS (bottom) for facilitating units in shell regions of IC. Dots represent recorded units. Bar plots represent means over the population of n = 38 units. Error bars are standard error of the mean.
Figure 3—figure supplement 1
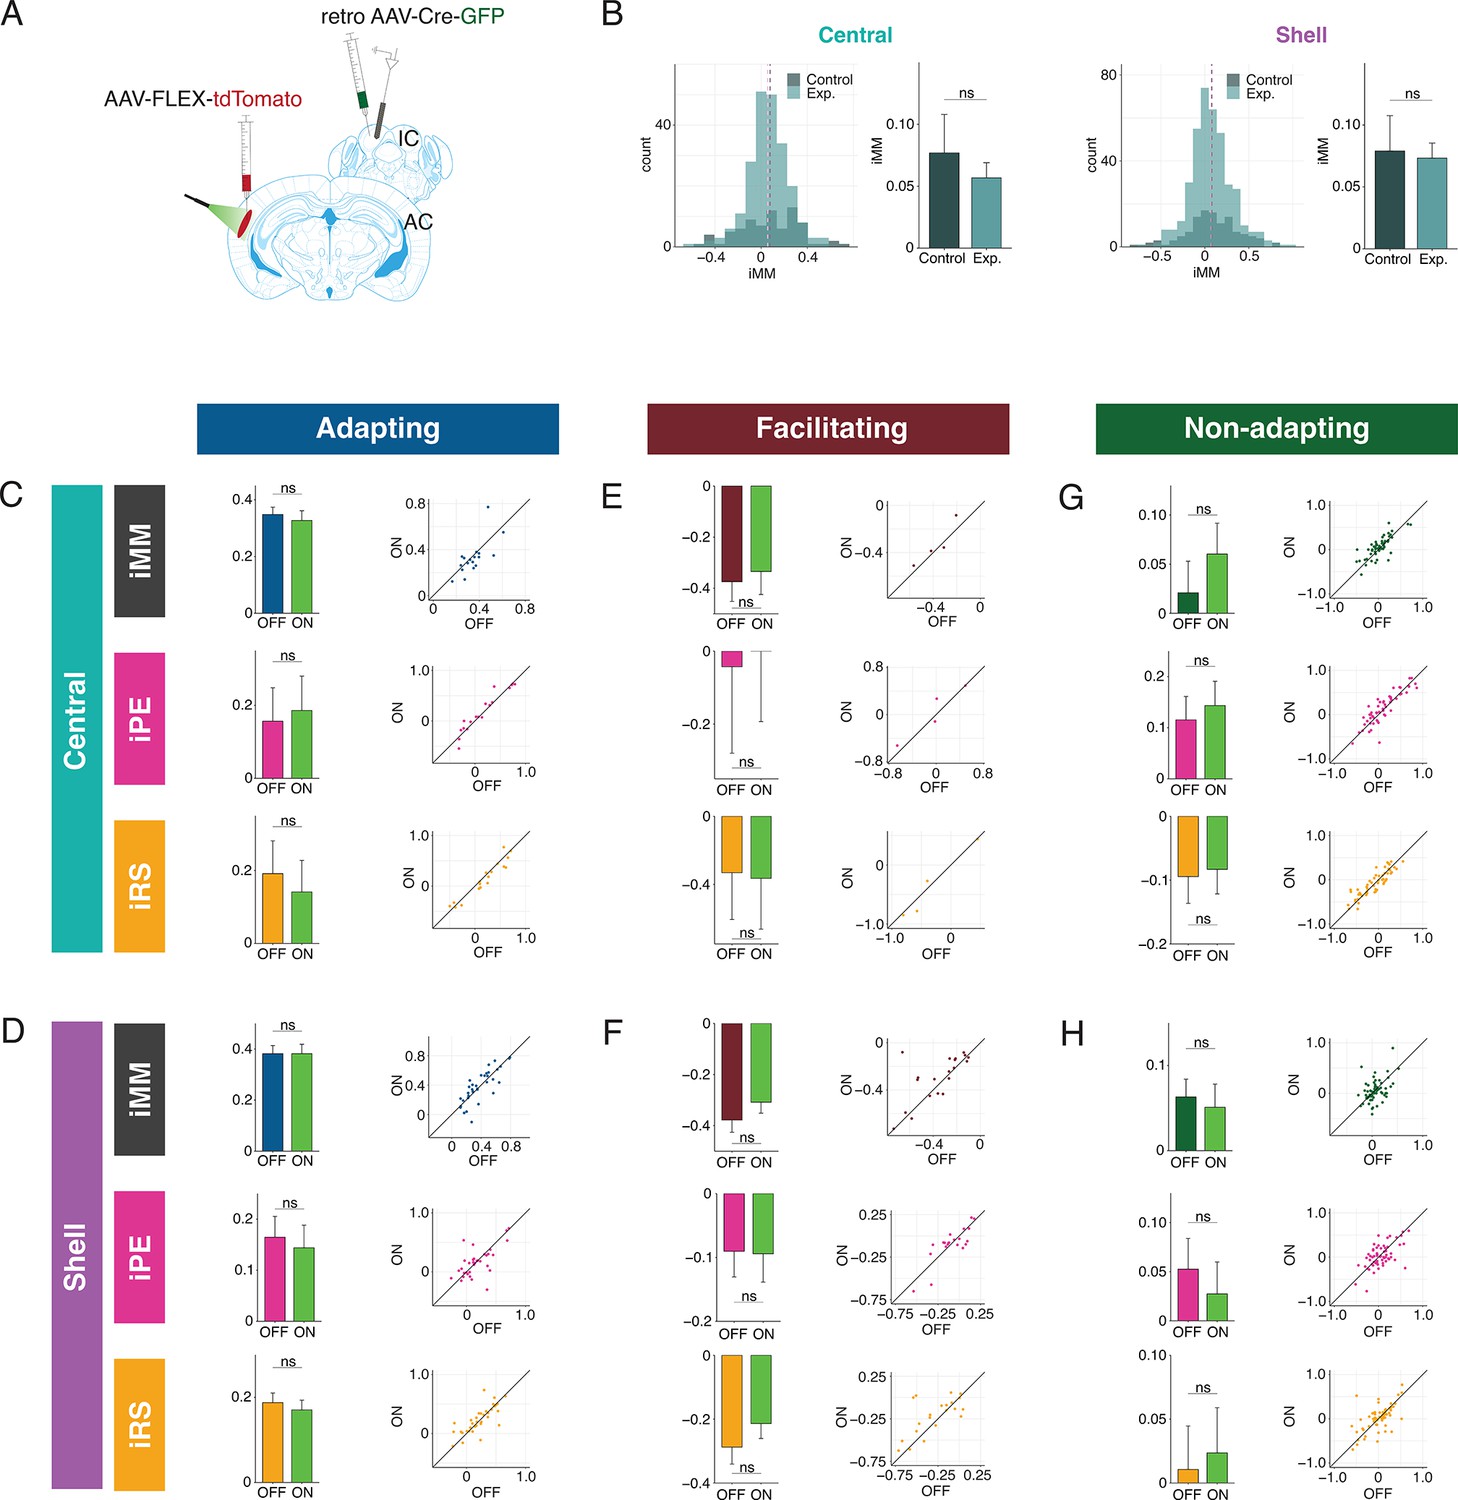
Control data.
(A) Experimental design for control experiments. All procedures were performed identically to the experimental group, except with the omission of ArchT from the viral construct injected in the auditory cortex (AC). (B) Comparison of the index of neuronal mismatch (iMM) distribution for control (navy) and experimental (light blue) groups in central (left) and shell (right) inferior colliculus (IC). (C) iMM (top), index of prediction error (iPE) (middle), and index of repetition suppression (iRS) (bottom) for control adapting units in the central nucleus. Dots represent recorded units. Bar plots represent means over the population of n = 18 units. Error bars are standard error of the mean. (D) iMM (top), iPE (middle), and iRS (bottom) for control adapting units in shell regions of IC. Dots represent recorded units. Bar plots represent means over the population of n = 35 units. Error bars are standard error of the mean. (E) iMM (top), iPE (middle), and iRS (bottom) for control facilitating units in the central nucleus. Dots represent recorded units. Bar plots represent means over the population of n = 4 units. Error bars are standard error of the mean. (F) iMM (top), iPE (middle), and iRS (bottom) for control facilitating units in shell regions of IC. Dots represent recorded units. Bar plots represent means over the population of n = 21 units. Error bars are standard error of the mean. (G) iMM (top), iPE (middle), and iRS (bottom) for control nonadapting units in the central nucleus. Dots represent recorded units. Bar plots represent means over the population of n = 55 units. Error bars are standard error of the mean. (H) iMM (top), iPE (middle), and iRS (bottom) for control nonadapting units in shell regions of IC. Dots represent recorded units. Bar plots represent means over the population of n = 63 units. Error bars are standard error of the mean.
Figure 3—figure supplement 2
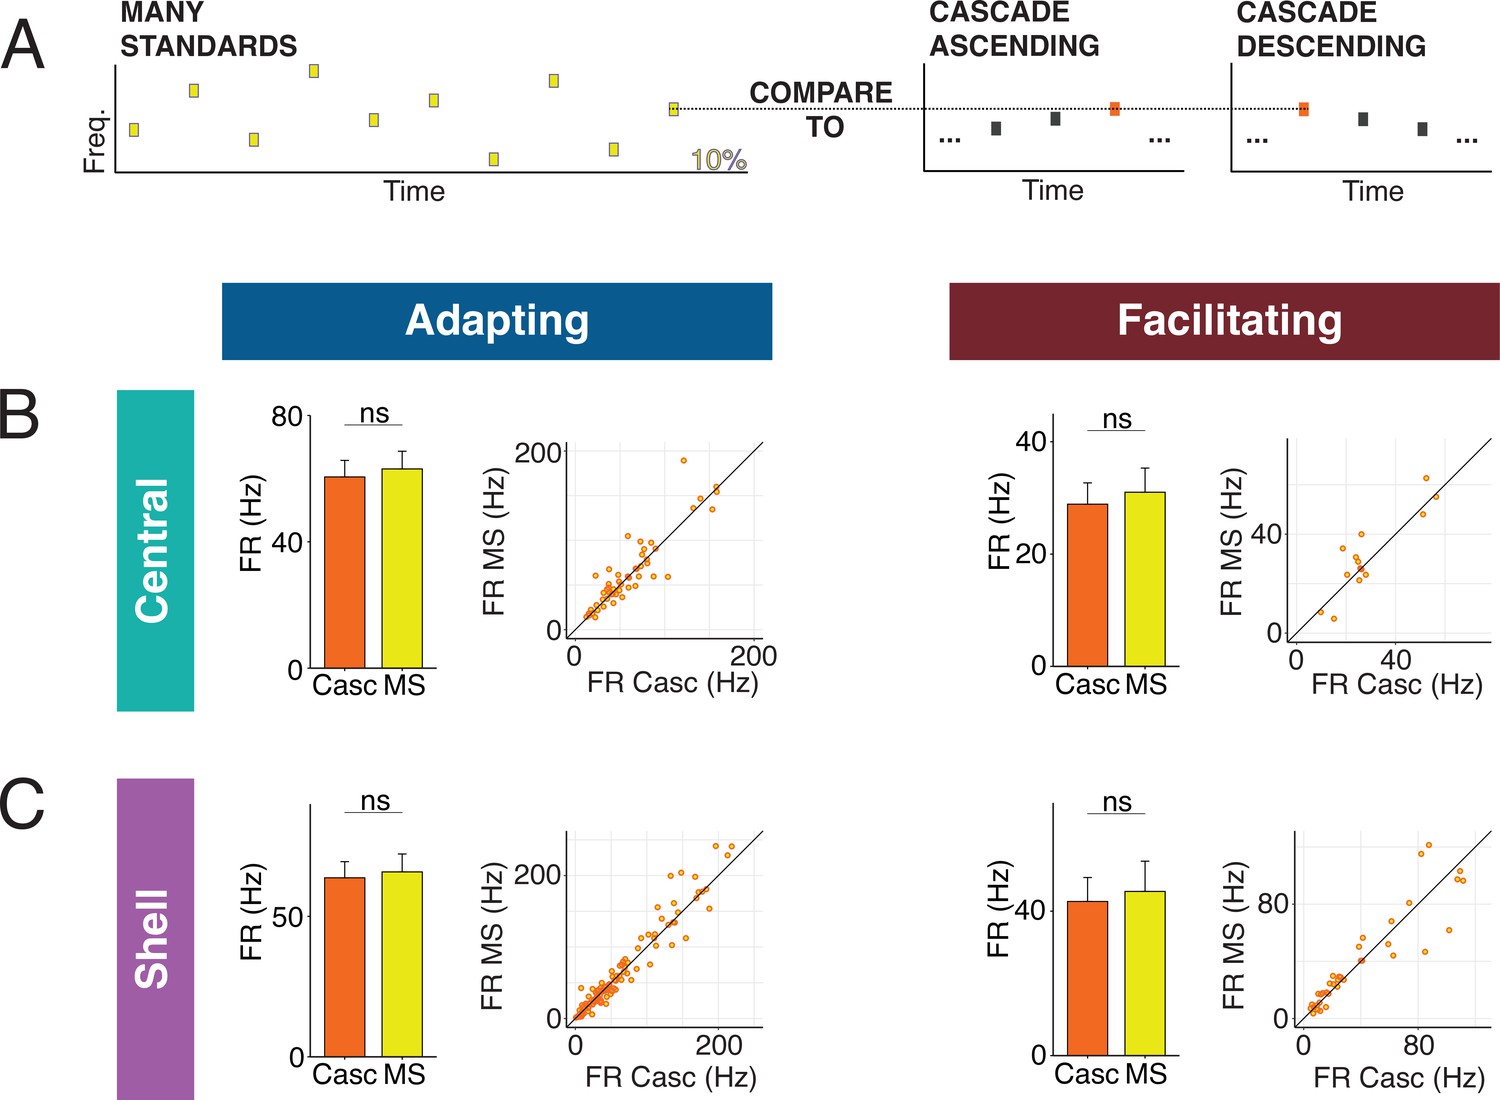
Comparison of neuronal responses between the many standards and cascade sequences.
(A) The many standards sequence consists of the same 10 tones found in the cascade sequence, but the tone order is random. Responses to the cascade and many standards sequences were compared to assess whether cross-frequency adaptation or global stimulus regularity affects responses to the cascade condition. (B) Firing rates of adapting units (left) and facilitating units (right) in the central inferior colliculus (IC) to tones in the cascade and many standards contexts. Dots represent recorded units. Bar plots represent means over the population of n = 52 adapting and n = 14 facilitating units. Error bars are standard error of the mean. (C) Firing rates of adapting units (left) and facilitating units (right) in the shell IC to tones in the cascade and many standards contexts. Dots represent recorded units. Bar plots represent means over the population of n = 113 adapting and n = 38 facilitating units. Error bars are standard error of the mean.
Figure 3—figure supplement 3
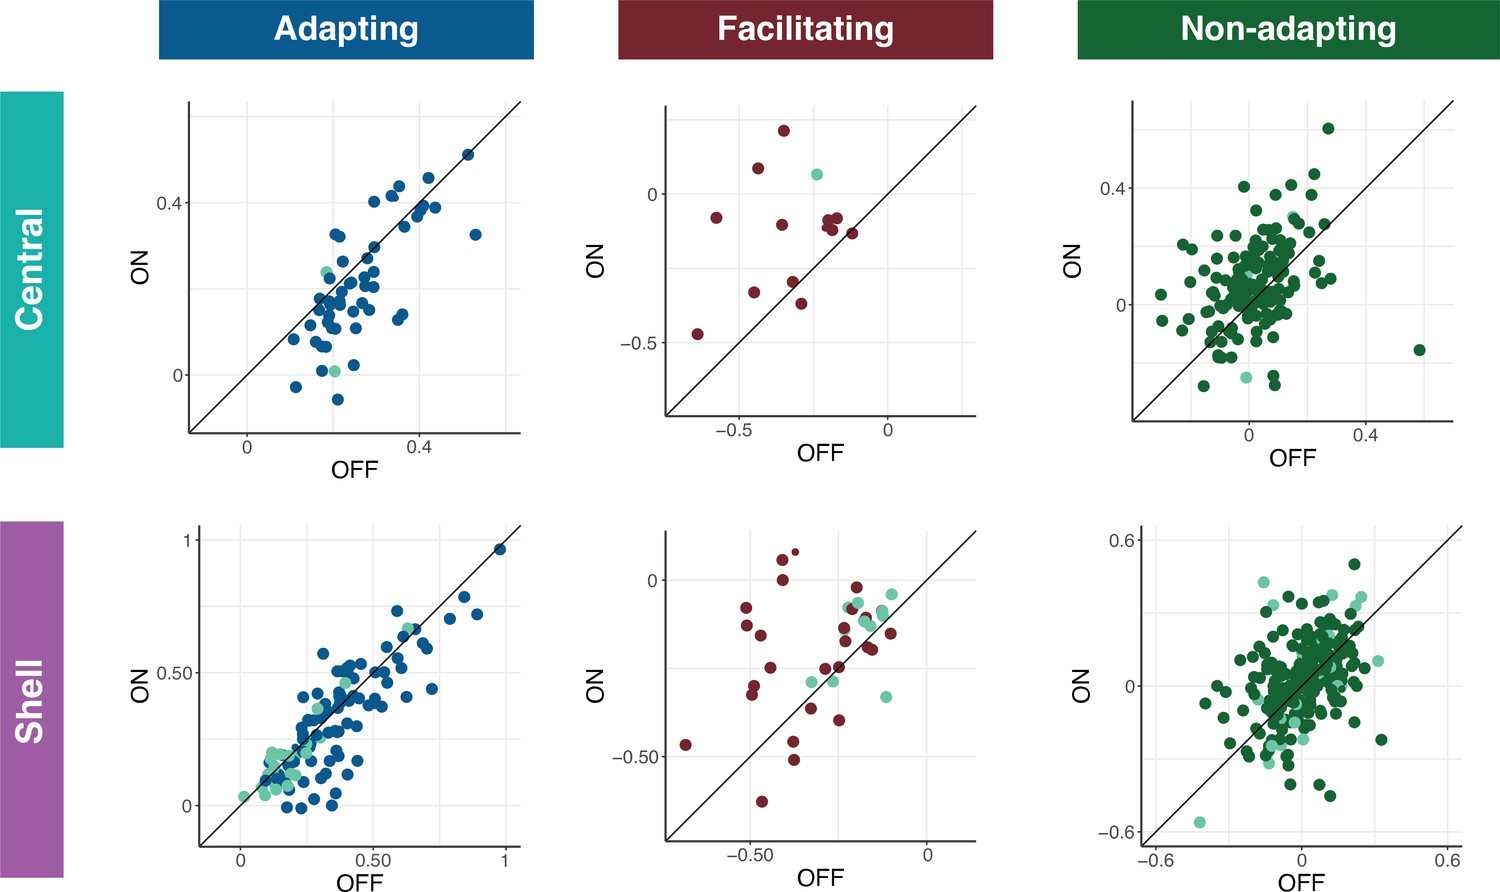
Index of neuronal mismatch (iMM) distribution does not differ between single- and multiunit types.
The iMM for laser OFF (x-axis) and laser ON (y-axis) trials for each region of the IC separated by single- (displayed in teal) and multiunits.
Figure 4
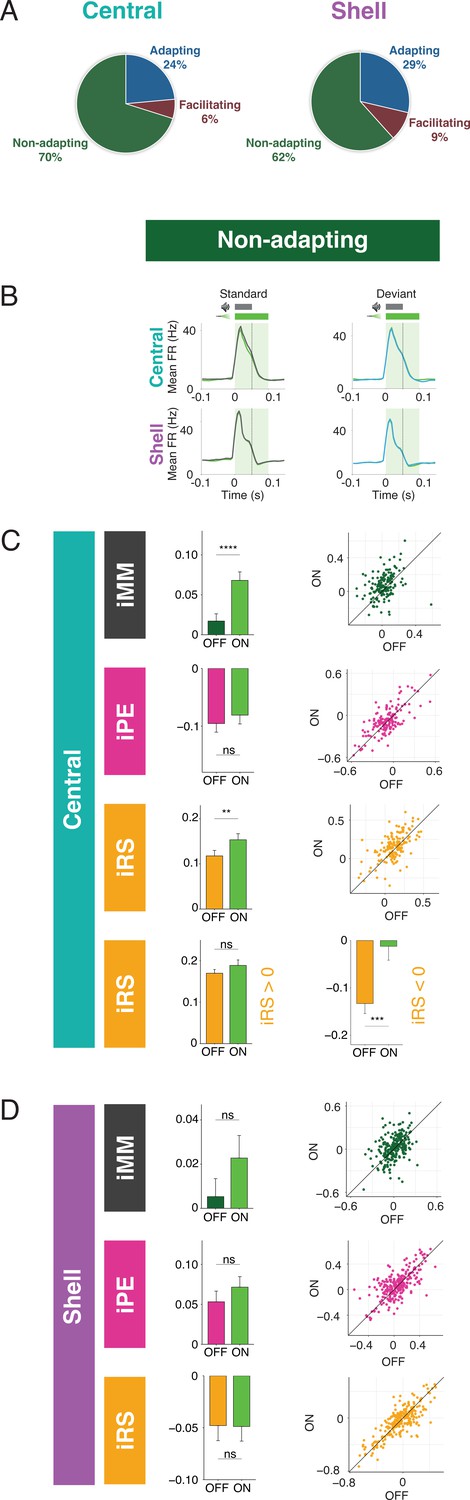
Nonadapting units also display top-down repetition enhancement.
(A) Distribution of adapting types (adapting, facilitating, and nonadapting) for units in central (left) and shell (right) regions of the inferior colliculus (IC). (B) Average peristimulus time histogram for nonadapting units in central (top) and shell (bottom) IC. (C) Index of neuronal mismatch (iMM) (top), index of prediction error (iPE) (middle), and index of repetition suppression (iRS) (bottom) for nonadapting units in central regions of IC. Dots represent recorded units. Bar plots represent means over the population of n = 155 units. Error bars are standard error of the mean. (D) iMM (top), iPE (middle), and iRS (bottom) for nonadapting units in shell regions of IC. Dots represent recorded units. Bar plots represent means over the population of n = 243 units. Error bars are standard error of the mean.
Figure 5
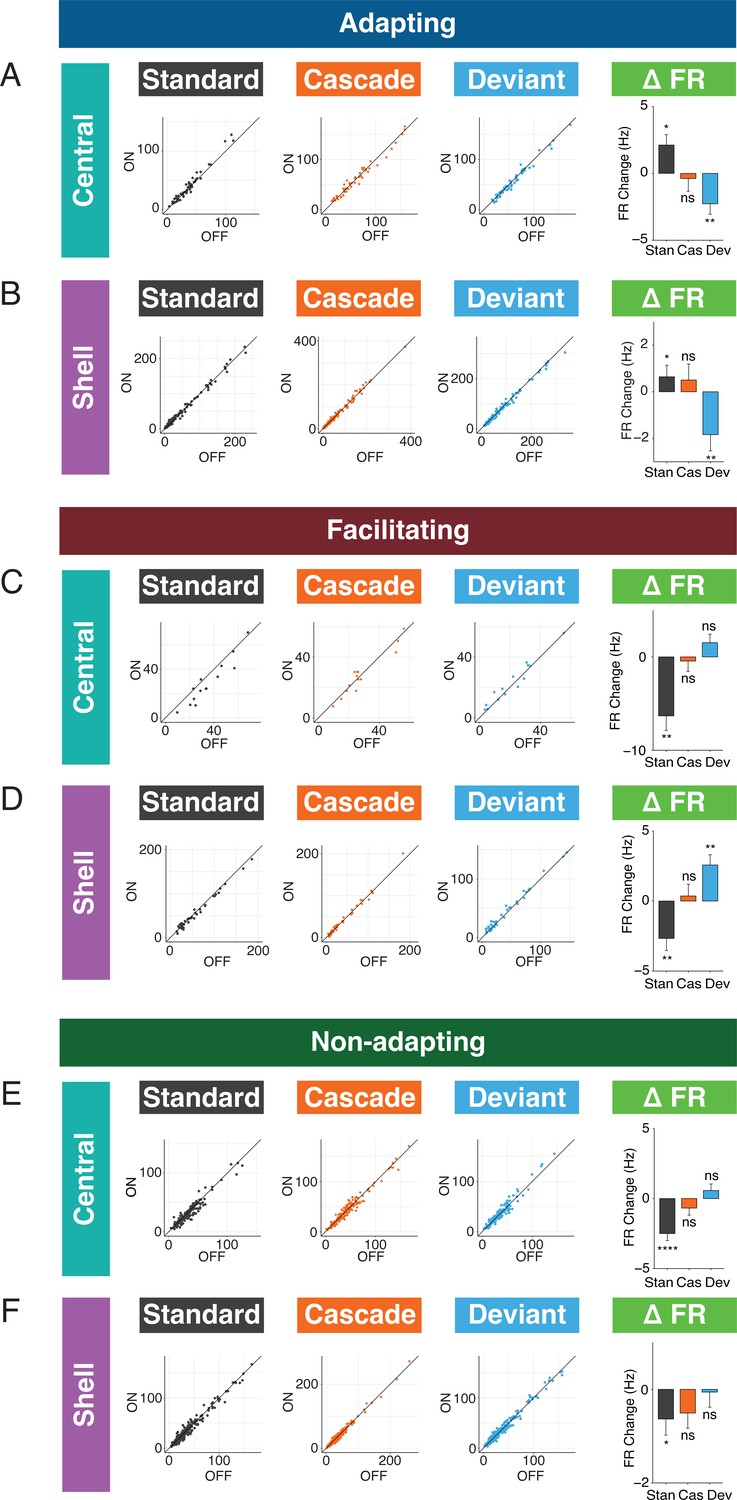
Standard and deviant responses are bidirectionally modulated by cortico-collicular inactivation.
(A) Responses to the standard (left), cascade (middle left), and deviant (middle right) for adapting units in central regions of the inferior colliculus (IC) under baseline and laser conditions. Change in firing rate between the laser and baseline condition for each stimulus (right). Dots represent recorded units. Bar plots represent means over the population of n = 52 units. Error bars are standard error of the mean. (B) Responses to the standard (left), cascade (middle left), and deviant (middle right) for adapting units in shell regions of IC under baseline and laser conditions. Change in firing rate between the laser and baseline condition for each stimulus (right). Dots represent recorded units. Bar plots represent means over the population of n = 113 units. Error bars are standard error of the mean. (C) Responses to the standard (left), cascade (middle left), and deviant (middle right) for facilitating units in central regions of IC under baseline and laser conditions. Change in firing rate between the laser and baseline condition for each stimulus (right). Dots represent recorded units. Bar plots represent means over the population of n = 14 units. Error bars are standard error of the mean. (D) Responses to the standard (left), cascade (middle left), and deviant (middle right) for facilitating units in shell regions of IC under baseline and laser conditions. Change in firing rate between the laser and baseline condition for each stimulus (right). Dots represent recorded units. Bar plots represent means over the population of n = 38 units. Error bars are standard error of the mean. (E) Responses to the standard (left), cascade (middle left), and deviant (middle right) for nonadapting units in central regions of IC under baseline and laser conditions. Change in firing rate between the laser and baseline condition for each stimulus (right). Dots represent recorded units. Bar plots represent means over the population of n = 155 units. Error bars are standard error of the mean. (F) Responses to the standard (left), cascade (middle left), and deviant (middle right) for nonadapting units in shell regions of IC under baseline and laser conditions. Change in firing rate between the laser and baseline condition for each stimulus (right). Dots represent recorded units. Bar plots represent means over the population of n = 243 units. Error bars are standard error of the mean.
Figure 6
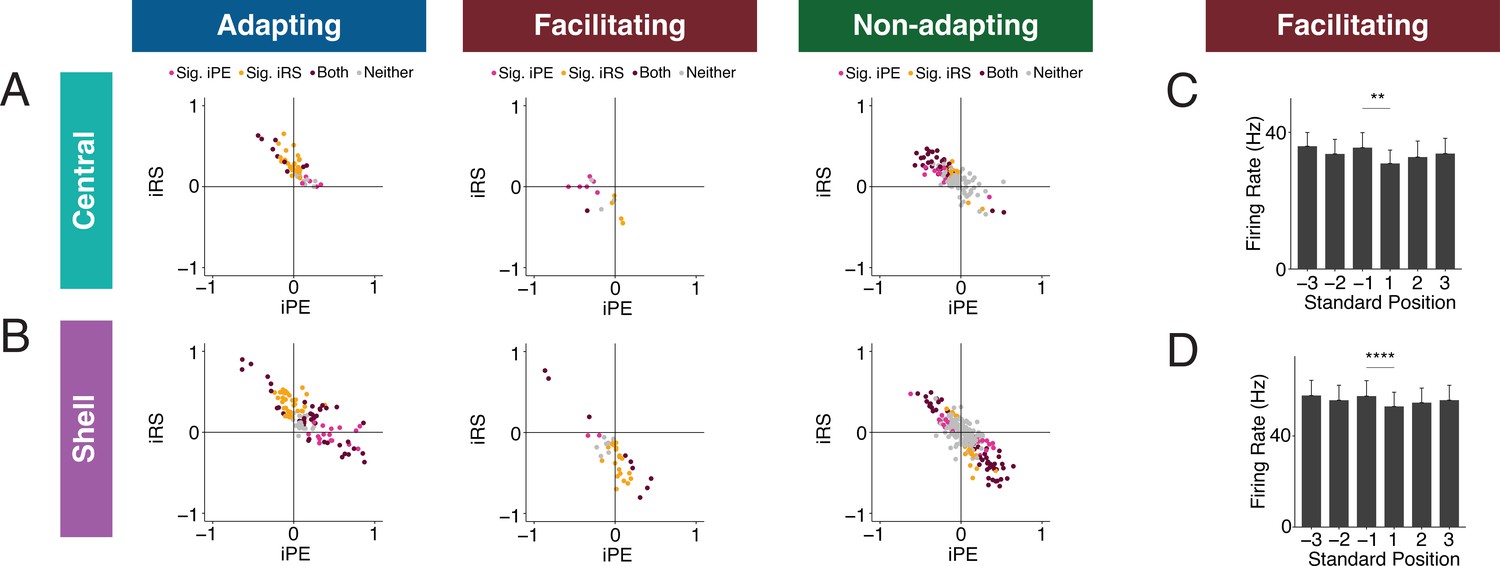
Inferior colliculus (IC) units exhibit distinct combinations of index of prediction error (iPE) and index of repetition suppression (iRS).
(A) Distribution of both iRS and iPE in adapting (left), facilitating (middle), and nonadapting (right) units in central IC. (B) Plots of distributions of both iRS and iPE in adapting (left), facilitating (middle), and nonadapting (right) units in shell IC. (C) Response to three subsequent standards prior to or following the deviant in facilitating units in central IC. Comparison between the last standard before and the first standard after the deviant demonstrates significant repetition enhancement. Bar plots represent means over the population of n = 14 units. Error bars are standard error of the mean. (D) Response to three subsequent standards prior to or following the deviant in facilitating units in shell IC. Comparison between the last standard before and the first standard after the deviant demonstrates significant repetition enhancement. Bar plots represent means over the population of n = 38 units. Error bars are standard error of the mean.
Figure 7
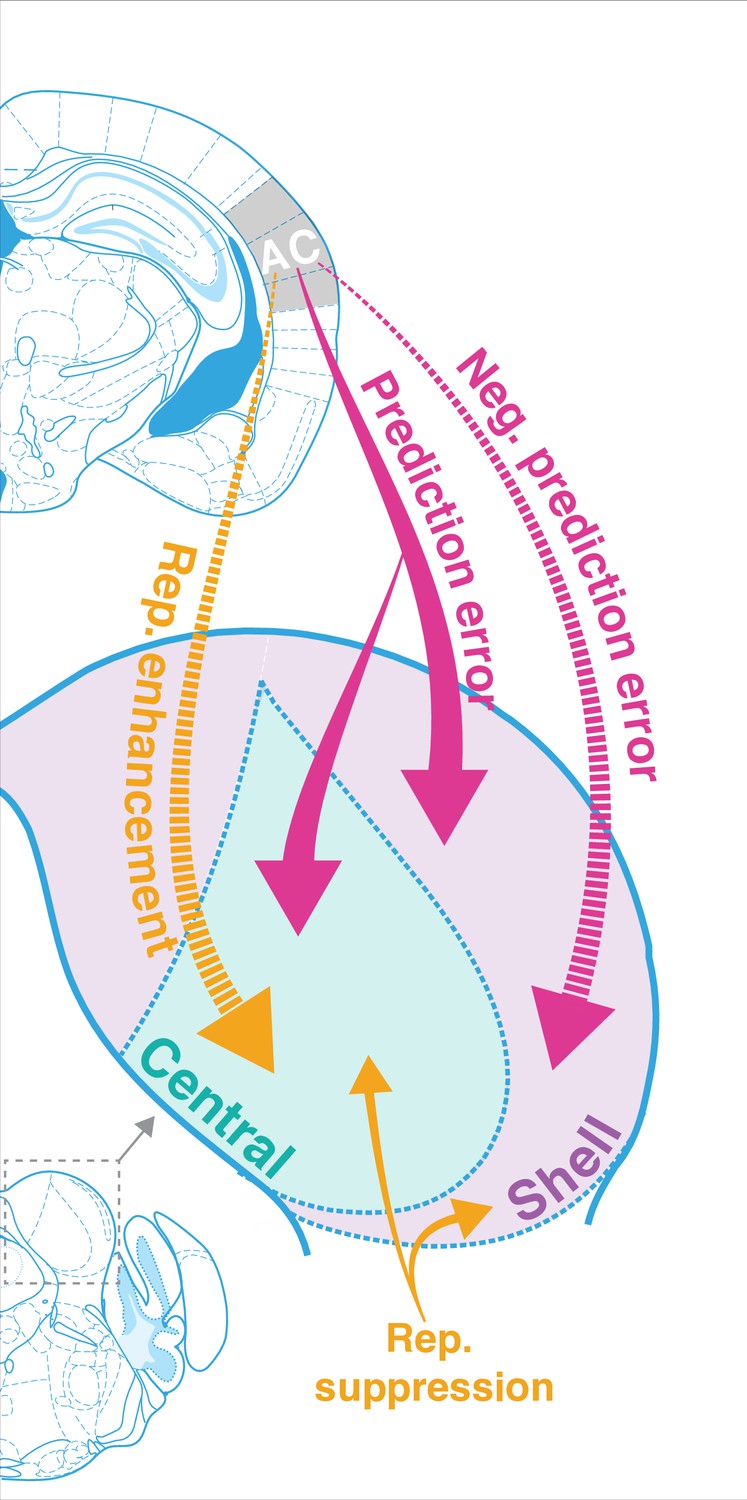
Corticofugal regulation of predictive coding.
Laser inactivation led to the abolishment of repetition enhancement in central facilitating units and the abolishment of negative prediction error in shell facilitating units. Prediction error decreased during inactivation for adapting units in both shell and central regions of the inferior colliculus (IC). Repetition suppression remained unaffected during cortical inactivation, suggesting that it may reflect fatigue of bottom-up sensory inputs.
Tables
Table 1
Statistical comparisons for experimental data.
| Comparison | Figure | Mean | Median | SD | SEM | CI (±) | Test | Test statistic | N | df | p | Effect size |
|---|---|---|---|---|---|---|---|---|---|---|---|---|
| Response of putative cortico-collicular units in silence (laser OFF vs. ON) | Figure 1—figure supplement 1D (top) | OFF: 11ON: 4.1 | OFF: 9.0ON: 3.5 | OFF: 8.9ON: 3.5 | OFF: 2.0ON: 0.78 | OFF: 4.2ON: 1.6 | Wilcoxon signed-rank test | V = 0 | 20 | NA | 1.9e-06 | 0.88 |
| Response of putative cortico-collicular units to pure tones (laser OFF vs. ON) | Figure 1—figure supplement 1D (bottom) | OFF: 18ON: 9.6 | OFF: 8.8ON: 4.3 | OFF: 24ON: 12 | OFF: 5.4ON: 2.7 | OFF: 11ON: 5.6 | Wilcoxon signed-rank test | V = 0 | 20 | NA | 1.9e-06 | 0.88 |
| iMM central (awake vs. anesthetized) | Figure 2B | Aw: 0.050An: 0.25 | Aw: 0.045An: 0.28 | Aw: 0.21An: 0.49 | Aw: 0.024An: 0.074 | Aw: 0.047An: 0.15 | Wilcoxon rank-sum test | W = 952.5 | Aw: 78An: 43 | NA | 8.8e-05 | 0.36 |
| iPE central (awake vs. anesthetized) | Figure 2C | Aw: –0.13An: 0.077 | Aw: –0.11An: 0.098 | Aw: 0.17An: 0.53 | Aw: 0.019An: 0.081 | Aw: 0.038An: 0.16 | Student’s t-test | t = –2.5 | Aw: 78An: 43 | 38 | 0.017 | 0.52 |
| iRS central (awake vs. anesthetized) | Figure 2D | Aw: 0.18An: 0.18 | Aw: 0.17An: 0.30 | Aw: 0.17An: 0.56 | Aw: 0.019An: 0.085 | Aw: 0.039An: 0.17 | Wilcoxon rank-sum test | W = 1444 | Aw: 78An: 43 | NA | 0.21 | 0.12 |
| iMM shell (awake vs. anesthetized) | Figure 2E | Aw: 0.095An: 0.27 | Aw: 0.090An: 0.27 | Aw: 0.31An: 0.35 | Aw: 0.025An: 0.022 | Aw: 0.050An: 0.043 | Wilcoxon rank-sum test | W = 12,502 | Aw: 147An: 254 | NA | 3.5e-08 | 0.28 |
| iPE shell (awake vs. anesthetized) | Figure 2F | Aw: 0.15An: 0.018 | Aw: 0.15An: –0.0075 | Aw: 0.33An: 0.39 | Aw: 0.027An: 0.025 | Aw: 0.053An: 0.049 | Wilcoxon rank-sum test | W = 23,368 | Aw: 147An: 254 | NA | 2.6e-05 | 0.21 |
| iRS shell (awake vs. anesthetized) | Figure 2G | Aw: –0.056An: 0.25 | Aw: –0.085An: 0.29 | Aw: 0.36An: 0.33 | Aw: 0.029An: 0.020 | Aw: 0.058An: 0.040 | Wilcoxon rank-sum test | W = 9501.5 | Aw: 147An: 254 | NA | 2.5e-16 | 0.41 |
| iMM central adapting (laser OFF vs. ON) | Figure 3D (top) | OFF: 0.26ON: 0.21 | OFF: 0.24ON: 0.19 | OFF: 0.096ON: 0.13 | OFF: 0.013ON: 0.019 | OFF: 0.027ON: 0.037 | Wilcoxon signed-rank test | V = 1083 | 52 | NA | 0.00034 | 0.50 |
| iPE central adapting (laser OFF vs. ON) | Figure 3D (middle) | OFF: 0.0077ON: –0.029 | OFF: 0.036ON: 0.0041 | OFF: 0.16ON: 0.16 | OFF: 0.022ON: 0.022 | OFF: 0.043ON: 0.044 | Wilcoxon signed-rank test | V = 907 | 52 | NA | 0.048 | 0.28 |
| iRS central adapting (laser OFF vs. ON) | Figure 3D (bottom) | OFF: 0.25ON: 0.24 | OFF: 0.24ON: 0.24 | OFF: 0.16ON: 0.16 | OFF: 0.023ON: 0.022 | OFF: 0.046ON: 0.045 | Wilcoxon signed-rank test | V = 832 | 52 | NA | 0.19 | 0.18 |
| iMM shell adapting (laser OFF vs. ON) | Figure 3E (top) | OFF: 0.34ON: 0.31 | OFF: 0.32ON: 0.28 | OFF: 0.19ON: 0.20 | OFF: 0.017ON: 0.019 | OFF: 0.035ON: 0.037 | Wilcoxon signed-rank test | V = 4283 | 113 | NA | 0.0023 | 0.29 |
| iPE shell adapting (laser OFF vs. ON) | Figure 3E (middle) | OFF: 0.15ON: 0.14 | OFF: 0.12ON: 0.10 | OFF: 0.30ON: 0.30 | OFF: 0.028ON: 0.028 | OFF: 0.056ON: 0.056 | Wilcoxon signed-rank test | V = 3963 | 113 | NA | 0.034 | 0.20 |
| iRS shell adapting (laser OFF vs. ON) | Figure 3E (bottom) | OFF: 0.19ON: 0.17 | OFF: 0.19ON: 0.16 | OFF: 0.24ON: 0.24 | OFF: 0.023ON: 0.023 | OFF: 0.045ON: 0.045 | Paired t-test | t = 1.6 | 113 | 112 | 0.11 | 0.15 |
| iMM central facilitating (laser OFF vs. ON) | Figure 3G (top) | OFF: –0.32ON: –0.13 | OFF: –0.31ON: –0.11 | OFF: 0.16ON: 0.19 | OFF: 0.042ON: 0.050 | OFF: 0.090ON: 0.11 | Paired t-test | t = –3.5 | 14 | 13 | 0.0036 | 0.95 |
| iPE central facilitating (laser OFF vs. ON) | Figure 3G (middle) | OFF: –0.20ON: –0.17 | OFF: –0.24ON: –0.20 | OFF: 0.20ON: 0.17 | OFF: 0.054ON: 0.044 | OFF: 0.12ON: 0.095 | Paired t-test | t = –1.2 | 14 | 13 | 0.25 | 0.32 |
| iRS central facilitating (laser OFF vs. ON) | Figure 3G (bottom) | OFF: –0.12ON: 0.036 | OFF: –0.092ON: 0.069 | OFF: 0.18ON: 0.24 | OFF: 0.049ON: 0.064 | OFF: 0.11ON: 0.14 | Paired t-test | t = –3.7 | 14 | 13 | 0.0026 | 1.0 |
| iMM shell facilitating (laser OFF vs. ON) | Figure 3H (top) | OFF: –0.29ON: –0.19 | OFF: –0.24ON: –0.15 | OFF: 0.15ON: 0.16 | OFF: 0.024ON: 0.026 | OFF: 0.048ON: 0.052 | Wilcoxon signed-rank test | V = 159 | 38 | NA | 0.0016 | 0.50 |
| iPE shell facilitating (laser OFF vs. ON) | Figure 3H (middle) | OFF: –0.026ON: 0.033 | OFF: 0.011ON: 0.023 | OFF: 0.26ON: 0.29 | OFF: 0.042ON: 0.047 | OFF: 0.085ON: 0.096 | Wilcoxon signed-rank test | V = 227 | 38 | NA | 0.037 | 0.34 |
| iRS shell facilitating (laser OFF vs. ON) | Figure 3H (bottom) | OFF: –0.26ON: –0.23 | OFF: –0.29ON: –0.23 | OFF: 0.32ON: 0.33 | OFF: 0.052ON: 0.054 | OFF: 0.11ON: 0.11 | Wilcoxon signed-rank test | V = 254 | 38 | NA | 0.093 | 0.27 |
| iMM central nonadapting (laser OFF vs. ON) | Figure 4C (top) | OFF: 0.022ON: 0.072 | OFF: 0.023ON: 0.065 | OFF: 0.12ON: 0.14 | OFF: 0.0094ON: 0.011 | OFF: 0.019ON: 0.022 | Wilcoxon signed-rank test | V = 3419 | 155 | NA | 2.7e-06 | 0.38 |
| iPE central nonadapting (laser OFF vs. ON) | Figure 4C (middle top) | OFF: –0.096ON: –0.081 | OFF: –0.098ON: –0.093 | OFF: 0.19ON: 0.19 | OFF: 0.015ON: 0.015 | OFF: 0.030ON: 0.030 | Wilcoxon signed-rank test | V = 5327 | 155 | NA | 0.20 | 0.10 |
| iRS central nonadapting (laser OFF vs. ON) | Figure 4C (middle bottom) | OFF: 0.12ON: 0.15 | OFF: 0.12ON: 0.15 | OFF: 0.15ON: 0.17 | OFF: 0.012ON: 0.013 | OFF: 0.024ON: 0.027 | Wilcoxon signed-rank test | V = 4224 | 155 | NA | 0.0011 | 0.26 |
| iRS > 0 central nonadapting (laser OFF vs. ON) | Figure 4C (bottom) | OFF: 0.17ON: 0.19 | OFF: 0.16ON: 0.18 | OFF: 0.10ON: 0.15 | OFF: 9.1e-03ON: 0.013 | OFF: 1.8e-02ON: 0.026 | Wilcoxon signed-rank test | V = 3313 | 127 | NA | 0.071 | 0.16 |
| iRS < 0 central nonadapting (laser OFF vs. ON) | Figure 4C (bottom) | OFF: –0.13ON: –0.012 | OFF: –0.10ON: –0.017 | OFF: 0.11ON: 0.15 | OFF: 0.021ON: 0.029 | OFF: 0.044ON: 0.060 | Wilcoxon signed-rank test | V = 30 | 25 | NA | 0.00012 | 0.71 |
| iMM shell nonadapting (laser OFF vs. ON) | Figure 4D (top) | OFF: 0.0053ON: 0.023 | OFF: 0.0062ON: 0.028 | OFF: 0.13ON: 0.16 | OFF: 0.0081ON: 0.010 | OFF: 0.016ON: 0.020 | Wilcoxon signed-rank test | V = 12,765 | 243 | NA | 0.076 | 0.11 |
| iPE shell nonadapting (laser OFF vs. ON) | Figure 4D (middle) | OFF: 0.053ON: 0.072 | OFF: 0.059ON: 0.061 | OFF: 0.21ON: 0.20 | OFF: 0.013ON: 0.013 | OFF: 0.026ON: 0.026 | Wilcoxon signed-rank test | V = 13,474 | 243 | NA | 0.22 | 0.079 |
| iRS shell nonadapting (laser OFF vs. ON) | Figure 4D (bottom) | OFF: –0.048ON: –0.049 | OFF: –0.042ON: –0.041 | OFF: 0.23ON: 0.22 | OFF: 0.015ON: 0.014 | OFF: 0.029ON: 0.028 | Wilcoxon signed-rank test | V = 14,344 | 243 | NA | 0.66 | 0.028 |
| FR change standard central adapting | Figure 5A | 2.1 | 2.0 | 5.6 | 0.78 | 1.6 | One-sample t-test | t = 2.7 | 52 | 51 | 0.0092 | 0.38 |
| FR change cascade central adapting | Figure 5A | –0.38 | 0.67 | 6.9 | 0.95 | 1.9 | One-sample t-test | t = –0.40 | 52 | 51 | 0.69 | 0.056 |
| FR change deviant central adapting | Figure 5A | –2.3 | –2.2 | 5.6 | 0.78 | 1.6 | One-sample t-test | t = –2.9 | 52 | 51 | 0.0054 | 0.40 |
| FR change standard shell adapting | Figure 5B | 0.64 | 0.89 | 5.3 | 0.50 | 0.98 | One-sample Wilcoxon test | V = 3760 | 113 | NA | 0.035 | 0.20 |
| FR change cascade shell adapting | Figure 5B | 0.50 | 0.44 | 7.3 | 0.68 | 1.4 | One-sample t-test | t = 0.74 | 113 | 112 | 0.46 | 0.069 |
| FR change deviant shell adapting | Figure 5B | –1.8 | –1.3 | 7.4 | 0.69 | 1.4 | One-sample Wilcoxon test | V = 2040 | 113 | NA | 0.0057 | 0.26 |
| FR change standard central facilitating | Figure 5C | –6.3 | –7.3 | 5.8 | 1.6 | 3.4 | One-sample t-test | t = –4.1 | 14 | 13 | 0.0013 | 1.1 |
| FR change cascade central facilitating | Figure 5C | –0.44 | –0.89 | 4.1 | 1.1 | 2.4 | One-sample t-test | t = –0.40 | 14 | 13 | 0.69 | 0.11 |
| FR change deviant central facilitating | Figure 5C | 1.5 | 1.3 | 3.4 | 0.92 | 2.0 | One-sample t-test | t = 1.7 | 14 | 13 | 0.12 | 0.45 |
| FR change standard shell facilitating | Figure 5D | –2.7 | –3.1 | 5.4 | 0.87 | 1.8 | One-sample t-test | t = –3.1 | 38 | 37 | 0.0042 | 0.50 |
| FR change cascade shell facilitating | Figure 5D | 0.36 | 0.44 | 5.1 | 0.84 | 1.7 | One-sample t-test | t = 0.43 | 38 | 37 | 0.67 | 0.070 |
| FR change deviant shell facilitating | Figure 5D | 2.6 | 2.7 | 4.5 | 0.74 | 1.5 | One-sample t-test | t = 3.5 | 38 | 37 | 0.0013 | 0.57 |
| FR change standard central nonadapting | Figure 5E | –2.5 | –2.2 | 6.2 | 0.50 | 0.99 | One-sample Wilcoxon test | V = 2995 | 155 | NA | 1.4e-06 | 0.38 |
| FR change cascade central nonadapting | Figure 5E | –0.68 | –0.44 | 6.3 | 0.51 | 1.0 | One-sample t-test | t = –1.3 | 155 | 154 | 0.18 | 0.11 |
| FR change deviant central nonadapting | Figure 5E | 0.57 | 0.0 | 5.8 | 0.47 | 0.93 | One-sample t-test | t = 1.2 | 155 | 154 | 0.22 | 0.098 |
| FR change standard shell nonadapting | Figure 5F | –0.63 | –0.44 | 5.3 | 0.34 | 0.68 | One-sample Wilcoxon test | V = 11,050 | 243 | NA | 0.035 | 0.14 |
| FR change cascade shell nonadapting | Figure 5F | –0.51 | –0.44 | 5.1 | 0.32 | 0.64 | One-sample Wilcoxon test | V = 12,157 | 243 | NA | 0.15 | 0.089 |
| FR change deviant shell nonadapting | Figure 5F | –0.059 | 0.0 | 5.0 | 0.32 | 0.64 | One-sample t-test | t = –0.18 | 243 | 242 | 0.86 | 0.012 |
| FR central facilitating (first vs. last standard) | Figure 6C | First: 31Last: 36 | First: 29Last: 31 | First: 15Last: 16 | First: 3.9Last: 4.4 | First: 8.5Last: 9.5 | Wilcoxon signed-rank test | V = 0 | 14 | NA | 0.0017 | 0.87 |
| FR shell facilitating (first vs. last standard) | Figure 6D | First: 53Last: 57 | First: 38Last: 42 | First: 38Last: 42 | First: 6.2Last: 6.8 | First: 13Last: 14 | Wilcoxon signed-rank test | V = 92 | 38 | NA | 9.3e-05 | 0.64 |
| FR central adapting (cascade vs. many standards) | Figure 3—figure supplement 2B (left) | Casc: 61MS: 63 | Casc: 50MS: 52 | Casc: 38MS: 40 | Casc: 5.2MS: 5.6 | Casc: 10MS: 11 | Wilcoxon signed-rank test | V = 595 | 52 | NA | 0.39 | 0.12 |
| FR central facilitating (cascade vs. many standards) | Figure 3—figure supplement 2B (right) | Casc: 29MS: 31 | Casc: 26MS: 28 | Casc: 14MS: 16 | Casc: 3.8MS: 4.3 | Casc: 8.2MS: 9.3 | Wilcoxon signed-rank test | V = 41 | 14 | NA | 0.49 | 0.19 |
| FR shell adapting (cascade vs. many standards) | Figure 3—figure supplement 2C (left) | Casc: 64MS: 66 | Casc: 43MS: 41 | Casc: 61MS: 68 | Casc: 5.7MS: 6.4 | Casc: 11MS: 13 | Wilcoxon signed-rank test | V = 2653 | 113 | NA | 0.46 | 0.064 |
| FR shell facilitating (cascade vs. many standards) | Figure 3—figure supplement 2C (right) | Casc: 43MS: 45 | Casc: 24MS: 28 | Casc: 41MS: 52 | Casc: 6.6MS: 8.4 | Casc: 13MS: 17 | Wilcoxon signed-rank test | V = 264.5 | 38 | NA | 0.41 | 0.14 |
| Central iMM OFF (single vs. multiunit) | Figure 3—figure supplement 3 (left) | Single: 0.045Multi: 0.057 | Single: 0.048Multi: 0.064 | Single: 0.15Multi: 0.18 | Single: 0.052Multi: 0.013 | Single: 0.12Multi: 0.025 | Wilcoxon rank-sum test | W = 825 | Single: 8Multi: 213 | NA | 0.88 | 0.010 |
| Central iMM ON (single vs. multiunit) | Figure 3—figure supplement 3 (left) | Single: 0.087Multi: 0.092 | Single: 0.085Multi: 0.086 | Single: 0.17Multi: 0.16 | Single: 0.059Multi: 0.011 | Single: 0.14Multi: 0.022 | Student’s t-test | t = –0.093 | Single: 8Multi: 213 | 7.5 | 0.93 | 0.034 |
| Shell iMM OFF (single vs. multiunit) | Figure 3—figure supplement 3 (right) | Single: 0.035Multi: 0.081 | Single: 0.028Multi: 0.055 | Single: 0.18Multi: 0.25 | Single: 0.022Multi: 0.014 | Single: 0.045Multi: 0.027 | Wilcoxon rank-sum test | W = 9832 | Single: 67Multi: 327 | NA | 0.19 | 0.067 |
| Shell iMM ON (single vs. multiunit) | Figure 3—figure supplement 3 (right) | Single: 0.046Multi: 0.091 | Single: 0.045Multi: 0.072 | Single: 0.21Multi: 0.23 | Single: 0.026Multi: 0.013 | Single: 0.051Multi: 0.025 | Wilcoxon rank-sum test | W = 9883 | Single: 67Multi: 327 | NA | 0.21 | 0.064 |
-
iRS: index of repetition suppression; iPE: index of prediction error; iMM: index of neuronal mismatch; Aw: awake; An: anesthetized; casc: cascading; MS: many standards.
Table 2
Statistical comparisons for control data.
| Comparison | Figure | Mean | Median | SD | SEM | CI (±) | Test | Test statistic | N | df | p | Effect size |
|---|---|---|---|---|---|---|---|---|---|---|---|---|
| iMM central (control vs. experimental) | Figure 3—figure supplement 1B (left) | Con: 0.092Exp: 0.057 | Con: 0.086Exp: 0.064 | Con: 0.16Exp: 0.18 | Con: 0.011Exp: 0.012 | Con: 0.022Exp: 0.024 | Wilcoxon rank-sum test | W = 7919 | 77 (control)221 (exp.) | NA | 0.37 | 0.052 |
| iMM shell (control vs. experimental) | Figure 3—figure supplement 1B (right) | Con: 0.083Exp: 0.073 | Con: 0.069Exp: 0.053 | Con: 0.23Exp: 0.24 | Con: 0.012Exp: 0.012 | Con: 0.023Exp: 0.024 | Wilcoxon rank-sum test | W = 22,364 | 119 (control)394 (exp.) | NA | 0.45 | 0.034 |
| iMM central adapting (laser OFF vs. ON) | Figure 3—figure supplement 1C (top) | OFF: 0.35ON: 0.33 | OFF: 0.35ON: 0.32 | OFF: 0.11ON: 0.15 | OFF: 0.026ON: 0.034 | OFF: 0.054ON: 0.072 | Wilcoxon signed-rank test | V = 124 | 18 | NA | 0.099 | 0.40 |
| iPE central adapting (laser OFF vs. ON) | Figure 3—figure supplement 1C (middle) | OFF: 0.16ON: 0.19 | OFF: 0.10ON: 0.081 | OFF: 0.39ON: 0.40 | OFF: 0.091ON: 0.094 | OFF: 0.19ON: 0.20 | Paired t-test | t = –1.1 | 18 | 17 | 0.30 | 0.25 |
| iRS central adapting (laser OFF vs. ON) | Figure 3—figure supplement 1C (bottom) | OFF: 0.19ON: 0.14 | OFF: 0.24ON: 0.14 | OFF: 0.38ON: 0.37 | OFF: 0.090ON: 0.087 | OFF: 0.19ON: 0.18 | Paired t-test | t = 1.9 | 18 | 17 | 0.077 | 0.44 |
| iMM shell adapting (laser OFF vs. ON) | Figure 3—figure supplement 1D (top) | OFF: 0.38ON: 0.38 | OFF: 0.35ON: 0.38 | OFF: 0.19ON: 0.22 | OFF: 0.032ON: 0.037 | OFF: 0.065ON: 0.075 | Paired t-test | t = –0.0013 | 35 | 34 | 0.99 | 0.00022 |
| iPE shell adapting (laser OFF vs. ON) | Figure 3—figure supplement 1D (middle) | OFF: 0.16ON: 0.14 | OFF: 0.12ON: 0.15 | OFF: 0.24ON: 0.26 | OFF: 0.041ON: 0.044 | OFF: 0.083ON: 0.090 | Paired t-test | t = 0.58 | 35 | 34 | 0.56 | 0.099 |
| iRS shell adapting (laser OFF vs. ON) | Figure 3—figure supplement 1D (bottom) | OFF: 0.22ON: 0.24 | OFF: 0.24ON: 0.20 | OFF: 0.23ON: 0.22 | OFF: 0.040ON: 0.038 | OFF: 0.081ON: 0.077 | Paired t-test | t = –0.78 | 35 | 34 | 0.44 | 0.13 |
| iMM central facilitating (laser OFF vs. ON) | Figure 3—figure supplement 1E (top) | OFF: –0.37ON: –0.33 | OFF: –0.36ON: –0.37 | OFF: 0.15ON: 0.18 | OFF: 0.077ON: 0.090 | OFF: 0.25ON: 0.29 | Paired t-test | t = –1.1 | 4 | 3 | 0.34 | 0.57 |
| iPE central facilitating (laser OFF vs. ON) | Figure 3—figure supplement 1E (middle) | OFF: –0.043ON: 0.030 | OFF: –0.0047ON: 0.077 | OFF: 0.47ON: 0.45 | OFF: 0.24ON: 0.22 | OFF: 0.75ON: 0.71 | Paired t-test | t = –0.93 | 4 | 3 | 0.42 | 0.47 |
| iRS central facilitating (laser OFF vs. ON) | Figure 3—figure supplement 1E (bottom) | OFF: –0.33ON: –0.36 | OFF: –0.49ON: –0.53 | OFF: 0.55ON: 0.60 | OFF: 0.27ON: 0.30 | OFF: 0.87ON: 0.95 | Paired t-test | t = 0.49 | 4 | 3 | 0.66 | 0.24 |
| iMM shell facilitating (laser OFF vs. ON) | Figure 3—figure supplement 1F (top) | OFF: –0.38ON: –0.31 | OFF: –0.32ON: –0.30 | OFF: 0.22ON: 0.20 | OFF: 0.048ON: 0.043 | OFF: 0.10ON: 0.090 | Wilcoxon signed-rank test | V = 63 | 21 | NA | 0.070 | 0.40 |
| iPE shell facilitating (laser OFF vs. ON) | Figure 3—figure supplement 1F (middle) | OFF: –0.090ON: –0.094 | OFF: –0.11ON: –0.081 | OFF: 0.18ON: 0.20 | OFF: 0.040ON: 0.044 | OFF: 0.083ON: 0.093 | Wilcoxon signed-rank test | V = 109 | 21 | NA | 0.84 | 0.050 |
| iRS shell facilitating (laser OFF vs. ON) | Figure 3—figure supplement 1F (bottom) | OFF: –0.29ON: –0.21 | OFF: –0.28ON: –0.15 | OFF: 0.24ON: 0.21 | OFF: 0.053ON: 0.047 | OFF: 0.11ON: 0.097 | Paired t-test | t = –1.8 | 21 | 20 | 0.091 | 0.39 |
| iMM central nonadapting (laser OFF vs. ON) | Figure 3—figure supplement 1G (top) | OFF: 0.021ON: 0.060 | OFF: 0.014ON: 0.050 | OFF: 0.24ON: 0.23 | OFF: 0.032ON: 0.031 | OFF: 0.064ON: 0.063 | Paired t-test | t = –1.8 | 55 | 54 | 0.075 | 0.24 |
| iPE central nonadapting (laser OFF vs. ON) | Figure 3—figure supplement 1G (middle) | OFF: 0.12ON: 0.14 | OFF: 0.034ON: 0.092 | OFF: 0.34ON: 0.35 | OFF: 0.046ON: 0.047 | OFF: 0.092ON: 0.095 | Paired t-test | t = –1.2 | 55 | 54 | 0.23 | 0.16 |
| iRS central nonadapting (laser OFF vs. ON) | Figure 3—figure supplement 1G (bottom) | OFF: –0.095ON: –0.083 | OFF: –0.064ON: –0.072 | OFF: 0.31ON: 0.29 | OFF: 0.042ON: 0.038 | OFF: 0.084ON: 0.077 | Paired t-test | t = –0.57 | 55 | 54 | 0.57 | 0.077 |
| iMM shell nonadapting (laser OFF vs. ON) | Figure 3—figure supplement 1H (top) | OFF: 0.063ON: 0.051 | OFF: 0.040ON: 0.031 | OFF: 0.16ON: 0.22 | OFF: 0.021ON: 0.027 | OFF: 0.042ON: 0.054 | Wilcoxon signed-rank test | V = 1133 | 63 | NA | 0.39 | 0.11 |
| iPE shell nonadapting (laser OFF vs. ON) | Figure 3—figure supplement 1H (middle) | OFF: 0.053ON: 0.027 | OFF: 0.0ON: 0.0 | OFF: 0.25ON: 0.26 | OFF: 0.031ON: 0.032 | OFF: 0.063ON: 0.065 | Paired t-test | t = 0.88 | 63 | 62 | 0.38 | 0.11 |
| iRS shell nonadapting (laser OFF vs. ON) | Figure 3—figure supplement 1H (bottom) | OFF: 0.011ON: 0.024 | OFF: 0.028ON: 0.041 | OFF: 0.27ON: 0.28 | OFF: 0.034ON: 0.035 | OFF: 0.068ON: 0.071 | Paired t-test | t = –0.43 | 63 | 62 | 0.67 | 0.054 |
| iRS > 0 central nonadapting (laser OFF vs. ON) | N/A | OFF: 0.21ON: 0.18 | OFF: 0.20ON: 0.16 | OFF: 0.12ON: 0.16 | OFF: 0.026ON: 0.034 | OFF: 0.054ON: 0.070 | Paired t-test | t = 1.5 | 22 | 21 | 0.16 | 0.31 |
| iRS < 0 central nonadapting (laser OFF vs. ON) | N/A | OFF: –0.31ON: –0.26 | OFF: –0.27ON: –0.27 | OFF: 0.21ON: 0.21 | OFF: 0.036ON: 0.037 | OFF: 0.074ON: 0.075 | Paired t-test | t = –1.7 | 32 | 31 | 0.099 | 0.30 |
-
iRS: index of repetition suppression; iPE: index of prediction error; iMM: index of neuronal mismatch.
Key resources table
| Reagent type (species) or resource | Designation | Source or reference | Identifiers | Additional information |
|---|---|---|---|---|
| Strain, strain background (Mus musculus) | Cdh23 mice | Jackson Laboratories | Cdh23tm2.1Kjn/J;RRID:IMSR_JAX:018399 | |
| Recombinant DNA reagent | AAV9-CAG-FLEX-ArchT-tdTomato | UNC Vector Core | Addgene_28305 | |
| Recombinant DNA reagent | RetroAAV2 hSyn Cre-GFP | In-house | Vector generated and maintained in the di Biasi lab | |
| Software, algorithm | Kilosort2 | Marius Pachitariu | https://github.com/MouseLand/Kilosort; RRID:SCR_016422 | |
| Software, algorithm | MATLAB | MathWorks | https://www.mathworks.com/; RRID:SCR_001622 | |
| Software, algorithm | ImageJ | NIH | RRID:SCR_003070 |
Additional files
Download links
A two-part list of links to download the article, or parts of the article, in various formats.
Downloads (link to download the article as PDF)
Open citations (links to open the citations from this article in various online reference manager services)
Cite this article (links to download the citations from this article in formats compatible with various reference manager tools)
Corticofugal regulation of predictive coding
eLife 11:e73289.
https://doi.org/10.7554/eLife.73289


