Clp protease and antisense RNA jointly regulate the global regulator CarD to mediate mycobacterial starvation response
- State Key Laboratory of Agricultural Microbiology & Hubei Hongshan Laboratory, College of Life Science and Technology, Huazhong Agricultural University, China
- National Center for Biotechnology Information, National Library of Medicine, National Institutes of Health, United States
Figures
Figure 1 with 1 supplement
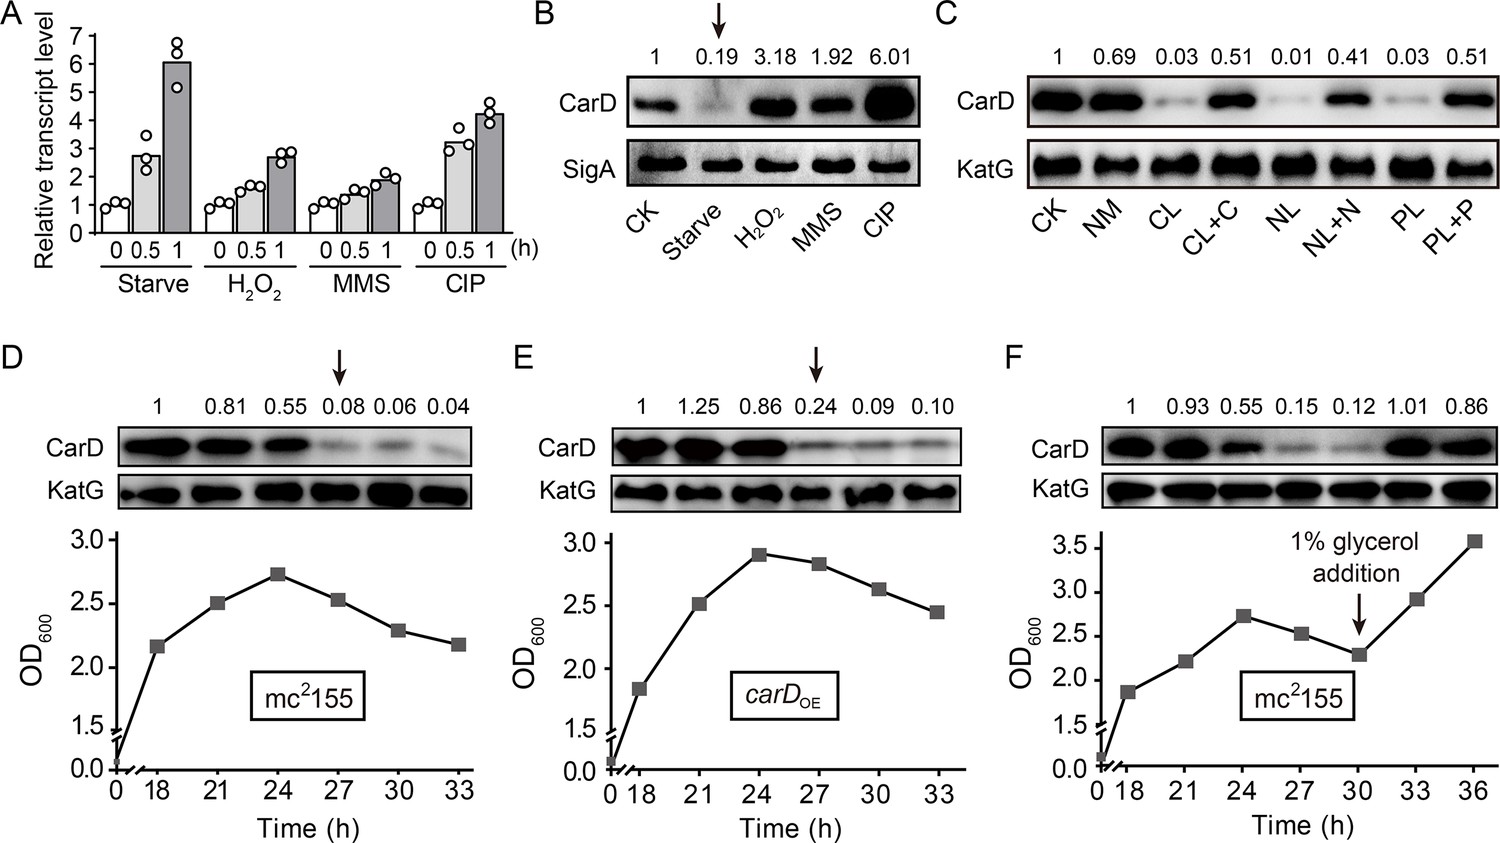
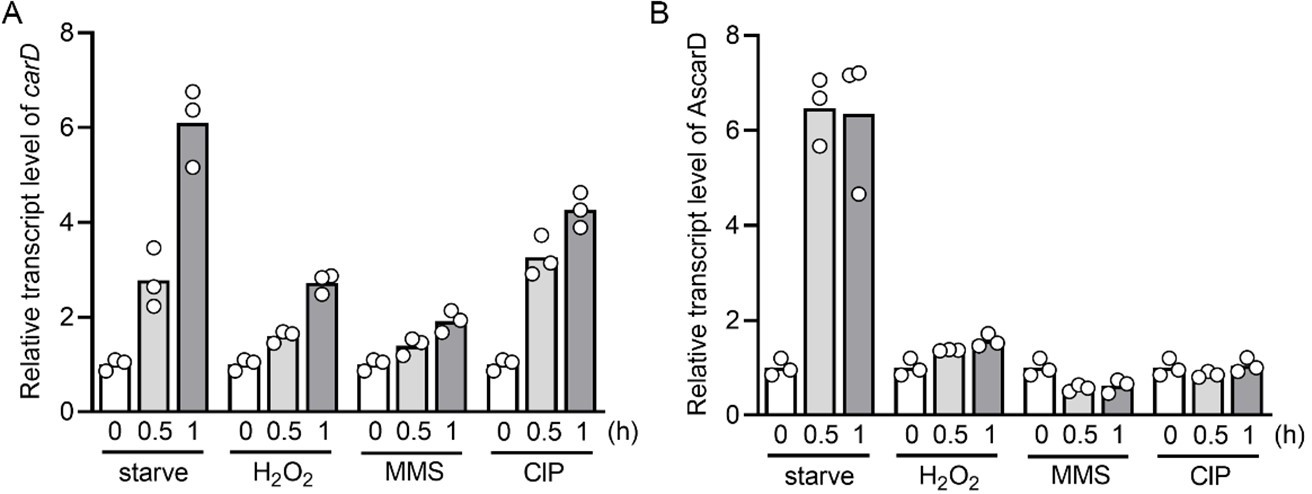
Changes of CarD transcript and protein levels under starvation and genotoxic stress.
(A, B) The transcript and protein levels of CarD, respectively, under different stress conditions. The carD transcript levels in the treated exponential mc2155 cells were measured by qRT-PCR, normalized to the sigA transcript levels, and expressed as the fold change of untreated cells. CK indicates the untreated cells of mc2155. ‘Starve’ means that mc2155 cells were first cultured in the 7H9 medium, and then transferred to phosphate-buffered saline (PBS) for 0.5 or 1 hr. For stimulation experiments, 10 mM H2O2, 0.1% methyl methanesulfonate (MMS), and 10 μg/ml of ciprofloxacin (CIP) were used. Individual data for the three biological replicates are shown in the corresponding columns. Western blot was used to detect the CarD protein levels under the same treatment conditions with SigA serving as the internal reference protein. (C) Protein levels of CarD under distinct starvation conditions. CK indicates the untreated exponential cells; NM indicates the exponential cells transferred into the normal medium for 4 hr; CL, NL, and PL indicate the exponential cells transferred into carbon-, nitrogen-, and phosphorus-limited media for 4 hr, respectively; CL + C, NL + N, and PL + P indicate the starved mc2155 cultures supplemented with the corresponding nutrients for 4 hr. KatG was used as the control in the Western blot experiments. CarD protein levels at the different growth stages in mc2155 (D, F), and carD overexpressing strain (carDOE, panel E). The lower part of the chart shows the respective growth curves with the sampling times. For panels (B–F), the number above each band of the Western blot represents their relative quantitative values, which are normalized with respect to their corresponding loading controls. For panels (B, D, and E), arrows above the Western blot results indicate the sharp decrease in CarD levels under starvation or stationary phase.
-
Figure 1—source data 1
Changes of carD transcript levels under starvation and genotoxic stress (numerical data for Figure 1A).
- https://cdn.elifesciences.org/articles/73347/elife-73347-fig1-data1-v2.xlsx
Figure 1—figure supplement 1
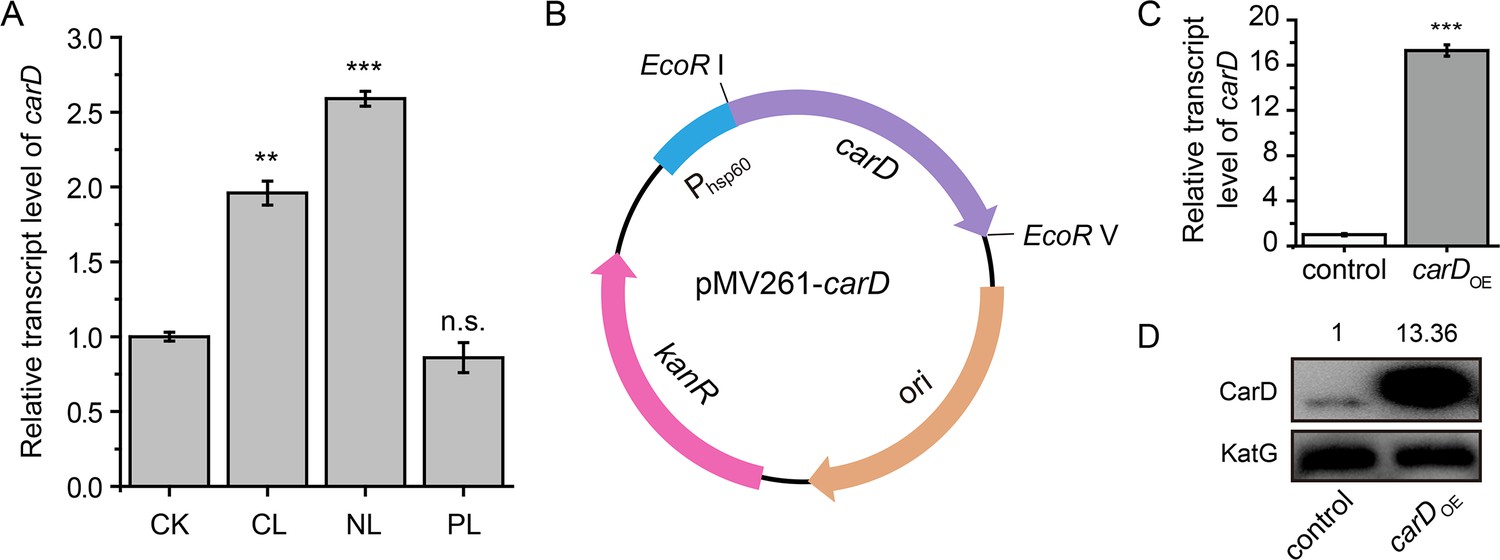
Changes of carD levels in M. smegmatis under different conditions and different strains.
(A) carD transcript levels under different starvation conditions. CK represents untreated exponential cells; CL, NL, and PL represent exponential cells transferred into carbon-, nitrogen-, and phosphorus-limiting media for 4 hr, respectively. Statistical analysis was done using Student’s t-test, with ** indicating p value <0.005, *** indicating p value <0.001, and n.s. indicating p value >0.05. Error bars indicate the standard deviation of three biological replicates. (B) Schematic diagram for the construction of the carD overexpression plasmid. The coding sequence of carD was cloned into multiple-copy plasmid pMV261 between the EcoRI and EcoRV restriction sites, which allowed carD to be transcribed from the hsp60 promoter on the plasmid. (C, D) The mRNA and protein levels of carD in the control and carD overexpression strains (carDOE), respectively. The number above each band of the Western blot represents their relative quantitative values, which are normalized with respect to their corresponding loading controls.
Figure 2 with 1 supplement
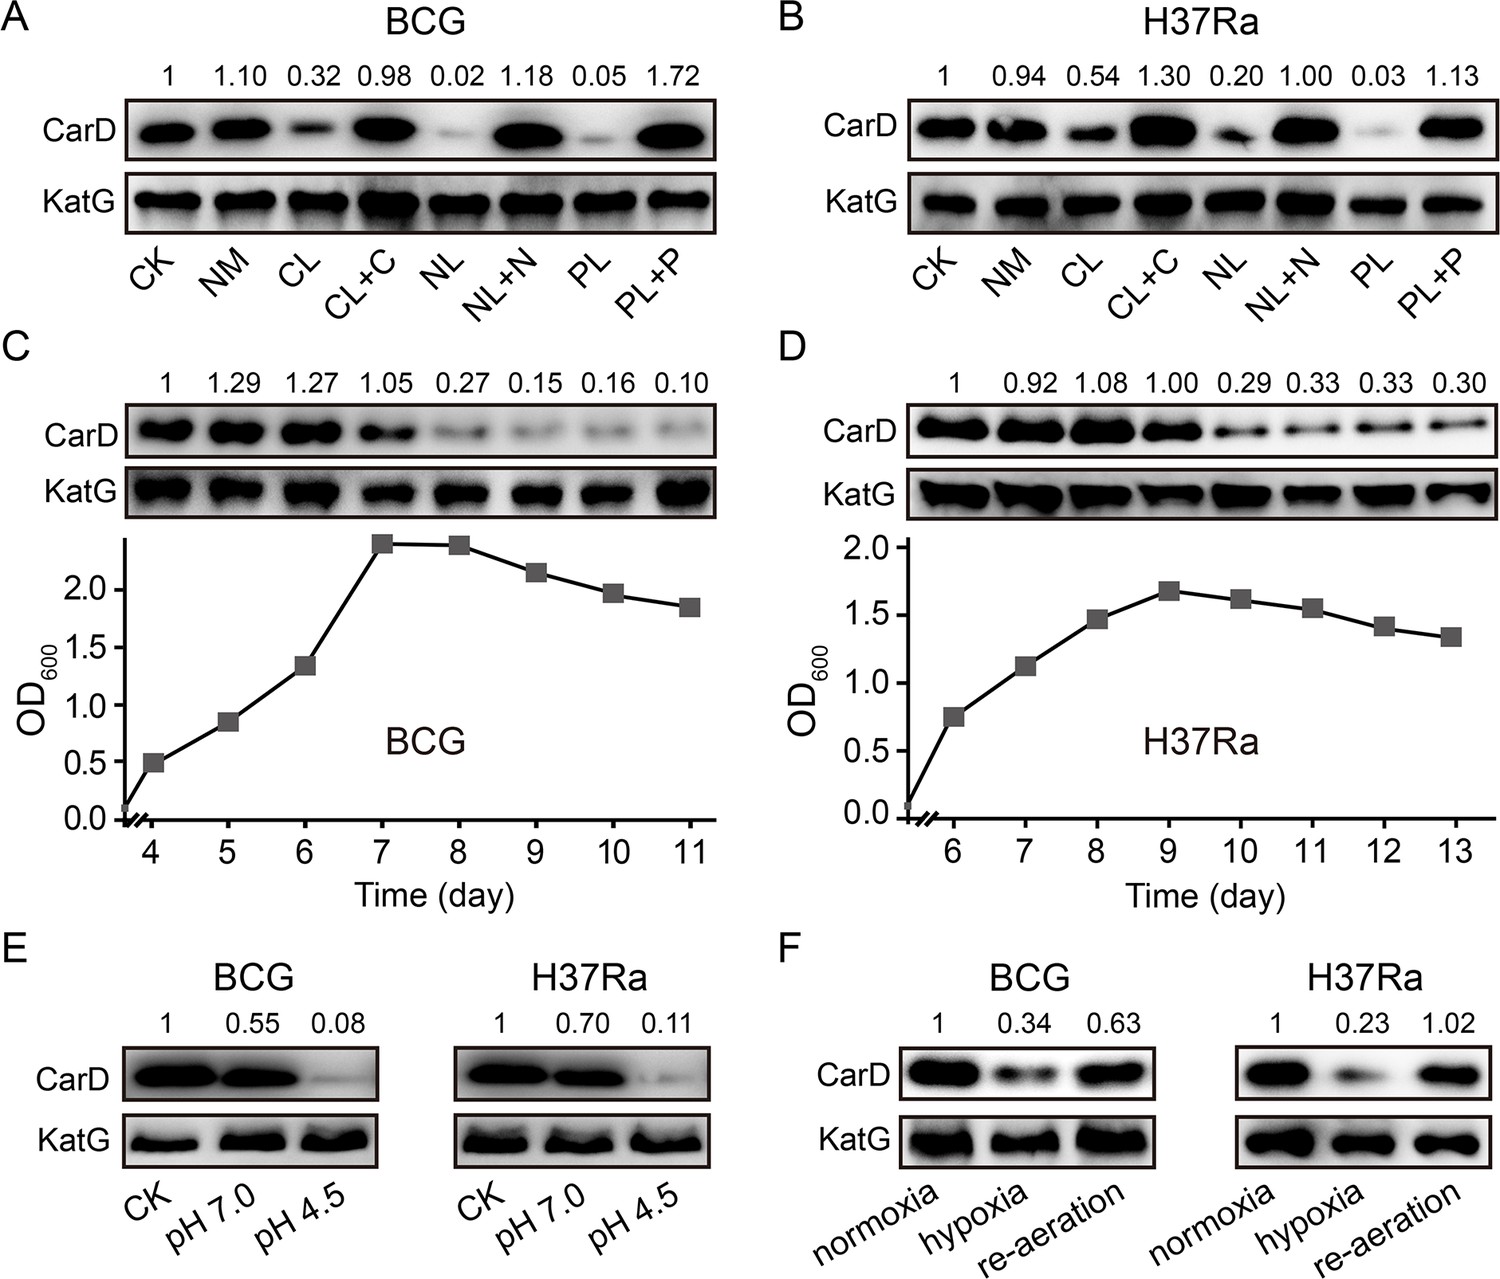
Changes of CarD levels in M.bovis BCG and M. tuberculosis H37Ra under host-like stress conditions.
(A, B) The protein levels of CarD in BCG and H37Ra strains, respectively, under distinct starvation conditions. (C, D) CarD protein levels at the different growth stages of BCG and H37Ra, respectively. (E) CarD protein levels in BCG and H37Ra under different pH conditions. (F) CarD protein levels in BCG and H37Ra under different oxygen availability conditions. For all panels, the number above each band of the Western blot represents their relative quantitative values, which are normalized with respect to their corresponding loading controls.
Figure 2—figure supplement 1
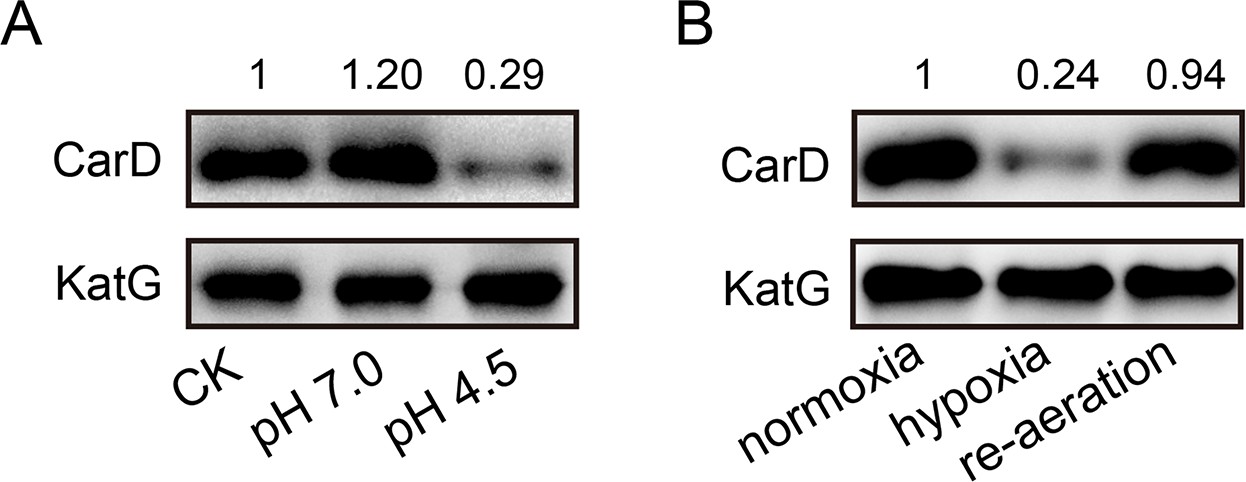
Changes of CarD levels in M. smegmatis under host-like stress conditions.
(A) CarD protein levels in mc2155 under different pH conditions. CK indicates the untreated exponential cells; pH 7.0 and 4.5 indicate the exponential cells transferred into the media with corresponding pH values for 4 hr. (B) CarD protein levels in mc2155 under different oxygen availability conditions. The number above each band of the Western blot represents their relative quantitative values, which are normalized with respect to their corresponding loading controls.
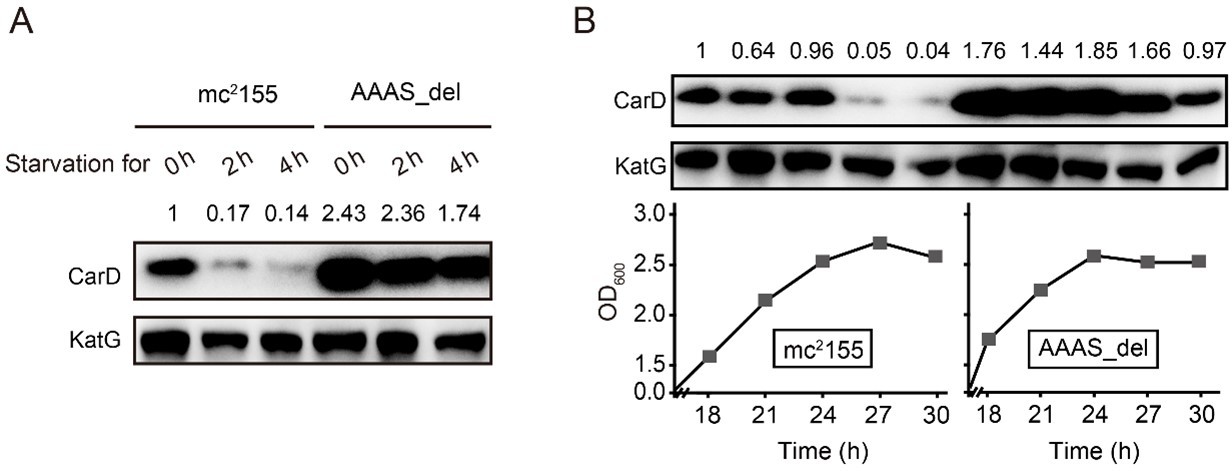
Figure 3 with 2 supplements
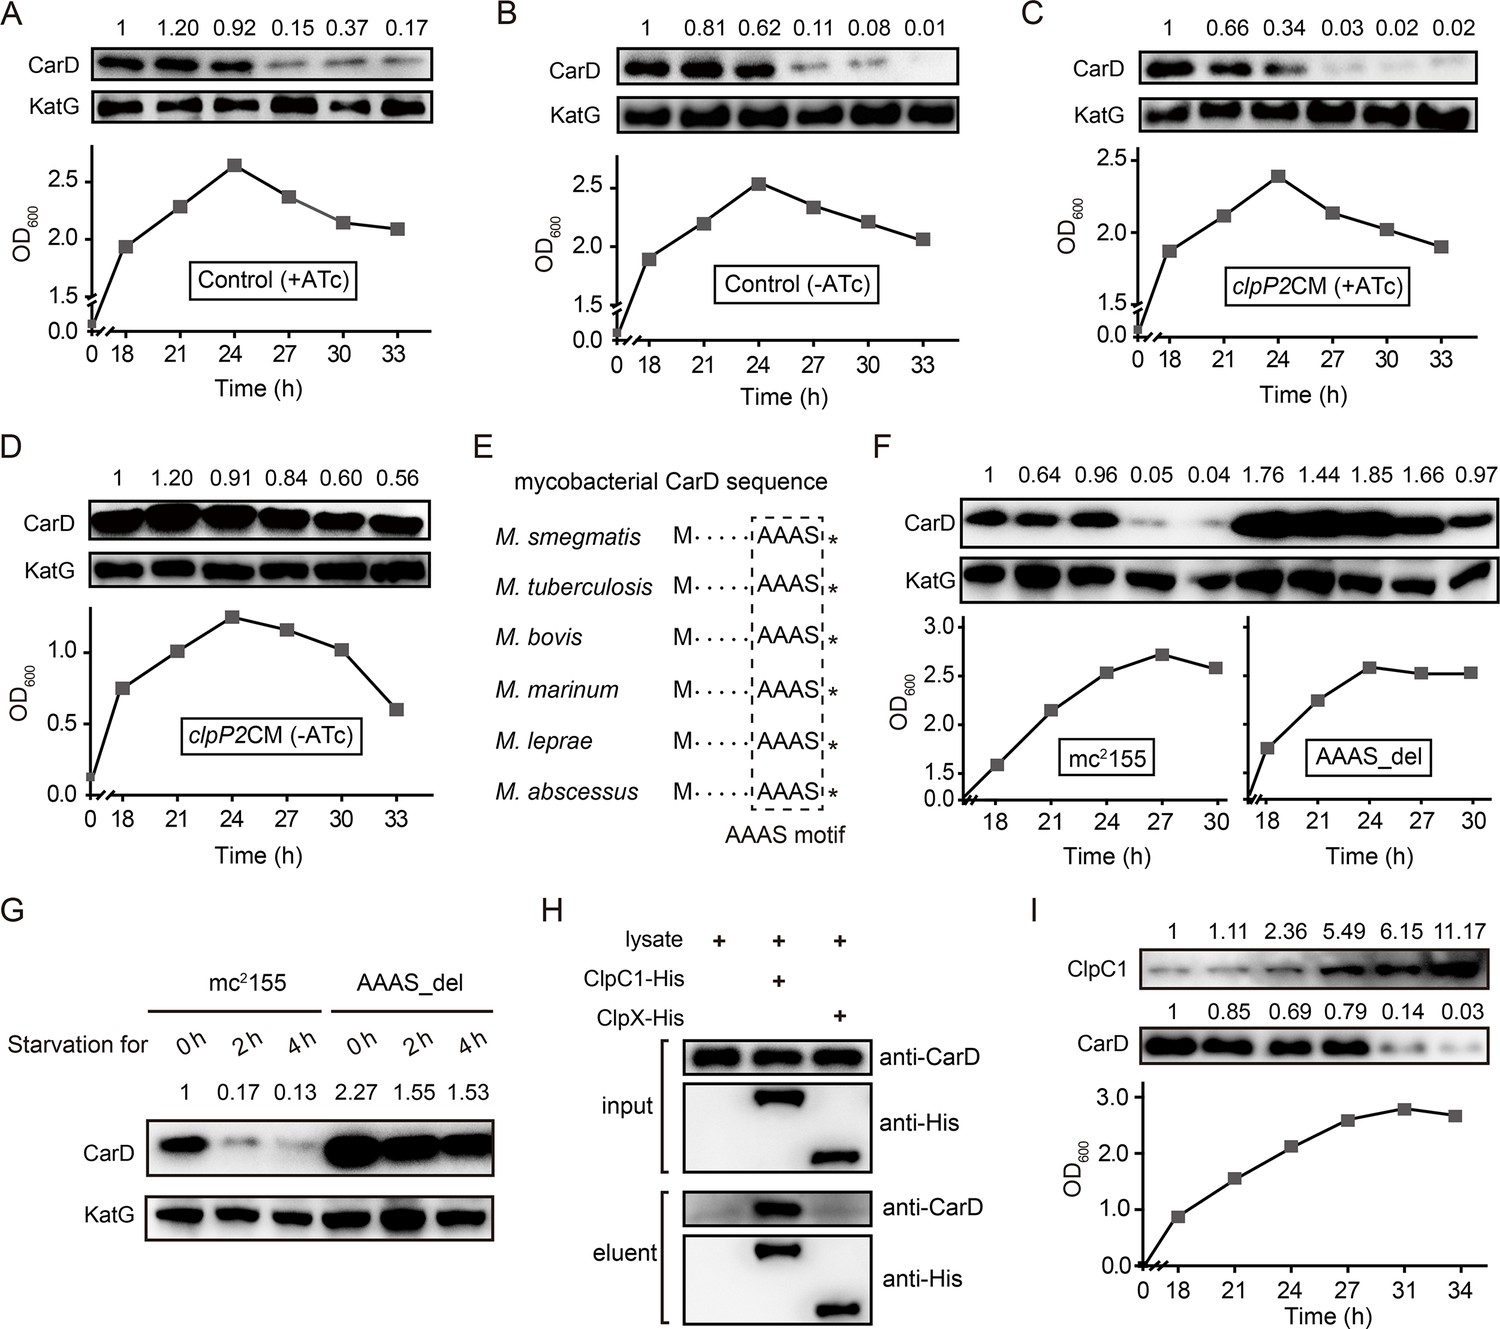
Clp protease is responsible for CarD degradation in the stationary phase.
(A–D) The cells were first cultured in anhydrotetracycline (ATc)-containing medium to the exponential phase (OD600 ≈ 1.5), then harvested, washed, and reinoculated in a fresh medium with or without ATc. 0 hr is the time when exponential cells were reinoculated into the fresh medium. (A, B) The intracellular CarD levels at different time points of the ATc-induced and ATc-uninduced control cells (Ms/pRH2502-clpP2), respectively. (C, D) The CarD levels at different time points of the ATc-induced and ATc-uninduced clpP2CM (clpP2 conditional mutant) cells, respectively. KatG was used as the control in the Western blot experiments. (E) Conservation of the LAAAS motif in mycobacterial CarD. The asterisk after the LAAAS motif indicates the stop codon. (F) CarD protein levels at the different growth stages of mc2155 and AAAS_del cells. (G) The starvation experiments of mc2155 and AAAS_del cells. (H) Verification of the interaction between CarD and ClpC1/ClpX by pull-down assay. (I) Protein levels of ClpC1 and CarD at different growth phases. For panels A–D, F–G, and I, the number above each band of the Western blot represents their relative quantitative values.
Figure 3—figure supplement 1
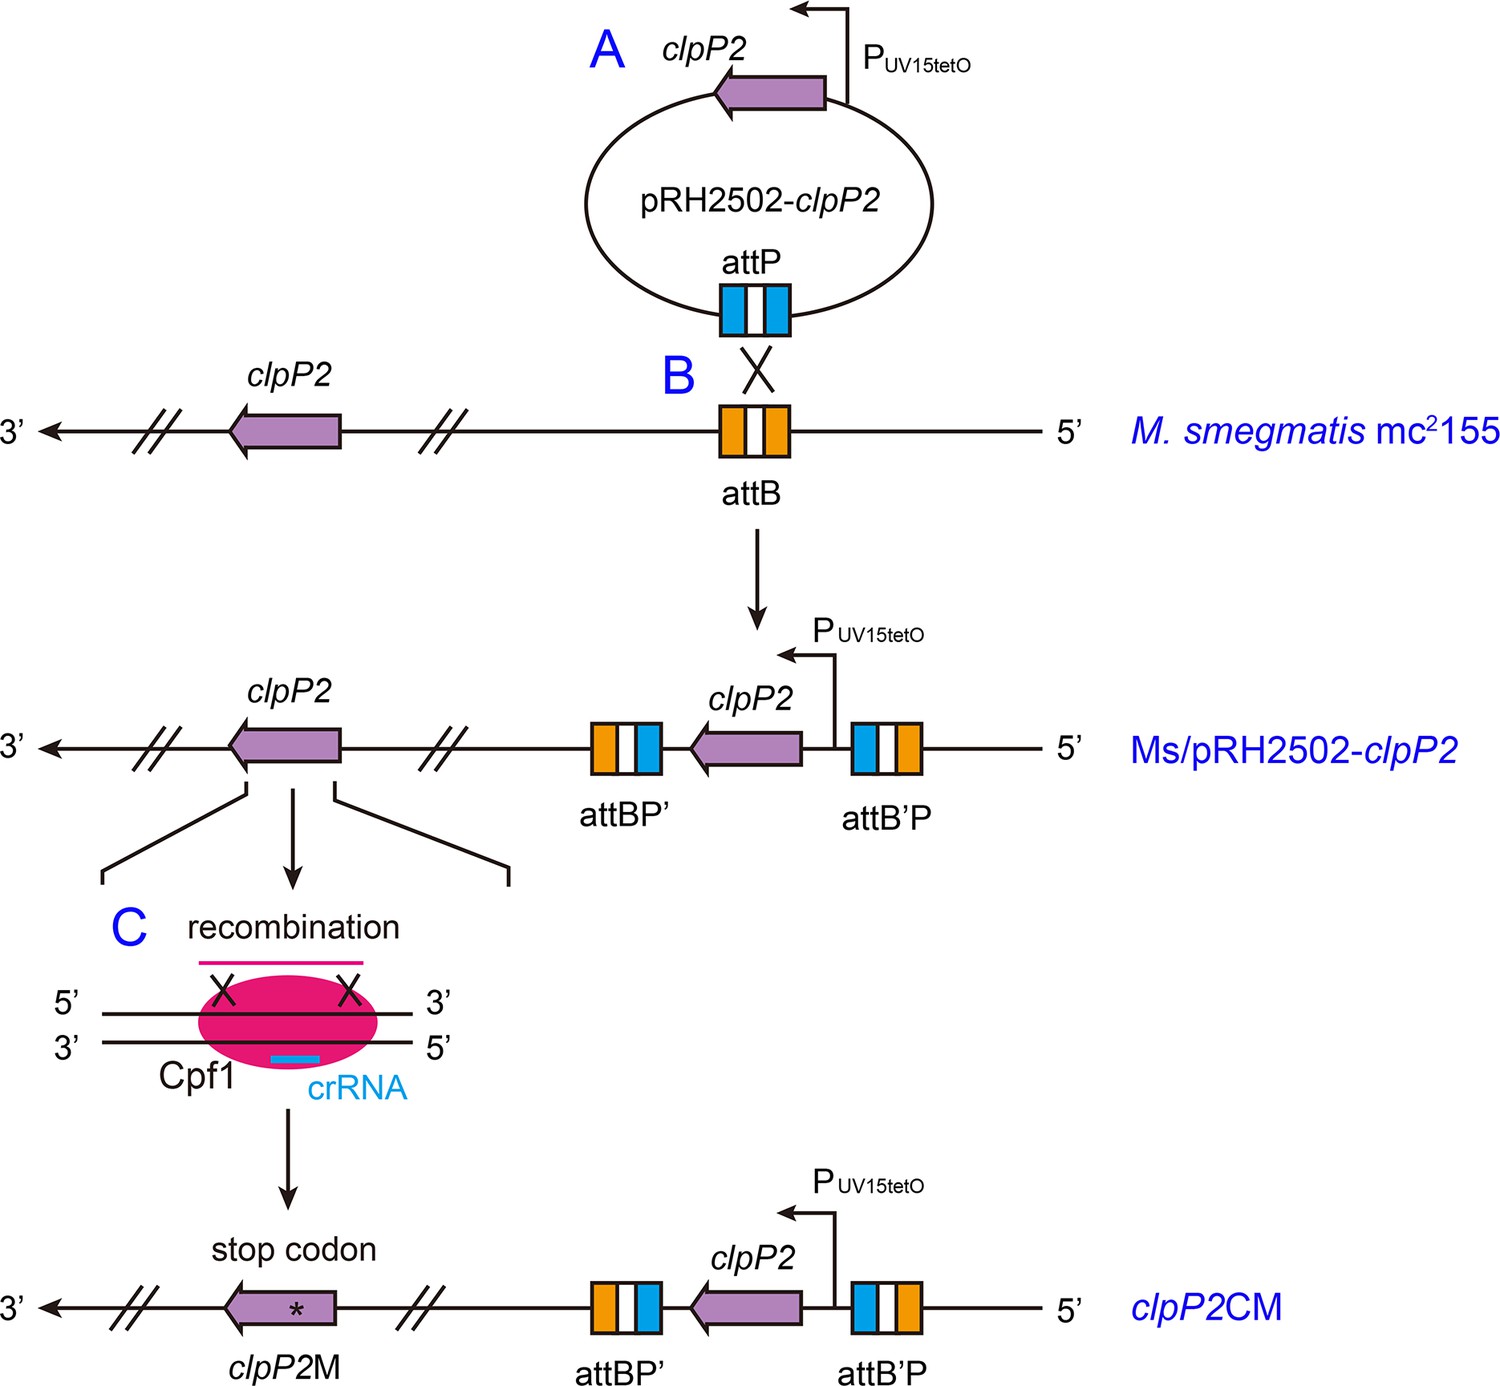
Schematic diagram for the construction of the clpP2 conditional mutant.
(A) clpP2 gene amplified with clpP2-F/R primer pair (Supplementary file 3) was ligated to the pRH2502 integration plasmid to obtain pRH2502-clpP2 recombinant plasmid, in which clpP2 is under the control of anhydrotetracycline (ATc)-inducible promoter PUV15tetO. (B) The pRH2502-clpP2 plasmid was transformed and integrated into mc2155 genome by attB–attP-mediated site-specific recombination, to obtain Ms/pRH2502-clpP2 strain. (C) CRISPR/Cpf1-mediated mutagenesis was used for the mutation of the endogenous clpP2 gene to obtain the clpP2 conditional mutant clpP2CM.
Figure 3—figure supplement 2
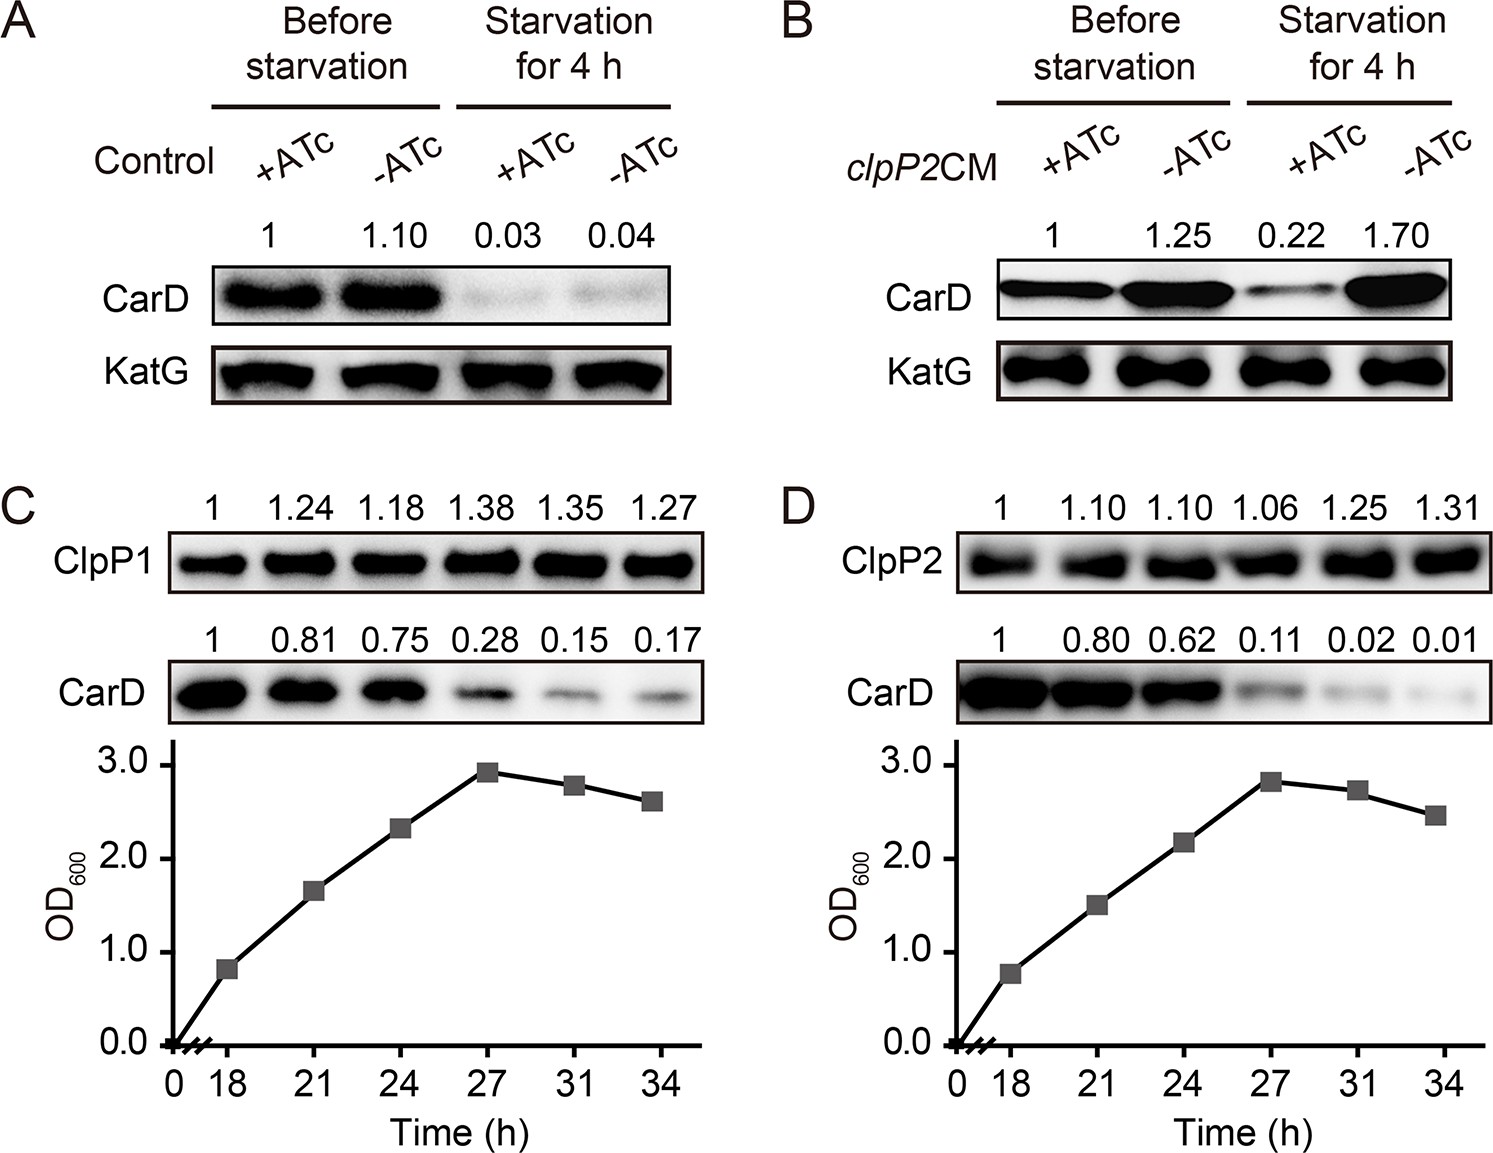
Clp protease degrades CarD under the starvation condition.
(A, B) The starvation experiments on control and clpP2CM cells, respectively. The cells used for starvation were harvested at the exponential phase (3 hr before the stationary phase). (C, D) Protein levels of ClpP1 and ClpP2, respectively, at different time points in M. smegmatis cells. For all panels, the number above each band of the Western blot represents their relative quantitative values.
Figure 4 with 1 supplement
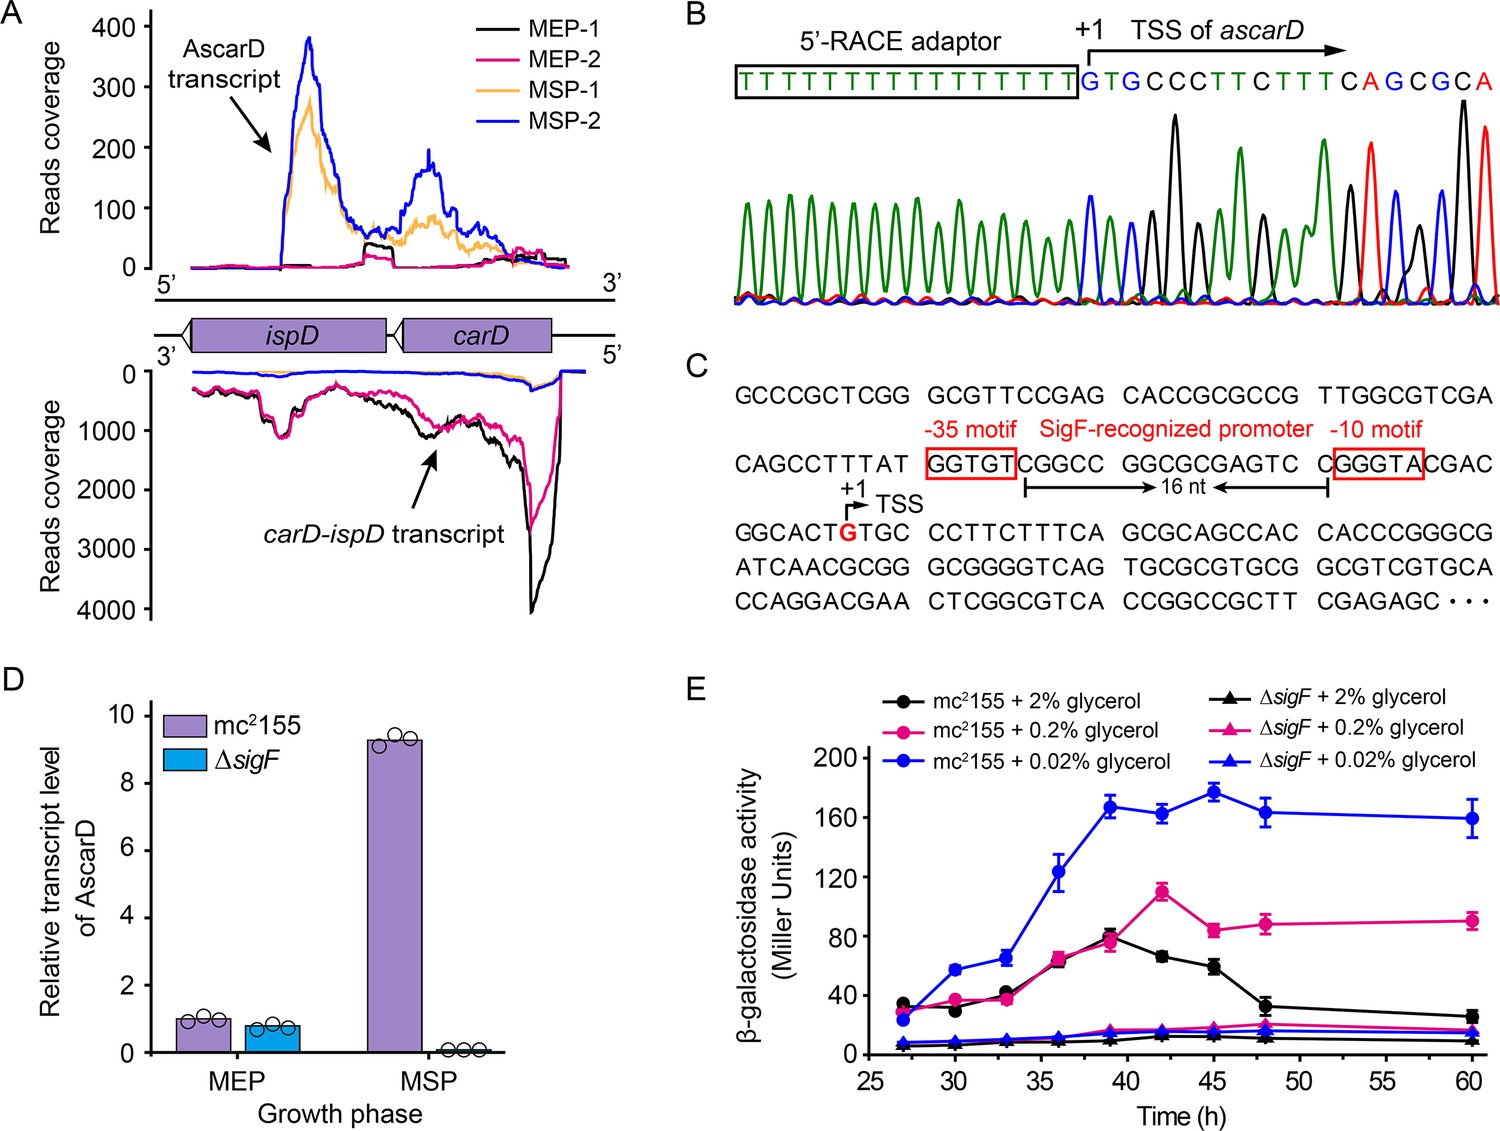
Identification and characterization of AscarD.
(A) Transcriptional landscapes of carD-ispD transcript and AscarD. Red and black lines represent exponential-phase cells, blue and green lines are from stationary-phase cells. Extensions of −1 and −2 represent two biological replicates. (B) Mapping of the transcriptional start site (TSS) of AscarD. The lower four-color chromatogram shows the results of Sanger sequencing, and the corresponding DNA sequence is displayed on the upper layer. The 5′-rapid amplification of cDNA ends (5′-RACE) adaptor sequence is framed by a black rectangle, and TSS is indicated by a black arrow. (C) Potential SigF-recognized −10 and −35 motifs upstream of the identified TSS are indicated with red rectangles. (D) AscarD transcript levels at different growth phases of mc2155 and ΔsigF strains were measured by qRT-PCR, normalized to sigA transcript levels, and expressed as fold change compared to levels of mc2155 cells at mid-exponential phase (MEP). Individual data for the three biological replicates are shown in the corresponding columns. (E) Promoter activities of ascarD in mc2155 and ΔsigF strains carrying a β-galactosidase-encoding reporter plasmid. Error bars indicate the standard deviation of three biological replicates.
-
Figure 4—source data 1
AscarD transcript levels at different growth phases of mc2155 and ΔsigF strains (numerical data for Figure 4D).
- https://cdn.elifesciences.org/articles/73347/elife-73347-fig4-data1-v2.xlsx
-
Figure 4—source data 2
Promoter activities of ascarD in mc2155 and ΔsigF strains (numerical data for Figure 4E).
- https://cdn.elifesciences.org/articles/73347/elife-73347-fig4-data2-v2.xlsx
Figure 4—figure supplement 1
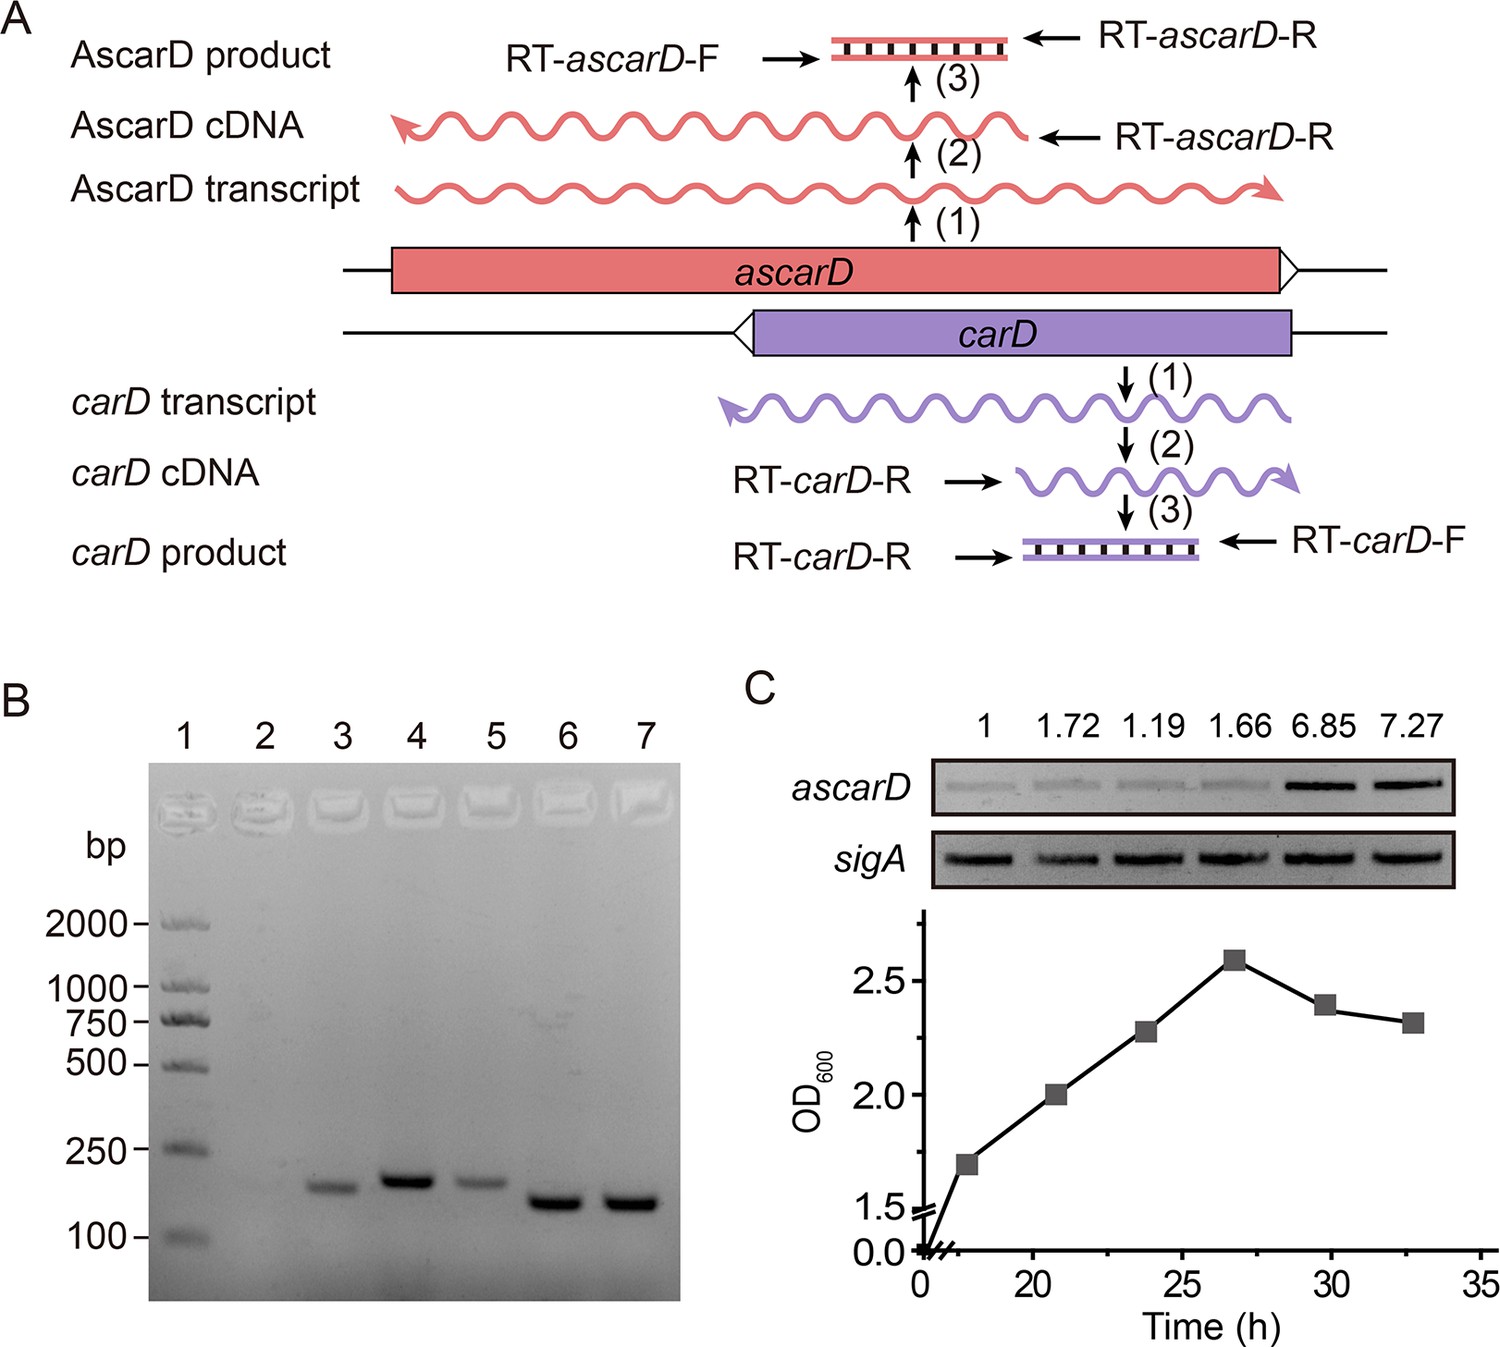
RT-PCR analysis of the transcriptional levels of ascarD and carD.
(A) Schematic diagram of the strand-specific RT-PCR. Step (1) represents transcription of the ascarD and carD genes; step (2) represents ascarD and carD transcripts reverse transcribed into the corresponding cDNAs with RT-ascarD-R/RT-carD-R primers (Supplementary file 3); step (3) represents amplification of AscarD and carD cDNA with RT-ascarD-F/R or RT-carD-F/R primer pairs (Supplementary file 3), respectively. (B) The RT-PCR results at different growth phases. Lane one is the DL2000 ladder marker, lanes 2 and 3 show the ascarD RNA levels at mid-exponential phase (MEP) and mid-stationary phase (MSP), respectively; lanes 4 and 5 show carD RNA levels at MEP and MSP, respectively; lanes 6 and 7 show the RNA levels of internal reference gene sigA at MEP and MSP, respectively. (C) ascarD RNA levels throughout the growth phase as measured by RT-PCR; sigA was used as an internal reference gene. The number above each band of the RT-PCR represents their relative quantitative values, which are normalized with respect to their corresponding loading controls.
Figure 5 with 1 supplement
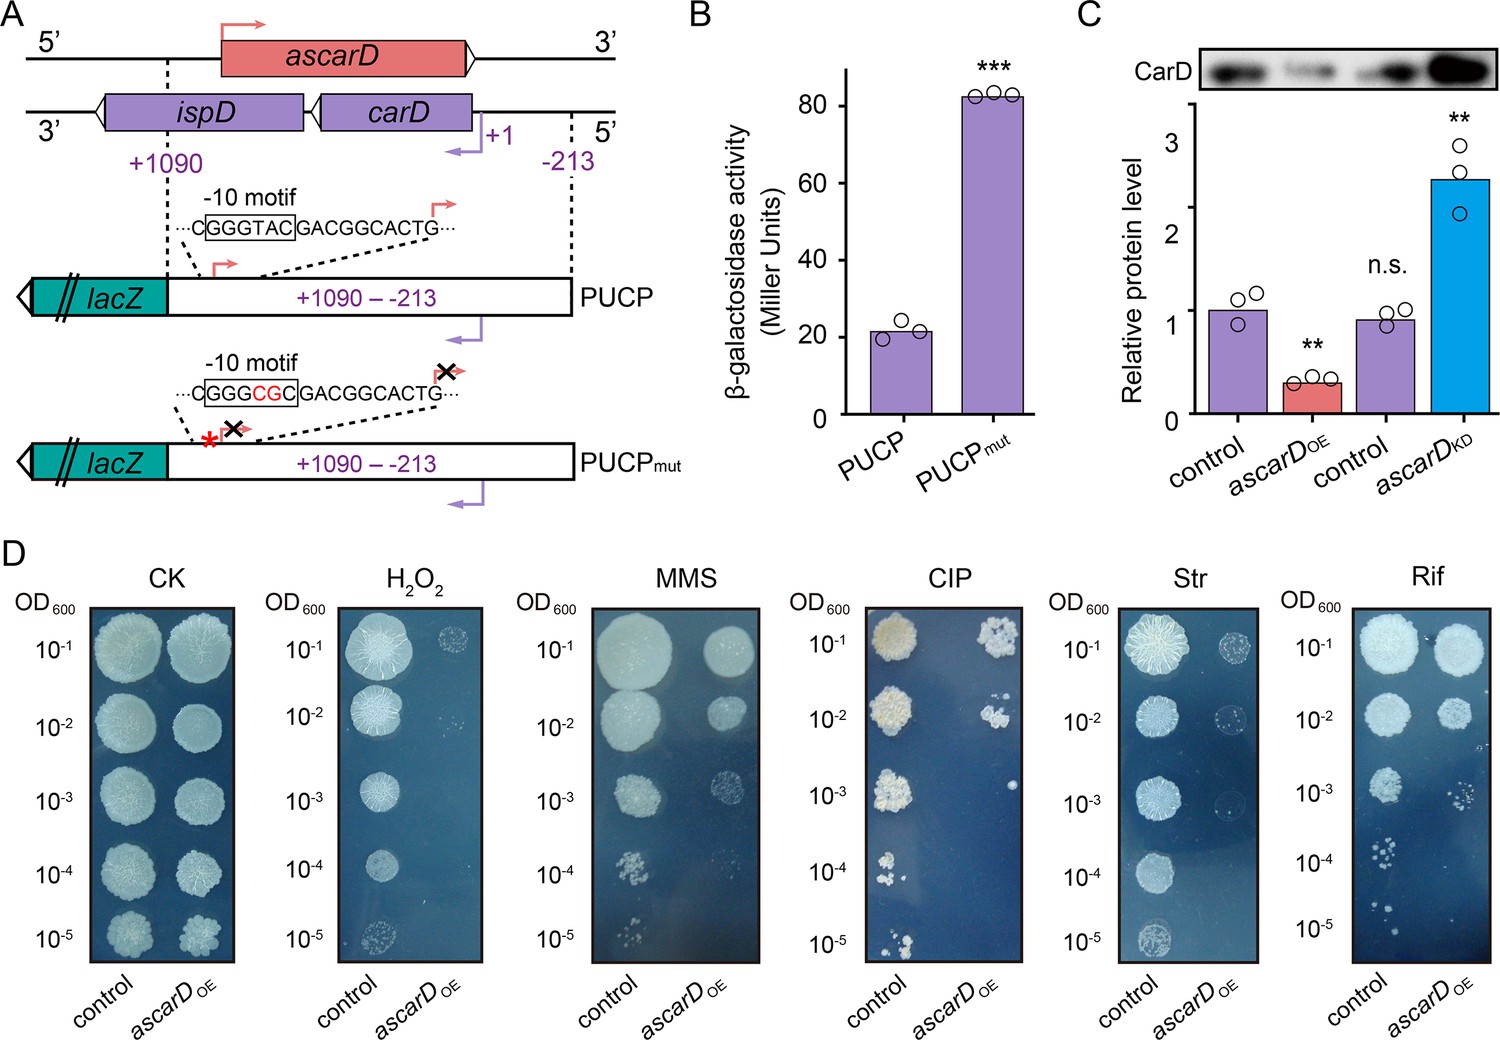
AscarD negatively regulates carD.
(A) A schematic diagram of PUCP and PUCPmut plasmids construction (see a detailed description in Experimental section). (B) β-Galactosidase activities of mc2155 strains transformed with PUCP or PUCPmut plasmid. Individual data for the three biological replicates are shown in the corresponding columns. (C) CarD protein levels in different strains. Mycobacterial cells were harvested at the mid-stationary phase (MSP). The upper part shows the Western blot with CarD levels, and the histogram below it shows the quantitative statistics of Western blot results. Statistical test was done using the Student's t-test, with ** indicating p-value <0.01, *** indicating p-value <0.001, and n.s. indicating p-value >0.05. (D) The tolerance of ascarDOE and control strains to oxidative stress, DNA damage, and antibiotic stimulation, respectively. Serially diluted bacterial suspensions were separately spotted onto normal 7H10 plate (CK) or plates containing 0.3 mM H2O2, 0.05% methanesulfonate (MMS), 0.2 μg/ml of ciprofloxacin (CIP), 0.1 μg/ml of streptomycin (Str), or 5 μg/ml of rifamycin (Rif), respectively.
-
Figure 5—source data 1
β-Galactosidase activities of mc2155 strains transformed with PUCP or PUCPmut plasmid (numerical data for Figure 5B).
- https://cdn.elifesciences.org/articles/73347/elife-73347-fig5-data1-v2.xlsx
-
Figure 5—source data 2
CarD protein levels in different strains (numerical data for Figure 5C).
- https://cdn.elifesciences.org/articles/73347/elife-73347-fig5-data2-v2.xlsx
Figure 5—figure supplement 1
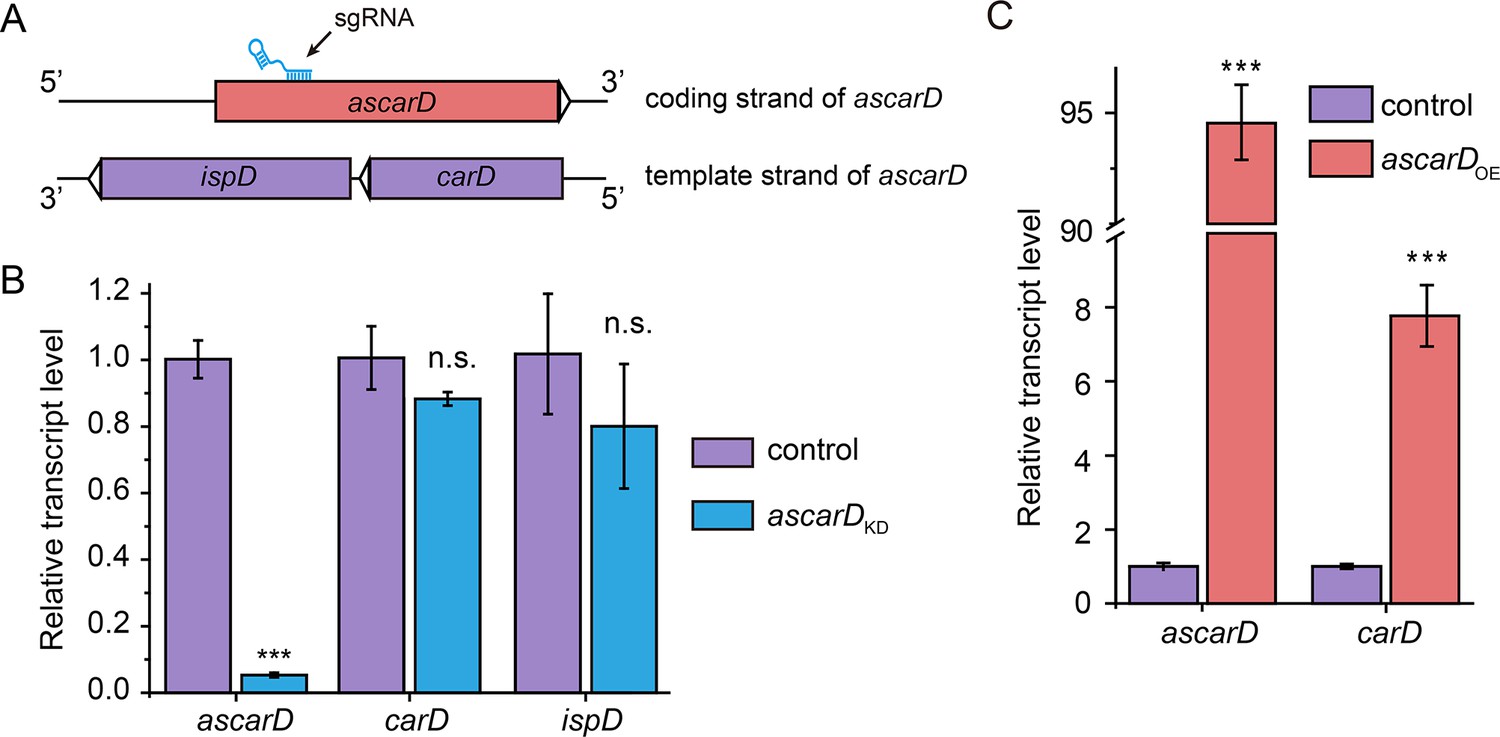
The expression levels of carD and ascarD in different strains.
(A) Schematic diagram for the location of small guide RNA (sgRNA) targeting ascarD. (B) Transcript levels of ascarD, carD, and ispD in ascarDKD and control strains. The mc2155 strain transformed with pRH2521 empty vector was used as the control. (C) Transcript levels of ascarD and carD in ascarDOE and control strains. The mc2155 strain transformed with pMV261 empty vector was used as the control. sigA was used as the internal reference gene of qRT-PCR. Error bars indicate the standard deviation of three biological replicates. Statistical testing was done using the Student’s t-test, with *** indicating p value <0.001, n.s. indicating p value >0.05.
Figure 6
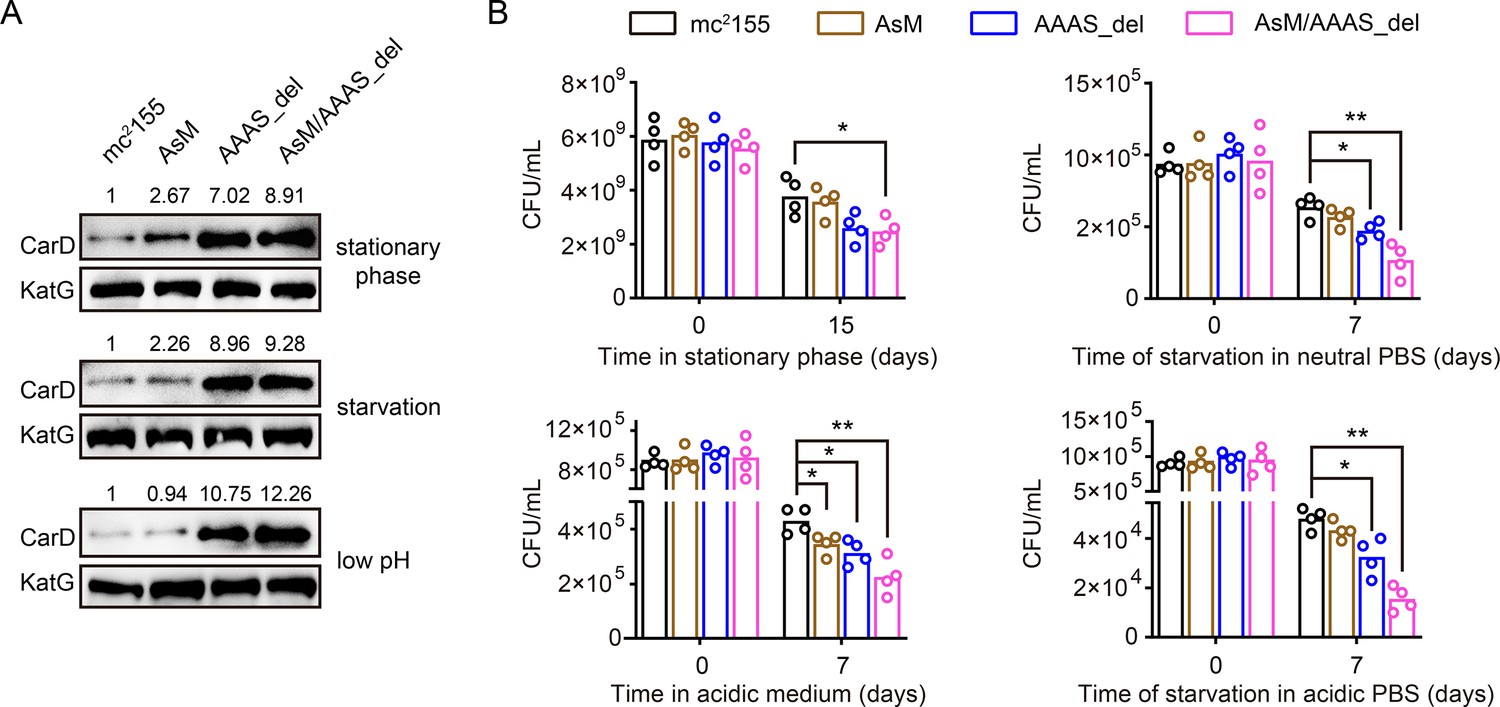
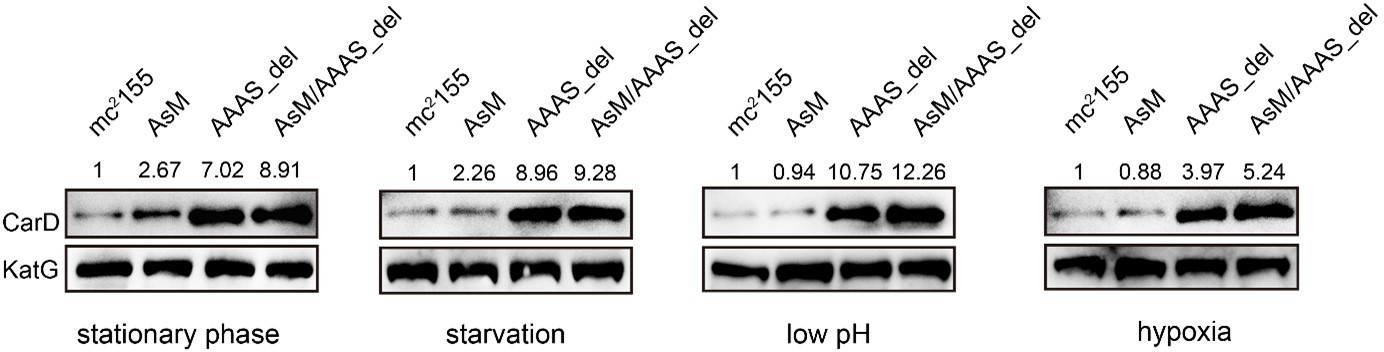
AscarD and Clp protease coregulate CarD-mediated mycobacterial adaptive response.
(A) Changes in CarD protein levels of different strains under various stress conditions. AsM, AAAS_del, and AsM/AAAS_del represent, respectively, AscarD promoter mutant, AAAS motif deletion, and double mutant strains. (B) Survival of different mycobacterial cells under various stress conditions. Statistical test was done using the Student’s t-test, with * indicating p value <0.05, and ** indicating p value <0.01.
-
Figure 6—source data 1
Survival of different mycobacterial cells under various stress conditions (numerical data for Figure 6B).
- https://cdn.elifesciences.org/articles/73347/elife-73347-fig6-data1-v2.xlsx
Figure 7 with 1 supplement
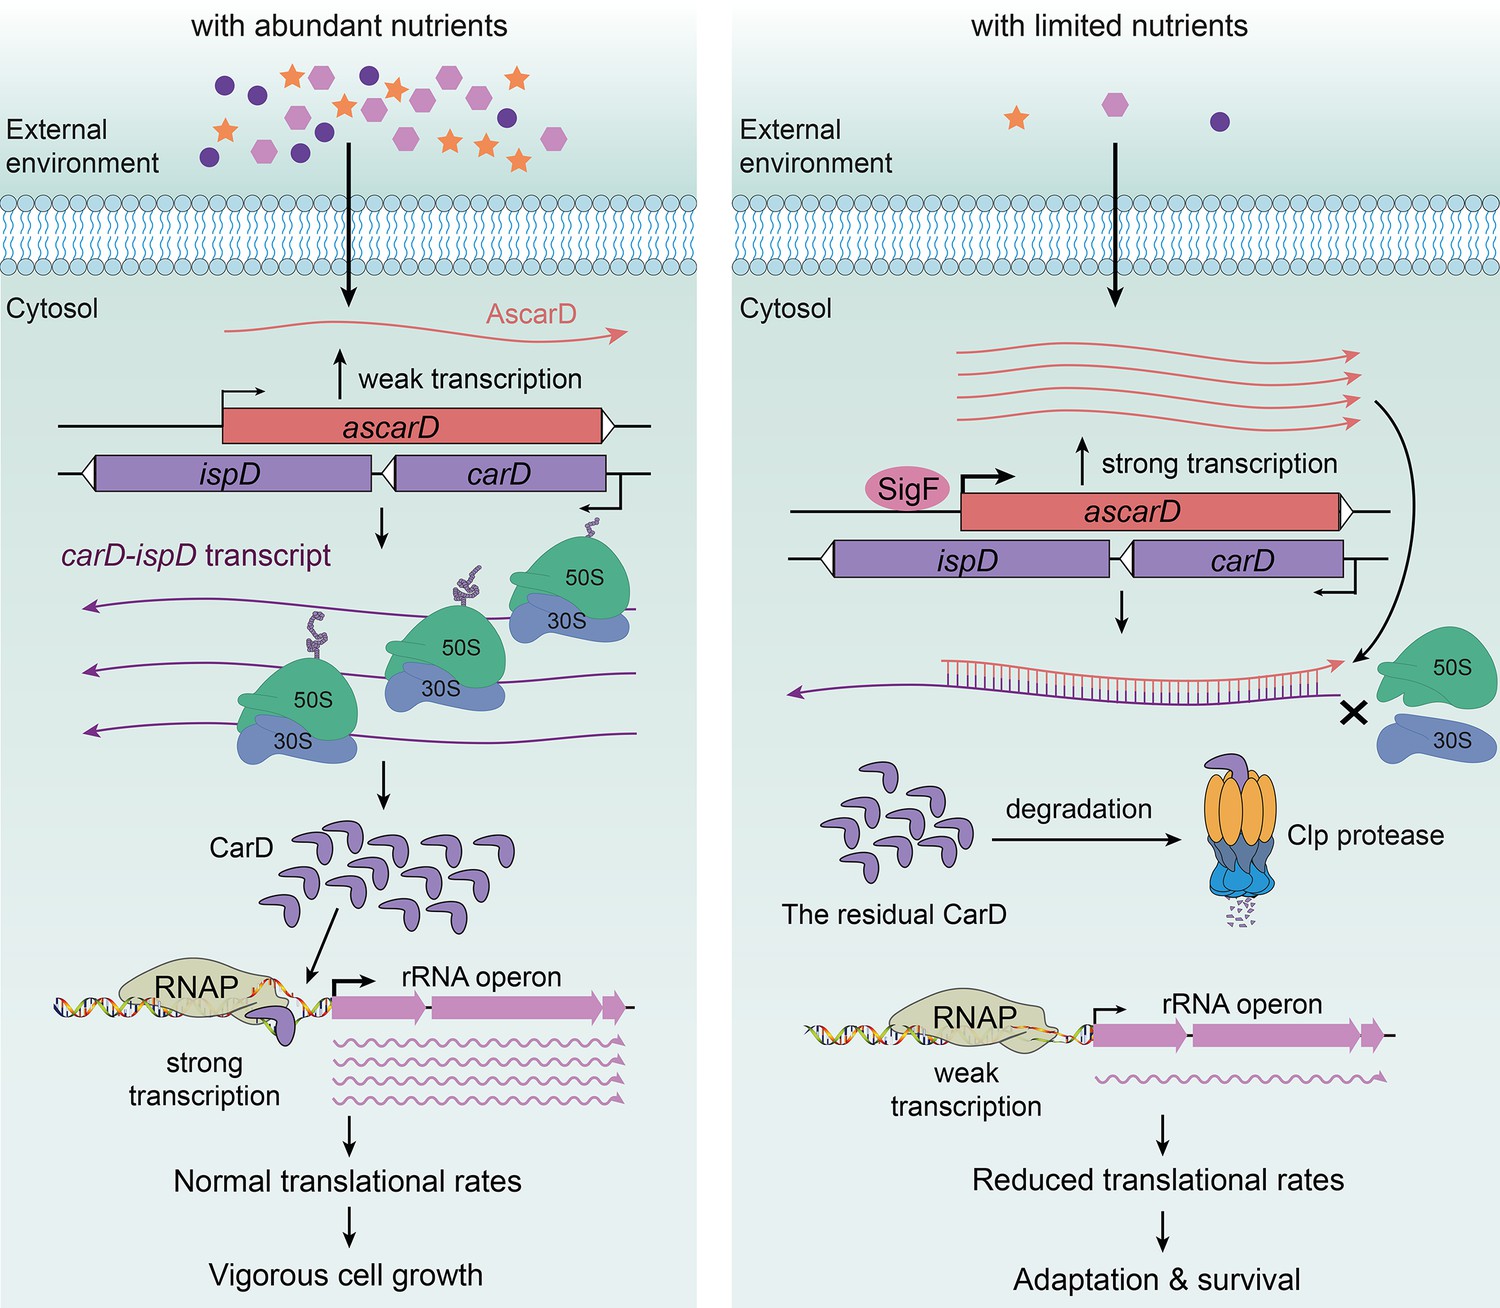
AscarD and Clp protease work together to regulate CarD-mediated starvation response.
The left and right panels represent the mycobacterial cells under nutrient-rich and nutrient-starved conditions, respectively.
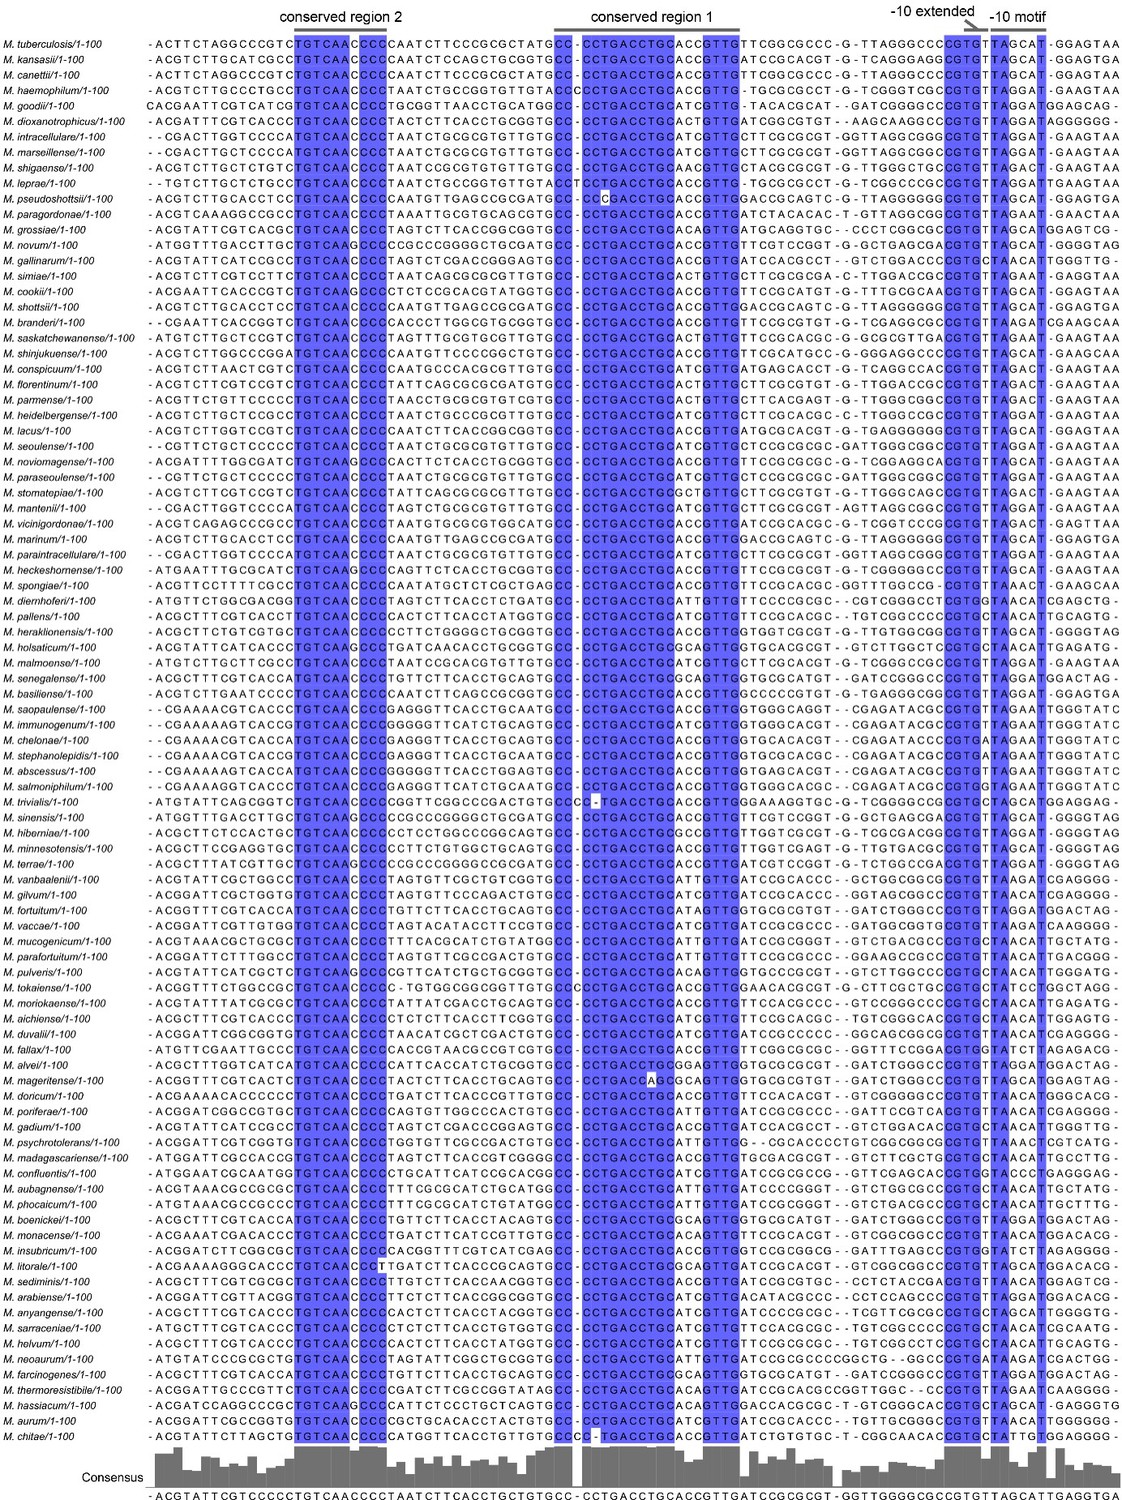
Figure 7—figure supplement 1
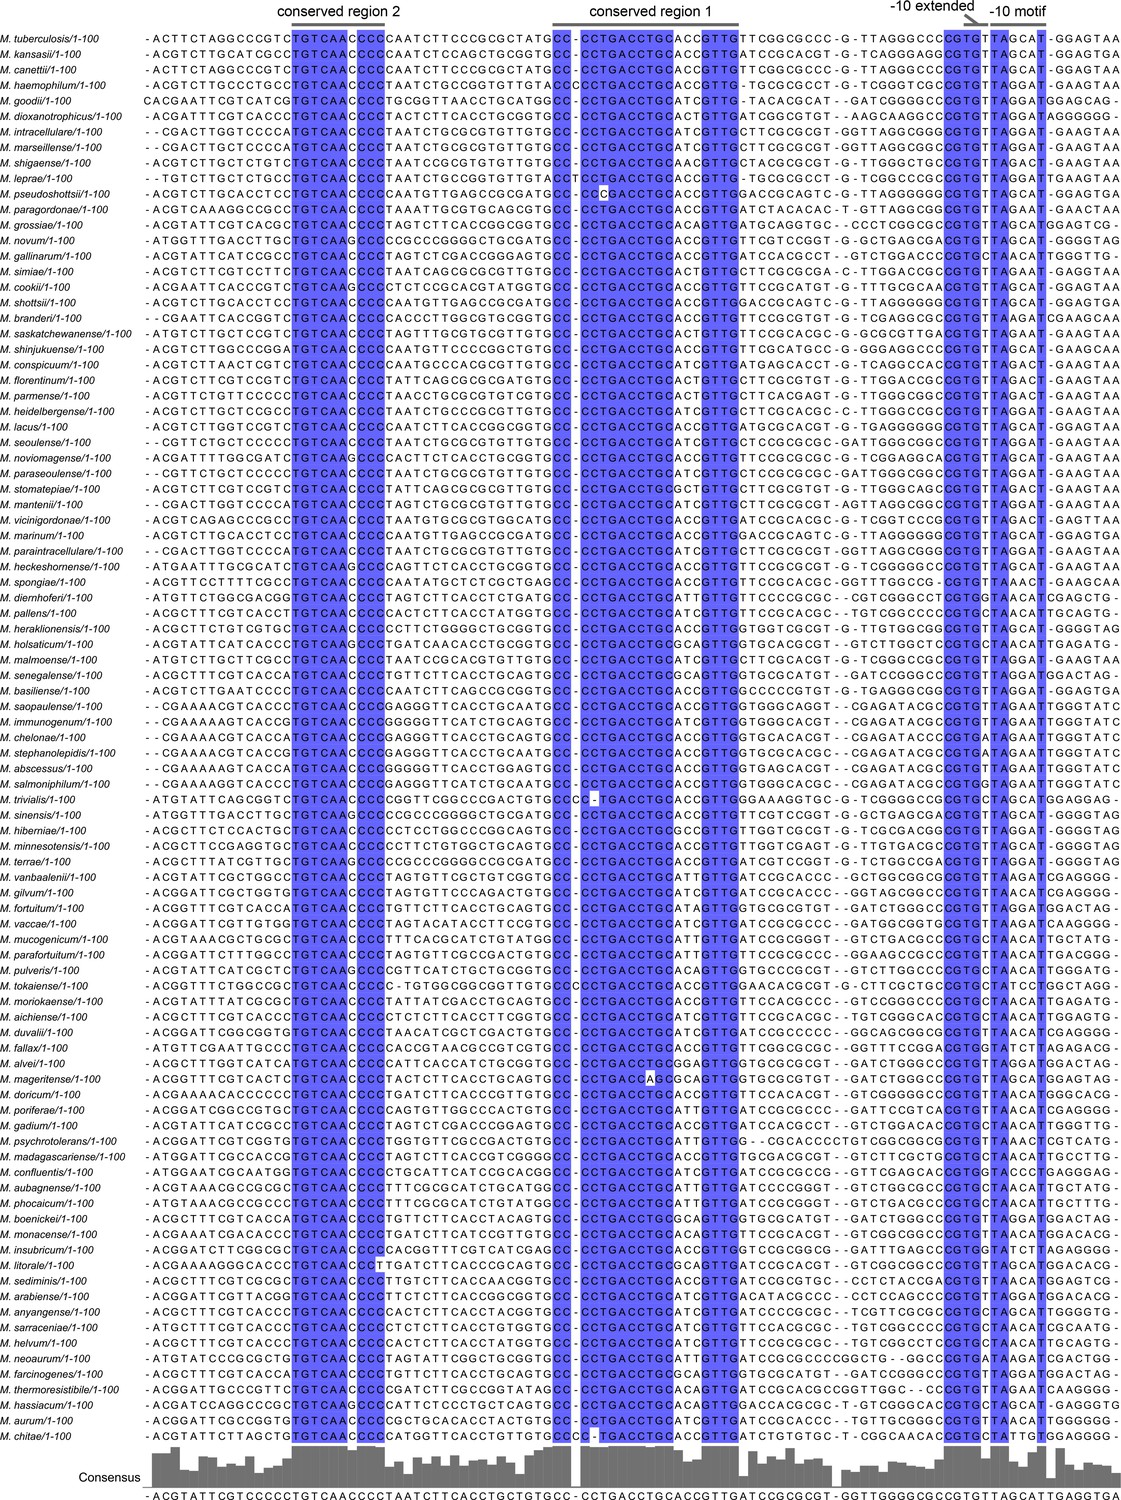
Alignment of mycobacterial carD promoter sequences.
The 100 bp promoter sequences of carD from 91 different mycobacteria were aligned by Clustal W, and the highly conserved nucleotides were marked in blue.
Author response image 1
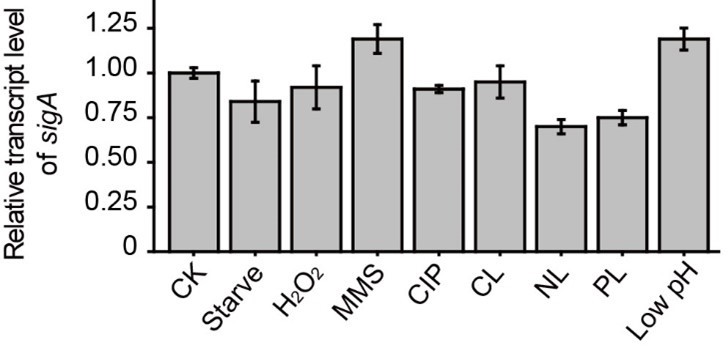
Relative transcript level of sigA under different conditions.
Author response image 2
Changes in CarD protein levels in different strains under (A) starvation condition or (B) stationary phase.
Author response image 3

The survival rate of different mycobacterial cells under various stress conditions.
AsM, AAAS_del, and AsM/AAAS_del respectively represent AscarD promoter mutant, AAAS motif deletion, and double mutant strains.
Author response image 4
Changes in CarD protein levels of different strains under various stress conditions.
AsM, AAAS_del, and AsM/AAAS_del represent, respectively, AscarD promoter mutant, AAAS motif deletion, and the double mutant strains.
Author response image 5
Changes of carD or AscarD transcript levels under various stress conditions.
Author response image 6
Alignment of mycobacterial carD promoter sequences.
Author response image 7

ChIP-seq reads from M. smegmatis DNA coimmunoprecipitated with CarD.
Tables
Author response table 1
Transcript levels of genes in the SigF partner switching system.
| Gene | Locus tag | Function | RPKM value | Fold change(MSP/MEP) | |
|---|---|---|---|---|---|
| MEP | MSP | ||||
| sigF | MSMEG_1804 | RNAP σ factor F | 463 | 573 | 1.24 |
| rsbW | MSMEG_1803 | anti-σF | 593 | 3,410 | 5.75 |
| rsbW3 | MSMEG_1787 | anti-σF antagonist | 17 | 6,055 | 356.18 |
| rsfA | MSMEG_1786 | anti-σF antagonist | 128 | 473 | 3.69 |
| rsfB | MSMEG_6127 | anti-σF antagonist | 1,764 | 298 | 0.17 |
| MSMEG_0586 | MSMEG_0586 | Putative anti-σF antagonist | 1,401 | 7,051 | 5.03 |
| MSMEG_5551 | MSMEG_5551 | Putative anti-σF antagonist | 7 | 45 | 6.85 |
| MSMEG_6541 | MSMEG_6541 | Putative anti-σF antagonist | 126 | 272 | 2.16 |
Additional files
-
Supplementary file 1
The top 20 upregulated genes in the CarDK125A mutant.
- https://cdn.elifesciences.org/articles/73347/elife-73347-supp1-v2.docx
-
Supplementary file 2
Strains used in this study.
- https://cdn.elifesciences.org/articles/73347/elife-73347-supp2-v2.docx
-
Supplementary file 3
Oligonucleotides used in this study.
- https://cdn.elifesciences.org/articles/73347/elife-73347-supp3-v2.docx
-
Transparent reporting form
- https://cdn.elifesciences.org/articles/73347/elife-73347-transrepform1-v2.pdf
-
Source data 1
Raw images of the gels/blots presented in this article.
- https://cdn.elifesciences.org/articles/73347/elife-73347-supp4-v2.zip
Download links
A two-part list of links to download the article, or parts of the article, in various formats.
Downloads (link to download the article as PDF)
Open citations (links to open the citations from this article in various online reference manager services)
Cite this article (links to download the citations from this article in formats compatible with various reference manager tools)
Clp protease and antisense RNA jointly regulate the global regulator CarD to mediate mycobacterial starvation response
eLife 11:e73347.
https://doi.org/10.7554/eLife.73347


