Instructions and experiential learning have similar impacts on pain and pain-related brain responses but produce dissociations in value-based reversal learning
- National Center for Complementary and Integrative Health, National Institutes of Health, United States
- National Institute on Drug Abuse, National Institutes of Health, United States
- National Institute of Mental Health, National Institutes of Health, United States
- Department of Clinical Neuroscience, Karolinska Institutet, Sweden
- Department of Psychology, University of Pittsburgh, United States
Figures
Figure 1

Experimental design.
(A) Experimental design. Participants underwent a pain calibration that identified temperatures corresponding to maximum tolerable pain (high pain; 8), pain threshold (low pain; 2), or medium pain (5). They were then positioned in the fMRI scanner and randomly assigned to group. Participants in the Instructed Group were informed about contingencies, while participants in the Uninstructed Group were told to pay attention to the associations between auditory cues and heat but were not informed about the specific cue-outcome contingencies. (B) Trial structure. On each trial, a 2 s auditory cue preceded heat delivered to the participants left forearm. Participants rated perceived pain following offset using an 8-point continuous visual analogue scale. Trials were 48 s long. (C) Instructed and experience-based reversals. Participants first underwent a brief conditioning phase of 5–6 trials in which Original Low Cues (gray) were followed by heat calibrated to elicit low pain (level 2) and Original High Cues (black) were followed by heat calibrated to elicit high pain (level 8). Conditioning was immediately followed by intermittent test trials, in which we delivered medium heat following each cue to test the effects of predictive cues on perceived pain. Following the initial test phase, participants in the Instructed Group were informed about reversals and we delivered medium stimuli to test the effects of instructions. We then paired high heat with the Original Low cue and low heat with the Original High cue, which should act as an experiential reversal, and again administered medium heat to test whether pain reverses upon experience. (D) Example trial order. There were three reversals across the entire task. We used two trial orders that were counterbalanced across participants.
Figure 2 with 1 supplement

Effects of heat intensity on pain, autonomic responses, and brain responses to noxious heat.
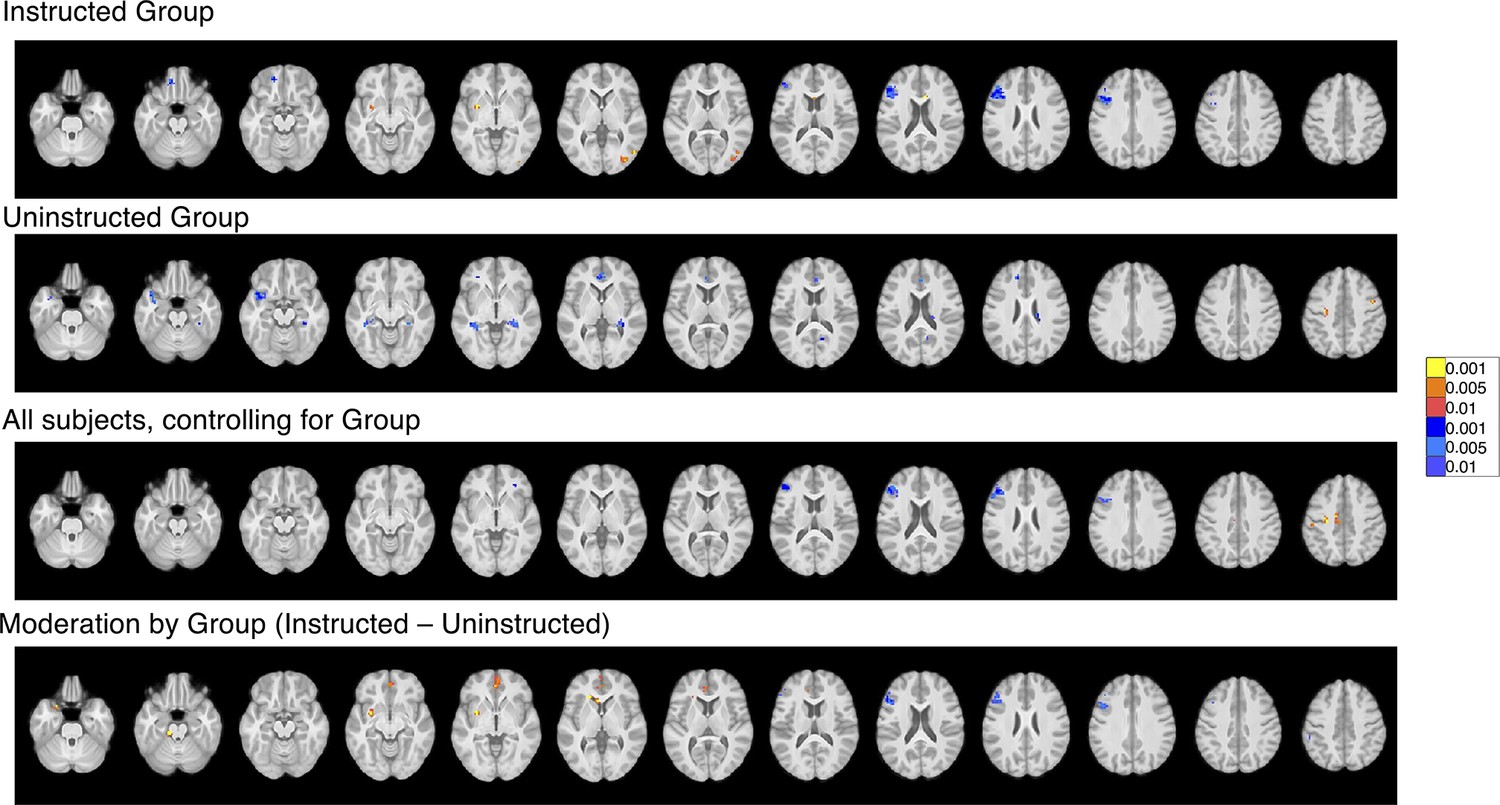
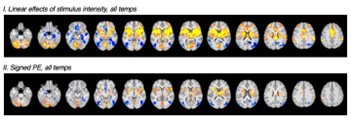
(A-D) There were no differences between groups in the effect of heat intensity on pain (A), skin conductance responses (SCR; B), or pattern expression in the neurologic pain signature (NPS; C) or stimulus-intensity independent pain signature (SIIPS; D). All outcomes showed robust effects of heat intensity (see Tables 1–2 and Figure 2—source data 1). Data were visualized using the R toolboxes ggplot2 (Wickham, 2016) and Raincloud plots (Allen et al., 2021). (E-H): Whole-brain voxel-wise analyses revealed robust effects of variations in stimulus intensity on heat-evoked activation within brain regions involved in pain, controlling for group (E), which were confirmed with separate analyses within the Instructed Group (F) and the Uninstructed Group (G). FDR-corrected p-values for contrasts E-G exceeded P<.005 and therefore we used maps thresholded at P<.001 for inference. Only the left hippocampus and right S1 showed significant group differences at corrected levels (H). Differences were driven by temperature-induced deactivation in the Uninstructed Group, as depicted in G. For additional regions identified in voxelwise results, see Figure 2—figure supplement 1 and Figure 2—source data 2 and 3.
-
Figure 2—source data 1
Heat intensity effects on heat-evoked autonomic responses.
- https://cdn.elifesciences.org/articles/73353/elife-73353-fig2-data1-v2.docx
-
Figure 2—source data 2
Heat intensity effects: Small-volumes corrected results.
- https://cdn.elifesciences.org/articles/73353/elife-73353-fig2-data2-v2.docx
-
Figure 2—source data 3
Heat intensity effects: Uncorrected results.
- https://cdn.elifesciences.org/articles/73353/elife-73353-fig2-data3-v2.docx
Figure 2—figure supplement 1
Heat intensity effects: Whole-brain uncorrected results.
Results are reported in Figure 2—source data 1.
Figure 3
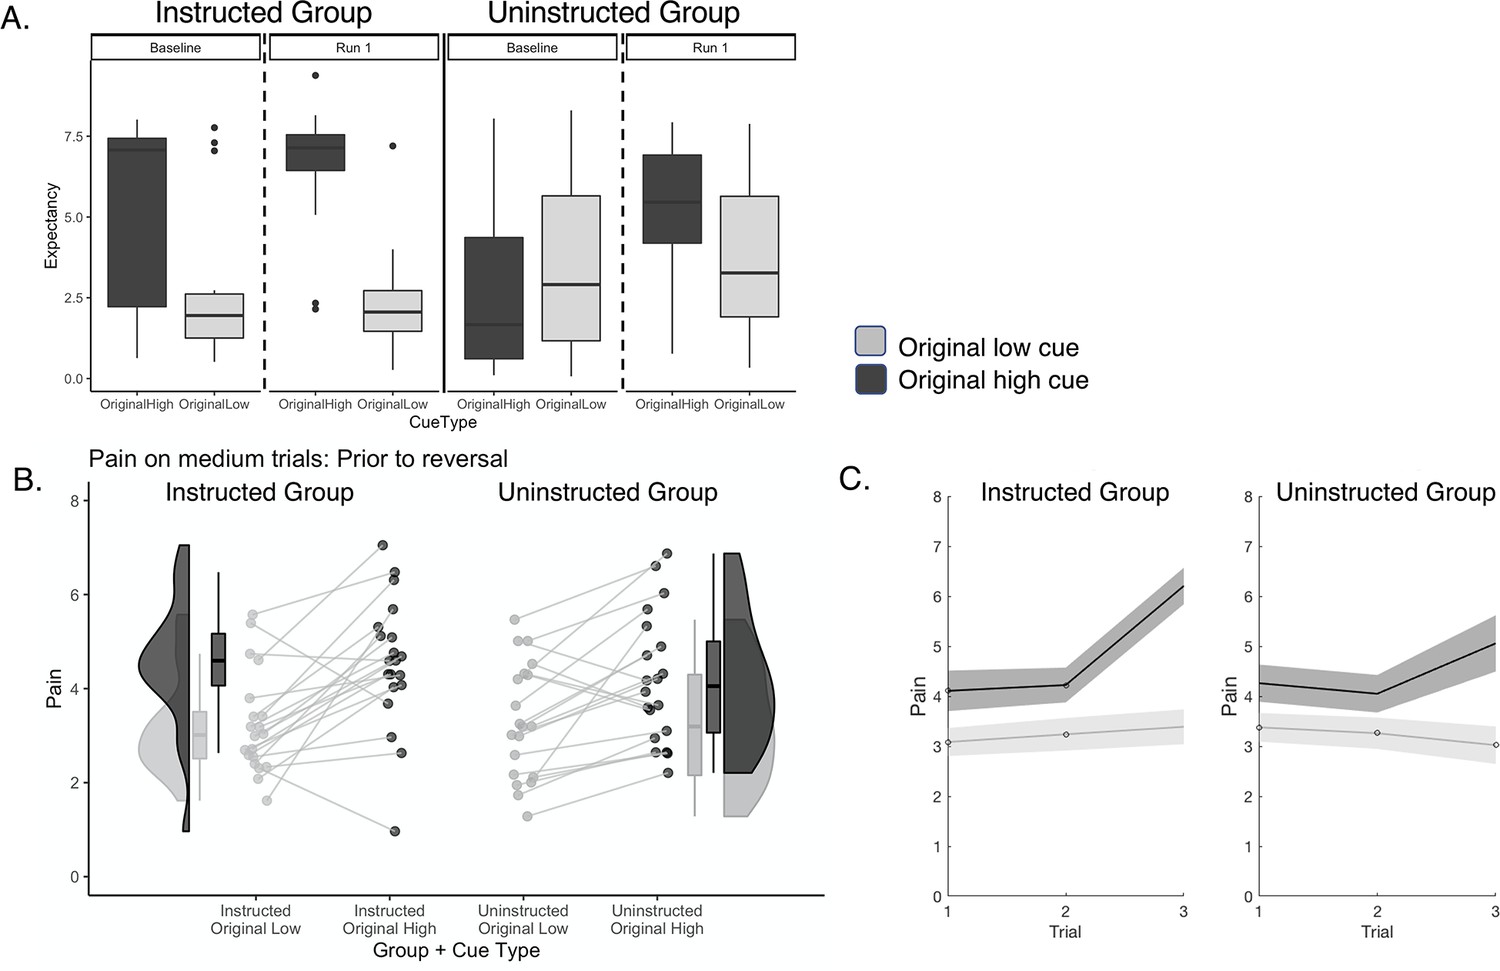
Effects of instructions and learning on expected pain and pain ratings prior to reversal.
(A) Expectancy ratings prior to reversal. Participants in the Instructed Group (Top Left) expected higher pain in response to the Original High Cue relative to the Original Low Cue at baseline (left) and differences in expectations grew larger following conditioning and the first test phase (right). Participants in the Uninstructed Group did not report differences prior to the task (left), consistent with the fact that they were not instructed about specific cue-outcome contingencies. Following conditioning and the first test phase, Uninstructed Group participants expected higher pain in response to the Original High Cue, relative to the Original Low Cue. Cue-based differences in expectancy ratings were larger in the Instructed Group. (B) Predictive cue effects on pain prior to reversal. We measured the effects of predictive cues on perceived pain prior to the first reversal (see Table 3). Both groups reported higher pain when medium heat was preceded by the high pain cue (black) relative to the low pain cue (gray) and this effect was present in nearly all participants. (C) Cue effects increase over time. Both groups show larger cue-based differences in perceived pain on medium heat trials as a function of experience prior to the first reversal, but effects of time were larger in the Instructed Group. Data were visualized using the R toolboxes ggplot2 (Wickham, 2016) and Raincloud plots (Allen et al., 2021). Error bars and shaded areas denote standard error of the mean (n = 20 per group).
Figure 4 with 2 supplements
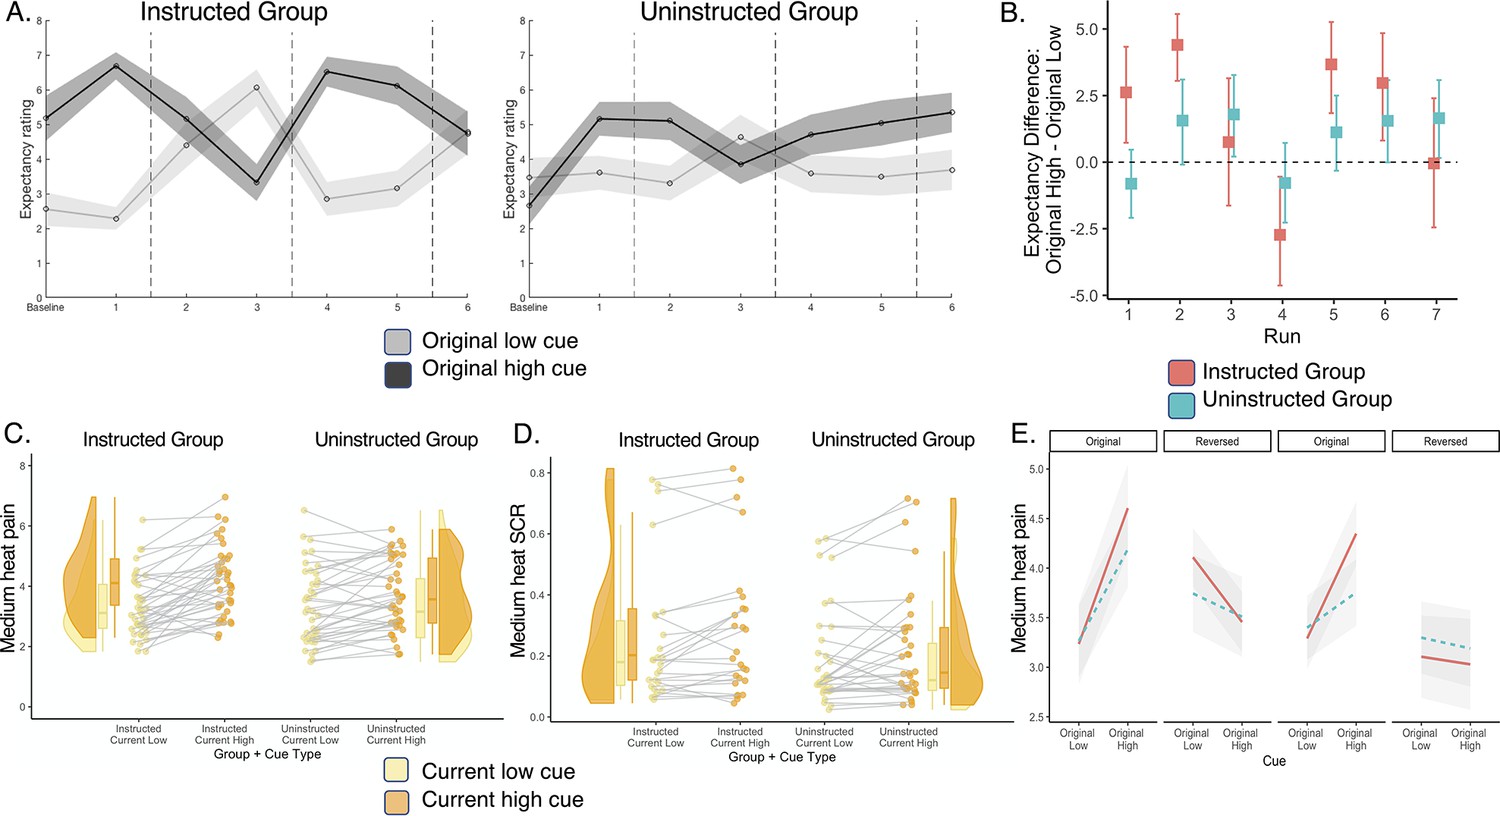
Expectations and pain ratings update as contingencies change.
We analyzed cue-based expectations and the effects of cues on pain ratings in response to medium heat across the entire task, including reversals. Reversals were coded relative to instructions in the Instructed Group and relative to experience in the Uninstructed Group (see Figure 1C). (A) Expectancy ratings across the entire task. Both groups updated expectations as contingencies reversed. (B) Cue-based differences in expectancy. The Instructed Group (Red) shows larger differences in expectancy as a function of phase, although both groups show significant Cue x Phase interactions across the task, indicating that both instructions and experiential learning dynamically shape expectations. (C) Effects of current cue contingencies on subjective pain. We analyzed Cue x Phase interactions on pain to evaluate whether individuals report higher pain with the cue that is currently paired with high heat (Original High Cue on original contingency blocks, Original Low Cue on reversed blocks). Both groups reported higher pain when medium heat was paired with the current high cue relative to the current low cue. (D) Effects of current cue contingencies on heat-evoked SCR. Similar to pain, both groups displayed elevated heat-evoked SCR when medium heat was paired with the current high cue relative to the current low cue. (E) Pain reversals are larger in Instructed Group participants. As with expectancy ratings, both groups showed significant reversals of cue effects on subjective pain as contingencies changed, but reversals were larger in Instructed Group participants. Individual participants’ ratings are presented in Figure 4—figure supplement 1 and retrospective ratings are reported in Figure 4—figure supplement 2. Errors and shaded regions denote standard error of the mean (n = 20 per group).
-
Figure 4—source data 1
Cue effects on skin conductance responses.
- https://cdn.elifesciences.org/articles/73353/elife-73353-fig4-data1-v2.docx
Figure 4—figure supplement 1
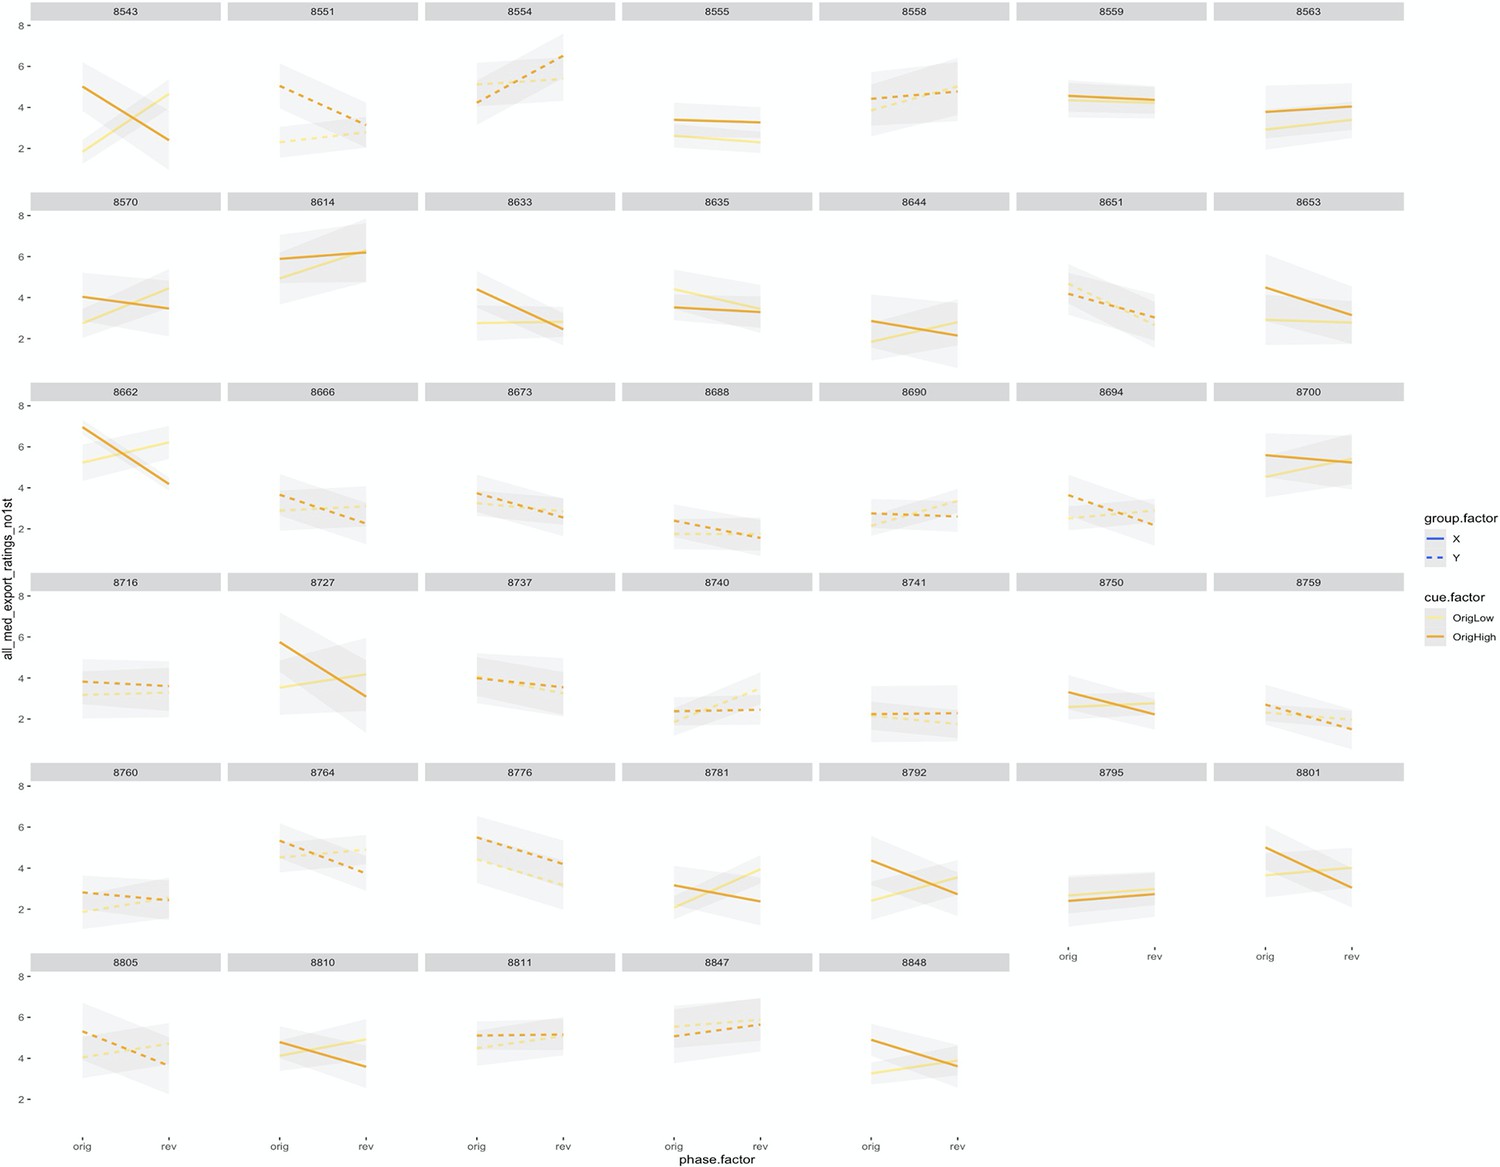
Cue and phase effects for individual participants.
This figure depicts effects of Cue (original low = yellow; original high = orange) and Phase (original = ‘orig’, reversed = ‘rev”) on subjective pain on medium heat trials for each participant. Instructed Group participants are displayed with solid lines and Uninstructed Participants are displayed in dashed lines. Shaded areas denote standard error of the mean.
Figure 4—figure supplement 2
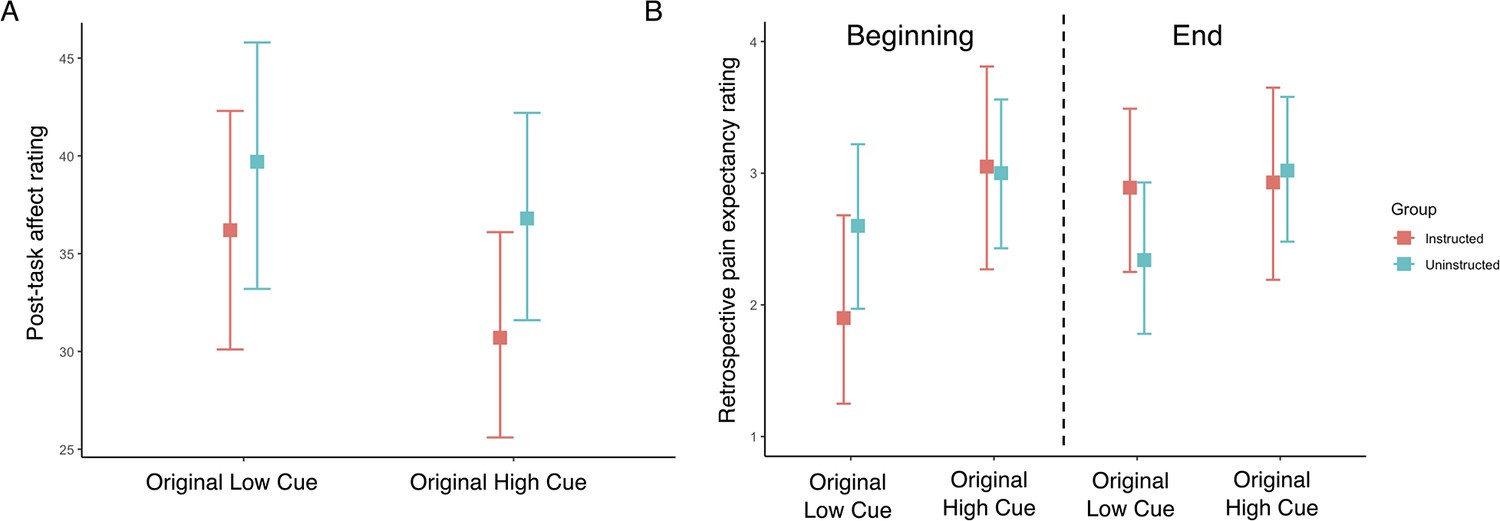
Retrospective ratings.
Following the task, participants provided retrospective ratings of affect (A) and expected pain at the beginning and end of the task (B) as a function of Cue. Error bars denote standard error of the mean (n = 20 per group).
Figure 5 with 7 supplements
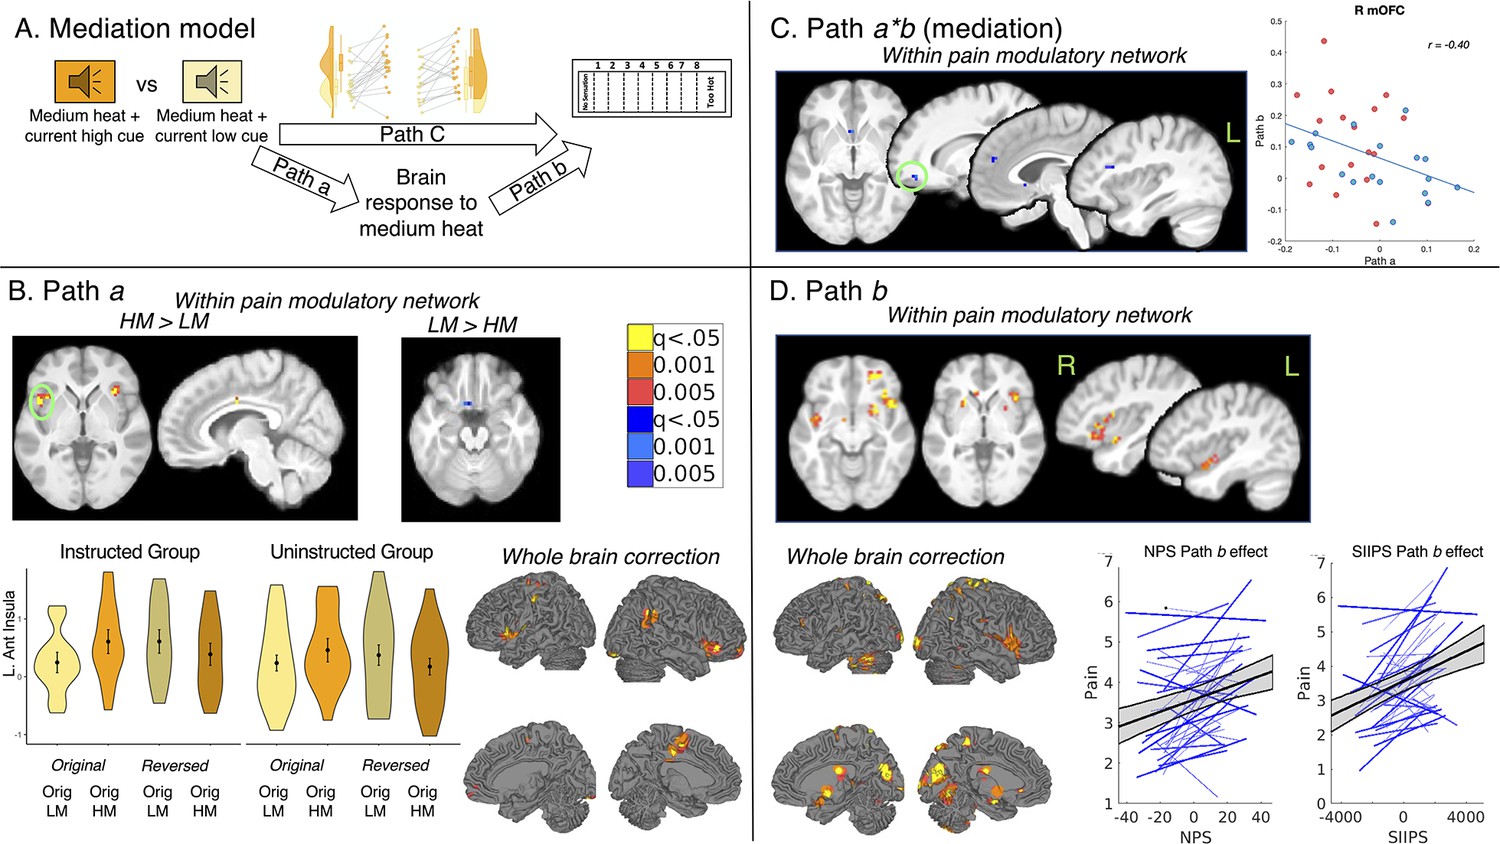
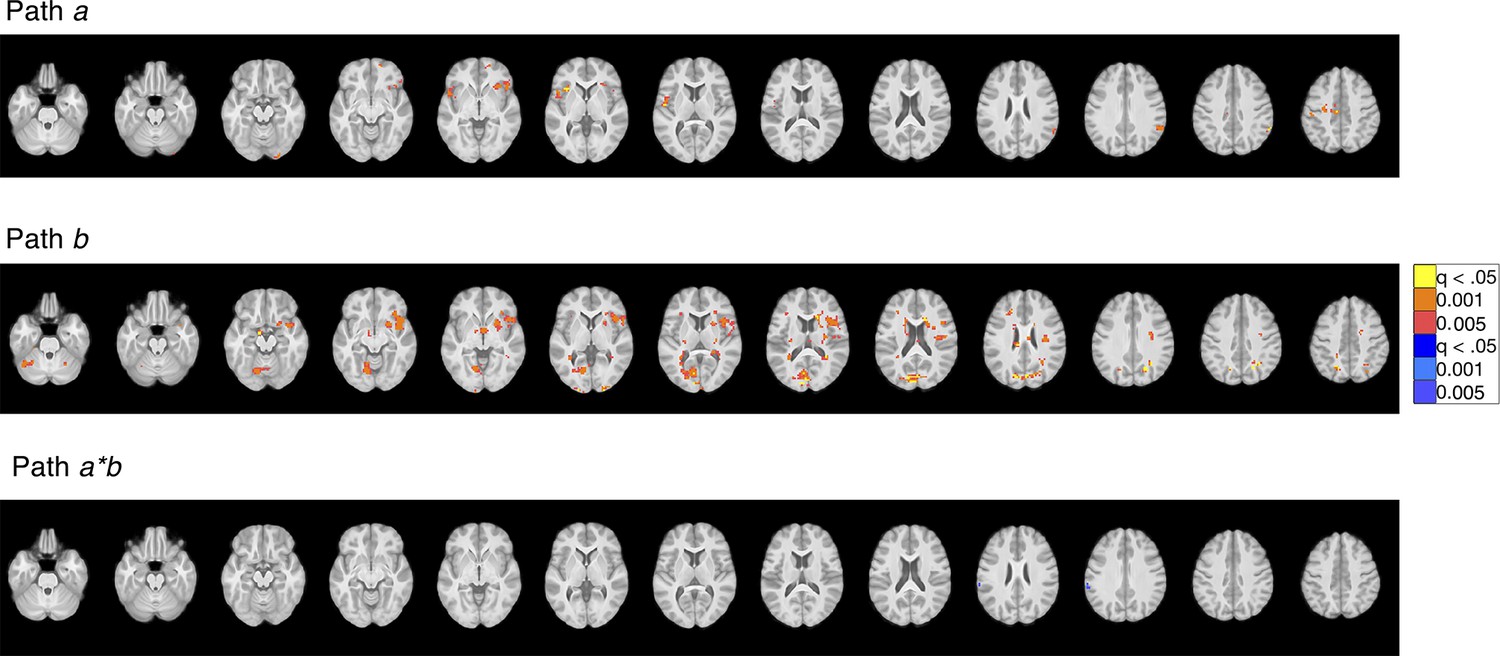
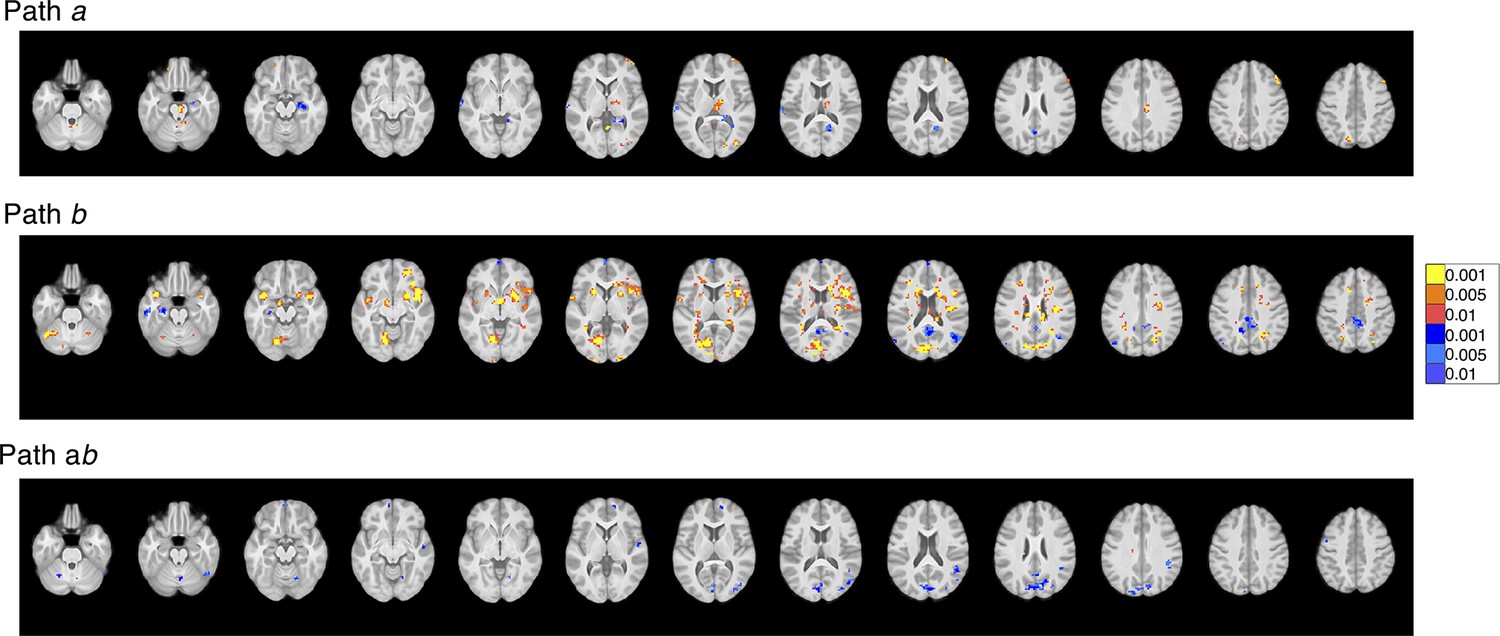
Mediation of current cue effects on medium heat pain.
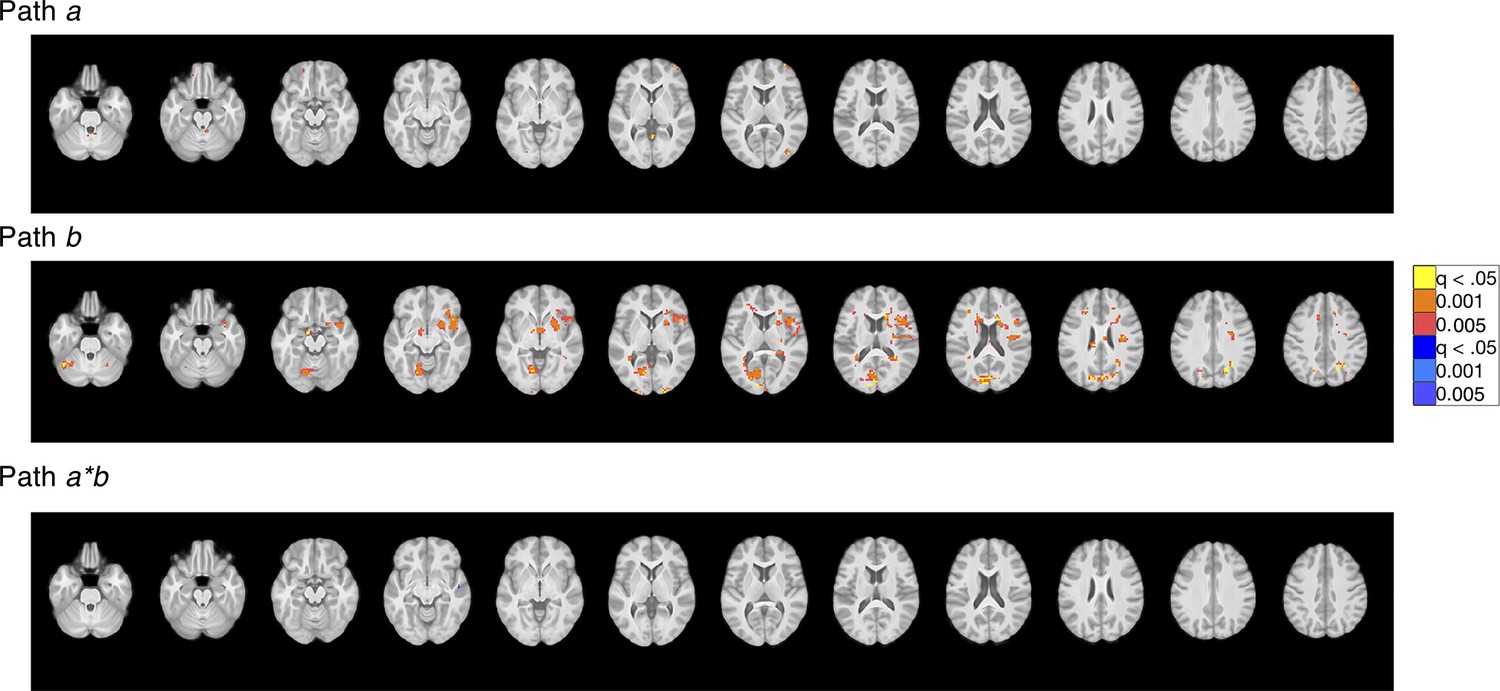
We examined brain mediators of current contingency effects on perceived pain on medium heat trials. Results are FDR-corrected within pain modulatory regions and across the whole brain. (A) Mediation model. We tested for brain regions that mediate the effects of current cue contingencies on subjective pain, corresponding to the reversals we observed (Figure 4). (B) Path A: effects of current contingencies. Path a identifies brain regions that show greater activation with the current high pain cue (e.g. Original High Cue during original contingencies, Original Low Cue during reversed contingencies), relative to the current low pain cue. Within pain modulatory regions (see Figure 5—figure supplement 1), we observed positive Path a effects (HM >LM) in the bilateral anterior insula, dorsal anterior cingulate, right anterior prefrontal cortex, and left dorsal posterior insula, and negative Path a effects (LM >HM) in the left subgenual ACC. We extracted trial-by-trial estimates from the left anterior insula and visualized average responses as a function of Group, Cue, and Phase (bottom left; Figure 2). Both groups showed greater left insula activation when medium heat was preceded by the Current High Cue, and cue effects did not differ by group. Differences were confirmed with extracted average timecourses (see Figure 5—figure supplement 3). Whole brain FDR-correction (bottom right) additionally identified positive Path a effects in the M1, S1, and right inferior parietal lobule (see Figure 5—figure supplement 4). (C) Mediation of current cue effects on pain. We observed significant negative mediation by several pain modulatory regions, including (from left to right) the subgenual ACC, the right VMPFC/OFC, the dorsomedial prefrontal cortex, and the left DLPFC. Extracting responses from each of these regions indicated that individuals who showed larger cue effects (i.e. Path a effects) showed more negative associations between brain activation and subjective pain (i.e. Path b). This is consistent with the fact that mediation can be driven by the covariance between paths, and is consistent with a modulatory suppression effect. Representative correlations are depicted for the right OFC; r=–0.40, P<.001, with Instructed Group participants in red and Uninstructed Group in blue. (D) Path b: associations with pain controlling for cue. Path b regions are positively associated with pain, controlling for cue (and temperature, since we tested only medium heat trials). We observed positive Path b effects in the VLPFC, bilateral putamen, bilateral anterior insula, and other regions within the pain modulatory network (top). We also observed significant Path b effects on NPS and SIIPS expression. Spaghetti plots in the lower right illustrate associations between trial-level pattern expression and pain, controlling for cue, for all individuals (blue) and the entire sample (95% CI illustrated in gray). For additional regions identified in whole brain search and uncorrected results, see Figures 3—5 and Figure 5—source data 1 (whole-brain corrected results) and Figure 5—source data 2 (uncorrected results).
-
Figure 5—source data 1
Mediation of current cue contingencies: Small-volumes corrected results.
- https://cdn.elifesciences.org/articles/73353/elife-73353-fig5-data1-v2.docx
-
Figure 5—source data 2
Mediation of current cue contingencies: Uncorrected results.
- https://cdn.elifesciences.org/articles/73353/elife-73353-fig5-data2-v2.docx
Figure 5—figure supplement 1
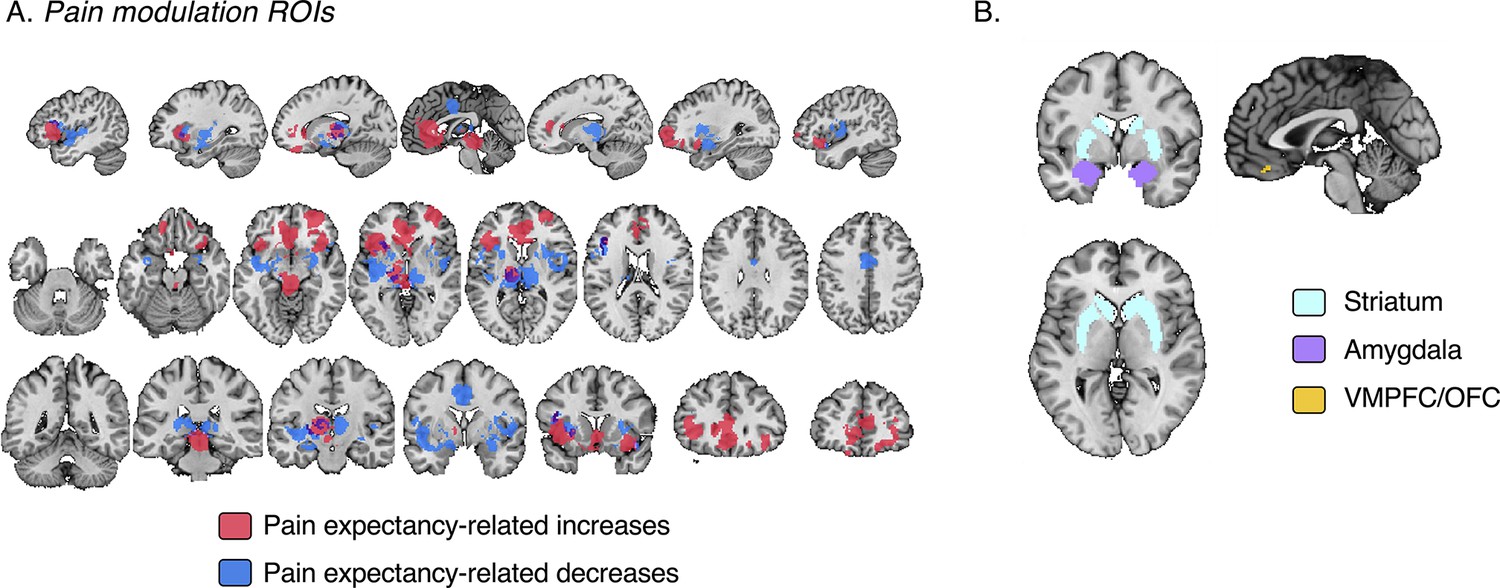
A priori regions of interest.
We searched within two sets of a priori regions of interest (ROIs). (A) Pain modulation ROIs were identified through a meta-analysis of placebo analgesia and expectancy-based pain modulation (Atlas and Wager, 2014b). We created a mask combined across modulatory regions whose responses to noxious stimuli increase with expectations for reduced pain (red) and regions whose responses to noxious stimuli decrease with expectations for reduced pain (blue). (B) We also examined responses within value-related ROIs (right), including the bilateral striatum (cyan), bilateral amygdala (violet), and the VMPFC/OFC (yellow). See Materials and methods for details of ROI identification and ROI-wise analyses.
Figure 5—figure supplement 2
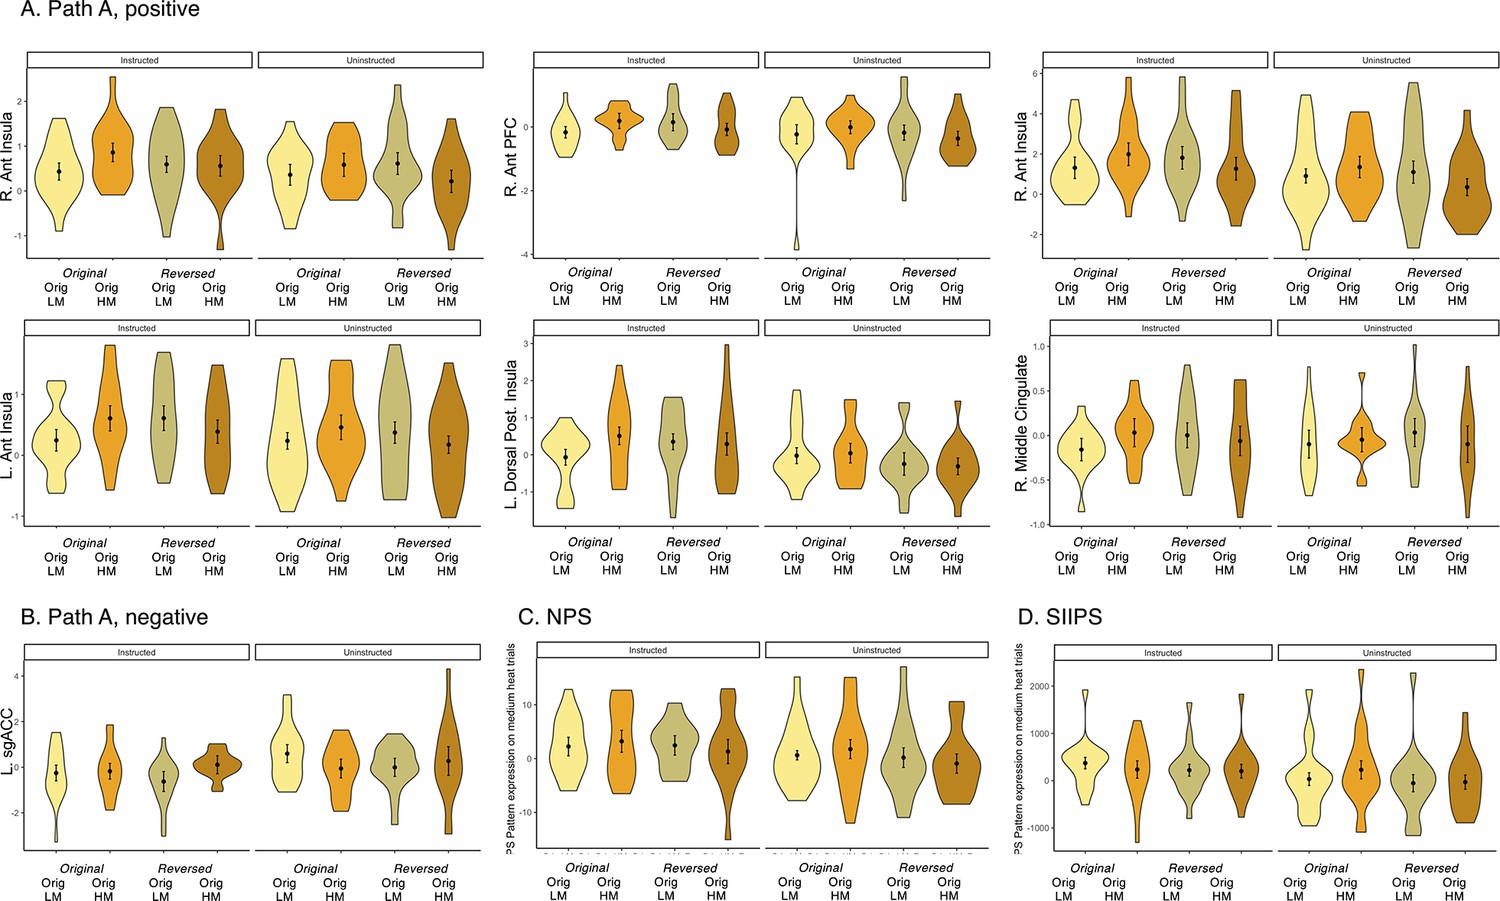
Current contingency mediation: Effects of cue and phase within pain modulatory network.
This figure depicts extracted responses within pain modulatory regions for Path a and mediation of current contingency effects on medium heat pain. We extracted responses and averaged as a function of Group (Instructed vs Uninstructed), Cue (Original low = ‘Orig LM’; Original high = ‘Orig HM’), Phase (Left two lighter bars = Original contingencies; Right two darker bars = reversed contingencies). (A) Responses in pain modulatory clusters identified in analyses of Path a with positive effects, hat is higher activation in response to current high pain cues relative to current low pain cues. This confirms that these regions update responses as contingencies change and do so similarly across both groups. (B) Responses within the sgACC region that showed negative path a effects. (C) Pattern expression within the neurologic signature pattern (NPS; Wager et al., 2013). (D) Pattern expression within the stimulus-intensity independent pain signature pattern (SIIPS; Woo et al., 2017).
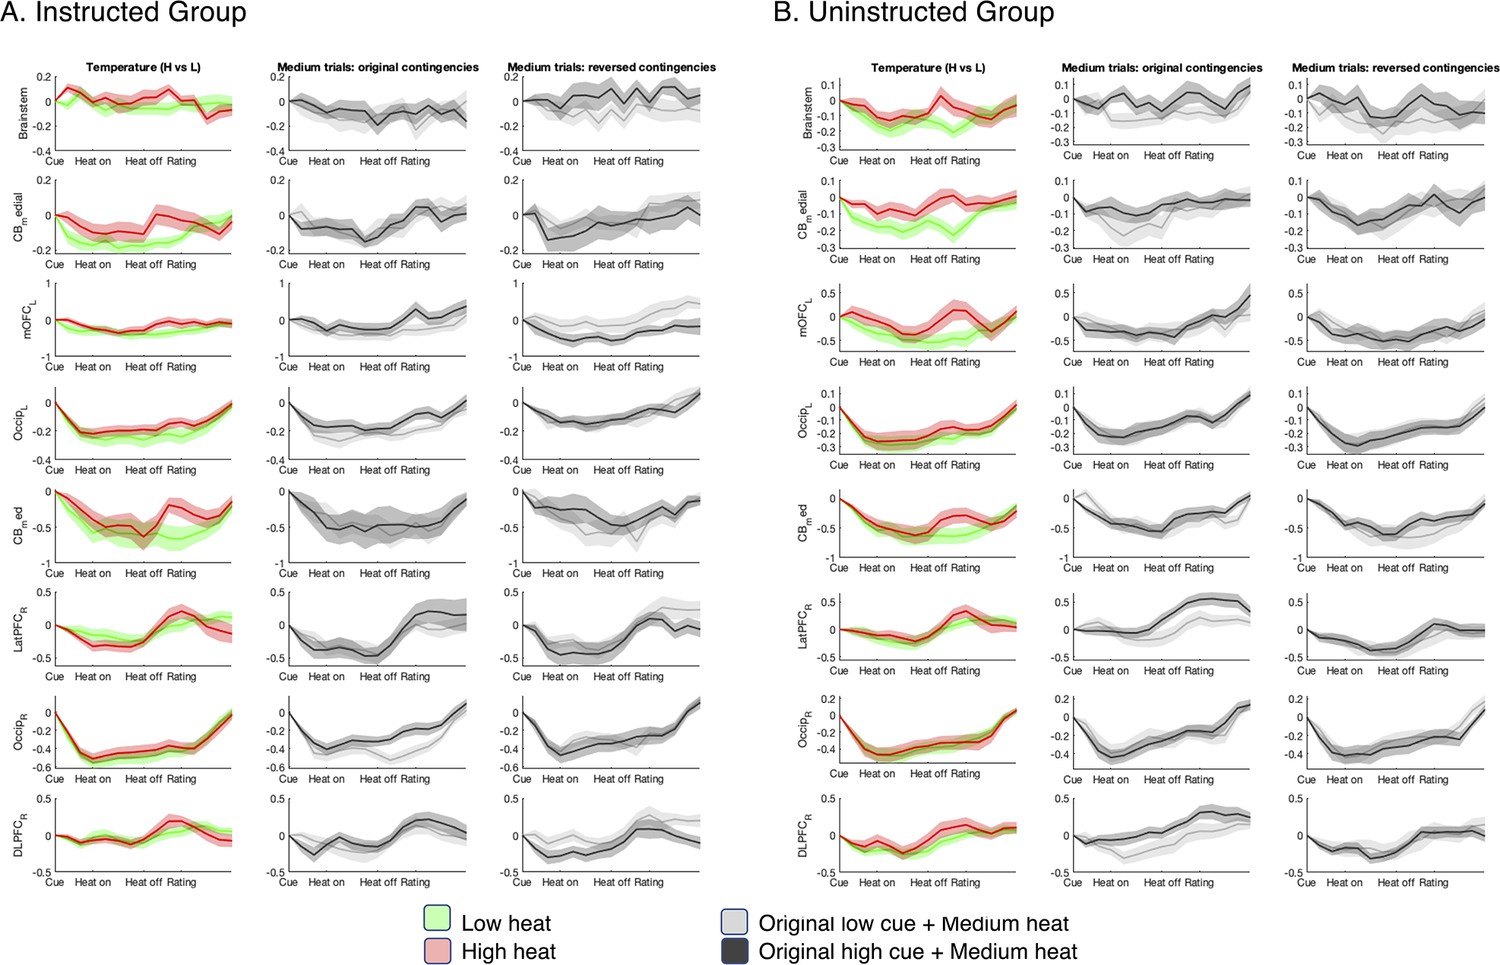
Figure 5—figure supplement 3
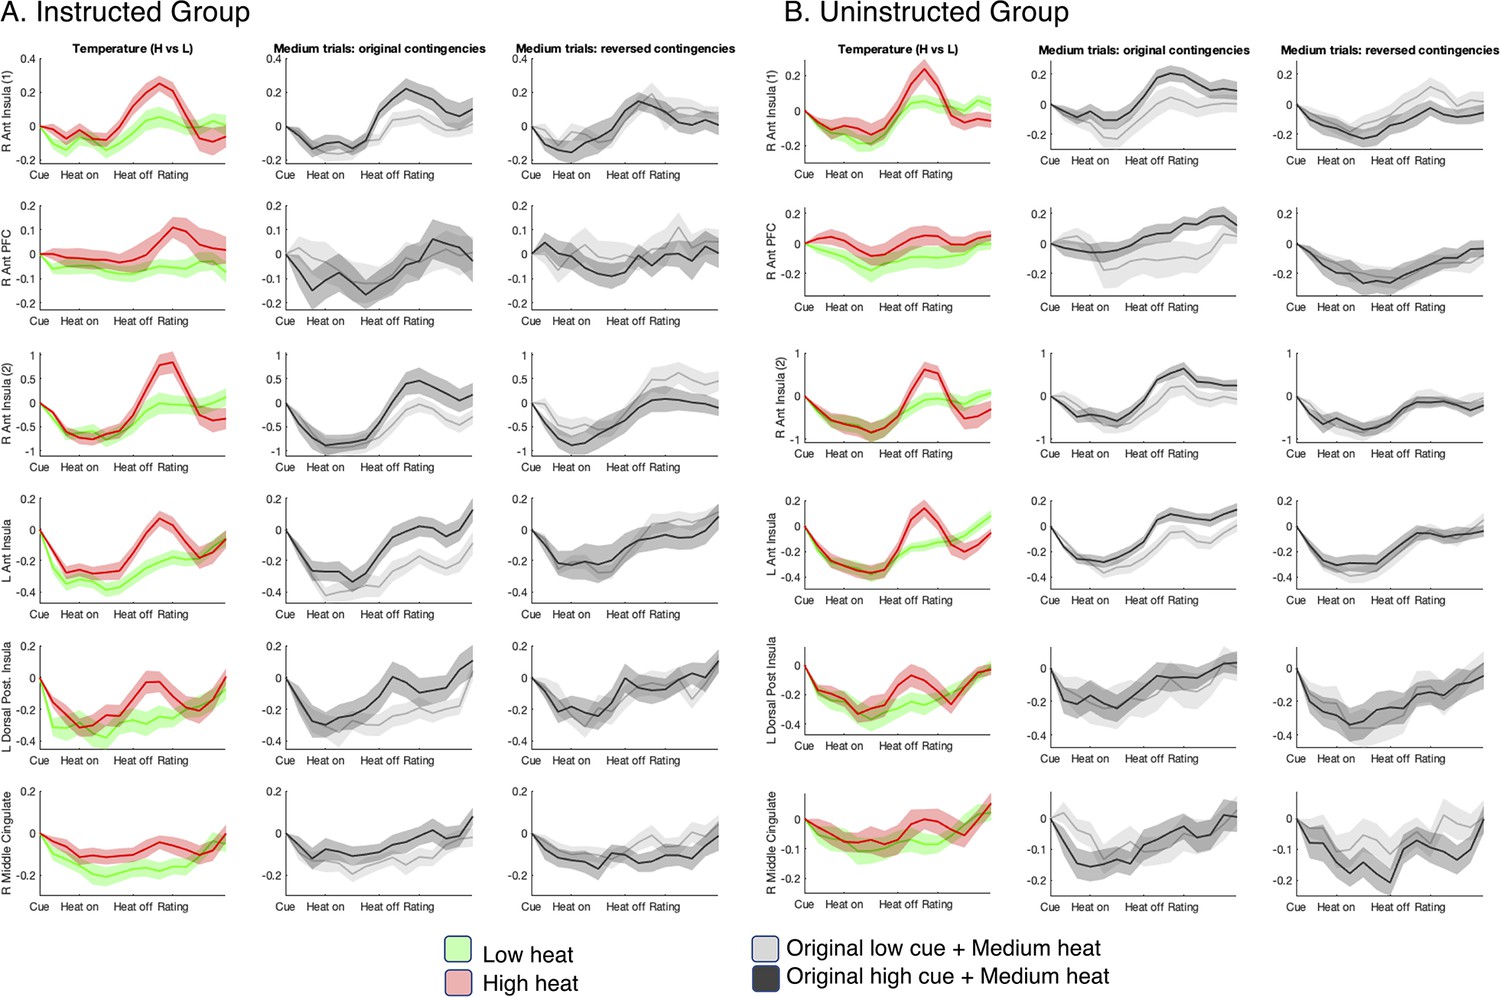
Raw timecourses in Path A regions.
Images depict average baseline-corrected trial timecourse for regions identified in FDR-Corrected Path A analyses (see Figure 5—figure supplement 3) as a function of Group and temperature. Average responses to low heat trials (green) and high heat trials (red) are depicted in the left column, and responses to medium heat trials are depicted in the center column (original contingencies) and right column (reversed contingencies) as a function of original cue type.
Figure 5—figure supplement 4
Current contingency mediation: Whole-brain FDR correction.
Results are reported in Figure 5—source data 1.
Figure 5—figure supplement 5
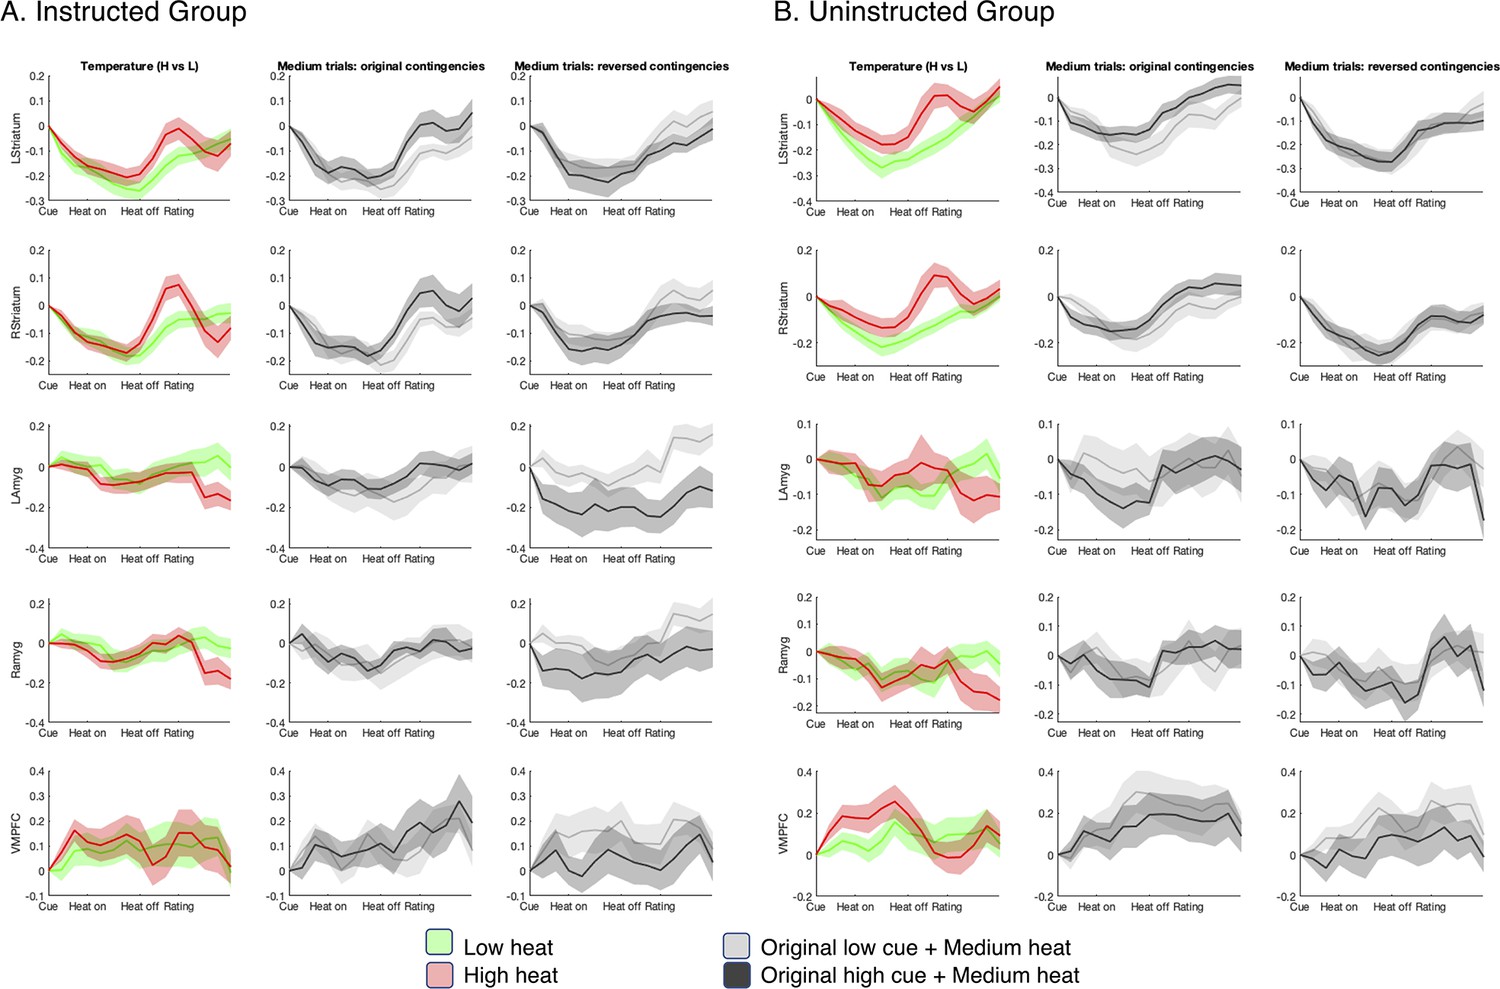
Raw timecourses in value-related regions of interest.
Images depict average baseline-corrected trial timecourse for value-related ROIs (see Figure 5—figure supplement 1) as a function of Group and temperature. Average responses to low heat trials (green) and high heat trials (red) are depicted in the left column, and responses to medium heat trials are depicted in the center column (original contingencies) and right column (reversed contingencies) as a function of original cue type.
Figure 5—figure supplement 6
Current contingency mediation: Whole-brain uncorrected.
Results are reported in Figure 5—source data 2.
Figure 5—figure supplement 7
Current contingency mediation including Group as a moderator: Whole-brain uncorrected.
Results are reported in Figure 5—source data 2.
Figure 6 with 5 supplements
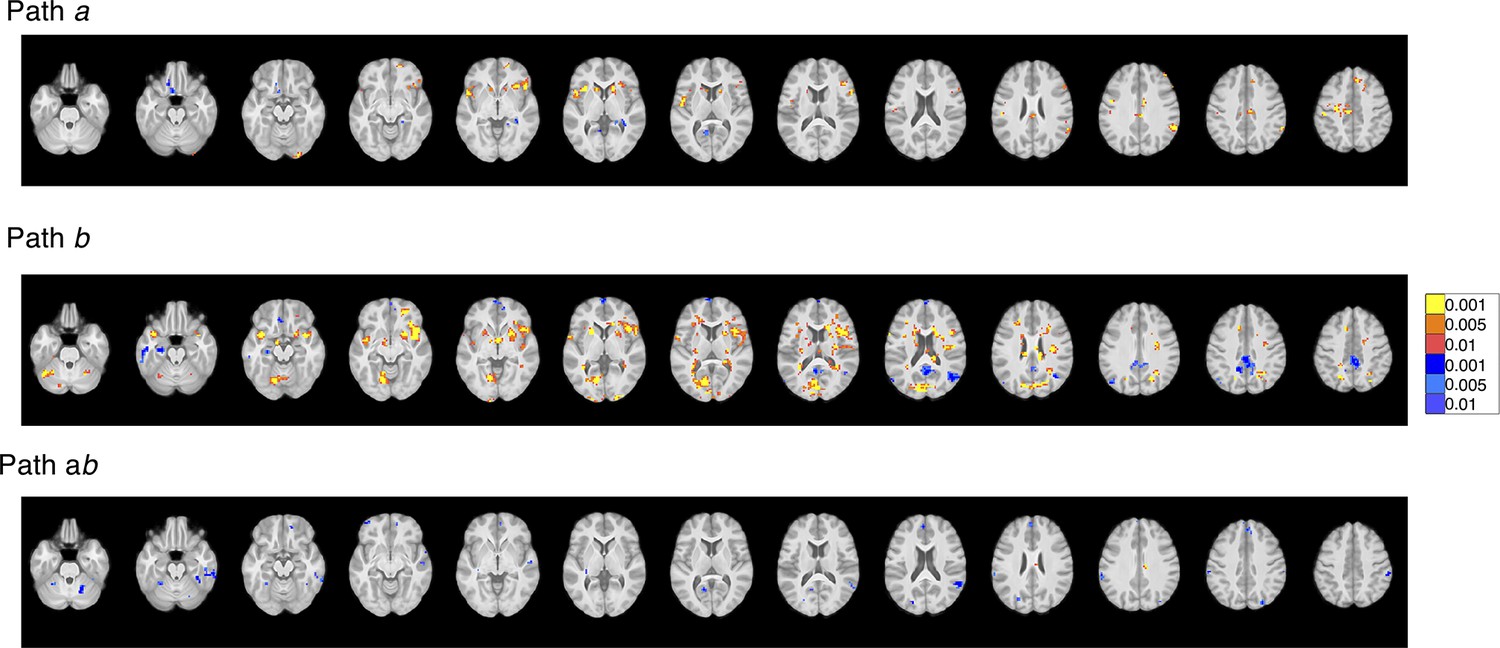
Original cue effects on medium heat pain.
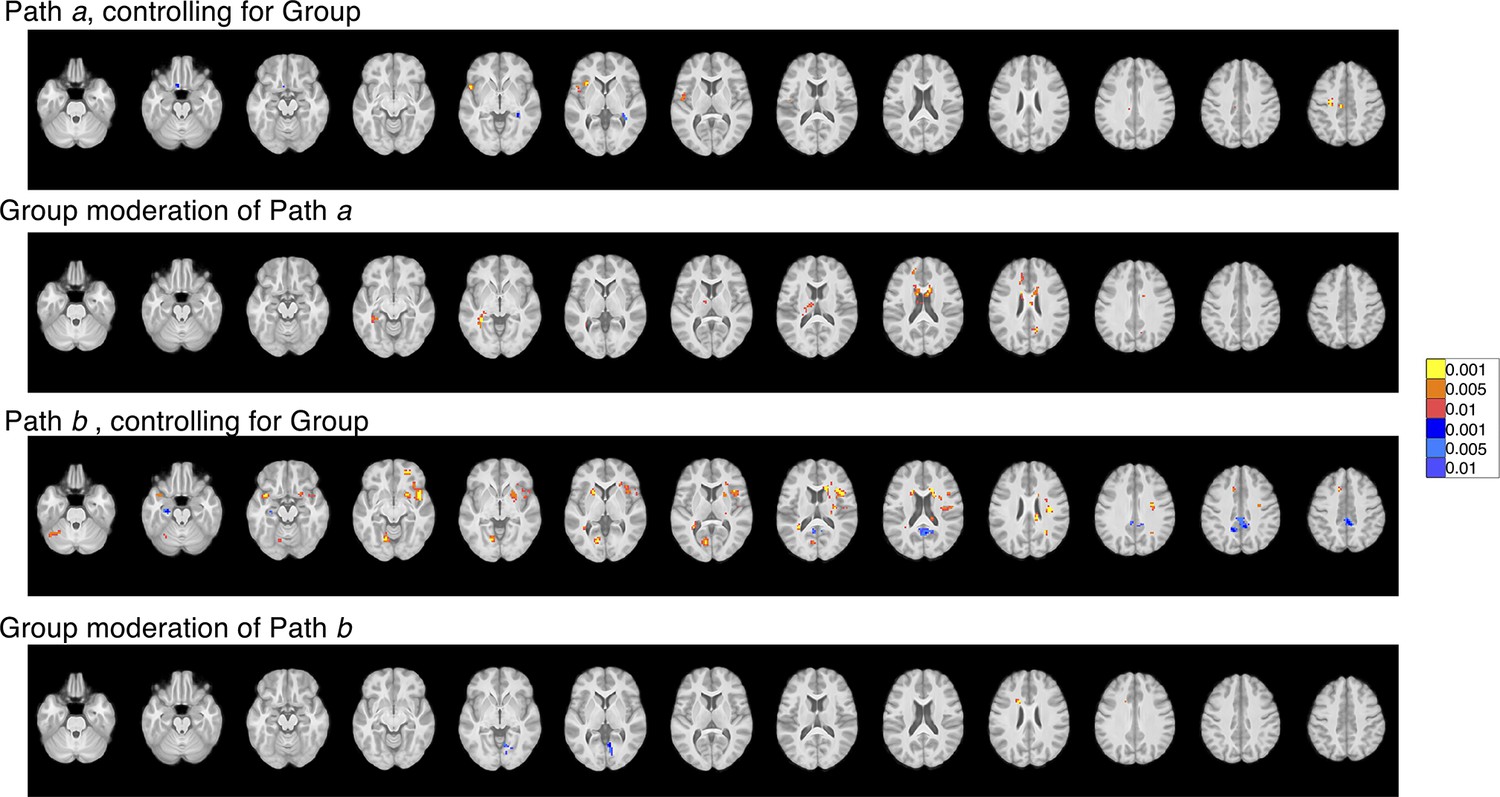
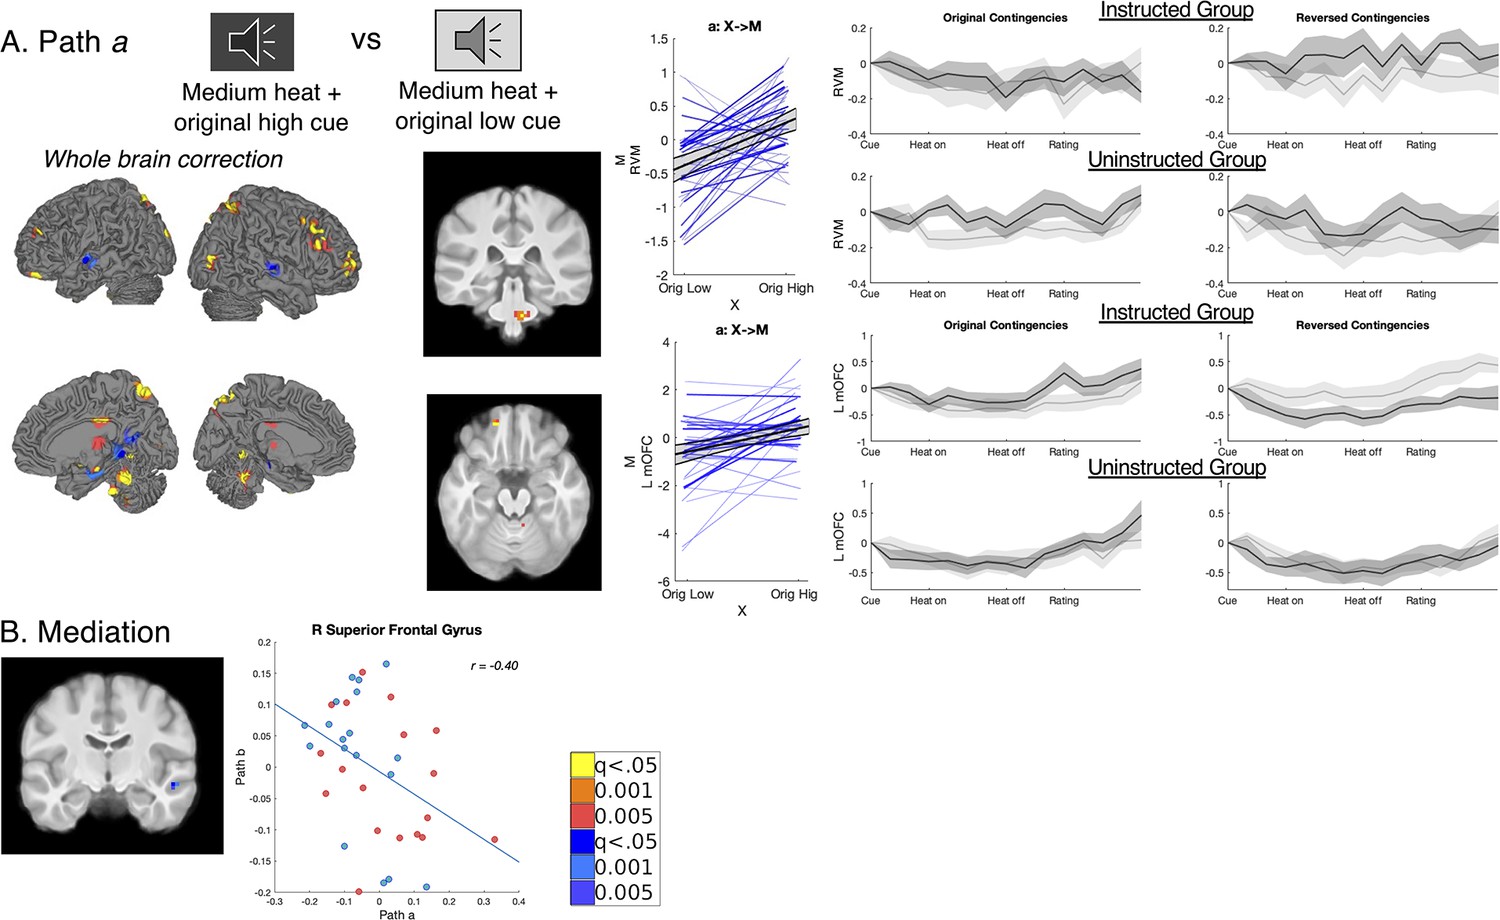
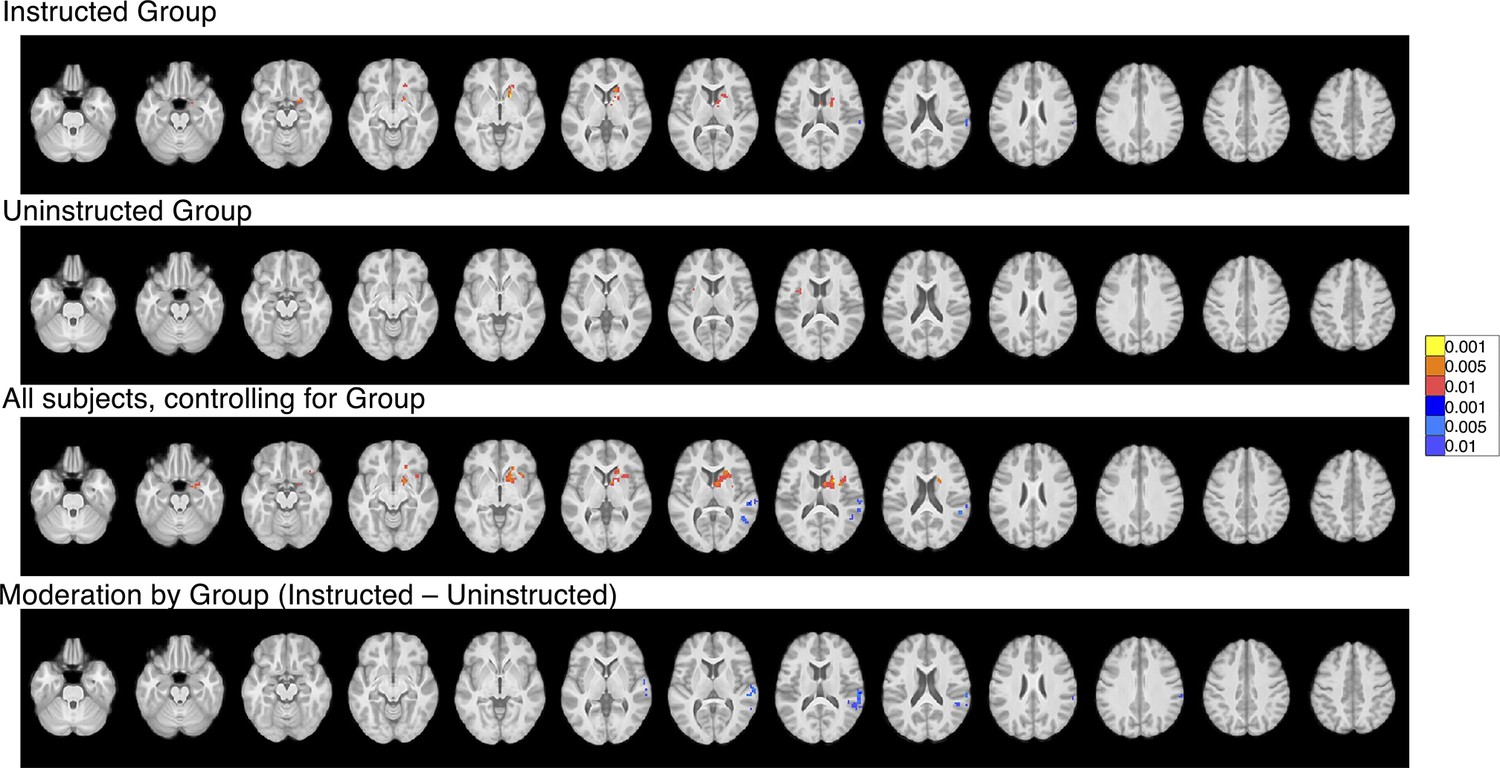
We conducted a second mediation analysis to isolate effects of original contingencies, controlling for current contingencies. (A) Effects of original contingencies. The goal of our second mediation analysis was to specifically identify regions that continued to respond to the original contingencies across the entire task, regardless of reversals. (B) Path a: Regions that show greater activation to original high pain contingencies despite reversals. Path a identified regions that showed greater activation to the Original High Cue (dark gray) relative to the Original Low Cue (light gray) across the entire task, while controlling for current contingencies. No voxels survived correction within pain modulatory regions. However, whole brain correction revealed that a number of regions including the brainstem’s rostroventral medulla (RVM), right DLPFC, left medial OFC (mOFC), and other regions (see Figure 6—figure supplement 2 and Figure 6—source data 1) continued to show higher activation when medium heat was paired with the original high pain cue regardless of Phase. Extracting trial-by-trial responses from the RVM (top) confirmed that this region showed greater heat-evoked activation with the Original High Cue during both original and reversed contingencies and that effects were present in both the Instructed Group and the Uninstructed Group. In the mOFC, however, responses did reverse within the Instructed Group (bottom), suggesting that failure to reverse was driven by Uninstructed Group participants. Similar effects were observed in the VMPFC region of interest (See Figure 5—figure supplement 5). See Figure 6—figure supplements 2 and 3 for means within other Path a regions. (B) Associations between original contingencies and pain were statistically mediated by a cluster in the right superior frontal gyrus, in which individuals who had larger effects of original cues on brain responses (controlling for current contingencies; i.e. Path a, x-axis) also had stronger negative associations between brain activation and subjective pain (Path b, y-axis). There were no additional mediators of original cue effects on pain based on whole brain correction identified additional effects in the right DLPFC, precuneus, and cerebellum (see Figure 6—figure supplement 1 and Figure 6—source data 1). Whole brain uncorrected results are presented in Figure 6—figure supplements 4 and 5 and Figure 6—source data 2.
-
Figure 6—source data 1
Mediation of original cue contingencies: Small-volumes corrected results.
- https://cdn.elifesciences.org/articles/73353/elife-73353-fig6-data1-v2.docx
-
Figure 6—source data 2
Mediation of original cue contingencies: Uncorrected results.
- https://cdn.elifesciences.org/articles/73353/elife-73353-fig6-data2-v2.docx
Figure 6—figure supplement 1
Original contingency mediation: Whole-brain FDR correction.
Results are reported in Figure 6—source data 1.
Figure 6—figure supplement 2
Original contingency mediation: Effects of cue and phase.
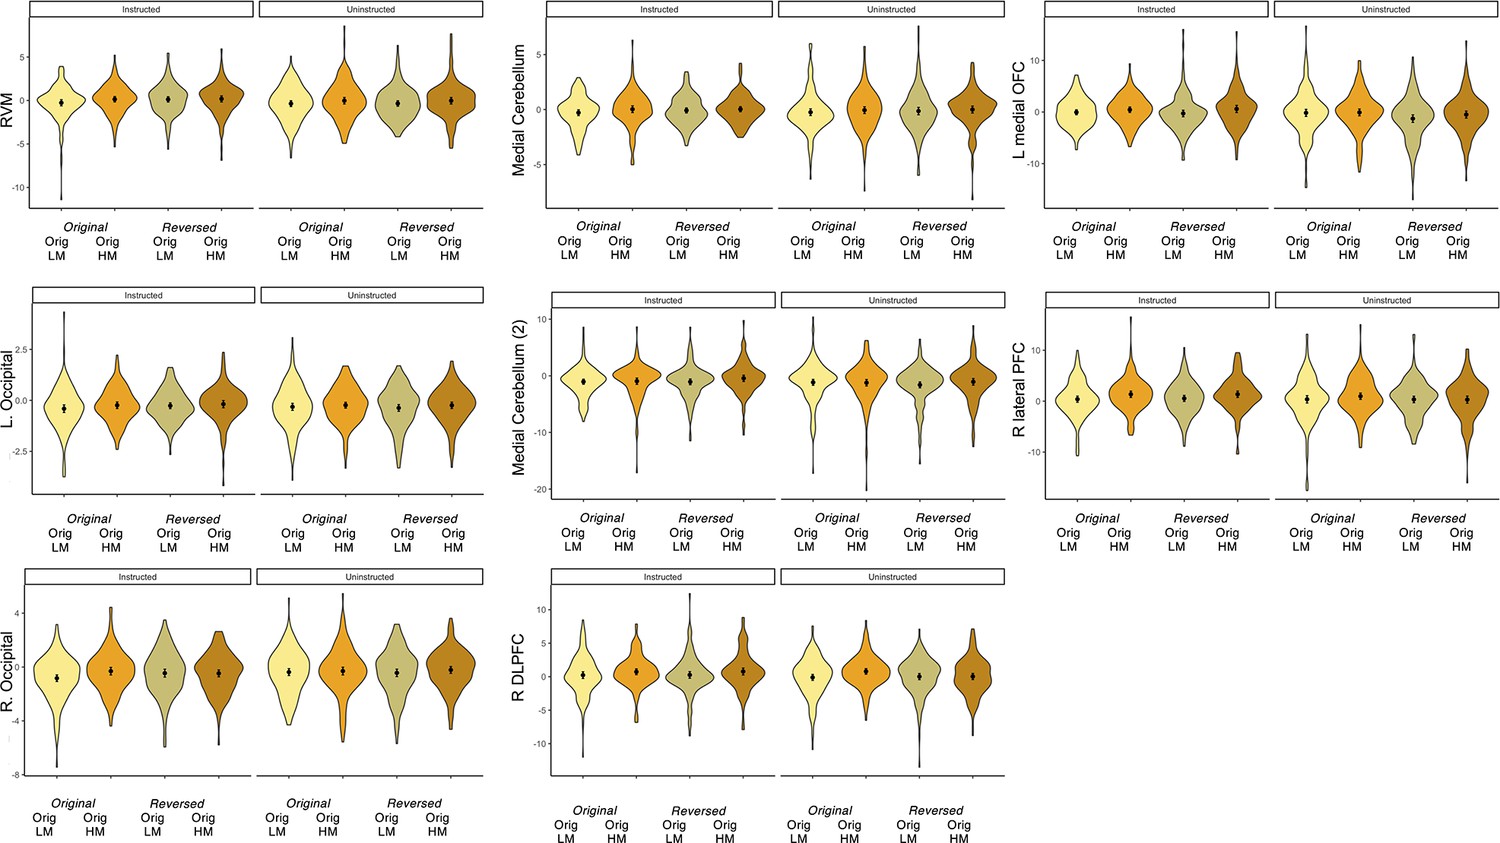
This figure depicts extracted responses in clusters identified in analyses of Path a of the mediation based on original contingencies, i.e. regions identified as showing higher activation in response to original high pain cues relative to original low pain cues, regardless of phase. We extracted responses and averaged as a function of Group (Instructed vs Uninstructed), Cue (Original low = ‘Orig LM’; Original high = ‘Orig HM’), Phase (Left two lighter bars = Original contingencies; Right two darker bars = reversed contingencies). This confirms that these regions maintain initial responses despite contingency reversals and that responses are similar across both groups.
Figure 6—figure supplement 3
Raw timecourses in Path A regions.
Images depict average baseline-corrected trial timecourse for regions identified in FDR-Corrected Path A analyses (see Figure 6—figure supplement 1) as a function of Group and temperature. Average responses to low heat trials (green) and high heat trials (red) are depicted in the left column, and responses to medium heat trials are depicted in the center column (original contingencies) and right column (reversed contingencies) as a function of original cue type.
Figure 6—figure supplement 4
Original contingency mediation: Whole-brain uncorrected results.
Results are reported in Figure 6—source data 2.
Figure 6—figure supplement 5

Original contingency mediation, including Group as a moderator: Whole-brain uncorrected results.
Results are reported in Figure 6—source data 2.
Figure 7
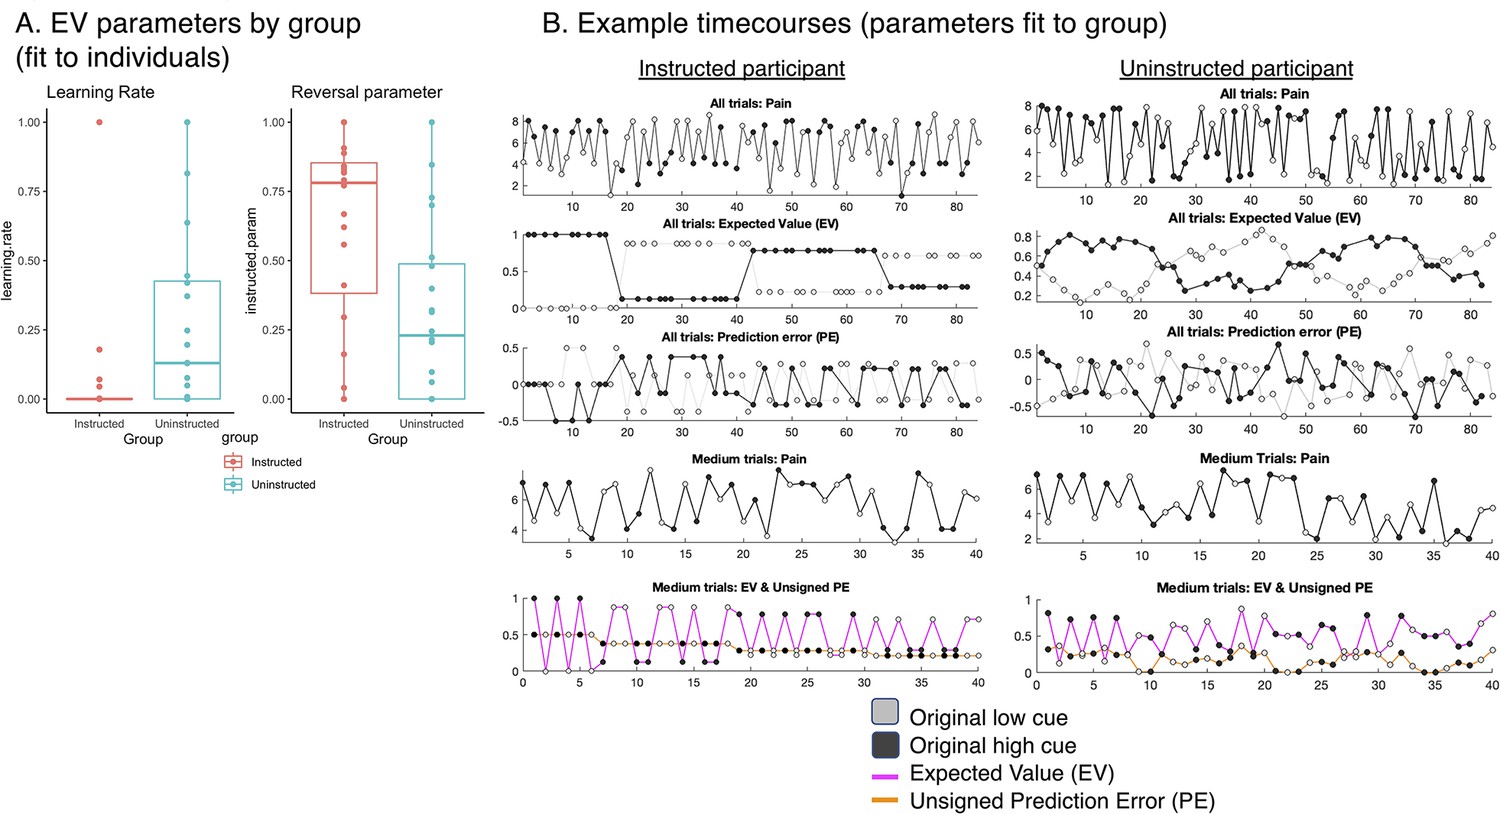
Instructed learning model fit to pain on medium heat trials.
We fit a computational model of instructed reversal learning (Atlas et al., 2016) to pain reports on medium heat trials to isolate the dynamics of expected value and how expected value updates with instruction. (A) Group differences in learning parameters. Fitting models to individuals revealed group differences in learning rate (α, left), such that participants in the Uninstructed Group (blue) showed stronger updates of expected value in response to prediction errors relative to the Instructed Group (red), whereas the Instructed Group showed stronger reversals at the time when instructions were delivered, based on the instructed reversal parameter (ρ, right). (B) Predicted timecourse of expected value based on jack-knife model fits. We used model parameters from a jack-knife model fitting procedure (see Materials and Methods) to generate predicted timecourse of expected value (EV) for each group. Here we depict model predictions for an example participant in the Instructed Group (left) and the Uninstructed Group (right). As shown in the second row, EV reverses immediately upon instruction in the Instructed Group and reverses more gradually in the Uninstructed Group. We focused on responses fit to medium pain ratings (fourth row) and modeled associations between heat-evoked activation and the timecourse of EV and unsigned PE on medium heat trials (bottom row).
Figure 8 with 9 supplements
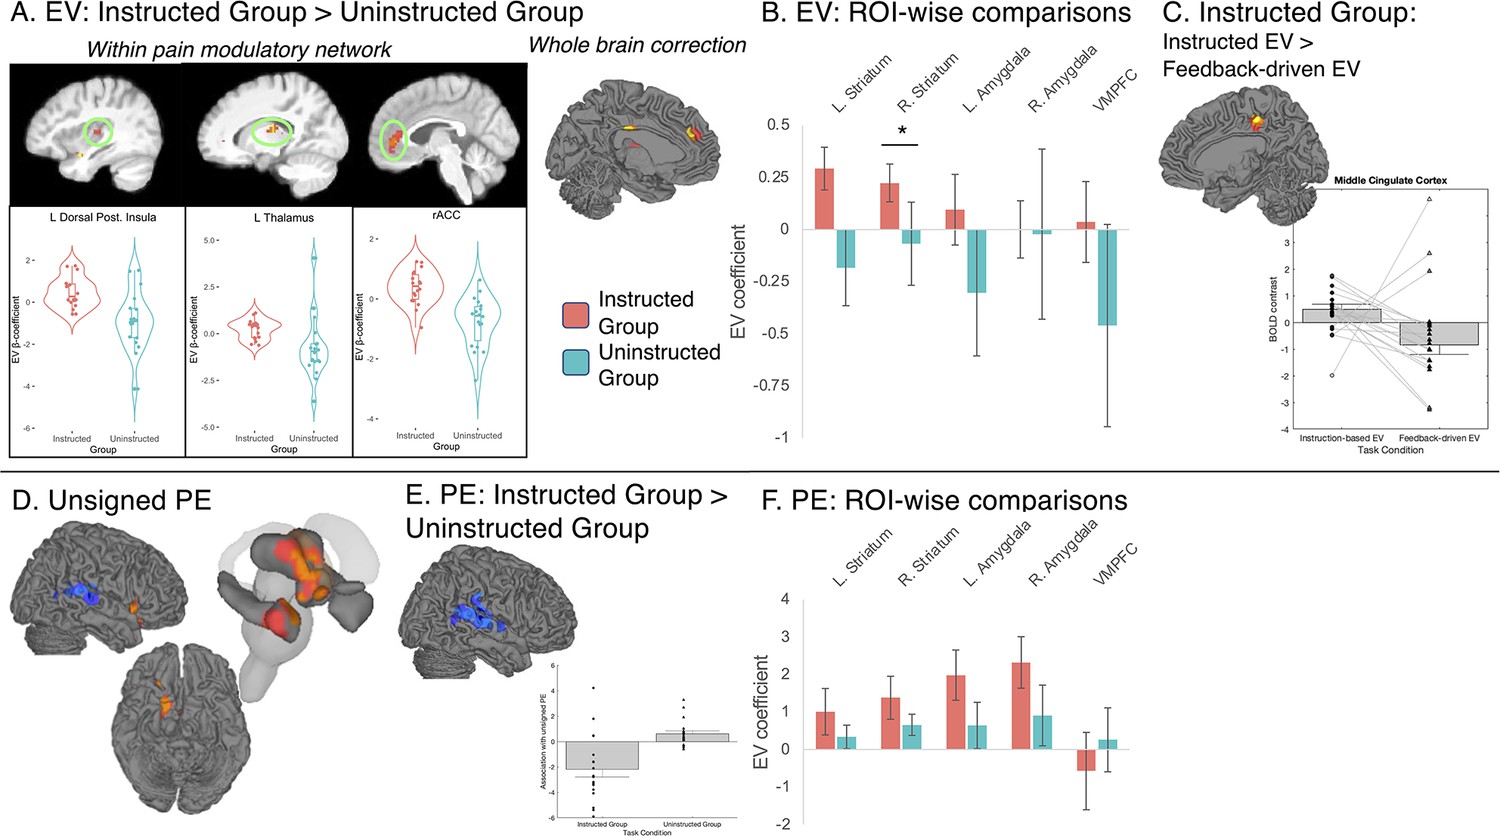
Group differences in associations with expected value and prediction error on medium heat trials.
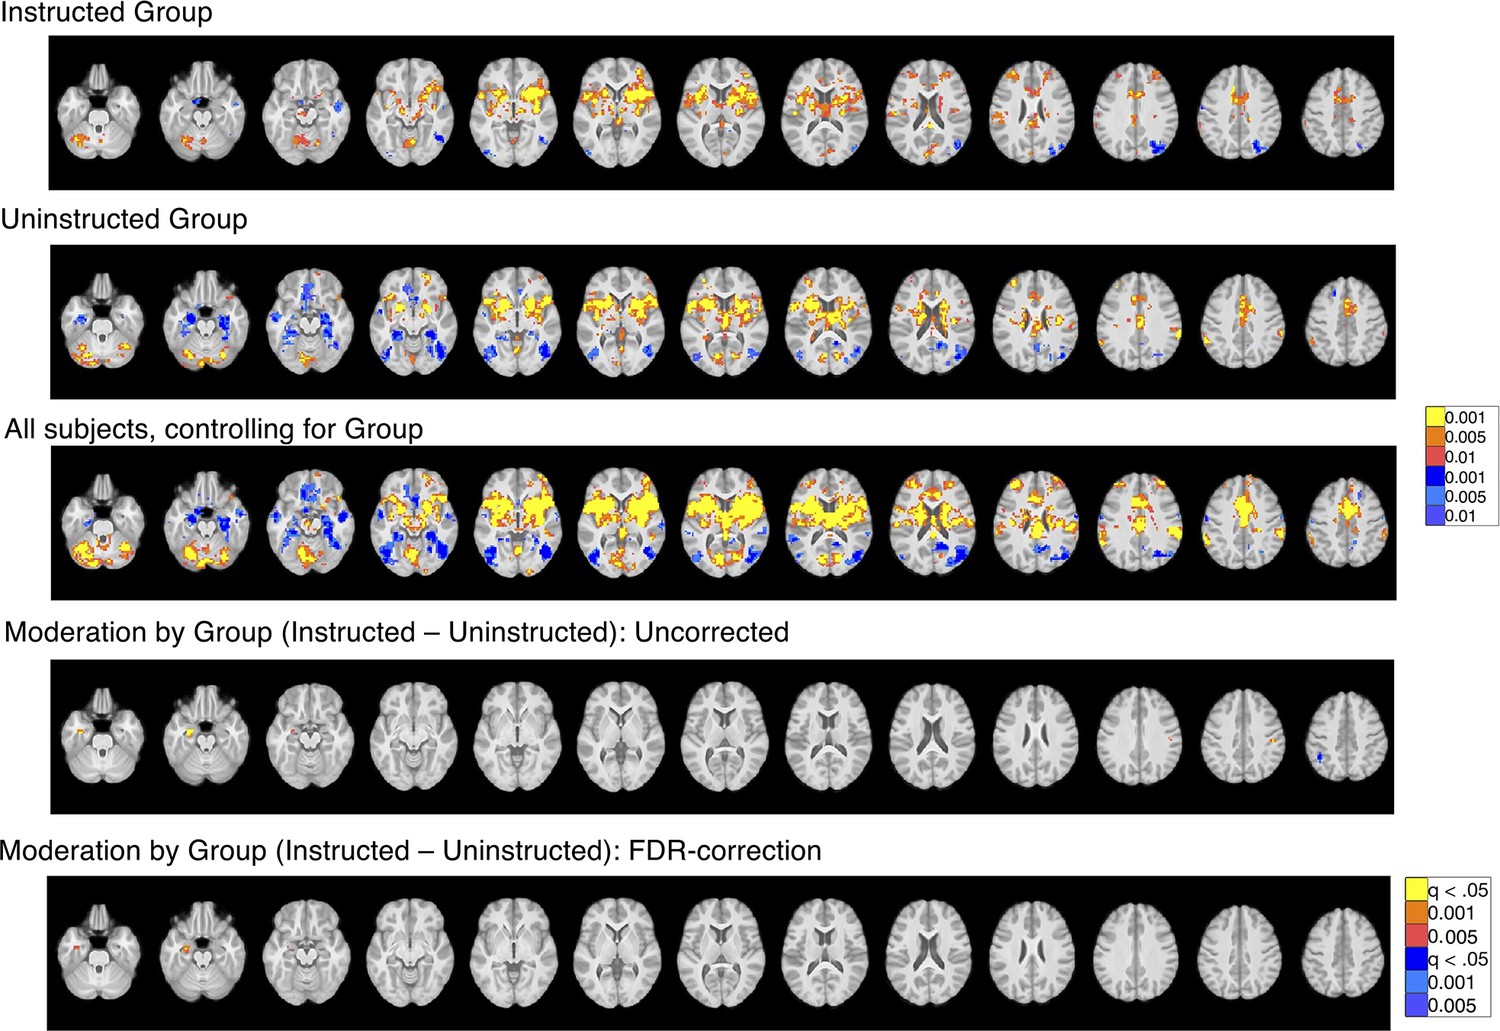
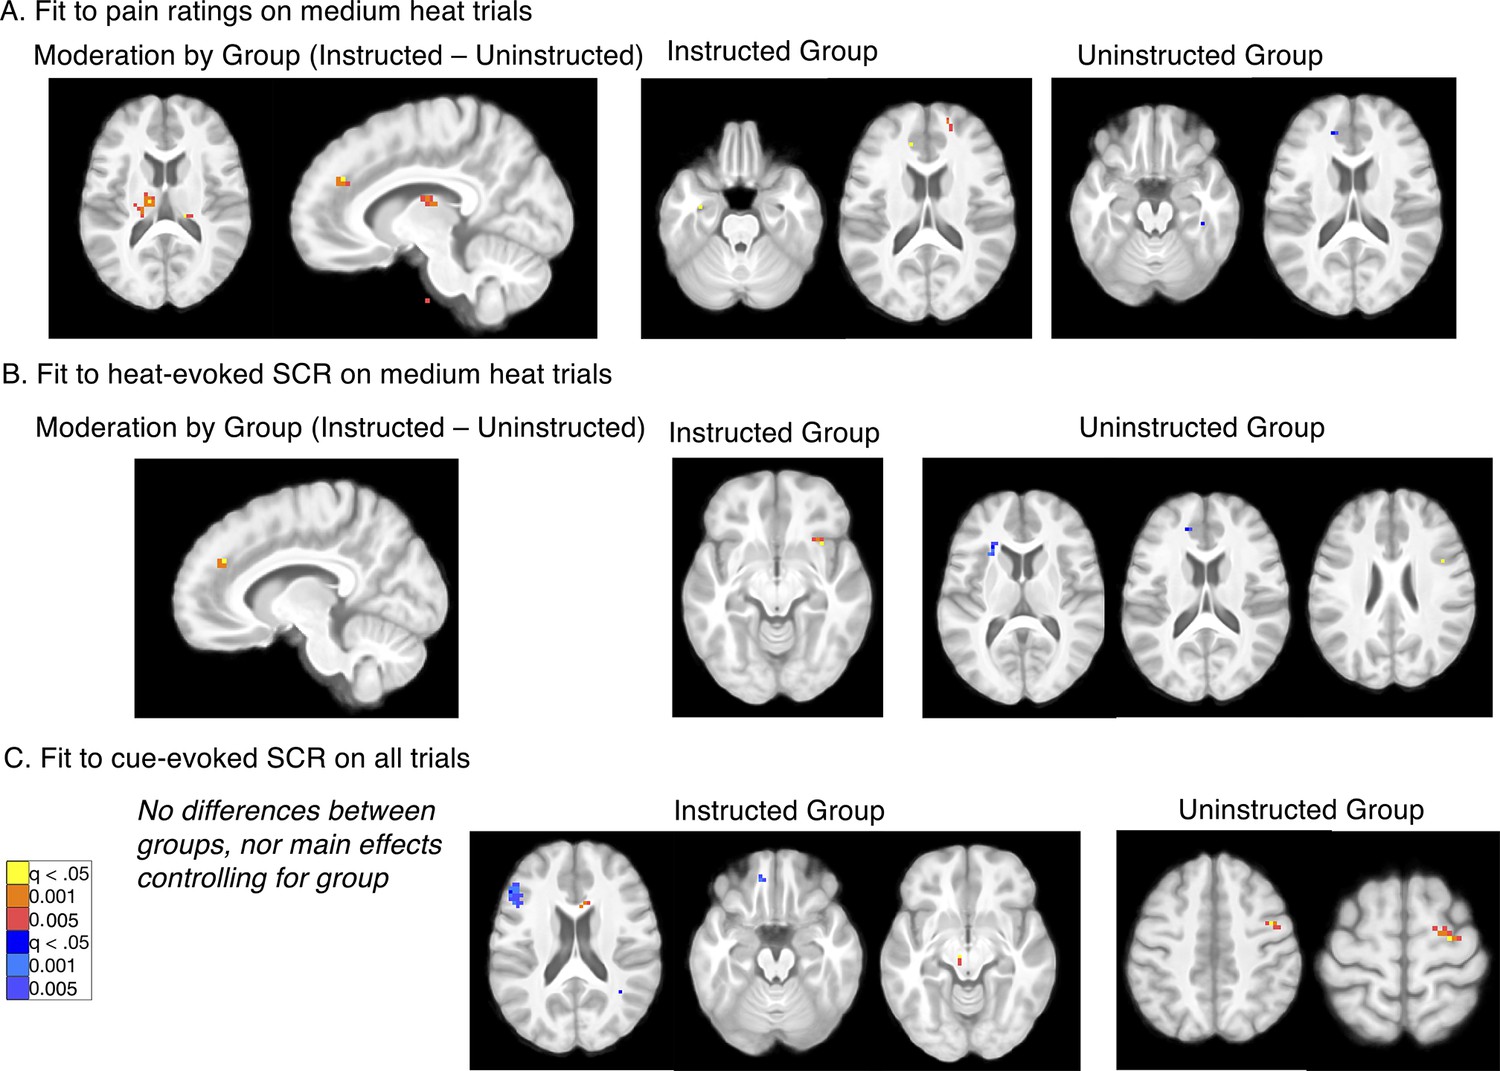
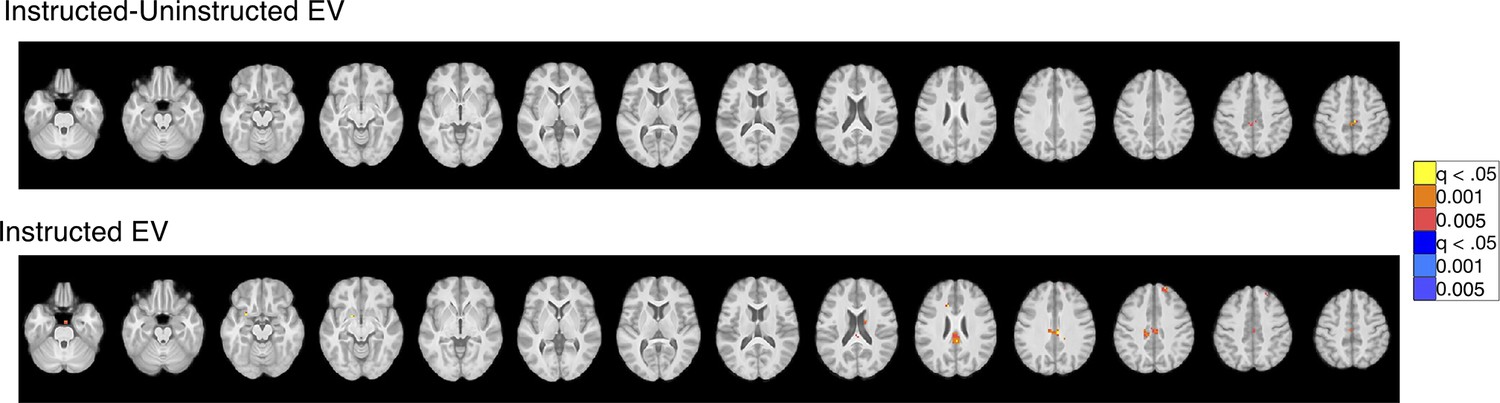
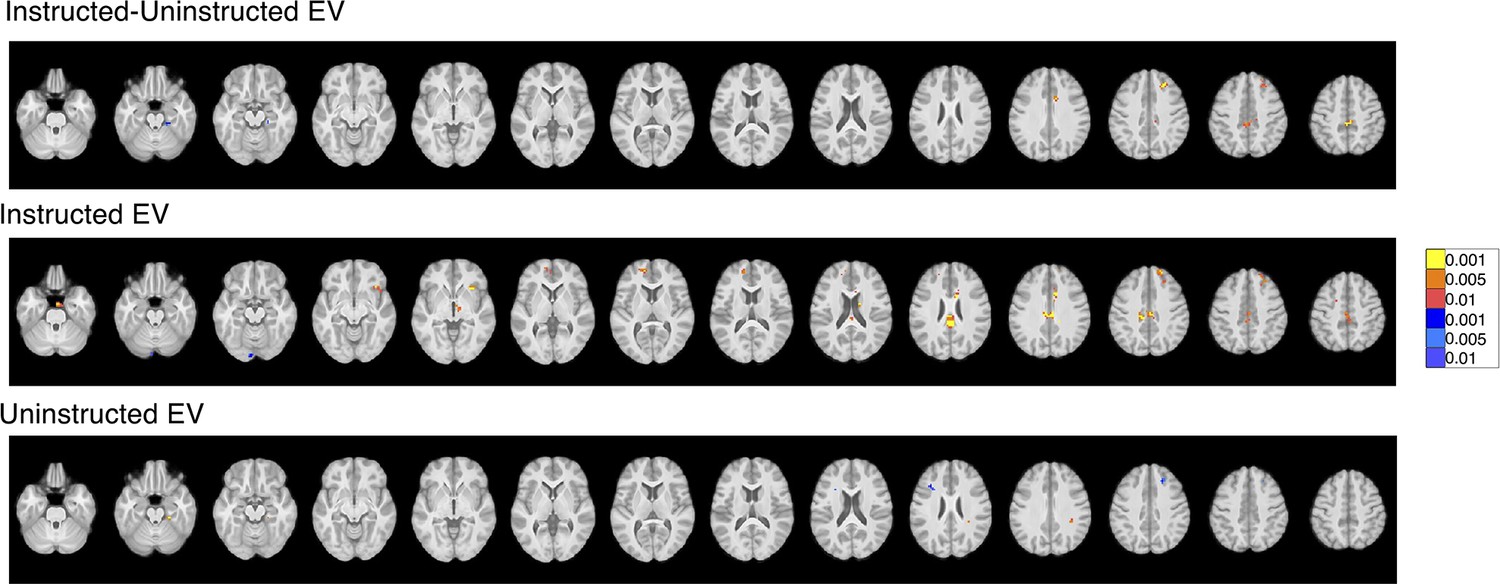
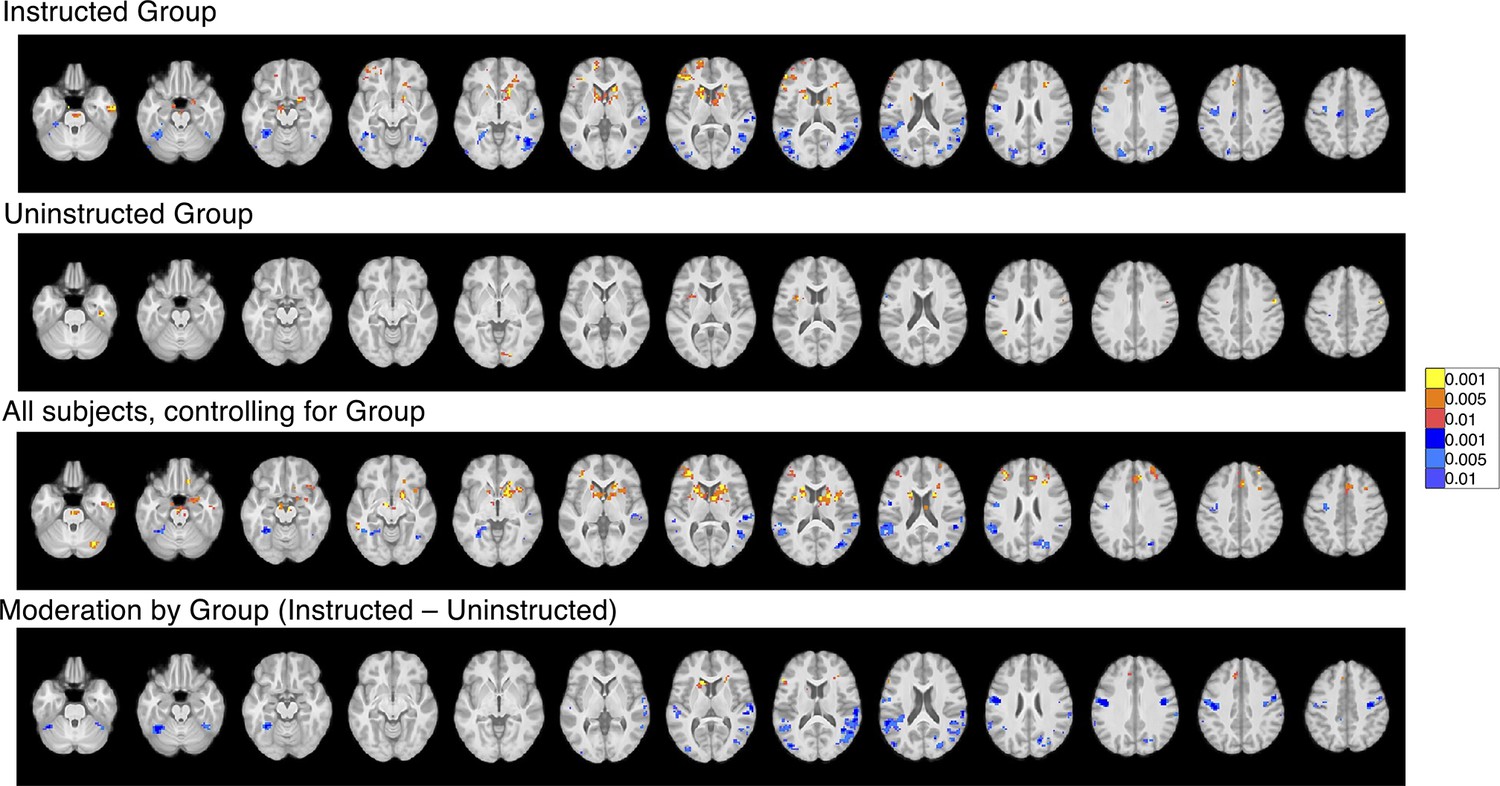
We used the timecourse of expected value (EV) based on fitting computational models to pain reports from each group (see Figure 7) to isolate the neural correlates of instructed and uninstructed expected value (EV) and prediction error (PE) during pain processing. We examined associations between brain responses to medium heat and the timecourse of EV and unsigned PE (i.e. absolute value of PE) and used robust regression (Wager et al., 2005) to compare groups. (A) Group differences in expected value within pain modulatory regions. The left dorsal posterior insula, left thalamus, and rostral anterior cingulate cortex (rACC) showed positive associations with EV within the Instructed Group (red) and negative associations within the Uninstructed Group (blue). Whole brain FDR-correction additionally identified group differences in the left middle cingulate cortex (see surface map). (B) Associations with EV in value-related ROIs. Extracting contrast values within a priori value-related regions of interest (ROIs) revealed significant associations in the bilateral striatum within the Instructed Group and significant group differences in the left striatum (see Table 4). (C) Comparing instructed and feedback-driven EV within the Instructed Group. Direct comparisons of the timecourse of EV within Instructed Group participants who were exposed to both types of information revealed significant differences in the middle cingulate cortex, driven by positive associations with instruction-based EV. (D) Main effects of unsigned PE. Unsigned PE was associated with activation across groups in the right insula, striatum, and right amygdala. (E) Group differences in unsigned PE. There were stronger associations with unsigned PE in the right SII and temporal gyrus, driven by negative associations in the Instructed Group and positive associations in the Uninstructed Group. (F) Associations with PE in value-related ROIs. ROI-wise analyses revealed significant associations between unsigned PE and activation in the right striatum and bilateral amygdala. See also Figure 8—figure supplements 1–9 and Figure 8—source data 1 and 2. Error bars denote standard error of the mean (n = 18 per group).
-
Figure 8—source data 1
Associations with expected value (EV): Small-volumes corrected results.
- https://cdn.elifesciences.org/articles/73353/elife-73353-fig8-data1-v2.docx
-
Figure 8—source data 2
Associations with expected value (EV): Uncorrected results.
- https://cdn.elifesciences.org/articles/73353/elife-73353-fig8-data2-v2.docx
-
Figure 8—source data 3
Associations with expected value (EV) based on fits to heat-evoked SCR.
- https://cdn.elifesciences.org/articles/73353/elife-73353-fig8-data3-v2.docx
-
Figure 8—source data 4
Associations with expected value (EV) based on fits to cue-evoked SCR.
- https://cdn.elifesciences.org/articles/73353/elife-73353-fig8-data4-v2.docx
-
Figure 8—source data 5
Comparing instructed and feedback-driven expected value (EV) within the Instructed Group.
- https://cdn.elifesciences.org/articles/73353/elife-73353-fig8-data5-v2.docx
-
Figure 8—source data 6
Associations with unsigned prediction error (PE).
- https://cdn.elifesciences.org/articles/73353/elife-73353-fig8-data6-v2.docx
Figure 8—figure supplement 1
Expected value: Whole-brain correction.
Results are reported in Figure 8—source data 1.
Figure 8—figure supplement 2
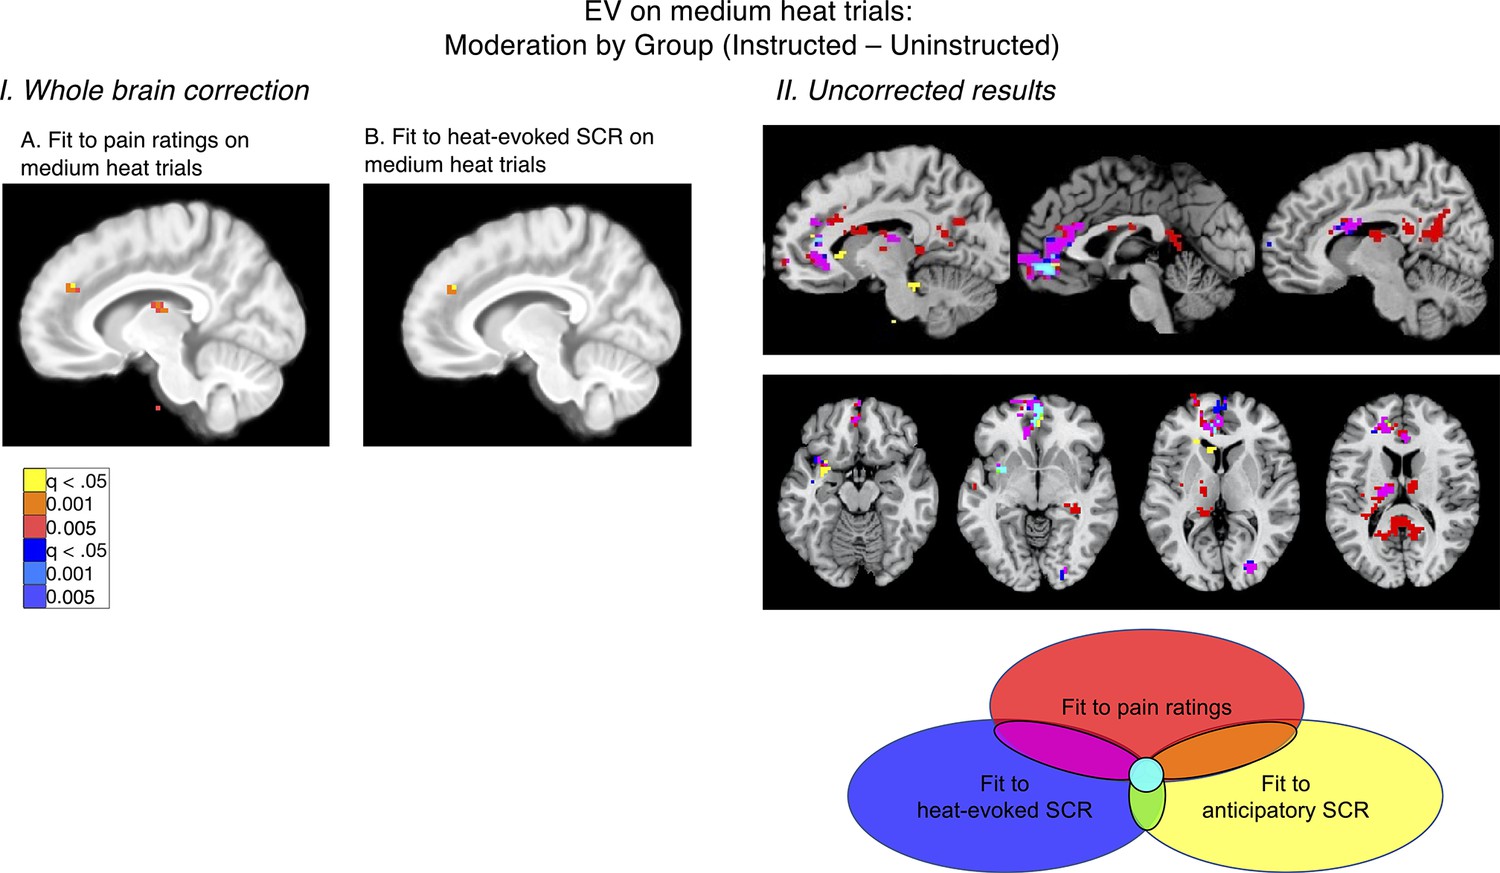
Expected Value on medium heat trials: Moderation by group (Instructed >Uninstructed).
(I) FDR-correction revealed stronger positive associations between DMPFC activation and EV in the Instructed Group than the Uninstructed Group, whether models were fit to pain ratings (left) or SCR (right) on medium heat trials. For complete results, see Figure 8—source data 1. (II) Cluster color depicts overlaps between the three computational models based on uncorrected results. For complete results, see Figure 8—figure supplements 3–5 and accompanying Source Data.
Figure 8—figure supplement 3
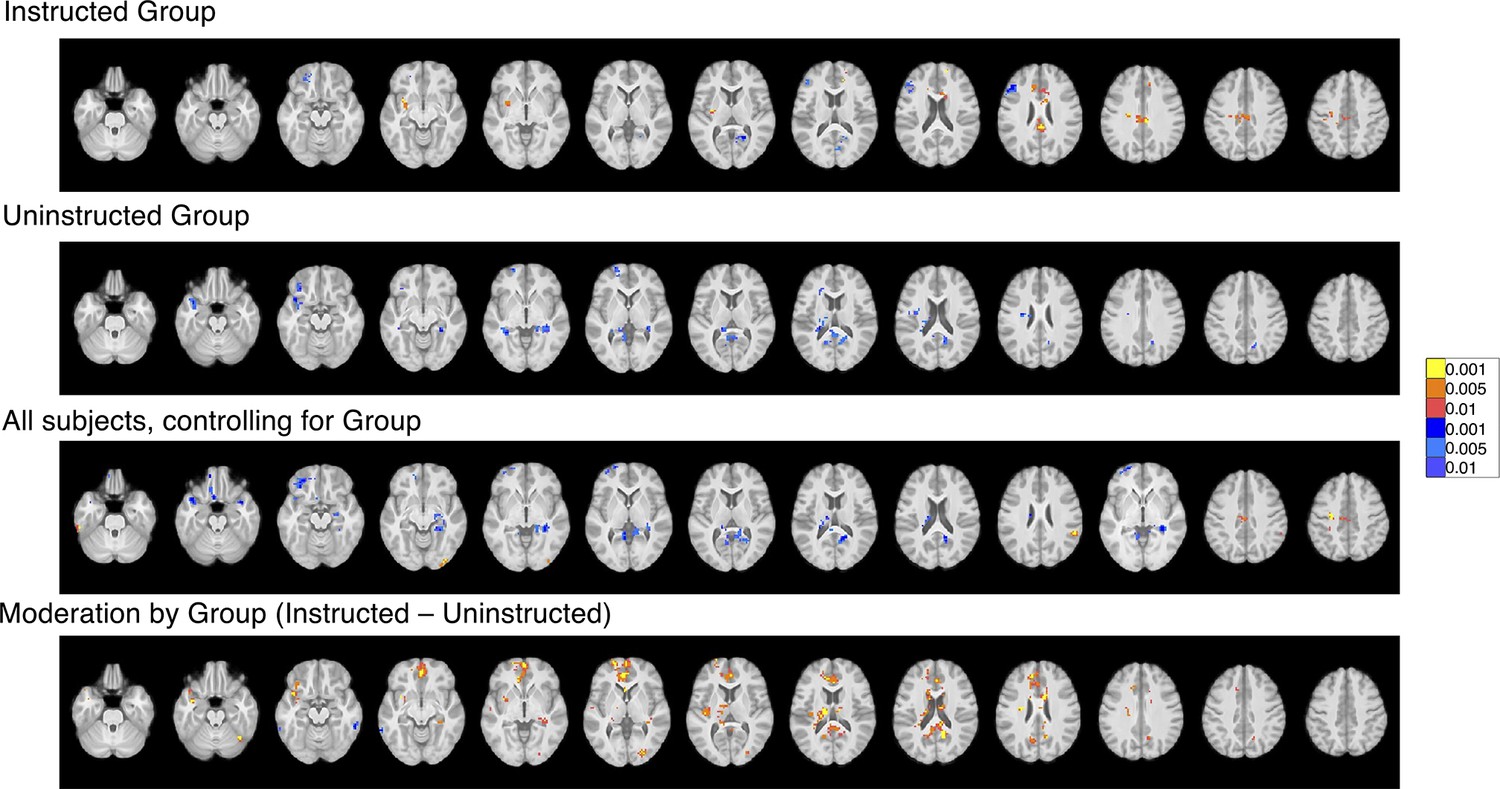
Expected value based on fit to pain ratings: Whole-brain uncorrected results.
Results are reported in Figure 8—source data 2.
Figure 8—figure supplement 4
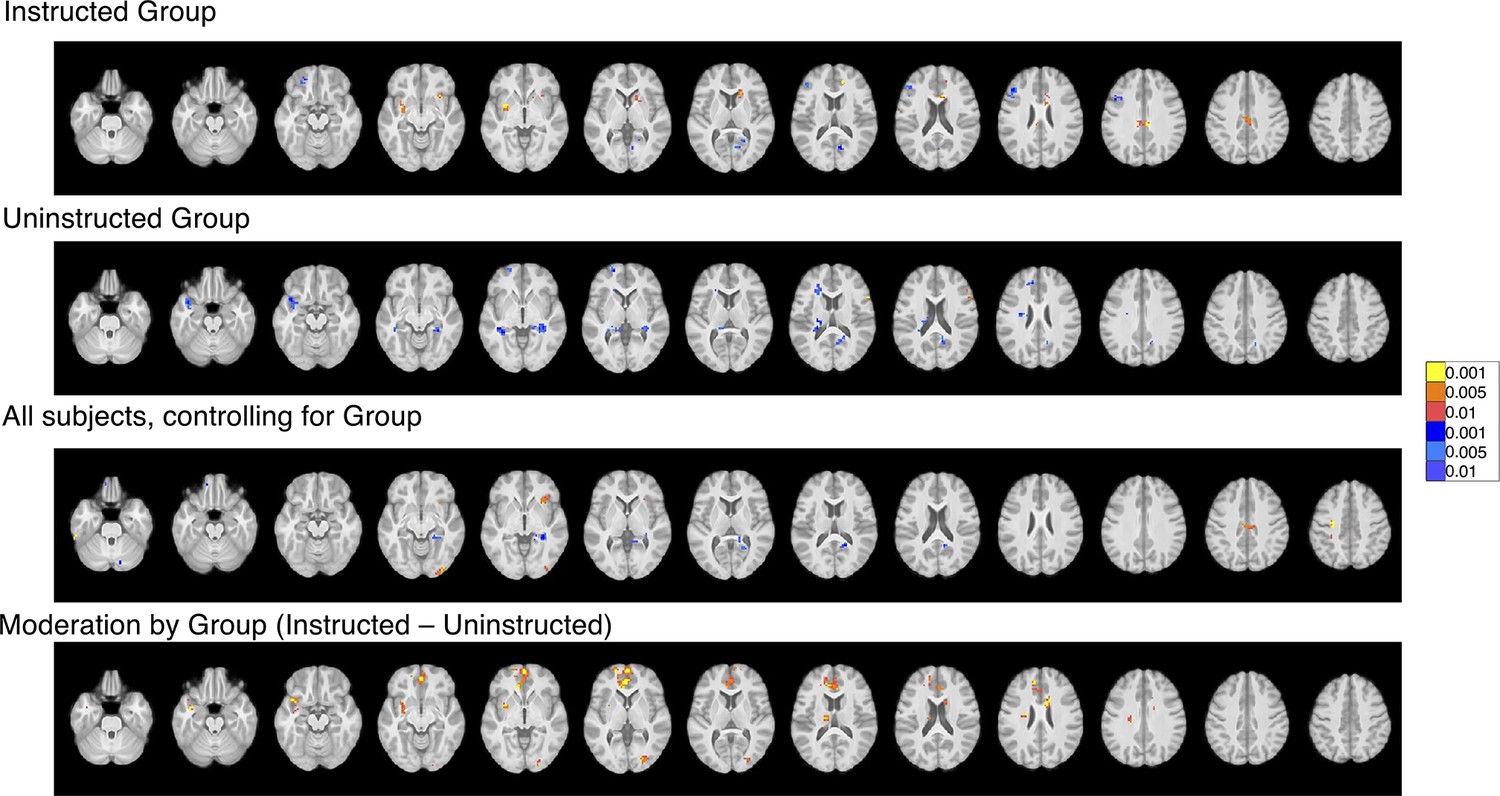
Expected value based on fit to heat-evoked SCR: Whole-brain uncorrected results.
Results are reported in Figure 8—source data 3.
Figure 8—figure supplement 5
Expected value based on fit to anticipatory SCR: Whole-brain uncorrected results.
Results are reported in Figure 8—source data 4.
Figure 8—figure supplement 6
Instructed vs Feedback driven Expected Value within Instructed Group: Whole-brain corrected results.
Associations with Uninstructed EV did not survive whole-brain FDR correction. See Figure 7 for uncorrected results. Results are reported in Figure 8—source data 5.
Figure 8—figure supplement 7
Instructed vs feedback driven expected value within instructed group: whole-brain uncorrected results.
Results are reported in Figure 8—source data 5.
Figure 8—figure supplement 8
Absolute value of prediction error on medium trials: whole-brain corrected results.
Results are reported in Figure 8—source data 6.
Figure 8—figure supplement 9
Absolute value of prediction error on medium trials: whole-brain uncorrected results.
Results are reported in Figure 8—source data 6.
Author response image 1

Mean structural (T1) image comparison – Images depict the average of all participants’ structural scans following normalization, with the initial pipeline on the left and the pipeline used for the revision, which includes nonlinear normalization, on the right.
Nonlinear warping is associated with more consistent normalization, as can be seen in better gray-white matter separation in the group mean image.
Author response image 2
Tables
Table 1
Heat intensity effects on pain across all participants (n=40)*.
| Predictors | Estimates | Confidence intervals | P-Value / probability of direction | Bayesian estimates | ||||||||
|---|---|---|---|---|---|---|---|---|---|---|---|---|
| LMER† | NLME‡ | BRMS§ | LMER† | NLME‡ | BRMS§ | LMER† | NLME‡ | BRMS§ | % in ROPE | Rhat | ESS | |
| (Intercept) | 3.64 | 3.646 | 3.641 | 3.40–3.88 | [3.408, 3.885] | [ 3.438, 3.849] | <0.001 | 0.000 | 100.00% | 0 | 1.005 | 1597.656 |
| Group | 0.11 | 0.101 | 0.112 | –0.13–0.35 | [–0.144, 0.347] | [–0.092, 0.318] | 0.356 | 0.409 | 80.83% | 82.783 | 1.001 | 1632.917 |
| Heat Level | 2.09 | 2.078 | 2.083 | 1.90–2.27 | [1.897, 2.258] | [ 1.929, 2.238] | <0.001 | 0.000 | 100.00% | 0 | 1 | 4205.817 |
| Cue | 0.32 | 0.293 | 0.323 | 0.17–0.47 | [0.148, 0.437] | [ 0.203, 0.447] | <0.001 | 0.000 | 100.00% | 12.692 | 1 | 9174.052 |
| Phase | 0.1 | 0.107 | 0.099 | 0.01–0.19 | [0.022, 0.193] | [ 0.026, 0.170] | 0.026 | 0.014 | 98.40% | 99.842 | 1.001 | 7792.54 |
| Group x Heat Level | –0.04 | –0.064 | –0.042 | –0.23–0.14 | [–0.245, 0.116] | [–0.195, 0.113] | 0.636 | 0.484 | 67.15% | 97.225 | 1.001 | 4410.973 |
| Group x Cue | 0.1 | 0.115 | 0.098 | –0.05–0.25 | [–0.029, 0.259] | [–0.025, 0.220] | 0.197 | 0.119 | 90.05% | 96.508 | 1 | 8745.241 |
| Heat Level x Cue | 0.16 | 0.128 | 0.158 | –0.03–0.35 | [–0.055, 0.311] | [ 0.002, 0.307] | 0.097 | 0.169 | 95.27% | 79.3 | 1 | 17260.576 |
| Group x Phase | 0 | –0.001 | –4.95E-04 | –0.09–0.09 | [–0.086, 0.085] | [–0.074, 0.071] | 0.999 | 0.985 | 50.43% | 100 | 1 | 8609.937 |
| Heat Level * Phase | –0.06 | –0.055 | –0.059 | –0.15–0.04 | [–0.139, 0.03] | [–0.133, 0.017] | 0.23 | 0.205 | 89.04% | 100 | 1 | 15179.351 |
| Cue * Phase | 0.58 | 0.615 | 0.575 | 0.39–0.77 | [0.424, 0.806] | [ 0.410, 0.731] | <0.001 | 0.000 | 100.00% | 0.025 | 1 | 9874.616 |
| (Group * Heat Level) * Cue | –0.04 | –0.033 | –0.036 | –0.22–0.15 | [–0.216, 0.15] | [–0.185, 0.112] | 0.709 | 0.724 | 64.35% | 98.242 | 1 | 17007.967 |
| (Group * Heat Level) * Phase | –0.03 | –0.037 | –0.029 | –0.12–0.07 | [–0.121, 0.047] | [–0.105, 0.049] | 0.546 | 0.390 | 73.22% | 100 | 1 | 14459.934 |
| (Group *Cue) * Phase | 0.23 | 0.249 | 0.231 | 0.04–0.42 | [0.058, 0.44] | [ 0.073, 0.392] | 0.017 | 0.011 | 98.79% | 52.8 | 1 | 10768.063 |
| (Heat Level *Cue) *Phase | 1.79 | 1.774 | 1.782 | 1.60–1.97 | [1.59, 1.958] | [ 1.634, 1.939] | <0.001 | 0.000 | 100.00% | 0 | 1 | 21294.817 |
| (Group *Heat Level *Cue) *Phase | –0.2 | –0.167 | –0.203 | –0.39 to –0.01 | [–0.351, 0.018] | [-0.359,–0.054] | 0.038 | 0.076 | 98.48% | 63.242 | 1 | 23048.272 |
-
*
This table presents results of linear mixed models predicting subjective pain as a function of Heat Level (High vs Medium vs Low), Group (Instructed vs Uninstructed), Cue (Original High vs Original Low), and Phase (Original vs Reversed). All predictors were dummy-coded and mean centered to facilitate interpretation of coefficients and interactions. Model specification was based on Bayesian model comparison. We compared three types of linear mixed models: frequentist analysis using the “lmer” function of lme4 (Bates et al., 2015), frequentist analysis using the “lme” function of nlme (Pinheiro et al., 2021) accounting for autoregression, and Bayesian estimation using mildly informative conservative priors (i.e. centered on 0 for all effects). Effects that are both statistically and practically significant are bolded, whereas effects that are statistically significant but not practically significant (i.e. >2.5% in the region of partial equivalence (ROPE)) are italicized.
-
†
Estimates based on a linear mixed effects model implemented in the “lmer” function of lme4 (Bates et al., 2015) using the following code: lmer(Pain~Group*Templevels*Cue*Phase+(1+Templevels + Cue*Phase||Subject)). Confidence intervals were obtained using the “tab_model” function from sjPlot (Lüdecke, 2021) and corresponds to the 95% confidence interval.
-
‡
Estimates based on a linear mixed effects model implemented in the “lme” function of nlme (Pinheiro et al., 2021) including autoregression using the following code: lme(Pain~Group*Templevels*Cue*Phase, random = ~1 + Templevels +Cue*Phase|Subject, correlation = corAR1(), na.action=na.exclude). Confidence intervals were obtained using the ‘intervals’ function from nlme (Pinheiro et al., 2021) and corresponds to the 95% confidence interval.
-
§
Estimates based on Bayesian model linear mixed models using the “brms” function (Bürkner, 2017) using the following code: brm Pain~Group*Templevels*Cue*Phase+(1+Templevels + Cue*Phase|Subject,prior = set_prior("normal(0,2.5)", class="b"), save_all_pars = TRUE, silent = TRUE, refresh = 0, iter = 4000, warmup = 1000). Posterior estimates, including the probable direction (which is roughly equivalent to 1- frequentist p-value), 89% confidence intervals, and the ROPE were obtained using the “describe_posterior” function from the package BayesTestR (Makowski et al., 2019a) and interpreted as in Makowski et al., 2019b. The Region of Partial Equivalence (ROPE) was defined as [–0.237, 0.237]. We report the median estimate for each parameter.
Table 2
Effects of heat, cues, and learning on responses in value-related regions of interest and pain-related signature patterns*.
| Analysis | Effect | Left striatum | Right striatum | Left amygdala | Right amygdala | VMPFC | NPS | SIIPS |
|---|---|---|---|---|---|---|---|---|
| Effect of heat intensity | All participants, controlling for Group | b=0.19, p<0.001 | b=0.14, p<0.001 | - | - | b=–0.27, p<0.001 | b=3.74, p<0.001 | b=439.87, p<0.001 |
| Instructed vs Uninstructed | - | - | - | - | b=0.15, p=0.048 | - | - | |
| Instructed Group | CI = [0.08 0.22], t(17) = 3.05, p=0.007 | CI = [0.14 0.25], t(17) = 5.37, p<0.001 | - | - | ns | CI = [2.39 5.49]; t(35) = 5.49; p<0.001 | CI = [197.59 572.36], t(35) = 4.33; p<0.001 | |
| Uninstructed Group | CI = [0.07 0.25], t(17) = 3.60, p=0.002 | CI = [0.12 0.28], t(17) = 5.34, p<0.001 | - | - | CI = [-0.67–0.19], t(17) = –3.81, p=0.001 | CI = [2.28 4.91]; t(17) = 5.77; p<0.001 | CI = [317.40 672.13]; t(17) = 5.89; p<0.001 | |
| Mediation of current cue contingencies | Path a | a=0.05, p=0.058 | a=0.05, p=0.079 | - | - | ns | ns | n.s. |
| Path b | b=0.13, p=0.007 | b=0.16, p<0.001 | - | - | ns | b=0.01, p=0.004 | b=0.00, p<0.001 | |
| Path a*b | - | - | - | - | ns | n.s. | n.s. | |
| Mediation of original cue contingencies | Path a | - | - | - | - | a=–0.09, p=0.015 | n.s. | n.s. |
| Path b | b=0.13, p=0.006 | b=0.16, p=0.001 | - | - | ns | b=0.01, p=0.006 | b=0.00, p<0.001 | |
| Path a*b | - | - | - | - | ns | ns | a*b=0.01, p=0.065 | |
| Association with expected value based on fits to pain | All participants, controlling for Group | - | - | - | - | - | - | - |
| Instructed vs Uninstructed | - | b=0.24, p=0.03 | - | - | - | - | - | |
| Instructed Group | CI = [0.078 0.51]; t(17) = 2.85; p=0.011 | CI = [0.03 0.42]; t(17) = 2.47; p=0.024 | - | - | - | - | - | |
| Uninstructed Group | - | - | - | - | - | - | - | |
| Association with unsigned prediction error | All participants, controlling for Group | b=1.02, p=0.003 | b=0.67, p=0.062 | b=1.61, p=0.004 | b=1.31, p=0.007 | - | - | - |
| Instructed vs Uninstructed | - | - | - | - | - | - | - | |
| Instructed Group | - | CI = [0.17 2.59]; t(17) = 2.41; p=0.028 | CI = [0.57 3.40]; t(17) = 2.96; p=0.009 | CI = [0.88 3.77]; t(17) = 3.39; p=0.004 | - | - | - | |
| Uninstructed Group | - | CI = [0.06 1.26]; t(17) = 2.33; p=0.033 | - | - | - | - | - | |
| Instructed vs feedback-driven expected value within Instructed Participants | Instruction vs Feedback-driven EV | - | - | - | - | - | - | - |
| Instruction-based EV | CI = [0.07 0.53]; t(17) = 2.73; p=0.014 | CI = [0.02 0.44]; t(17) = 2.33; p=0.03 | - | - | - | - | - | |
| Feedback-driven EV | - | - | - | - | - | - | - |
-
*
This table reports results of tests within a priori regions of interest (ROIs) involved in expected value and pain-related signature patterns, the Neurologic Pain Signature (NPS; Wager et al., 2013) and the Stimulus Intensity Independent Pain Signature (SIIPS; Woo et al., 2017). For mediation analyses, trial-level responses (i.e. area-under-the-curve estimates) were extracted and averaged across each ROI or computed as the dot-product between trial estimates and pattern expression for NPS and SIIPS, and then multilevel mediation analyses were evaluated. For regressions with heat intensity, expected value, and unsigned prediction error, we used linear models and one-sample t-tests across beta estimates and contrast maps. See Materials and Methods for additional details and Figure 5—figure supplement 1 for ROI images.
Table 3
Multilevel model evaluating effects of Group, Cue, and Trial on medium heat pain prior to reversal*.
| Predictors | Estimates | Confidence intervals | P-Value / probability of direction | Bayesian estimates† | |||||||||
|---|---|---|---|---|---|---|---|---|---|---|---|---|---|
| LMER‡ | NLME§ | BRMS† | LMER‡ | NLME§ | BRMS† | LMER‡ | NLME§ | BRMS† | % in ROPE | Rhat | ESS | ||
| All participants (n=40) | (Intercept) | 3.89 | 3.875 | 3.883 | 3.55–4.23 | [3.53, 4.221] | [ 3.598, 4.181] | <0.001 | 0.000 | 100.00% | 0 | 1 | 4860.246 |
| Group | 0.18 | 0.167 | 0.178 | –0.16–0.51 | [–0.183, 0.518] | [–0.106, 0.480] | 0.305 | 0.339 | 83.67% | 45.258 | 1 | 5043.495 | |
| Cue | 1.27 | 1.254 | 1.261 | 0.89–1.66 | [0.857, 1.651] | [ 0.939, 1.568] | <0.001 | 0.000 | 100.00% | 0 | 1 | 11882.091 | |
| Trial | 0.11 | 0.107 | 0.11 | 0.02–0.21 | [0.011, 0.202] | [ 0.031, 0.190] | 0.023 | 0.029 | 98.39% | 88.483 | 1 | 13555.299 | |
| Group * Cue | 0.44 | 0.425 | 0.442 | 0.06–0.83 | [0.028, 0.823] | [ 0.116, 0.758] | 0.024 | 0.036 | 98.45% | 8.892 | 1 | 12094.57 | |
| Group * Trial | 0.14 | 0.133 | 0.135 | 0.04–0.23 | [0.035, 0.231] | [ 0.049, 0.213] | 0.007 | 0.008 | 99.52% | 75.492 | 1 | 13395.889 | |
| Cue * Trial | 0.14 | 0.132 | 0.142 | –0.01–0.30 | [–0.032, 0.296] | [ 0.005, 0.274] | 0.071 | 0.114 | 95.07% | 62.758 | 1 | 14333.687 | |
| (Group *Cue) *Trial | 0.2 | 0.186 | 0.201 | 0.04–0.37 | [0.016, 0.357] | [ 0.060, 0.343] | 0.016 | 0.033 | 98.70% | 35.45 | 1 | 16585.744 | |
| Instructed Group (n=20) | (Intercept) | 4.07 | 4.034 | 4.076 | 3.63–4.51 | [3.594, 4.475] | [3.691, 4.455] | <0.001 | 0 | 100.00% | 0 | 1 | 4421.861 |
| Cue | 1.73 | 1.694 | 1.724 | 1.14–2.32 | [1.088, 2.3] | [1.204, 2.218] | <0.001 | 0 | 100.00% | 0 | 1 | 7914.074 | |
| Trial | 0.26 | 0.252 | 0.26 | 0.08–0.44 | [0.073, 0.43] | [0.106, 0.422] | 0.005 | 0.0063 | 99.28% | 17.733 | 1 | 6993.832 | |
| Cue * Trial | 0.35 | 0.294 | 0.361 | 0.04–0.66 | [–0.031, 0.618] | [0.088, 0.631] | 0.027 | 0.0755 | 97.65% | 13.558 | 1 | 7952.078 | |
| Uninstructed Group (n=20) | (Intercept) | 3.74 | 3.737 | 3.741 | 3.22–4.25 | [3.215, 4.259] | [ 3.261, 4.185] | <0.001 | 0 | 100.00% | 0 | 1.001 | 3062.443 |
| Cue | 0.89 | 0.885 | 0.874 | 0.40–1.38 | [0.378, 1.392] | [ 0.450, 1.262] | <0.001 | 0.0008 | 99.88% | 0.55 | 1.001 | 9645.377 | |
| Trial | 0 | –0.005 | –0.005 | –0.11–0.10 | [–0.113, 0.103] | [–0.095, 0.087] | 0.928 | 0.9333 | 53.46% | 99.433 | 1 | 8985.322 | |
| Cue * Trial | –0.03 | –0.035 | –0.035 | –0.20–0.14 | [–0.211, 0.142] | [–0.184, 0.112] | 0.704 | 0.6975 | 65.33% | 90.7 | 1 | 12054.973 | |
-
*
This table presents results of a linear mixed model predicting subjective pain on medium heat trials as a function of Group (Instructed vs Uninstructed), Cue (Original High vs Original Low), and Trial prior to the first reversal, as well as post-hoc tests in each Group. See Table 1 for additional information about model specification and presentation.
-
†
Estimates based on Bayesian model linear mixed models using the ‘brms’ function (Bürkner, 2017) using the following code: brmPain~Group*Cue*Trial+(1+Cue*Trial|Subject,prior = set_prior("normal(0,2.5)", class="b"), save_all_pars = TRUE, silent = TRUE, refresh = 0, iter = 4000,, warmup = 1000). Posterior estimates and the Region of Partial Equivalence were obtained using the “describe_posterior” function from the package BayesTestR (Makowski et al., 2019a) and interpreted as in Makowski et al., 2019b. The Region of Partial Equivalence (ROPE) was defined as [–0.17, 0.17] across all participants, [–.172,.172] when restricted to the Instructed Group, and [–.168,.168] when restricted to the Uninstructed Group.
-
‡
Estimates based on a linear mixed effects model implemented in the ‘lmer’ function of lme4 (Bates et al., 2015) using the following code: lmer(PainMedium~Group*Cue*Trial+(1+Cue*Trial||Subject)).
-
§
Estimates based on a linear mixed effects model implemented in the ‘lme’ function of nlme (Pinheiro et al., 2021) including autoregression using the following code: lme(Pain~Group *Cue*Trial, random = ~1 + Cue*Trial|Subject, correlation = corAR1, na.action=na.exclude).
Table 4
Multilevel model evaluating effects of Group, Cue, and Phase on medium heat pain across the entire task*.
| Predictors | Estimates | Confidence intervals | P-Value / probability of direction | Bayesian estimates† | |||||||||
|---|---|---|---|---|---|---|---|---|---|---|---|---|---|
| LMER‡ | NLME§ | BRMS† | LMER‡ | NLME§ | BRMS† | LMER‡ | NLME§ | BRMS† | % in ROPE | Rhat | ESS | ||
| All participants (n=40) | (Intercept) | 3.63 | 3.624 | 3.621 | 3.31–3.95 | [3.301, 3.948] | [ 3.342, 3.889] | <0.001 | 0.000 | 100.00% | 0 | 1.001 | 2237.328 |
| Group | 0.11 | 0.100 | 0.103 | –0.22–0.43 | [–0.233, 0.433] | [–0.162, 0.379] | 0.52 | 0.546 | 73.12% | 62.4 | 1.002 | 2181.022 | |
| Cue | 0.29 | 0.286 | 0.287 | 0.14–0.44 | [0.146, 0.426] | [ 0.160, 0.413] | <0.001 | 0.000 | 100.00% | 8.425 | 1 | 17294.743 | |
| Phase | 0.1 | 0.100 | 0.104 | 0.00–0.20 | [0.001, 0.198] | [ 0.015, 0.183] | 0.046 | 0.047 | 97.38% | 91.908 | 1 | 10287.406 | |
| Group * Cue | 0.06 | 0.095 | 0.065 | –0.09–0.21 | [–0.045, 0.235] | [–0.062,, 0.189] | 0.401 | 0.182 | 79.30% | 92.3 | 1 | 17827.085 | |
| Group * Phase | –0.01 | –0.002 | –0.005 | –0.11–0.09 | [–0.1, 0.097] | [–0.087, 0.079] | 0.907 | 0.974 | 54.11% | 99.925 | 1 | 10239.068 | |
| Cue * Phase | 0.58 | 0.643 | 0.582 | 0.38–0.78 | [0.443, 0.843] | [ 0.415, 0.740] | <0.001 | 0.000 | 100.00% | 0.042 | 1 | 11512.539 | |
| (Group * Cue) * Phase | 0.24 | 0.248 | 0.241 | 0.04–0.44 | [0.048, 0.447] | [ 0.077, 0.400] | 0.018 | 0.015 | 98.97% | 25.2 | 1 | 10802.199 | |
| Instructed Group (n=20) | (Intercept) | 3.74 | 3.732 | 3.731 | 3.32–4.16 | [3.313, 4.15] | [ 3.363, 4.107] | <0.001 | 0.000 | 100.00% | 0 | 1.001 | 1614.785 |
| Cue | 0.36 | 0.386 | 0.353 | 0.14–0.58 | [0.182, 0.59] | [ 0.156, 0.530] | 0.001 | 0.000 | 99.83% | 5.775 | 1 | 13912.092 | |
| Phase | 0.1 | 0.100 | 0.098 | –0.02–0.22 | [–0.03, 0.23] | [–0.003, 0.194] | 0.105 | 0.133 | 94.46% | 88.158 | 1 | 12203.321 | |
| Cue * Phase | 0.84 | 0.904 | 0.836 | 0.52–1.17 | [0.58, 1.227] | [ 0.559, 1.112] | <0.001 | 0.000 | 99.99% | 0.05 | 1 | 9283.385 | |
| Uninstructed Group (n=20) | (Intercept) | 3.53 | 3.531 | 3.526 | 3.04–4.02 | [3.04, 4.022] | [ 3.098, 3.955] | <0.001 | 0.000 | 100.00% | 0 | 1.001 | 2390.769 |
| Cue | 0.23 | 0.194 | 0.228 | 0.01–0.44 | [–0.004, 0.391] | [ 0.058, 0.411] | 0.037 | 0.054 | 98.09% | 33.975 | 1 | 19966.344 | |
| Phase | 0.11 | 0.099 | 0.107 | –0.05–0.27 | [–0.05, 0.248] | [–0.025, 0.245] | 0.19 | 0.192 | 90.18% | 81.167 | 1 | 9498.139 | |
| Cue * Phase | 0.35 | 0.411 | 0.354 | 0.11–0.60 | [0.169, 0.653] | [ 0.158, 0.555] | 0.004 | 0.001 | 99.58% | 8.133 | 1 | 12670.552 | |
-
*
This table presents results of a linear mixed model predicting subjective pain on medium heat trials as a function of Group (Instructed vs Uninstructed), Cue (Original High vs Original Low), and Phase (Original vs Reversed) across all participants, as well as post-hoc tests in each Group. See Table 1 for additional information about model specification and presentation.
-
†
Estimates based on Bayesian model linear mixed models using the ‘brms’ function (Bürkner, 2017) using the following code: brmPain~Group *Cue*Phase+(1+Cue*Phase|Subject,prior = set_prior("normal(0,2.5)", class="b"), save_all_pars = TRUE, silent = TRUE, refresh = 0, iter = 4000,, warmup = 1000). Posterior estimates and the Region of Partial Equivalence were obtained using the “describe_posterior” function from the package BayesTestR (Makowski et al., 2019a) and interpreted as in Makowski et al., 2019b. The Region of Partial Equivalence (ROPE) was defined as [–0.176, 0.176] across all participants, [–.170,.170] when restricted to the Instructed Group, and [–.181,.181] when restricted to the Uninstructed Group.
-
‡
Estimates based on a linear mixed effects model implemented in the ‘lmer’ function of lme4 (Bates et al., 2015) using the following code: lmer(PainMedium~Group*Cue*Phase+(1+Cue*Phase|Subject)).
-
§
Estimates based on a linear mixed effects model implemented in the ‘lme’ function of nlme (Pinheiro et al., 2021) including autoregression using the following code: lme(Pain~Group *Cue*Phase, random = ~1 + Cue*Phase|Subject, correlation = corAR1(), na.action=na.exclude).
Author response table 1
| Contrast | Region | x | y | z | voxels | Volume (mm3) |
|---|---|---|---|---|---|---|
| Positive association with anticipatory SCR | R Caudate Nucleus (Nucleus Accumbens) | 10 | 10 | -8 | 6 | 162 |
| Negative association with anticipatory SCR | R Superior Temporal Gyrus (Area TE 3) | 62 | -10 | -4 | 104 | 2808 |
| L operculum | -56 | 14 | -2 | 32 | 864 | |
| R Middle Occipital Gyrus (Area hOc4la) | 46 | -74 | 4 | 83 | 2241 | |
| L Superior Temporal Gyrus (Area TE 3) | -62 | -32 | 16 | 200 | 5400 | |
| L Insula Lobe (Area Ig2) | -38 | -20 | 14 | 33 | 891 | |
| R Superior Temporal Gyrus | 50 | -40 | 14 | 25 | 675 | |
| L Postcentral Gyrus (Area 3b) | -44 | -16 | 46 | 44 | 1188 | |
| L dACC | -8 | -4 | 44 | 19 | 513 | |
| R Postcentral Gyrus (Area 4p) | 34 | -28 | 46 | 15 | 405 | |
| L Posterior-Medial Frontal | -2 | -8 | 68 | 38 | 1026 |
Author response table 2
| N | LM mean (SD) | HM mean (SD) | HM-LM mean (SD) | HM & LM correlation | Standardized effect size (cohen’s dz) | Repeated measures effect size (drepeated measures, pooled) | Required sample size | |
|---|---|---|---|---|---|---|---|---|
| All participants | 12 | 3.05 (1.17) | 3.62 (1.23) | 0.57 (0.36) | 0.91 | 1.57 | 1.60 | 6 for 80% power;8 for 95% power |
| Instructed Group | 6 | 3.21 (0.79) | 3.87 (0.66) | 0.66 (0.45) | 0.82 | 1.47 | 1.52 | 6 for 80% power;9 for 95% power |
| Uninstructed Group | 6 | 2.88 (1.53) | 3.37 (1.65) | 0.48 (0.26) | 0.99 | 1.83 | 2.07 | 5 for 80% power;7 for 95% power |
Additional files
-
Supplementary file 1
Heat intensity effects on pain in fMRI participants (n = 36).
- https://cdn.elifesciences.org/articles/73353/elife-73353-supp1-v2.docx
-
Supplementary file 2
Bayesian multilevel model evaluating effects of Group, Cue, Phase, and Trial on medium heat pain using Beta family.
- https://cdn.elifesciences.org/articles/73353/elife-73353-supp2-v2.docx
-
Transparent reporting form
- https://cdn.elifesciences.org/articles/73353/elife-73353-transrepform1-v2.docx
Download links
A two-part list of links to download the article, or parts of the article, in various formats.
Downloads (link to download the article as PDF)
Open citations (links to open the citations from this article in various online reference manager services)
Cite this article (links to download the citations from this article in formats compatible with various reference manager tools)
Instructions and experiential learning have similar impacts on pain and pain-related brain responses but produce dissociations in value-based reversal learning
eLife 11:e73353.
https://doi.org/10.7554/eLife.73353


