Predictive modeling reveals that higher-order cooperativity drives transcriptional repression in a synthetic developmental enhancer
- Chan Zuckerberg Biohub, United States
- Department of Chemical Biology, University of California, Berkeley, United States
- Department of Physics, University of California, Berkeley, United States
- Department of Biology, Ecole Polytechnique, France
- Biophysics Graduate Group, University of California, Berkeley, United States
- Department of Biology, New York University, United States
- Department of Molecular and Cell Biology, University of California, Berkeley, United States
- Institute for Quantitative Biosciences–QB3, University of California at Berkeley, United States
Figures
Figure 1

Building up predictive models of transcriptional repression.
(A) In the absence of repressor binding, gene expression can be characterized by a dissociation constant between RNAP and the promoter and the rate of transcription initiation when the promoter is bound by RNAP . (B) In the presence of a single repressor binding site, models need to account for two additional parameters describing the repressor dissociation constant and a repressor-RNAP interaction term . (C) For two-repressor architectures, parameters accounting for repressor-repressor interactions and for interactions giving rise to a repressor-repressor-RNAP complex could also have to be incorporated. (D) For the case of three repressor binding sites, additional parameters and capturing the higher-order cooperativity between three repressor molecules and between three Runt molecules and RNAP, respectively, could be necessary. Note the nomenclature shown below each construct, which indicates which Runt binding sites are present in each construct.
Figure 2 with 2 supplements
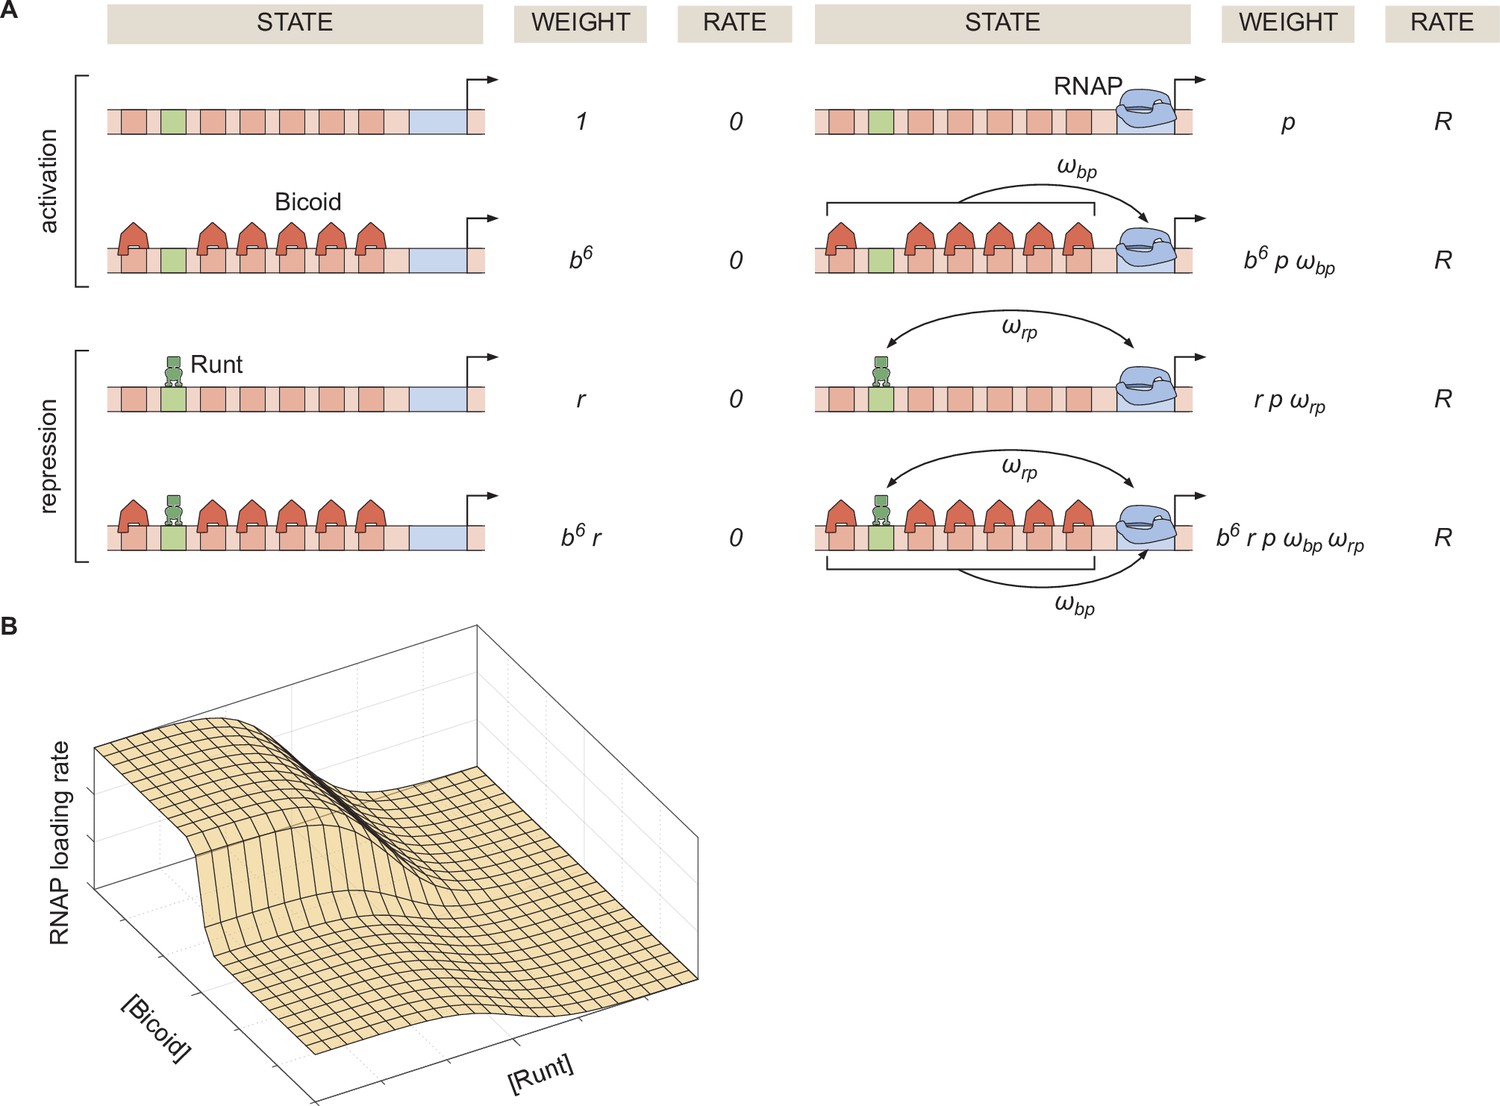
Thermodynamic model of transcriptional regulation by Bicoid activator and Runt repressor.
(A) States and statistical weights for the regulation of hunchback P2 with one Runt binding site in the limit of strong Bicoid-Bicoid cooperativity. Here, we use the dimensionless parameters , , and , where , , and are the dissociation constants of Bicoid, Runt, and RNAP, respectively. represents the cooperativity between Bicoid and RNAP, captures the cooperativity between Runt and RNAP, and represents the rate of transcription when the promoter is occupied by RNAP. The top two rows correspond to states where only Bicoid and RNAP act, while the bottom two rows represent repression by Runt. (B) Representative prediction of RNAP loading rate as a function of Bicoid and Runt concentrations for .
Figure 2—figure supplement 1
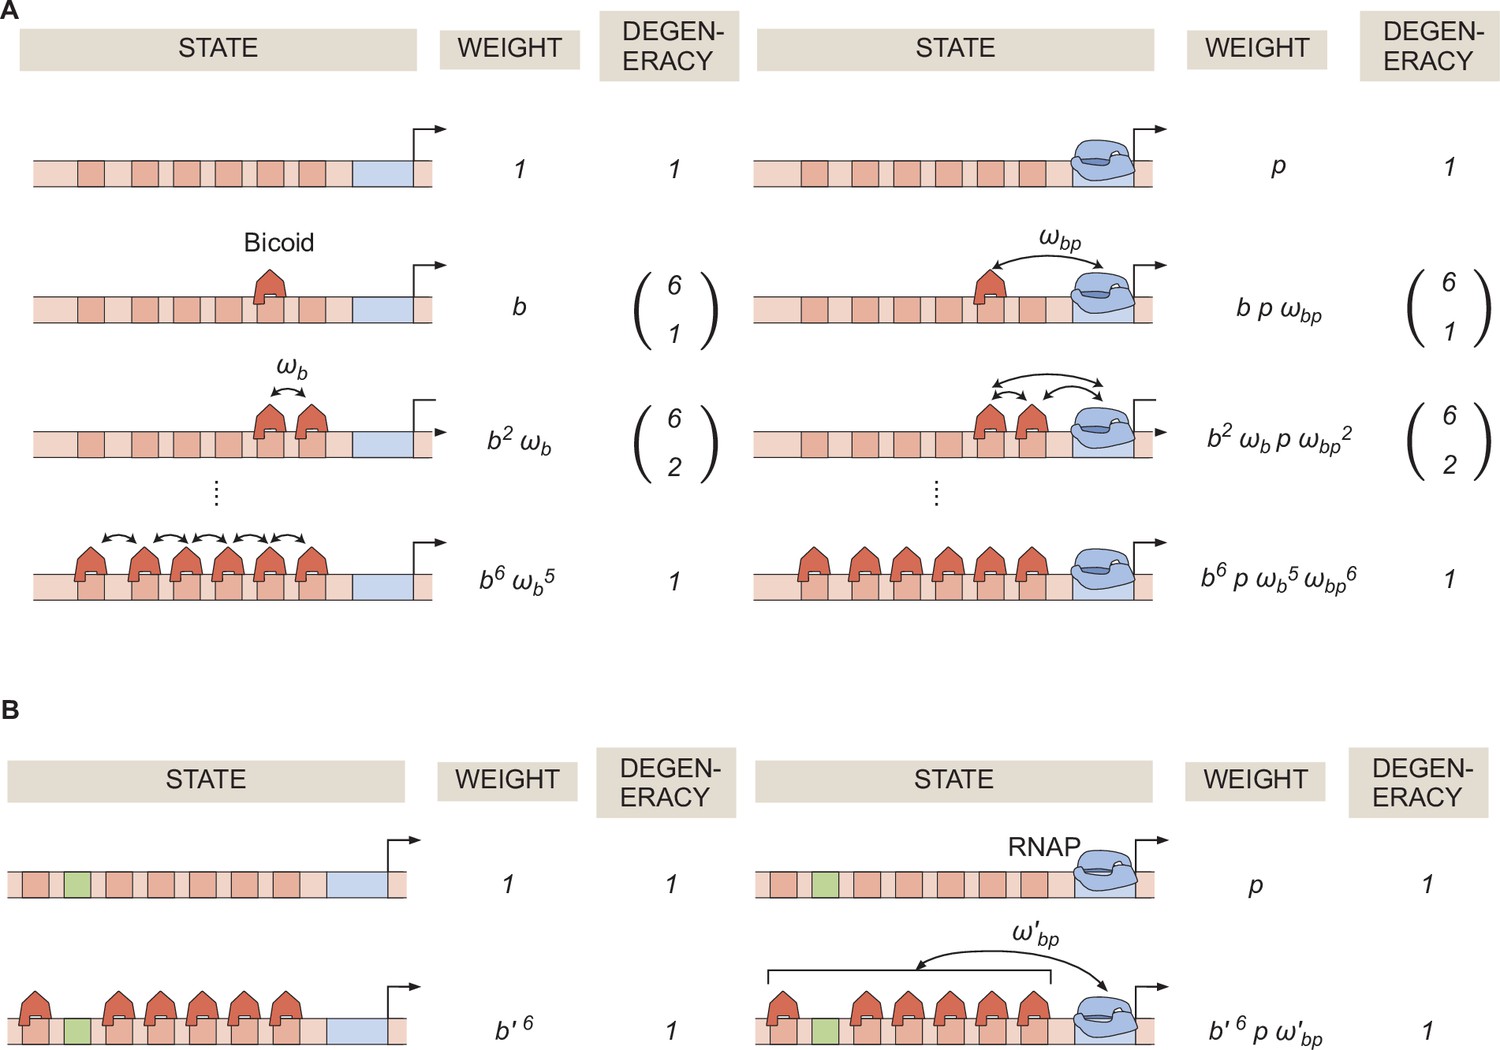
General thermodynamic model for a hunchback P2 enhancer with six Bicoid binding sites.
(A) States, weights, and degeneracy considered for our thermodynamic model. (B) Simpler form of the thermodynamic model in the limit of .
Figure 2—figure supplement 2
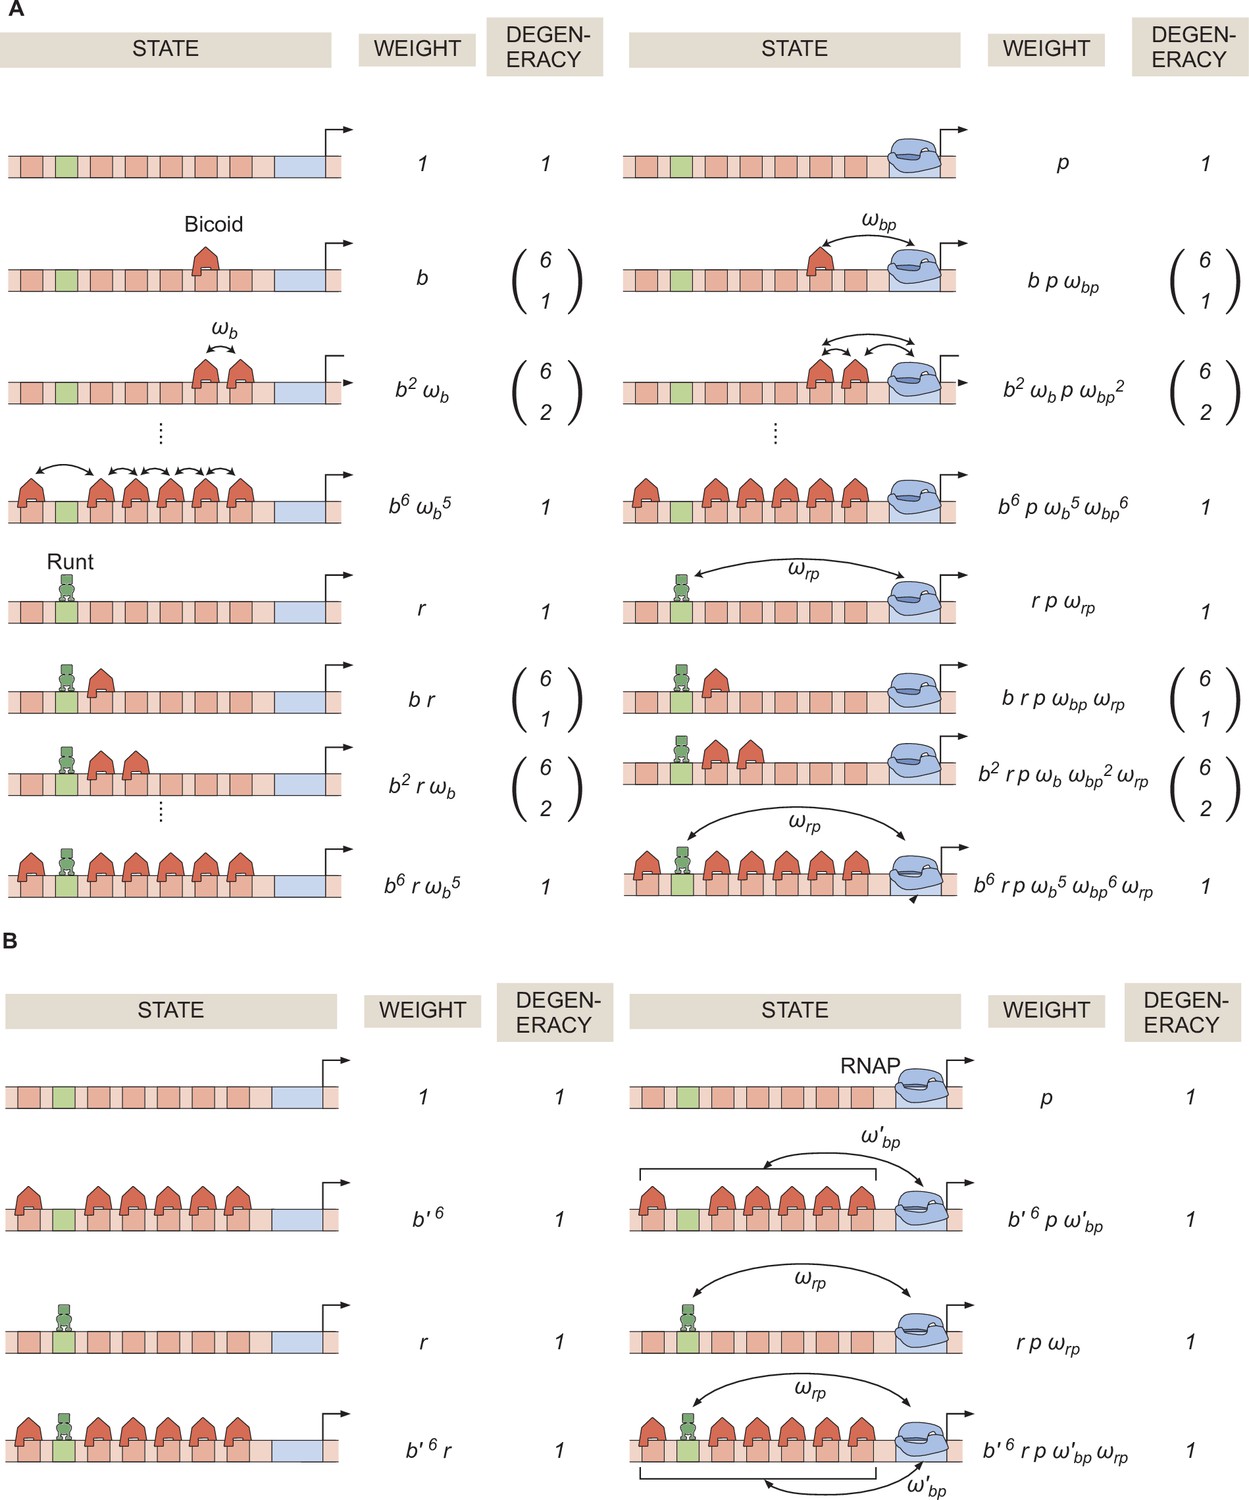
General thermodynamic model for an enhancer with six-Bicoid binding sites and one Runt binding site.
(A) Statistical weights and degeneracy of each state the system can be found in. (B) Simpler form of the model from (A) in the limit of strong Bicoid-Bicoid cooperativity.
Figure 3 with 11 supplements
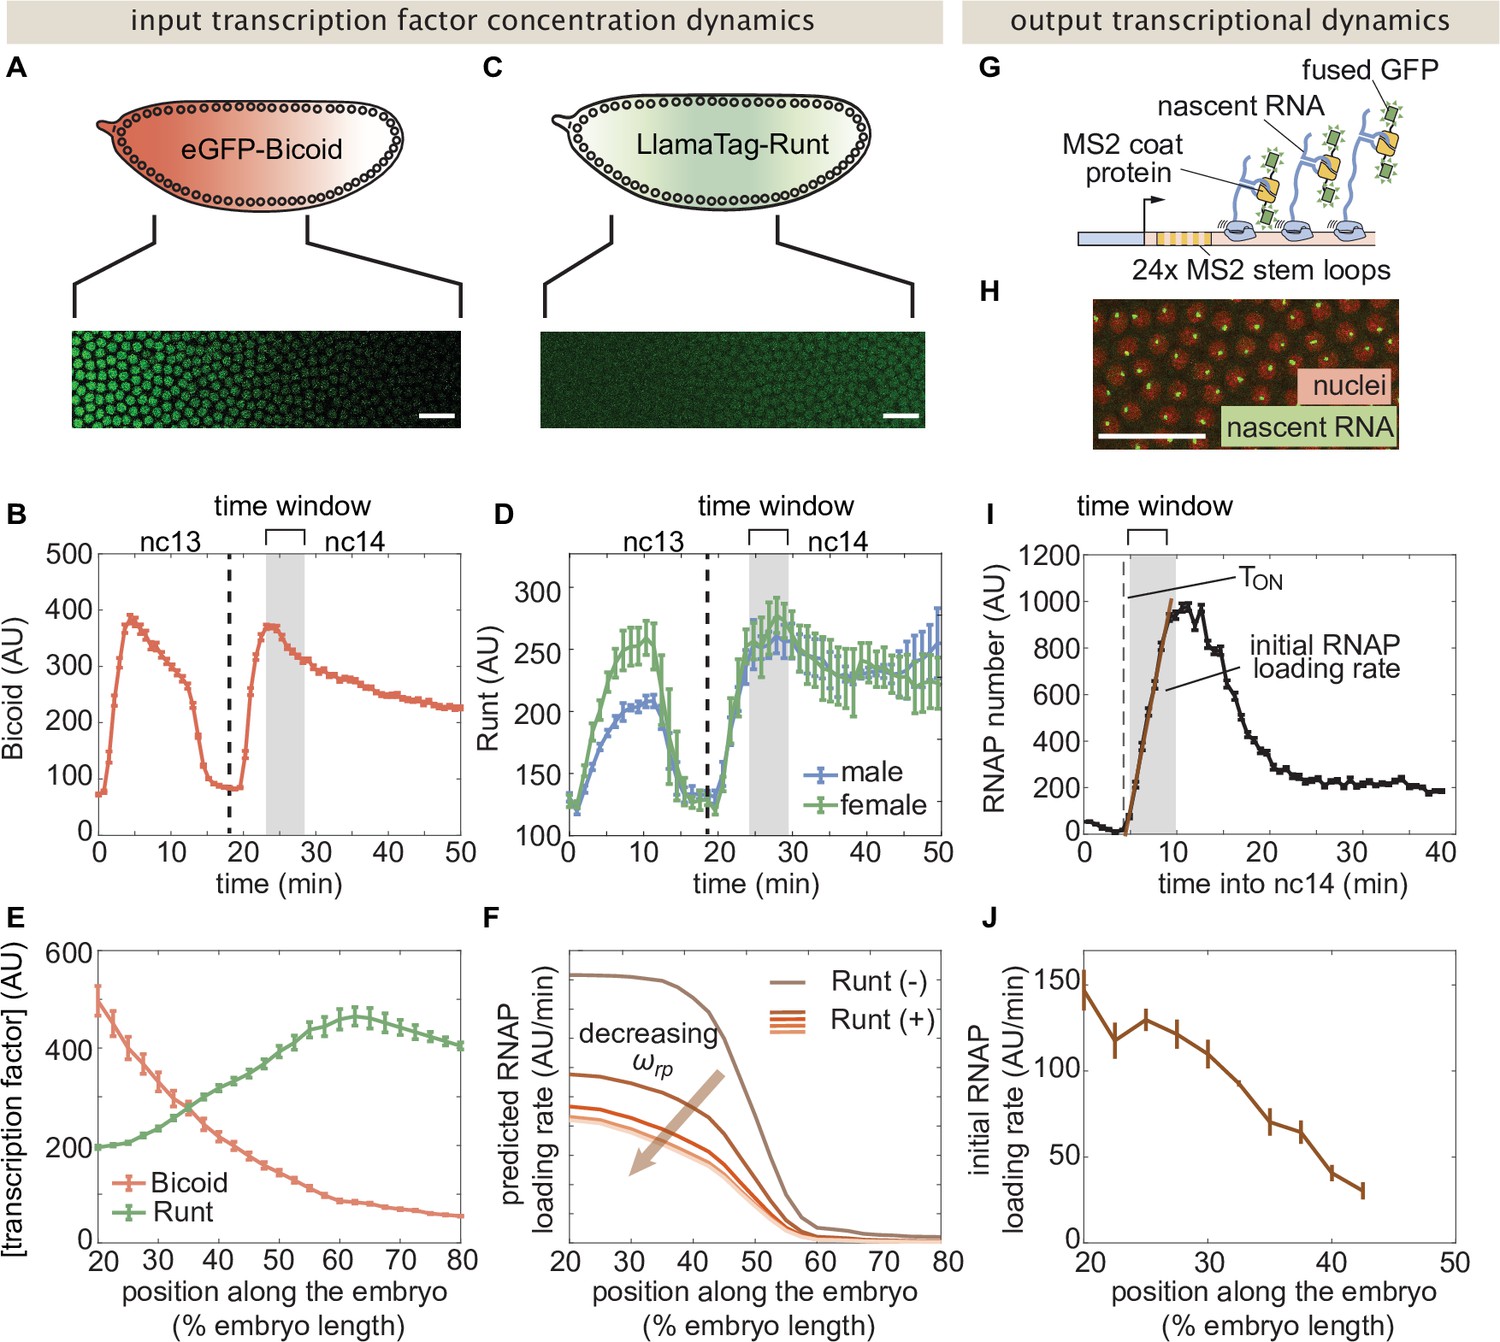
Measurement of input transcription factor concentrations and output rate of transcription to test model predictions.
(A) Snapshot of an embryo expressing eGFP-Bicoid spanning 20–60% of the embryo length. (For a full time-lapse movie, see Movie Figure 3—video 1) (B) Bicoid nuclear fluorescence dynamics taken at 40% of the embryo. (C) Snapshot of an embryo expressing eGFP:LlamaTag-Runt spanning 20–60% of the embryo length. (For a full time-lapse movie, see Movie Figure 3—video 2) (D) Runt nuclear concentration dynamics in males and females. (E) Measured transcription factor concentration profiles along the anterior-posterior axis of the embryo. The concentration profiles are averaged over the gray shaded regions shown in (B) and (D) which corresponds to a time window between 5 and 10min into nc14. (F) Predicted RNAP loading rate for hunchback P2 with one Runt binding site over the anterior-posterior axis generated for a reasonable set of model parameters AU, AU, , , and AU/min for varying values of the Runt-RNAP interaction term . (G) Schematic of the MS2 system where 24 repeats of the MS2 loop sequence are inserted downstream of the promoter followed by the lacZ gene. The MS2 coat protein (MCP) fused to GFP binds the MS2 loops. (H) Example snapshot of an embryo expressing MCP-GFP and Histone-RFP. Green spots correspond to active transcriptional loci and red circles correspond to nuclei. Spot intensities are proportional to the number of actively transcribing RNAP molecules. (I) Representative MS2 fluorescence averaged over a narrow window (2.5% of the embryo length) along the anterior-posterior axis of the embryo. The initial rate of RNAP loading was obtained by fitting a line (brown) to the initial rise of the data and the x-intercept is defined as the onset of transcription (). (J) Measured initial rate of RNAP loading (over a spatial bin of 2.5% of the embryo length) across the anterior-posterior axis of the embryo, from the hunchback P2 enhancer. (B, D, E, and J, error bars represent standard error of the mean over embryos; I, error bars represent standard error of the mean over the spatial averaging corresponding to roughly ten nuclei; A, C, and H, white scale bars represent 20 μm.).
Figure 3—figure supplement 1
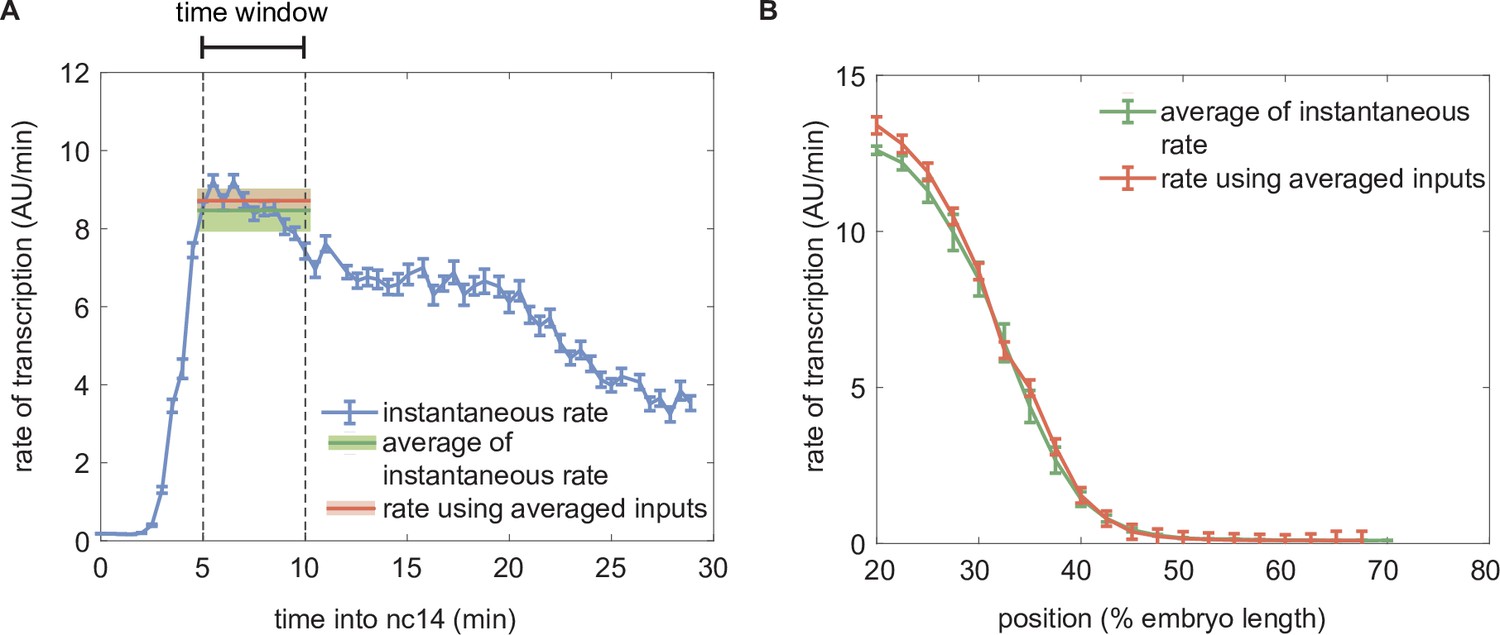
Comparison of the predicted rate of transcription using dynamic and time-averaged transcription factor concentration profiles as inputs.
(A) Instantaneous predicted rate of transcription calculated using dynamic transcription factor concentration profiles at each time point (blue) and resulting averaged rate of transcription averaged over the time window of 5–10 minutes from the 13th anaphase (green) compared to the predicted rate of transcription obtained using the static transcription factor concentrations of Bicoid and Runt shown in Figure 3E (red). (Illustrative predictions calculated at 30% of the embryo length using , , , , , .) (B) Spatial profile of the predicted rate of transcription calculated by averaging the instantaneous transcription rate (green) or by using the averaged input transcription factor concentrations as inputs (red). (A, B, error bars and shaded areas represent the standard error of mean over embryos 42 embryos generated from making pairs of independently measured six eGFP-Bicoid embryo and seven GreenLlamaTag-Runt embryo.).
Figure 3—figure supplement 2
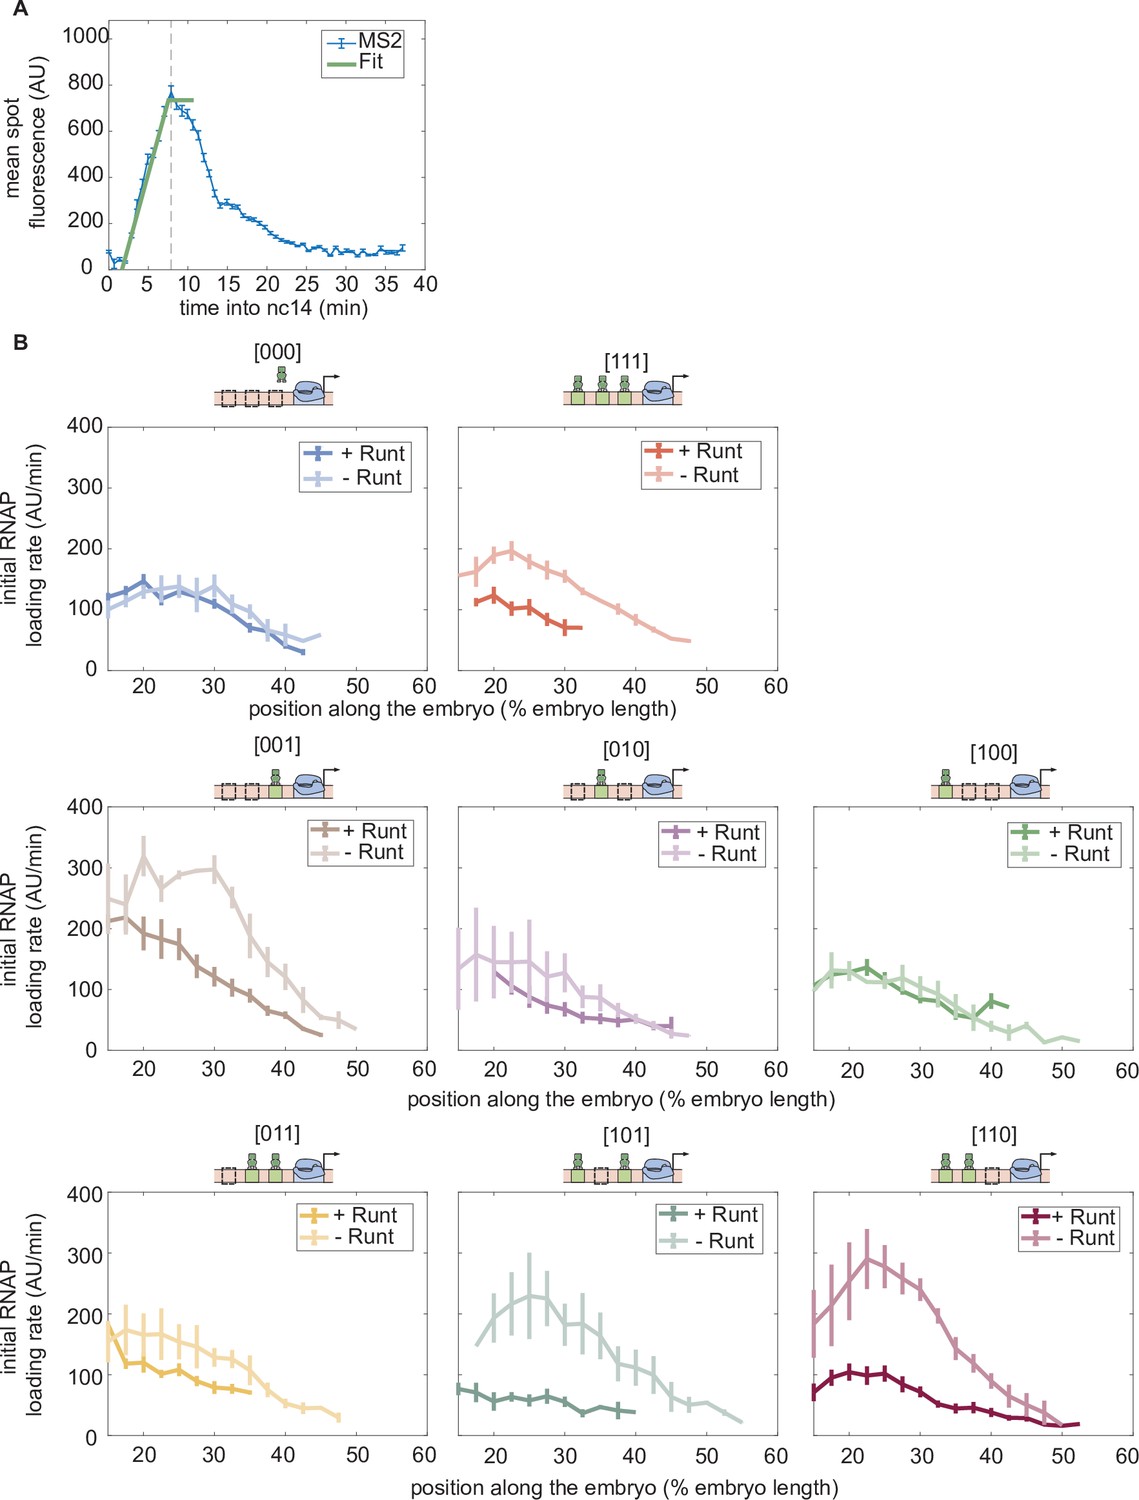
Initial rate of RNAP loading in nuclear cycle 14 across the anterior-posterior axis for different constructs, with or without Runt protein.
(A) Schematic showing how the initial rate of RNAP loading is measured by extracting the slope resulting from a linear fit to the MS2 time traces at the beginning of nuclear cycle 14. (B) Initial rate of RNAP loading along the embryo length for each construct in the presence and absence of Runt for each of our synthetic enhancer construct. (B, Error bars represent standard error of the mean over embryos.).
Figure 3—figure supplement 3
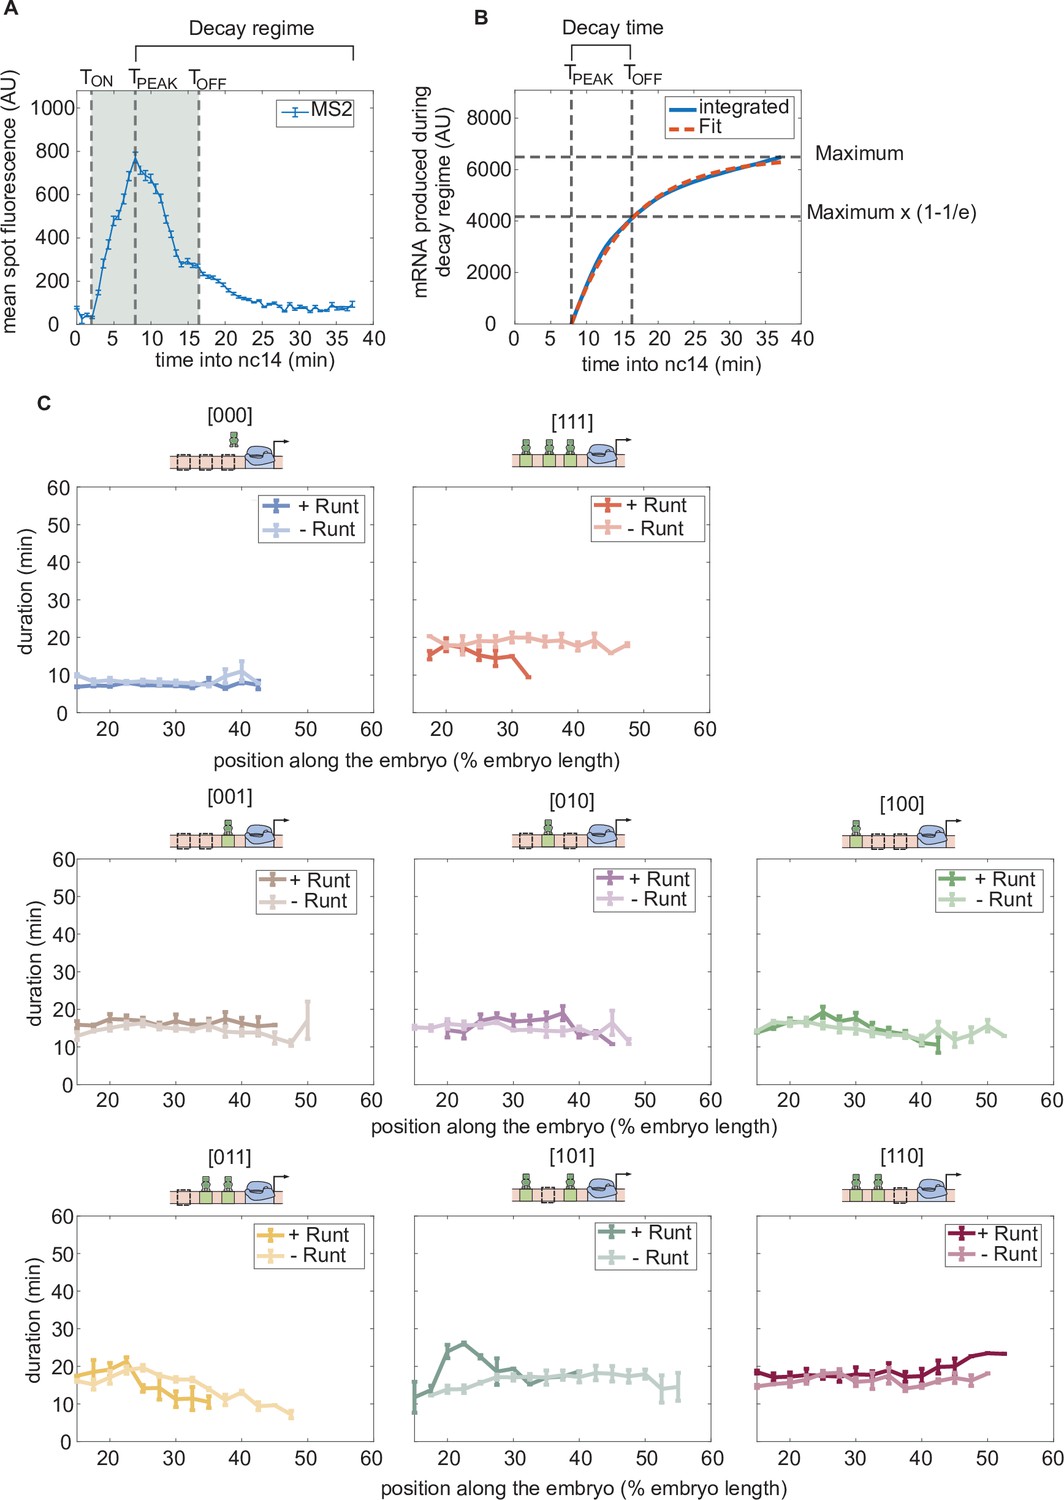
Duration of transcription over nuclear cycle 14.
(A) An example MS2 time trace in nuclear cycle 14. The decay regime is defined from the peak of the signal to the end of the measurement. is defined by the x-intercept of the slope of the fitted line. is determined by the decay time in the exponential function. The gray shaded region from to is defined as the transcriptional time window. (B) The decay time can be extracted from the accummulated mRNA signal obtained by integrating the MS2 fluorescence. Here, decay time is defined as the time it takes to reach (1–1/e) of that maximum accumulated mRNA. (C) Transcriptional time window along the anterior-posterior axis for each construct with and without Runt protein. (A, error bars represent standard error of the mean over the spatial averaging corresponding to roughly ten nuclei; C, error bars represent standard error of the mean over embryos.).
Figure 3—figure supplement 4
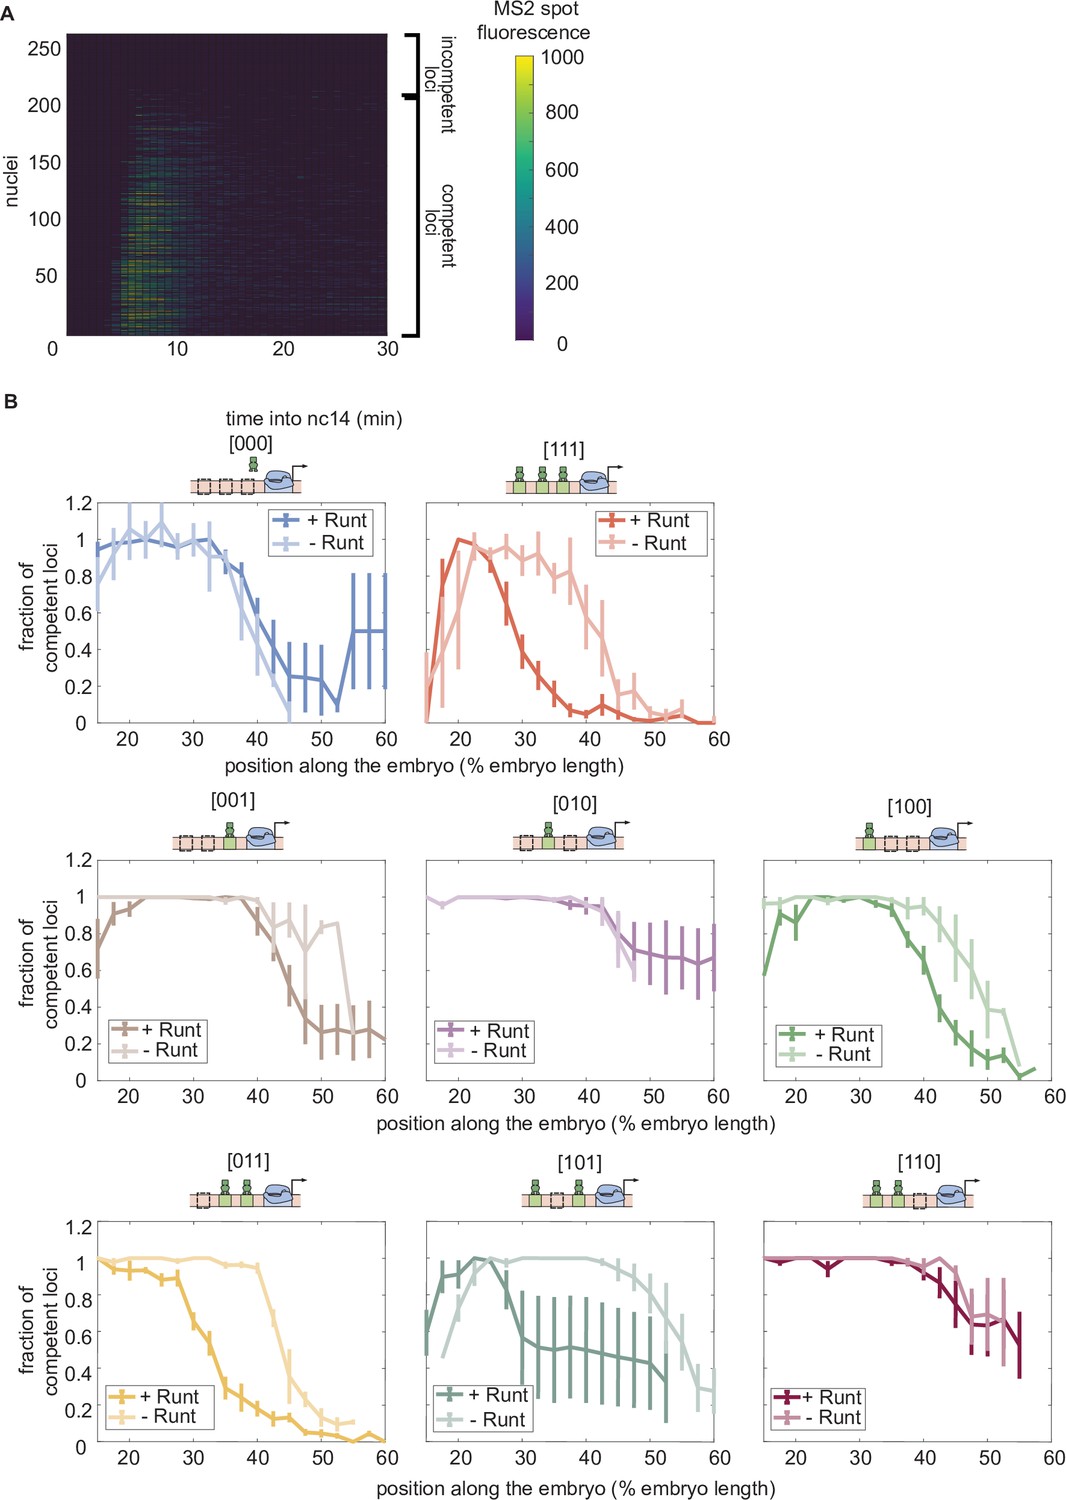
Fraction of competent loci in nuclear cycle 14 along the anterior-posterior axis for each synthetic enhancer construct in the presence and absence of Runt protein.
(A) Heatmap showing the transcriptional signal from the hunchback P2 enhancer for individual nuclei (rows) demonstrating that there are two populations of loci: transcriptionally active and inactive loci. (B) Fraction of transcriptionally active loci along the embryo for each construct for wild-type and runt null backgrounds. (B, error bars represent standard error of the mean over embryos.).
Figure 3—figure supplement 5
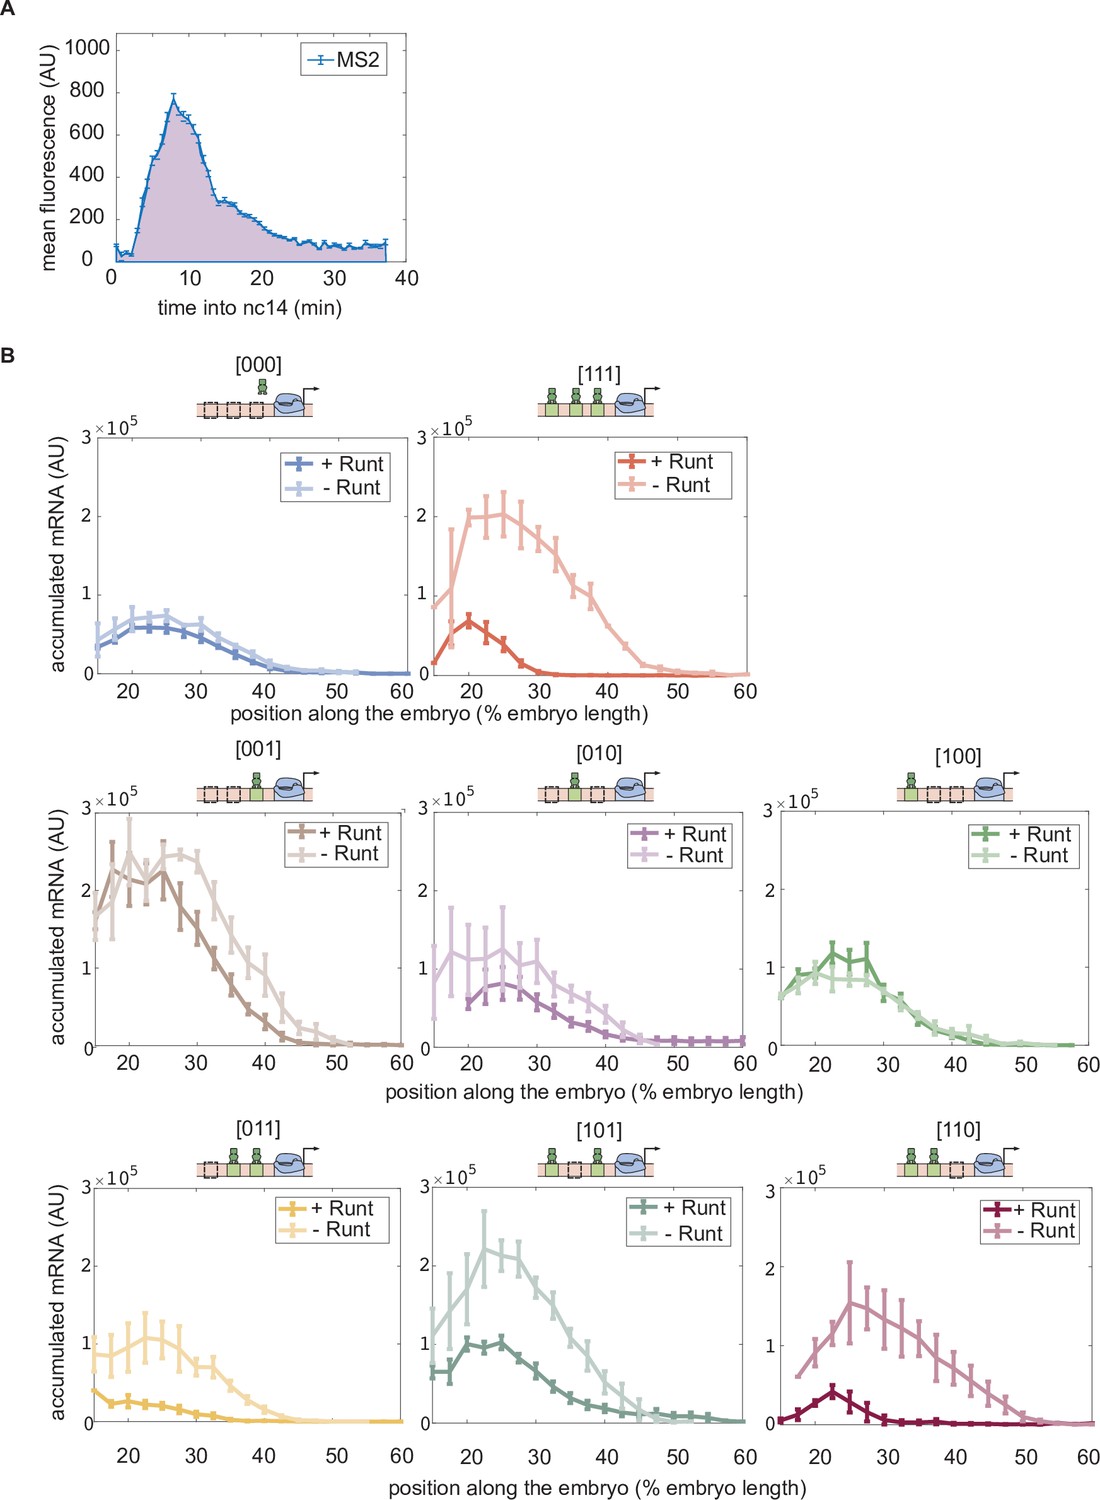
Accumulated mRNA during nuclear cycle 14 along the anterior-posterior axis for each synthetic enhancer construct in the presence and absence of Runt protein.
(A) An illustrative MS2 time trace in nuclear cycle 14. The accumulated mRNA is calculated by integrating the MS2 time traces during nuclear cycle 14, indicated by the purple area under the MS2 trace. (B) Accumulated mRNA along the embryo for each construct for the wild-type and runt null backgrounds. (B, error bars represent standard error of the mean over embryos.).
Figure 3—figure supplement 6
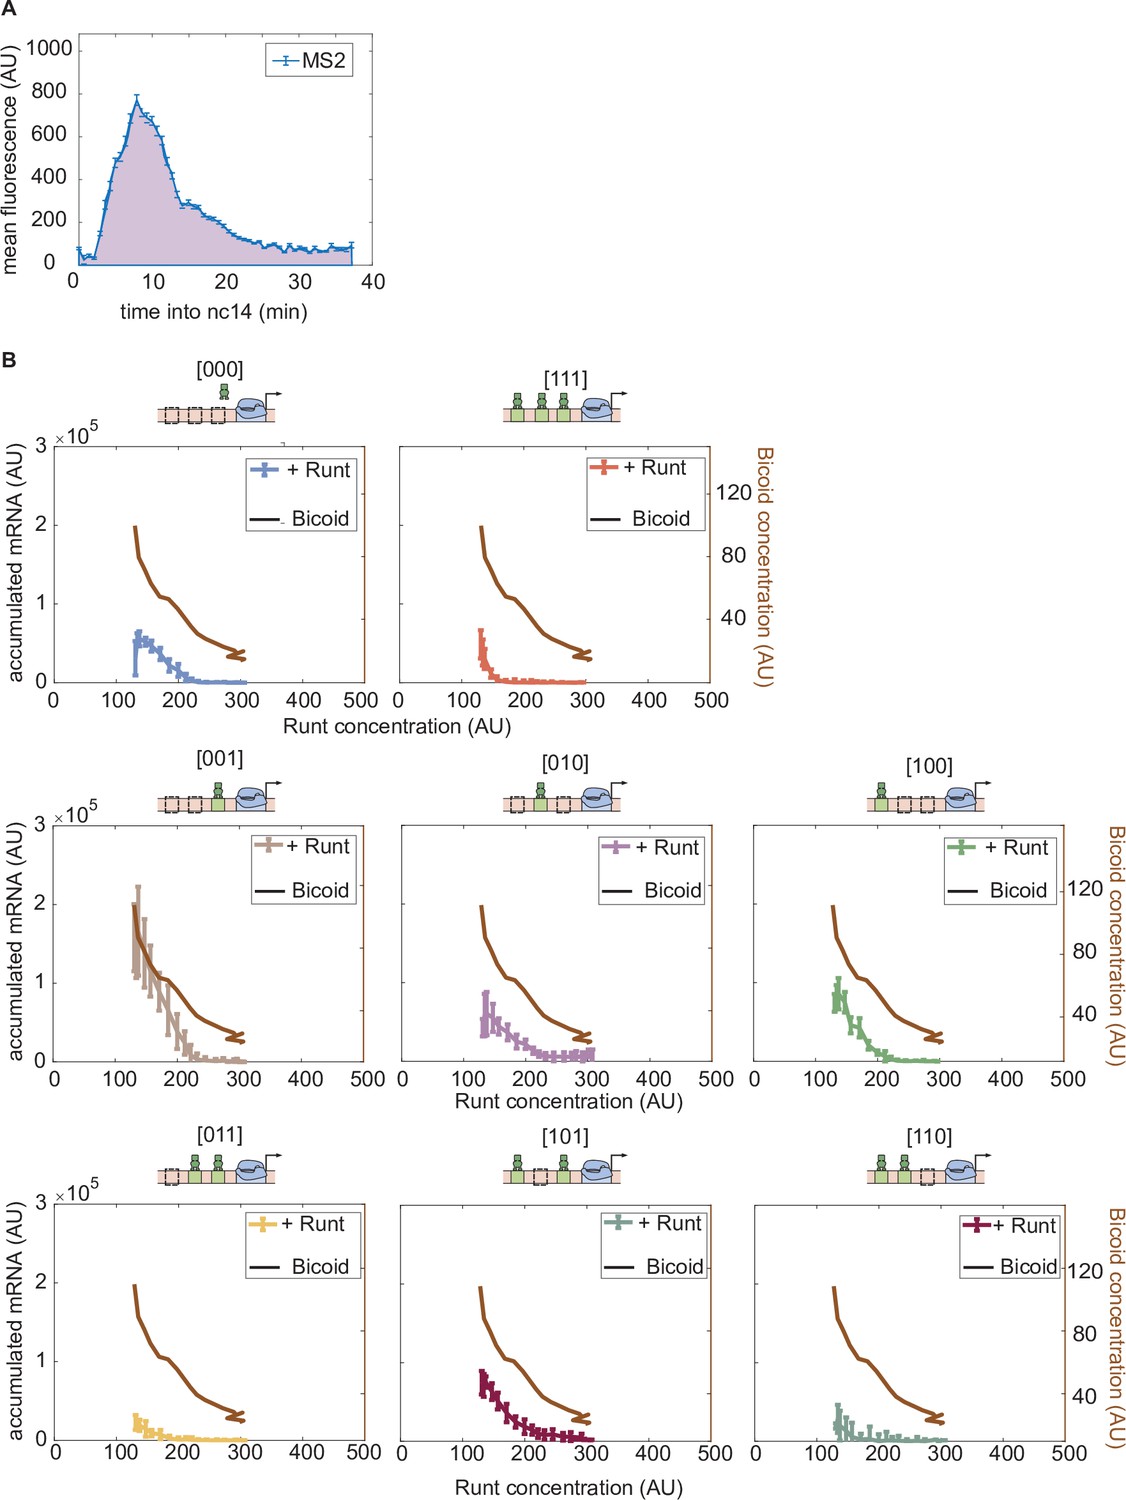
Accumulated mRNA during nuclear cycle 14 versus Runt concentration for each synthetic enhancer construct in the presence and absence of Runt protein.
(A) An example MS2 time trace averaged over MS2 spots in a spatial window of 2.5% of the embryo length in nuclear cycle 14. The accumulated mRNA is calculated by integrating the MS2 time traces during nuclear cycle 14, indicated by the purple area under the MS2 trace. (B) Accumulated mRNA as a function of Runt concentration (as reported by Figure 3E) for each construct for wild-type and runt null backgrounds. Bicoid concentration at each corresponding Runt concentration (as shown in Figure 3E) is shown as a black curve to note that the activator concentration changes as Runt concentration changes along the anterior-posterior axis of the embryo. (B, error bars represent standard error of the mean over embryos.).
Figure 3—figure supplement 7
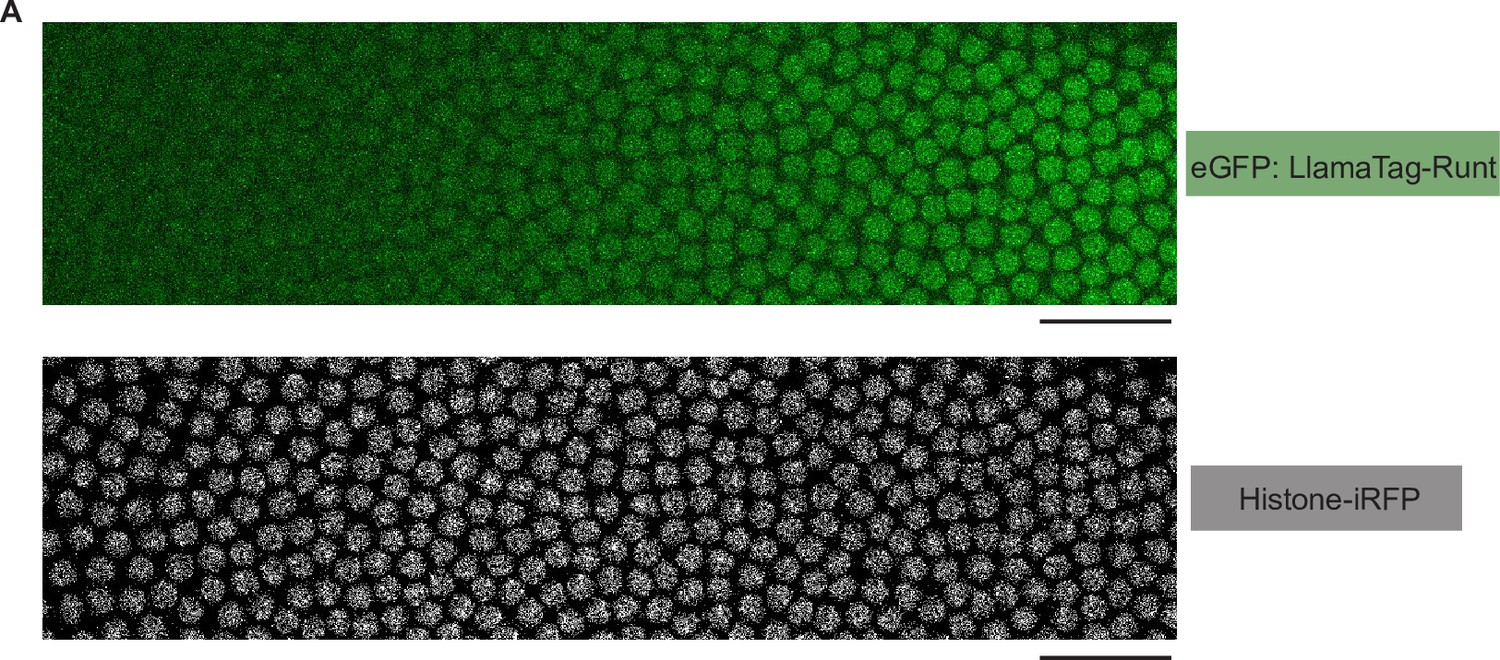
Snapshots of an embryo expressing eGFP:LlamaTag-Runt and the Histone-iRFP signal used for nuclear segmentation.
(A) Snapshots of an embryo for eGFP:LlamaTag-Runt (top) and Histone-iRFP (bottom) spanning 20–60% of the embryo length in nuclear cycle 14. The scale bars represent 50 μm.
Figure 3—figure supplement 8
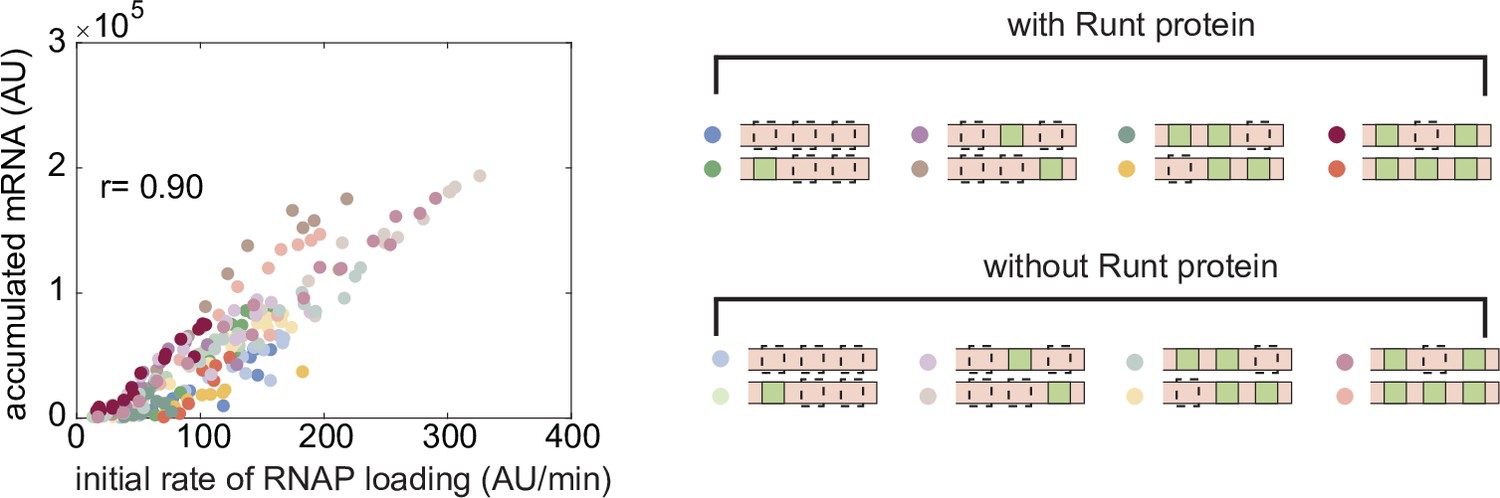
Correlation between the initial RNAP loading rate and accumulated mRNA during nuclear cycle 14.
Correlation between the initial RNAP loading rates and accumulated mRNA levels at each position along the embryo length for all constructs for the wild-type and runt null backgrounds. A Pearson’s correlation coefficient between these two quantities of 0.90 is found.
Figure 3—video 1
eGFP-Bicoid confocal movie.
Confocal microscopy movie taken on a developing fly embryo (eGFP-Bicoid; His2Av-mRFP; +) during nuclear cycle 13 and 14.
Figure 3—video 2
eGFP:LlamaTag-Runt confocal movie.
Confocal microscopy movie taken on a developing fly embryo (eGFP-Bicoid; His2Av-mRFP; +) during nuclear cycle 13 and 14.
Figure 3—video 3
[001]-MS2V5:MCP-GFP (+Runt) confocal movie.
Confocal microscopy movie taken on a developing fly embryo (yw; His2Av-mRFP; MCP-eGFP) for the [001] construct with MS2 reporter during nuclear cycle 13 and 14.
Figure 4 with 2 supplements
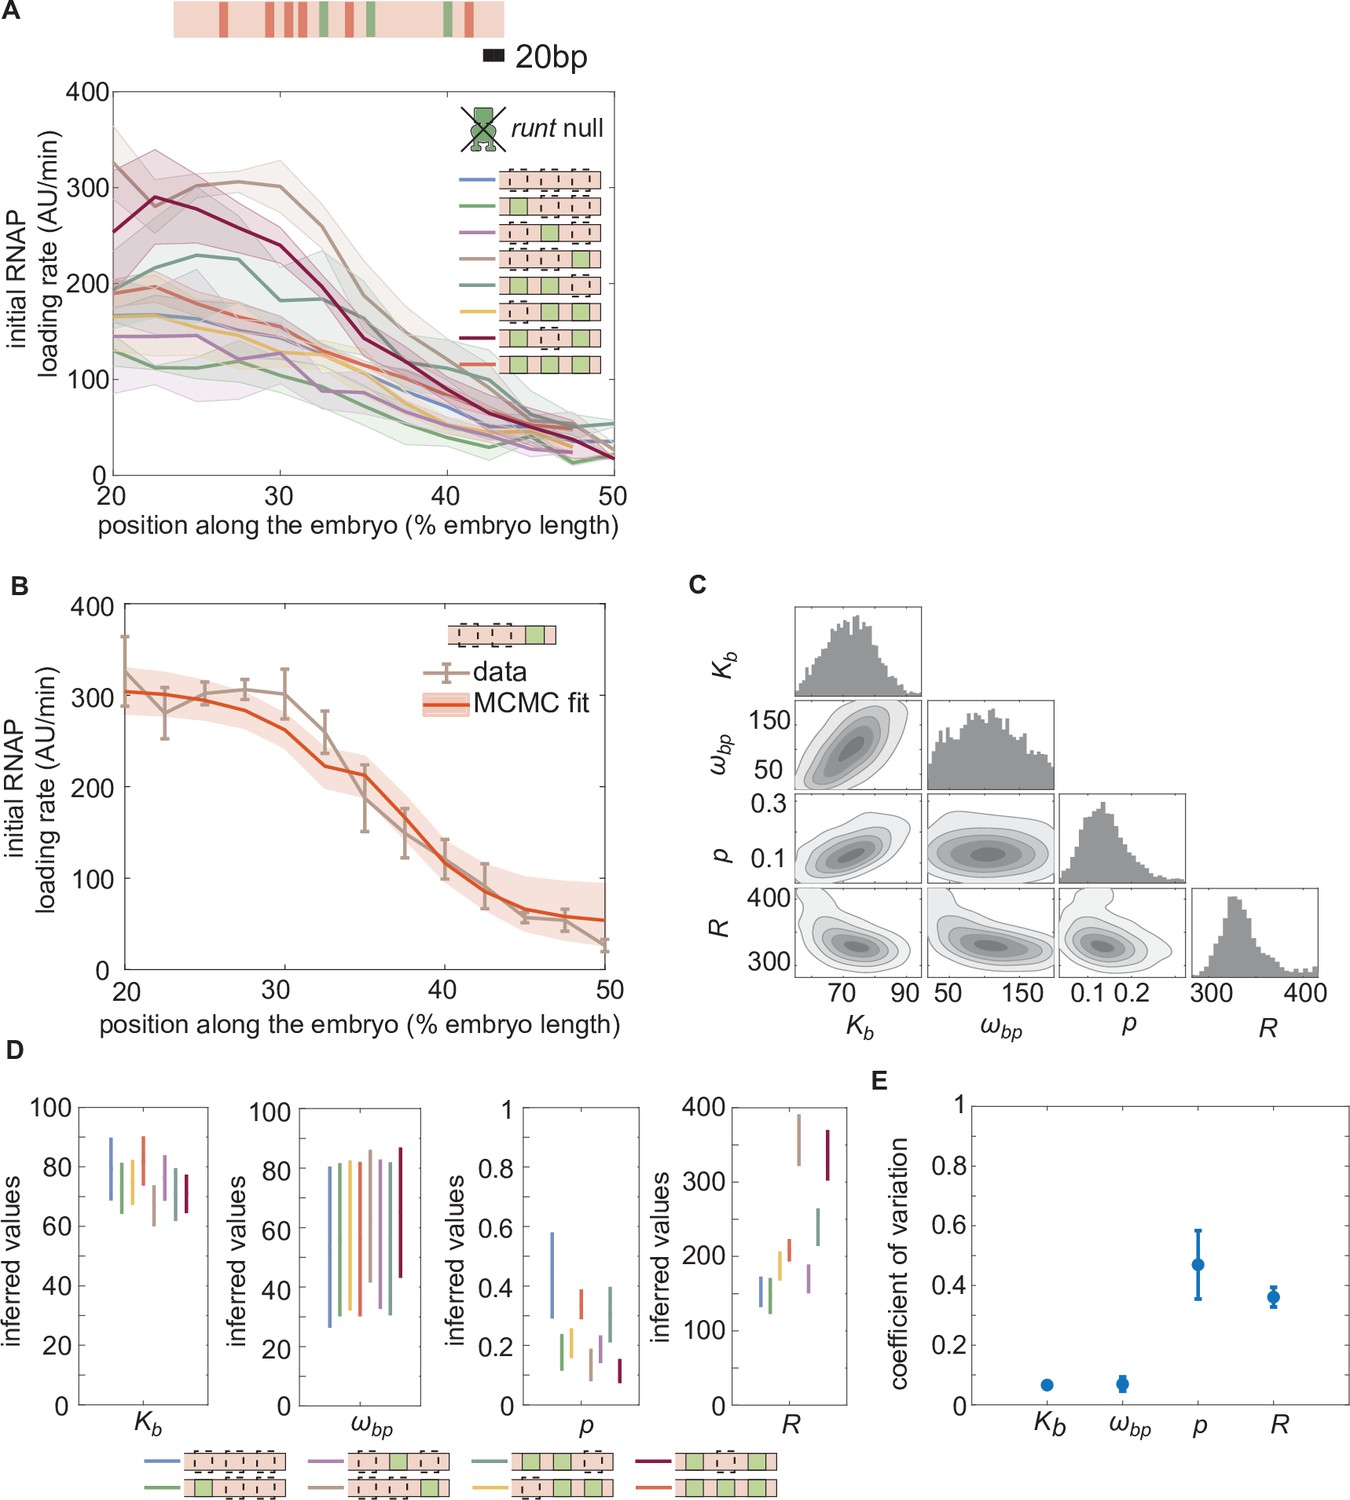
Enchancer-to-enhancer variability in the unrepressed transcription level stems from unique RNAP-dependent parameters.
(A) Measured initial rates of RNAP loading across the anterior-posterior axis of the embryo for all synthetic enhancer constructs in the absence of Runt protein. (The [111] synthetic enhancer construct with the position of Bicoid (red) and Runt (green) binding sites is shown in genomic length scale on top as a reference.) (B) Representative best MCMC fit and (C) associated corner plot for the [001] construct in the runt null background. (D) Inferred model parameters for all synthetic enhancers in the absence of Runt repressor. Note the large spread in , consistent with the corner plot shown in (C), which indicates that our model does not constrain this parameter well compared to the other parameters. (E) Coefficient of variation of inferred parameters. (A, B), shaded regions represent the standard error of the mean over>3 embryos; (B) error bars from MCMC fit represent 95% confidence interval; (D) error bars represent standard deviations calculated from the MCMC posterior chains; (E) error bars are calculated by propagating the standard deviation of individual parameters from their MCMC chains.
Figure 4—figure supplement 1
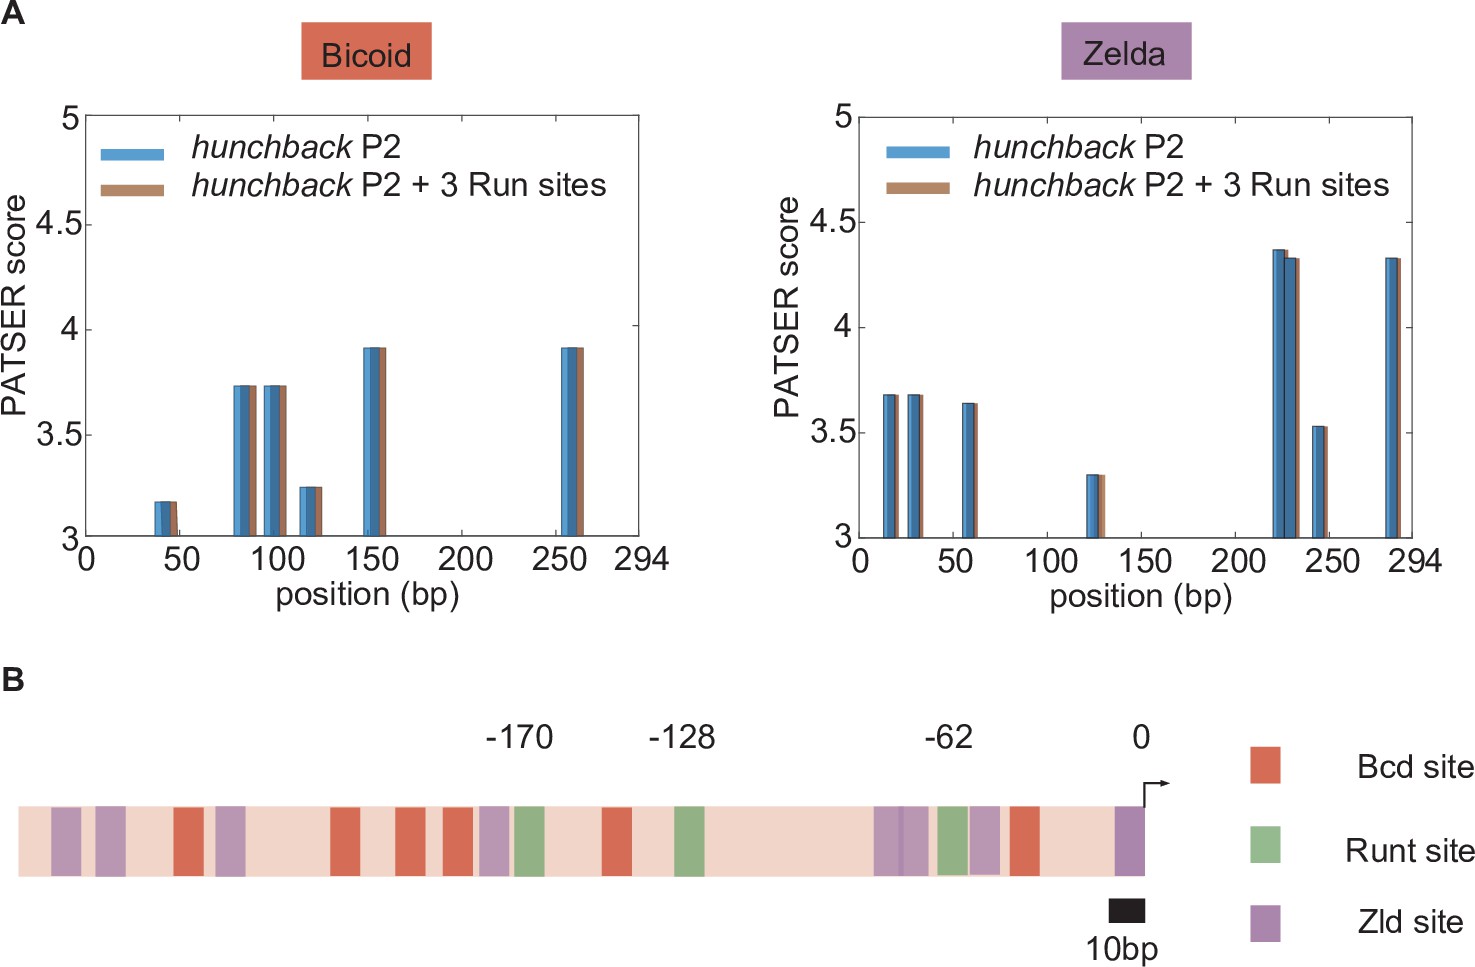
Bioinformatically predicted architecture of major transcription factor binding sites in the hunchback P2 minimal enhancer with three Runt (Run) binding sites.
(A) PATSER scores for Bicoid and Zelda for hunchback P2 (blue) and hunchback P2 with three Runt sites (brown). The binding motifs with PATSER scores higher than three are shown. We concluded that neither Bicoid nor Zelda binding sites were created or removed by the introduction of these three Runt binding motifs. (B) A schematic diagram of hunchback P2 minimal enhancer with three Runt binding sites with mapped binding sites for Bicoid and Zelda from (A) and Runt binding sites from Chen et al. [2012]. The position of Runt binding sites are noted with their distance from the promoter (marked as 0).
Figure 4—figure supplement 2
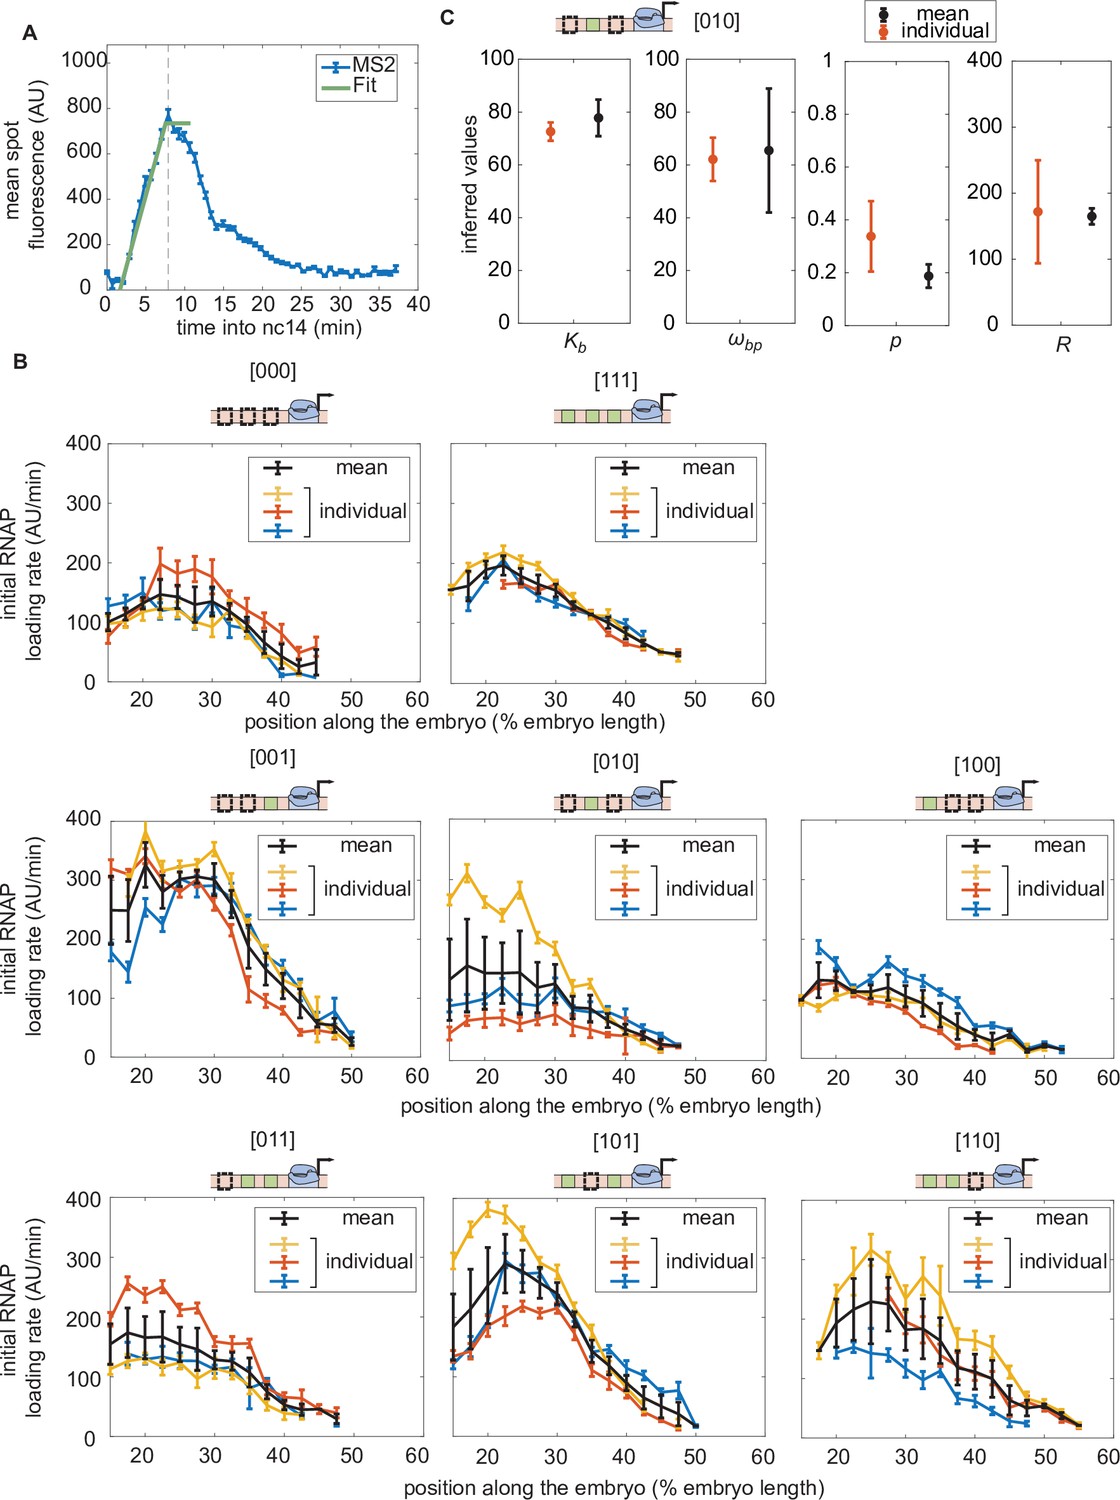
Initial rate of RNAP loading in nuclear cycle 14 across the anterior-posterior axis for different constructs in individual embryos in the absence of Runt protein.
(A) Schematic showing how the initial rate of RNAP loading is measured for an individual embryo by extracting the slope resulting from a linear fit to the averaged MS2 time traces at the beginning of nuclear cycle 14. Here, the MS2 traces are averaged over a set of nuclei that are in the same spatial bin along the anterior-posterior axis of the embryo (2.5% of the embryo length). (B) Initial rate of RNAP loading along the embryo for individual embryos (indicated by the different colors, such as red, blue, or yellow) for each construct in the absence of Runt protein. The average obtained by taking the mean over these multiple embryos is shown in black. (C) Comparison between the inferred parameter values of from Equation 3 for the [010] construct for different averaging strategies. The averaged parameters inferred from the initial rate of RNAP from individual embryos, shown in color in (B), are shown in red. The parameters inferred from the mean initial rate of RNAP averaged over multiple embryos, shown in black in (B), are shown in black. There is no significant difference between these inferred values. Note that the [010] construct was chosen because it exhibits the largest dynamic range in the initial rate of RNAP loading across multiple embryos. (A, error bars represent standard error of the mean over 3 embryos; B, error bars for individual embryos represent the 95% confidence interval from the linear fit and error bars for black line represents the standard error of the mean over 3 embryos; C, red error bars represent the standard error of the mean over 3 embryos, while blue error bars indicate the 95% confidence interval.).
Figure 5 with 3 supplements
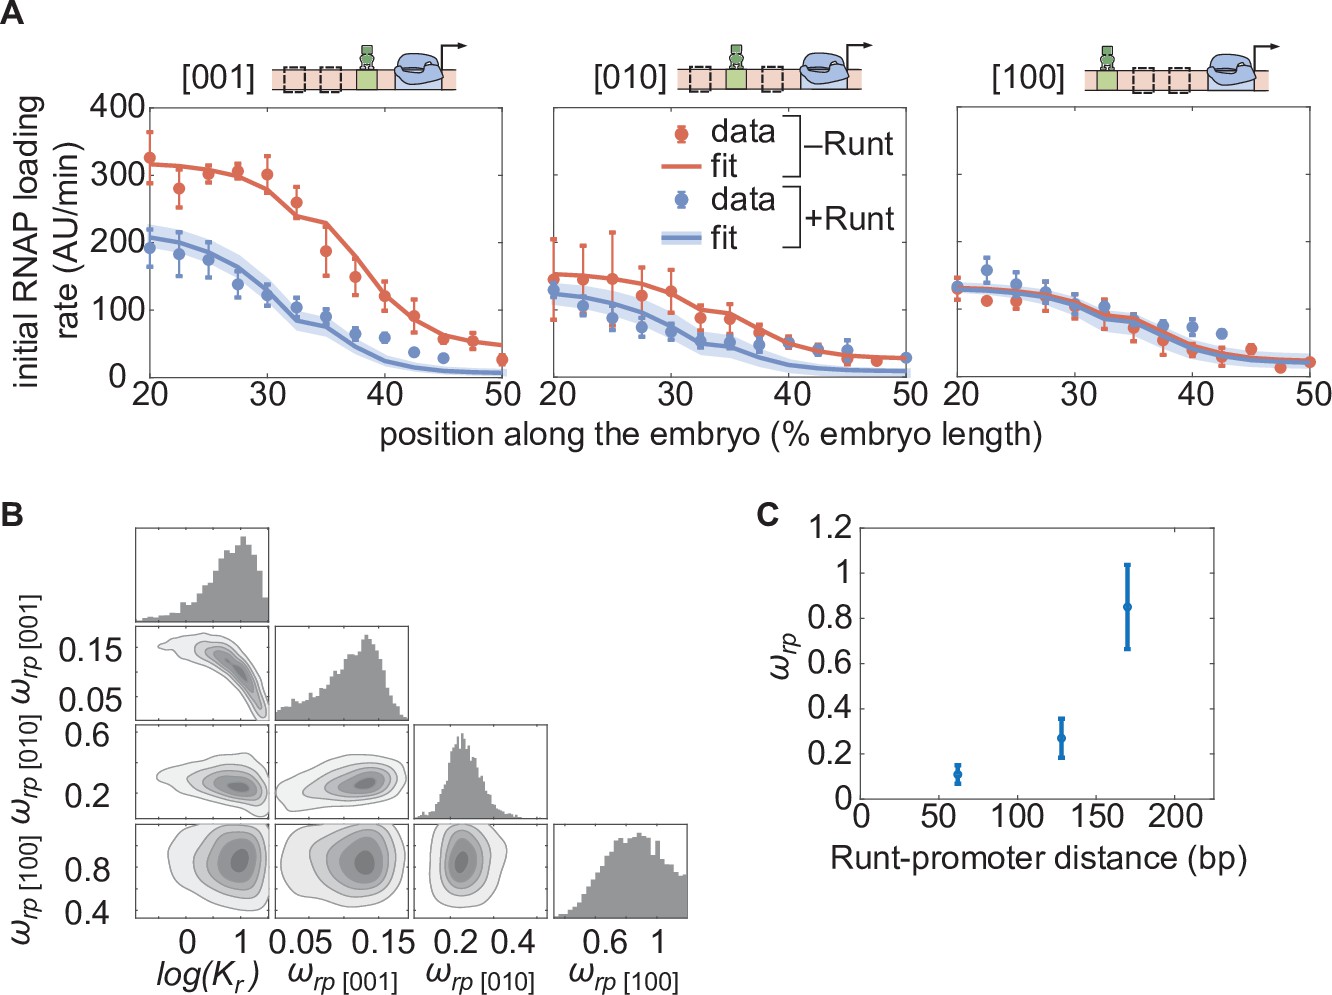
Testing the direct repression model in the presence of one Runt binding site.
(A) Initial transcription rate as a function of position along the embryo for the three constructs containing one Runt binding site in the presence and absence of Runt repressor, together with their best MCMC fits. (B) Corner plots from MCMC inference for all constructs with one Runt binding site. (C) Inferred value as a function of distance between the promoter and the Runt binding site. (A, data points represent mean and standard error of the mean over the embryos and shaded error bars represent 95% confidence intervals for the best MCMC fits for Runt WT datasets; C, data and error bars represent the mean and standard deviation of the posterior chains, respectively.).
Figure 5—figure supplement 1
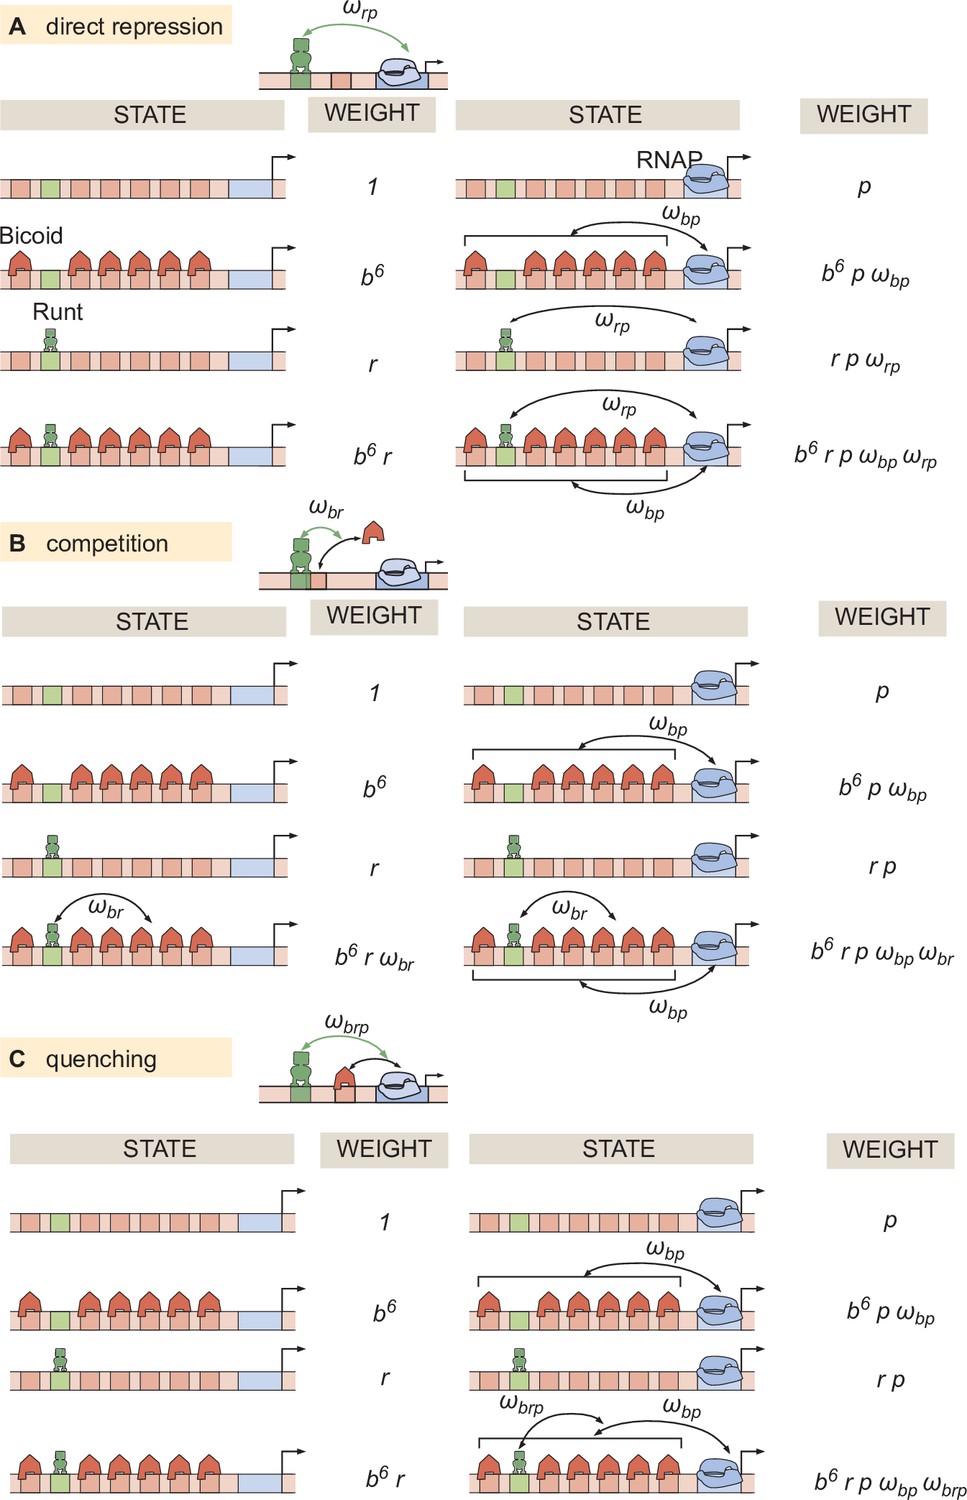
Thermodynamic models for different modes of repression.
States and statistical weights corresponding to the hunchback P2 enhancer with one Runt binding site for the (A) direct repression, (B) competition, and (C) quenching mechanisms.
Figure 5—figure supplement 2
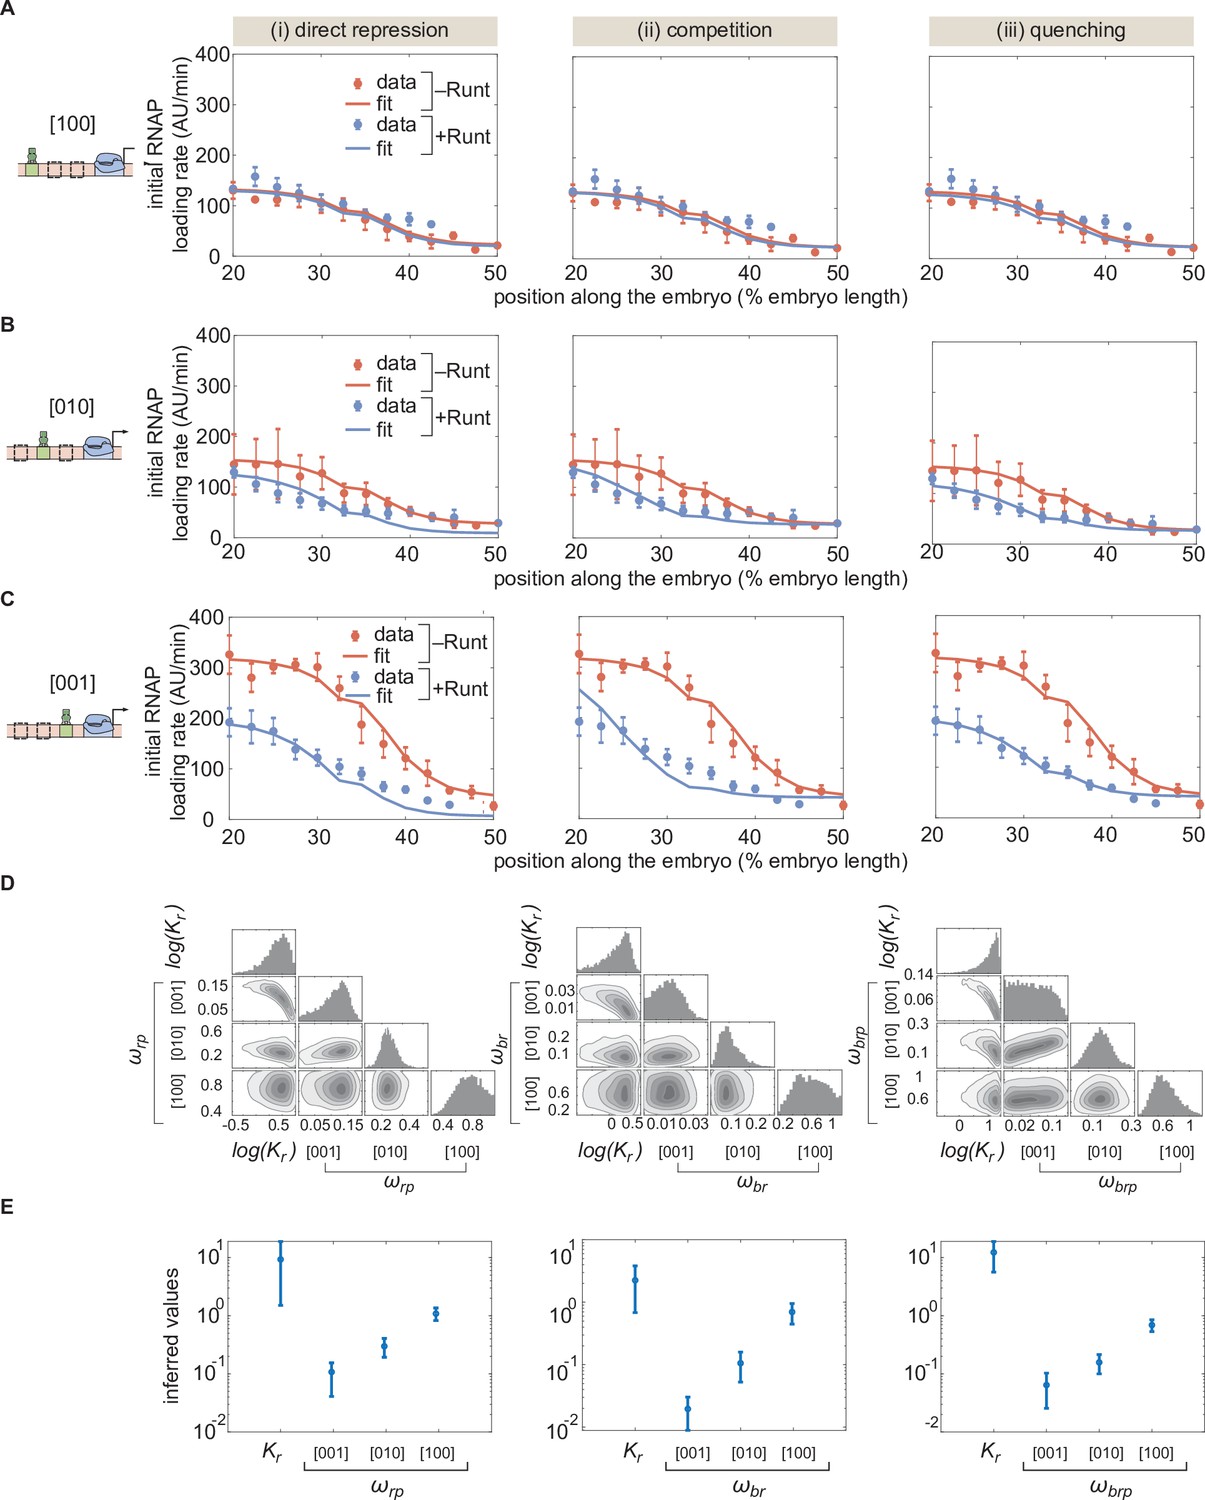
MCMC fitting to the hunchback P2 with one Runt binding site constructs using different models of repression.
(A,B,C) MCMC fits for three modes of repression, (i) direct repression, (ii) competition, and (iii) quenching, for our three one-Runt site constructs, (A) [100], (B) [101], and (C) [001]. (D) Corner plots resulteing from MCMC inference on the three one-Runt site constructs for each model. (E) Inferred parameters from MCMC fitting. (A,B, and C, error bars represent standard error of the mean over embryos; E, error bars represent standard deviation of the posterior chain.).
Figure 5—figure supplement 3
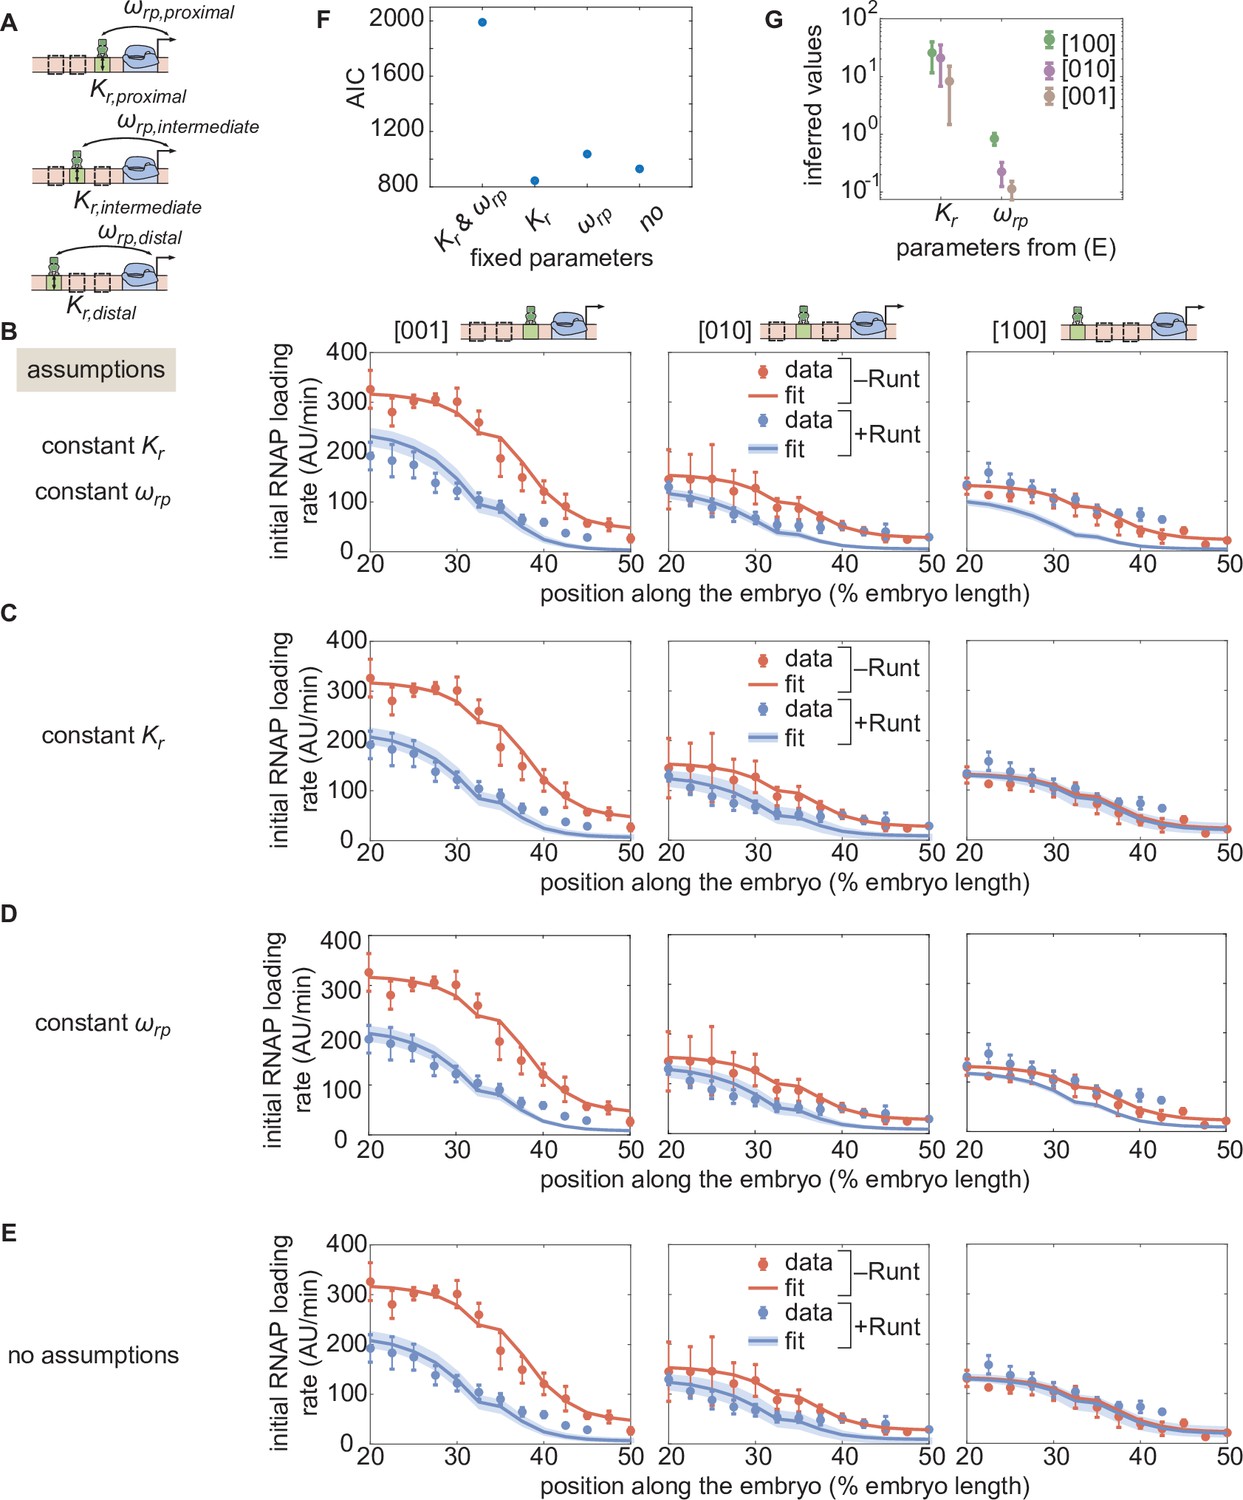
Assessment of alternative models for the one-Runt binding site case.
(A) A schematic of three synthetic enhancers with one Runt binding site at different positions in the enhancer (proximal, intermediate and distal) and their key parameters and . (B,C,D,E) Best MCMC fits to the data for the one-Runt binding site constructs for models with varying assumptions of how and vary across constructs. (B) Model assuming that both and are constant across constructs. (C) Model assuming that remains constant and varies across constructs. (D) Model assuming that remains constant and that varies across constructs. (E) Model assuming that both and vary across constructs. (F) Akaike Information Criterion for all four models. The parameters kept constant across constructs are shown on the x-axis, and the AIC value is shown on the y-axis. (G) Inferred parameter values ( and ) from (E) for all three one-Runt binding site constructs ([100],[010],[001]). (B-E, data points represent mean and standard error of the mean over >3 embryos, shaded regions represent 95% confidence intervals for the best MCMC fits for the datasets in the presence of Runt protein.).
Figure 6 with 7 supplements
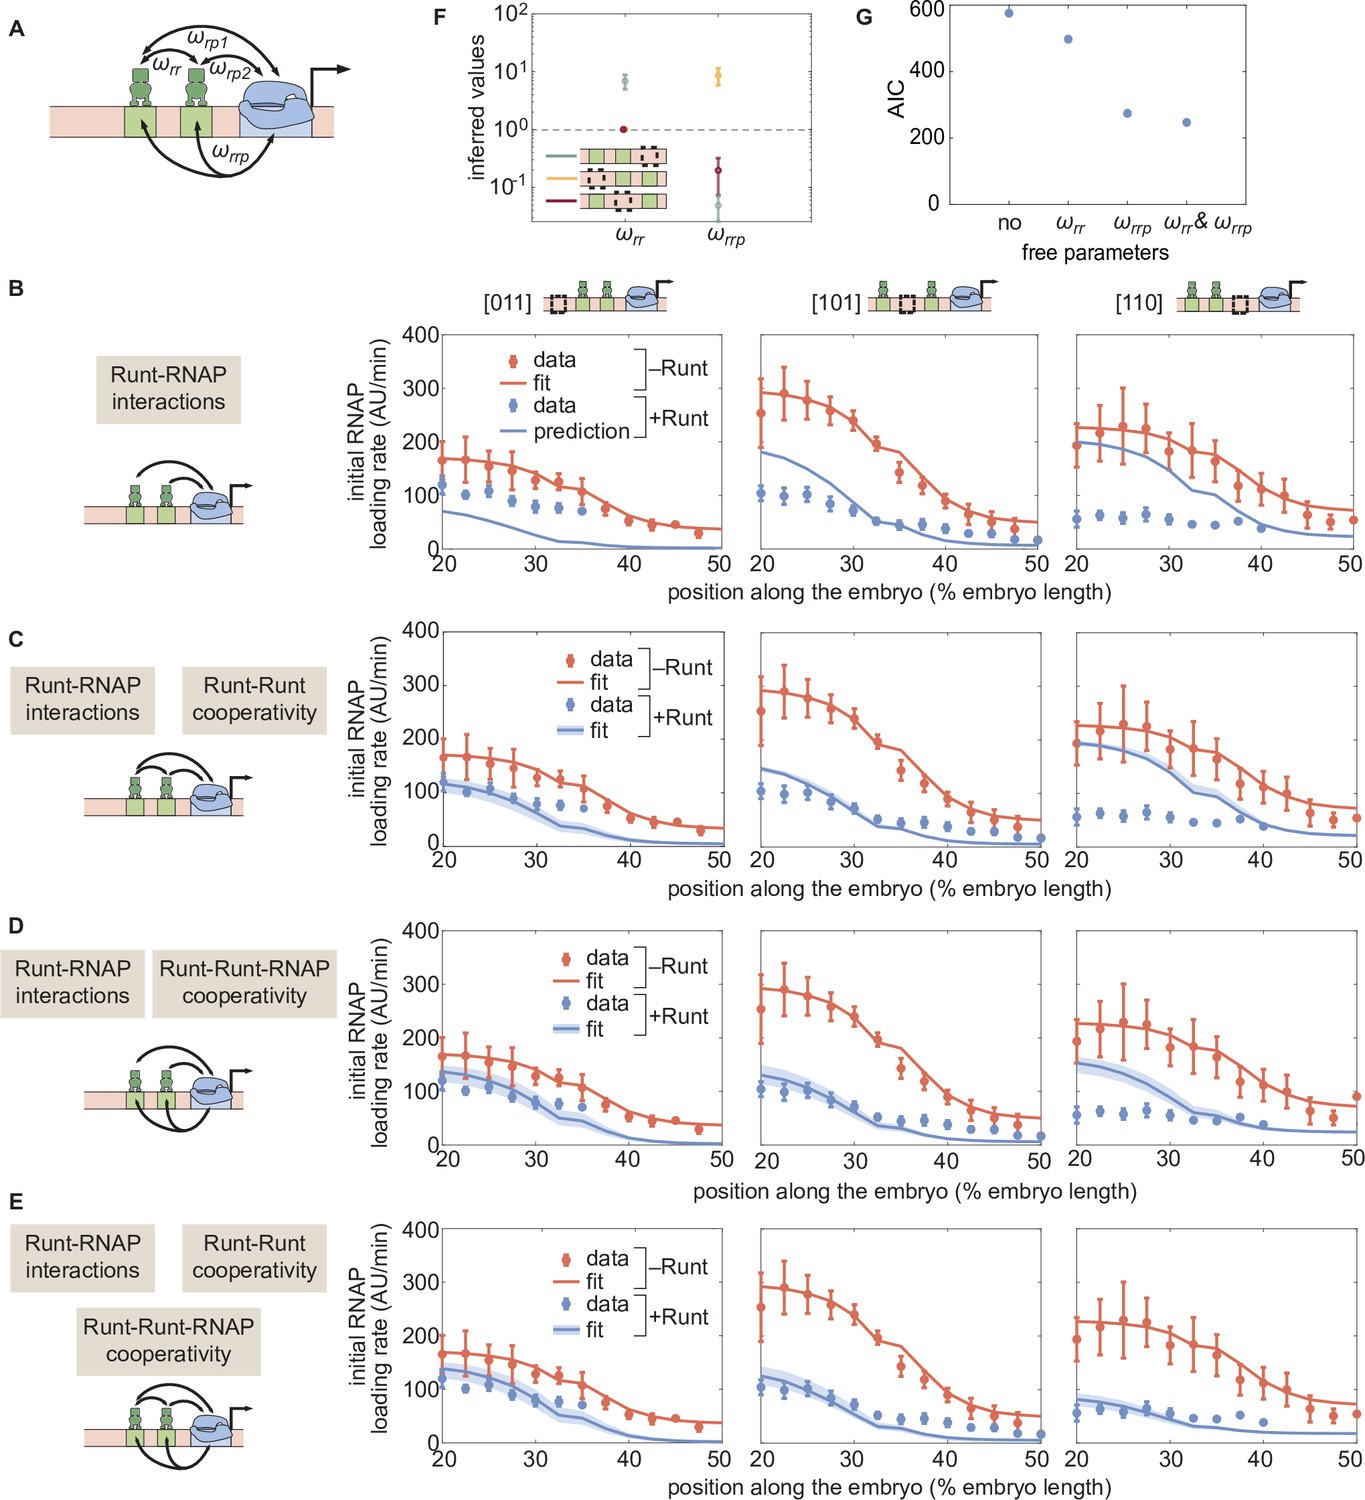
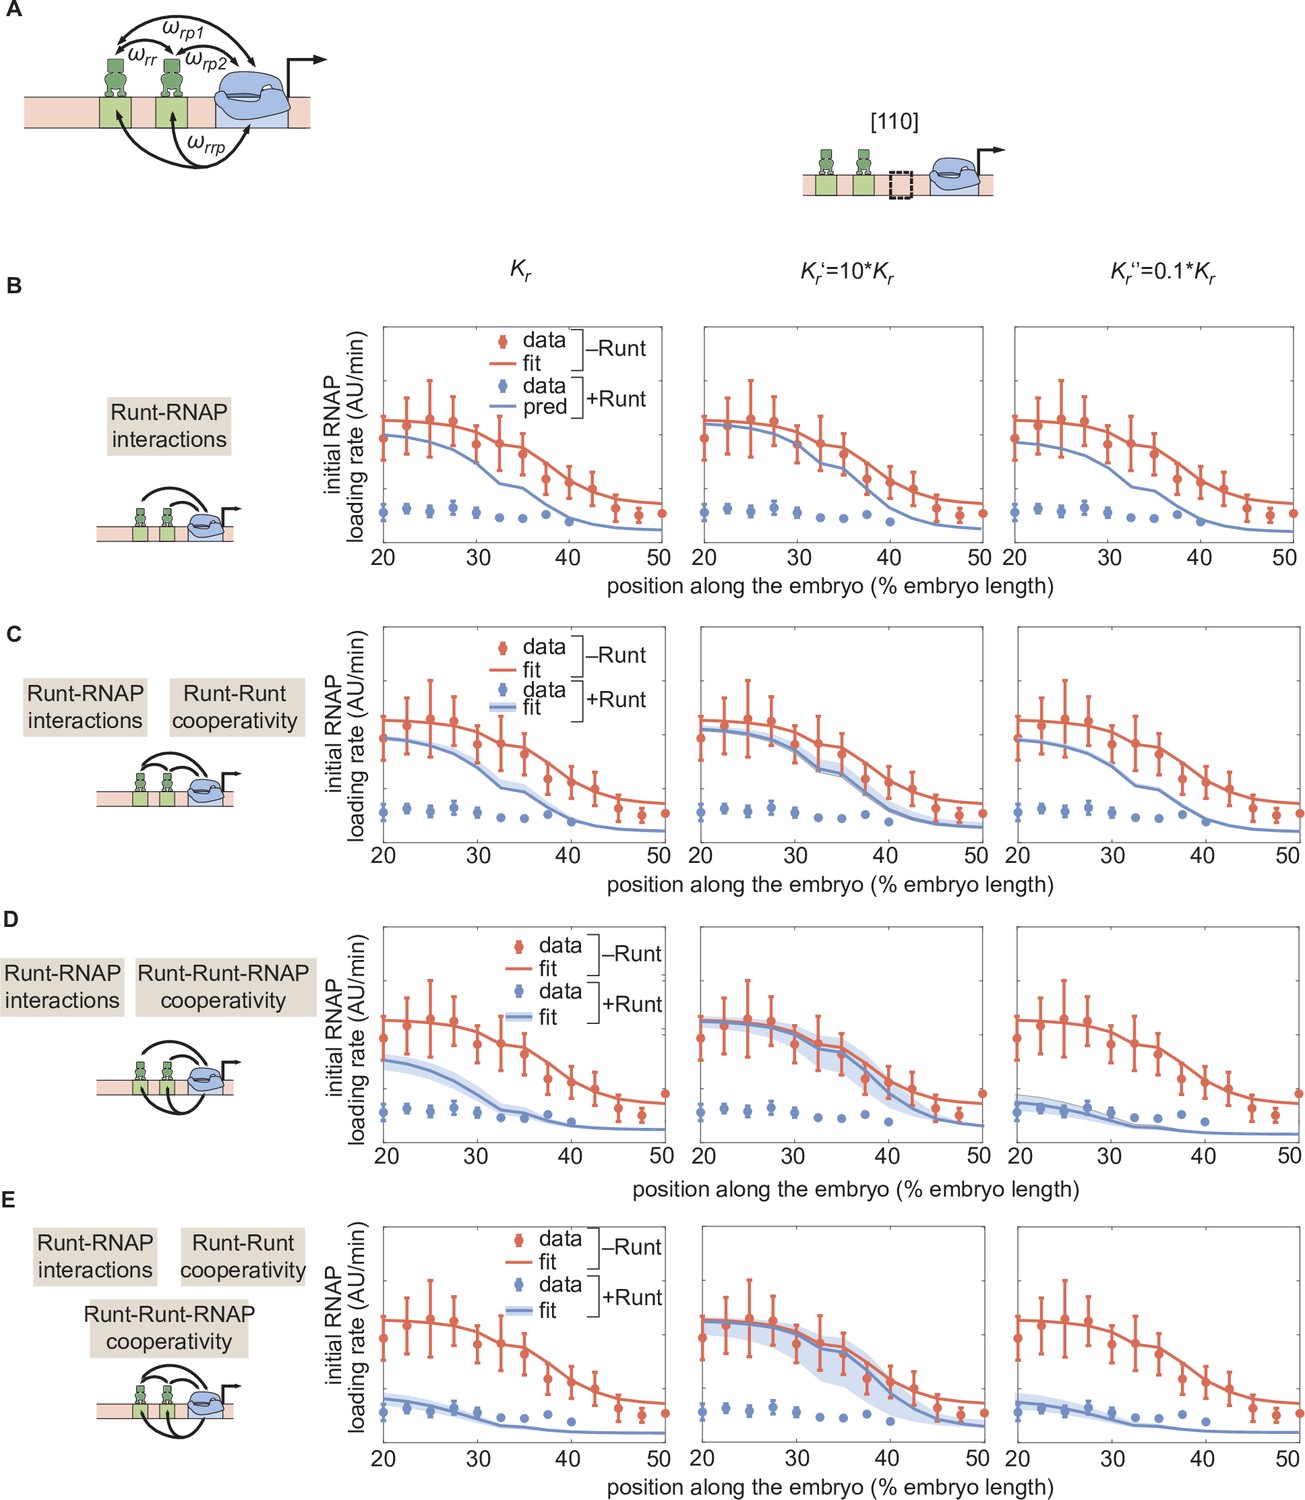
Prediction for the transcription initiation rate of hunchback P2 with two-Runt binding sites under different models of cooperativity.
(A) Direct repression model for hunchback P2 with two Runt binding sites featuring Runt-RNAP interaction terms given by and, Runt-Runt cooperativity captured by , and Runt-Runt-RNAP higher-order cooperativity accounted for by . (B) Parameter-free model prediction for two Runt binding sites when the two Runt molecules bind the DNA and interact with RNAP independently of each other. (C,D,E) Best MCMC fits for the data for two-Runt binding site constructs for models with various combinations of cooperativity parameters. (C) Model incorporating Runt-Runt cooperativity. (D) Model incorporating Runt-Runt-RNAP higher-order cooperativity. (E) Model accounting for both Runt-Runt cooperativity and Runt-Runt-RNAP higher-order cooperativity. (F) Fixed or inferred parameters and for all two-Runt binding site constructs. Note that is fixed to 1 for [011] and [101] constructs due to the fact that no Runt-Runt cooperativity is necessary to quantitatively describe the expression driven by these constructs; only the [110] construct is used to infer both and . The horizontal line of denotes the case of no cooperativity. (G) Akaike Information Criterion (AIC) for all four scenarios of different free parameters shown throughout (B–E). (B-E, data points represent mean and standard error of the mean over the embryos. C-E, shaded error bars represent 95% confidence intervals for the best MCMC fits for the Runt WT datasets; F, data and error bars represent the mean and standard deviation of the posterior chain, while the standard deviation for the fixed is set to 0.).
Figure 6—figure supplement 1
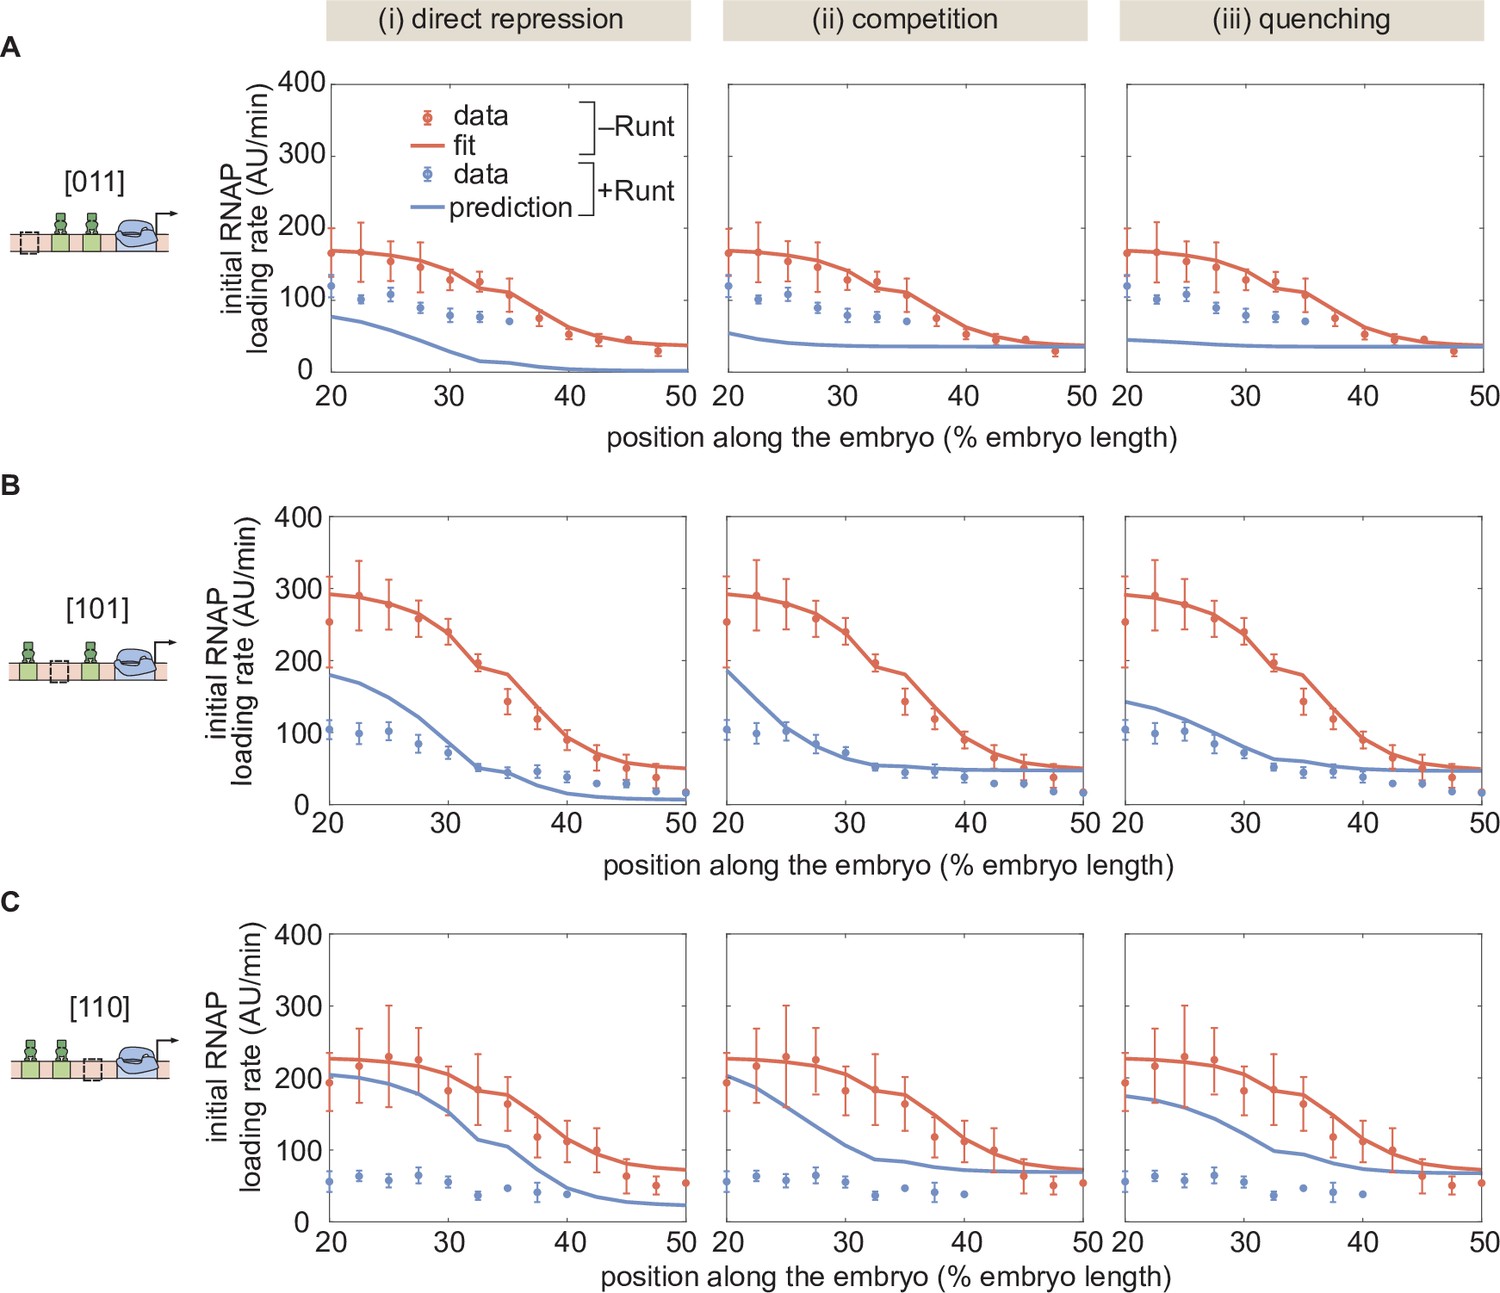
Prediction for two-Runt binding sites constructs based on the inferred parameters from the one-Runt binding site cases for different modes of repression for the (A) [011], (B) [101], and (C) [110] constructs.
The model assumes no interactions between Runt molecules. (A,B, and C, error bars represent standard error of the mean over embryos.).
Figure 6—figure supplement 2
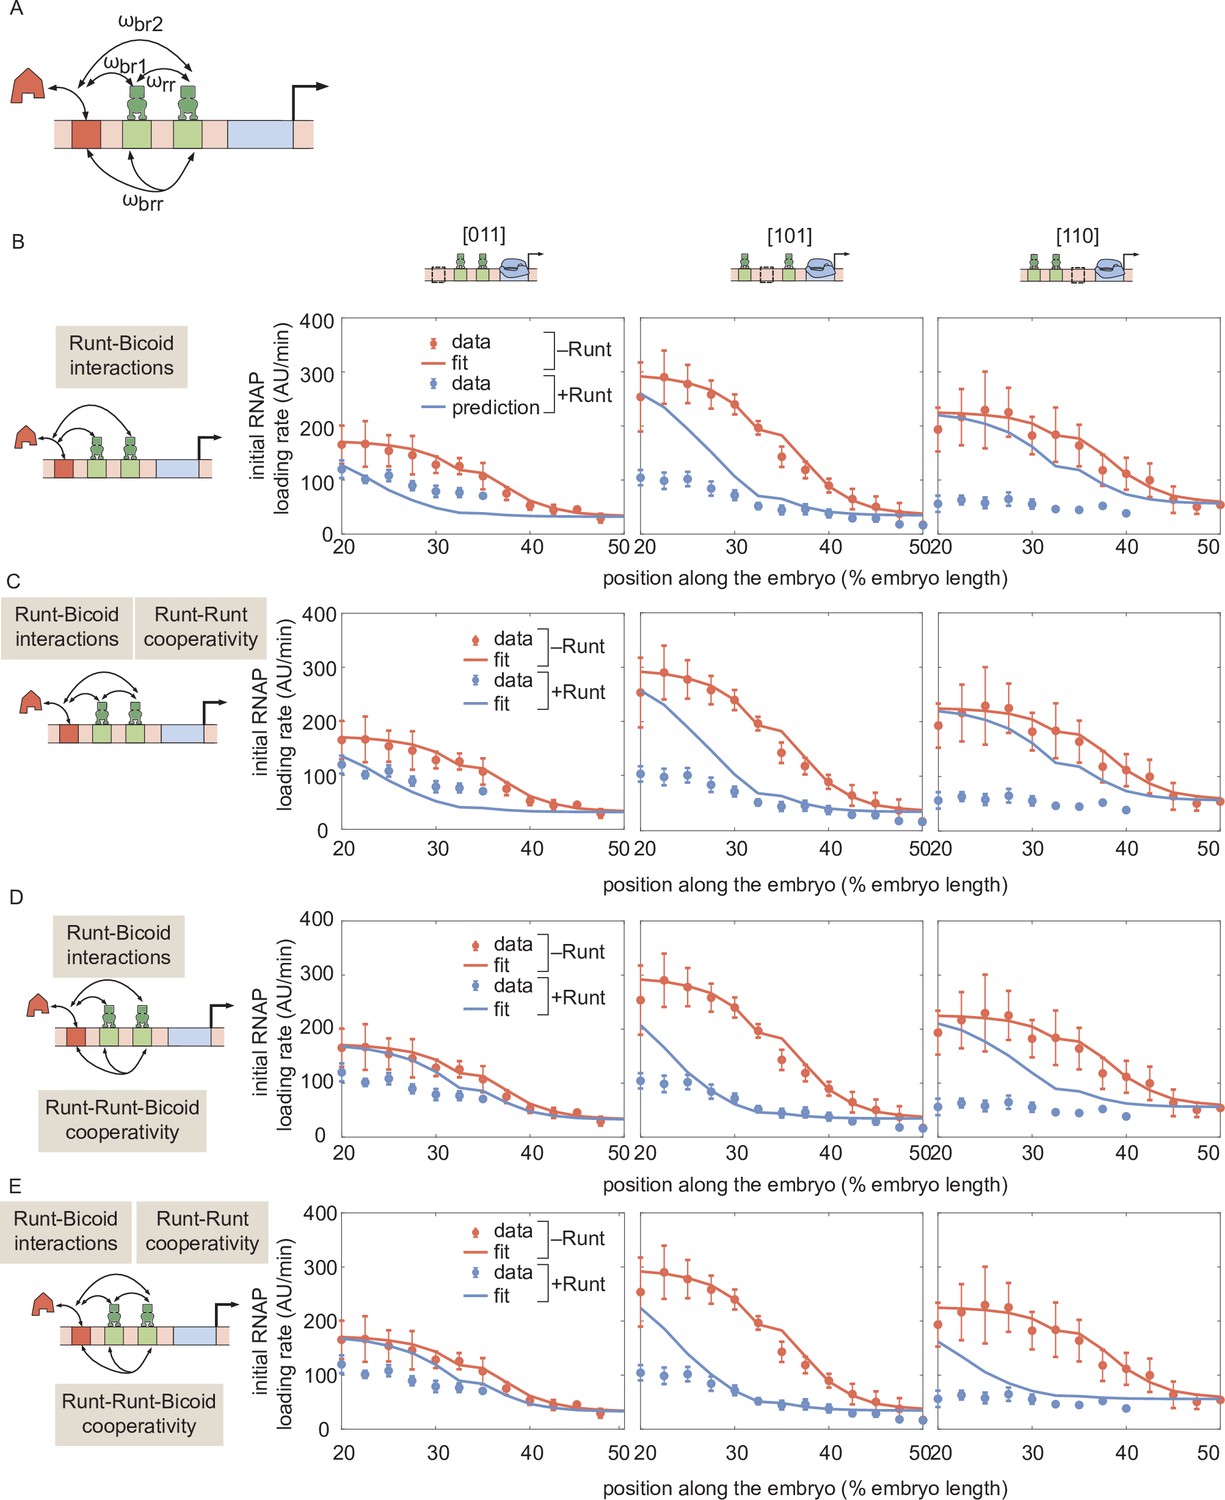
Prediction for hunchback P2 transcription initiation rate with two-Runt binding sites under the competition scenario for different combinations of cooperativities.
(A) Schematic of cooperativity terms considered: Runt-Runt cooperativity given by and Runt-Runt-Bicoid complex higher-order cooperativity captured by , in addition to the competition terms and . (B) Zero-parameter prediction using the inferred parameters from zero- and one-Runt binding site constructs. (C,D,E) Best MCMC fits for our three two-Runt binding sites constructs considering (C) Runt-Runt cooperativity, (D) Runt-Runt-Bicoid complex higher-order cooperativity, and (E) both Runt-Runt cooperativity and Runt-Runt-Bicoid complex higher-order cooperativity. (B,C,D, and E, error bars represent standard error of the mean over embryos.).
Figure 6—figure supplement 3
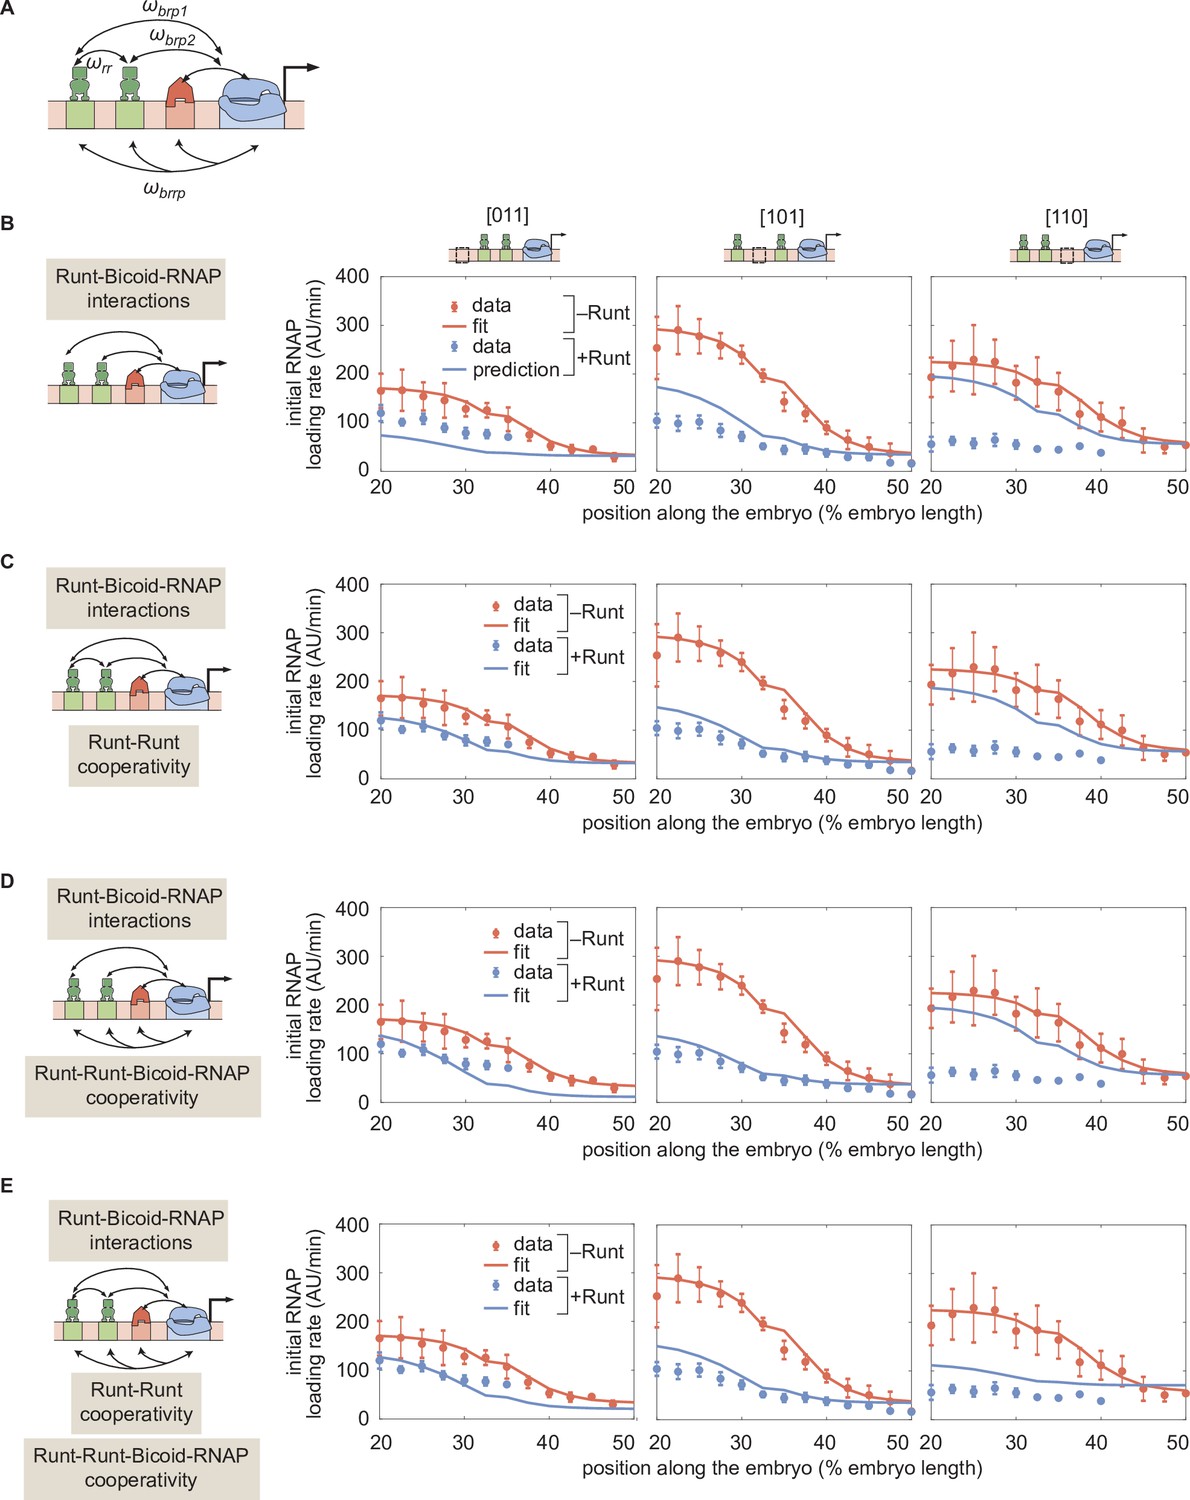
Prediction for hunchback P2 transcription initiation rate with two-Runt binding sites under the quenching mechanism for different combinations of cooperativities.
(A) Schematic of additional cooperativities considered: Runt-Runt cooperativity and Runt-Runt-Bicoid-RNAP complex higher-order cooperativity . (B) Zero-parameter prediction using the inferred parameters from one-Runt binding site constructs. (C,D,E) Best MCMC fits for our three two-Runt binding sites constructs considering (C) Runt-Runt cooperativity, (D) Runt-Runt-Bicoid-RNAP higher-order cooperativity, and (E) both Runt-Runt cooperativity and Runt-Runt-Bicoid-RNAP higher-order cooperativity. (B,C,D, and E, error bars represent standard error of the mean over embryos.).
Figure 6—figure supplement 4
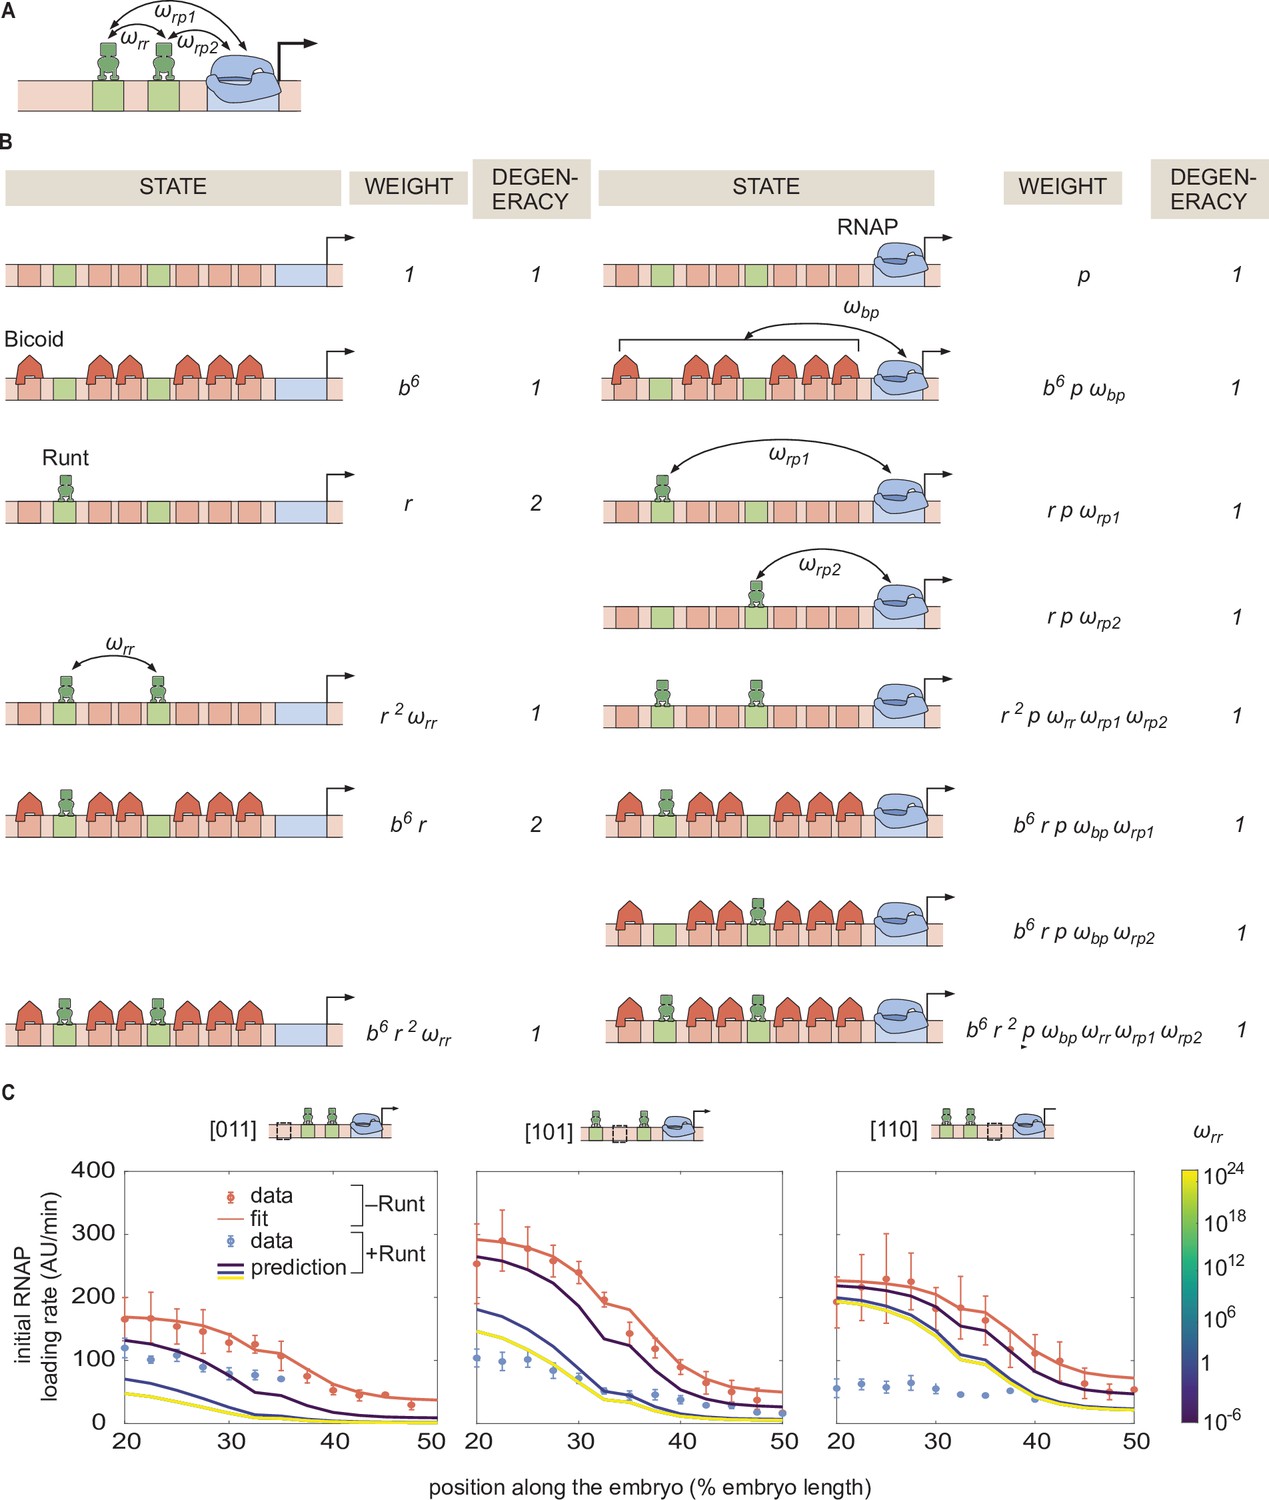
Invoking Runt-Runt cooperativity in the thermodynamic model is not sufficient to explain the experimental data from hunchback P2 with two Runt binding sites.
(A) Model schematic where we add a new parameter representing Runt-Runt cooperativity. (B) Corresponding states and weights for hunchback P2 with two Runt binding sites in the presence of Runt-Runt cooperativity. (C) Prediction of the initial rate of RNAP loading profiles over a range of Runt-Runt cooperativity strength,, for all constructs of hunchback P2 with two Runt binding sites. The sole presence of Runt-Runt cooperativity is not enough to recapitulate the data corresponding to the [110] construct. (C, error bars represent standard error of the mean over embryos).
Figure 6—figure supplement 5
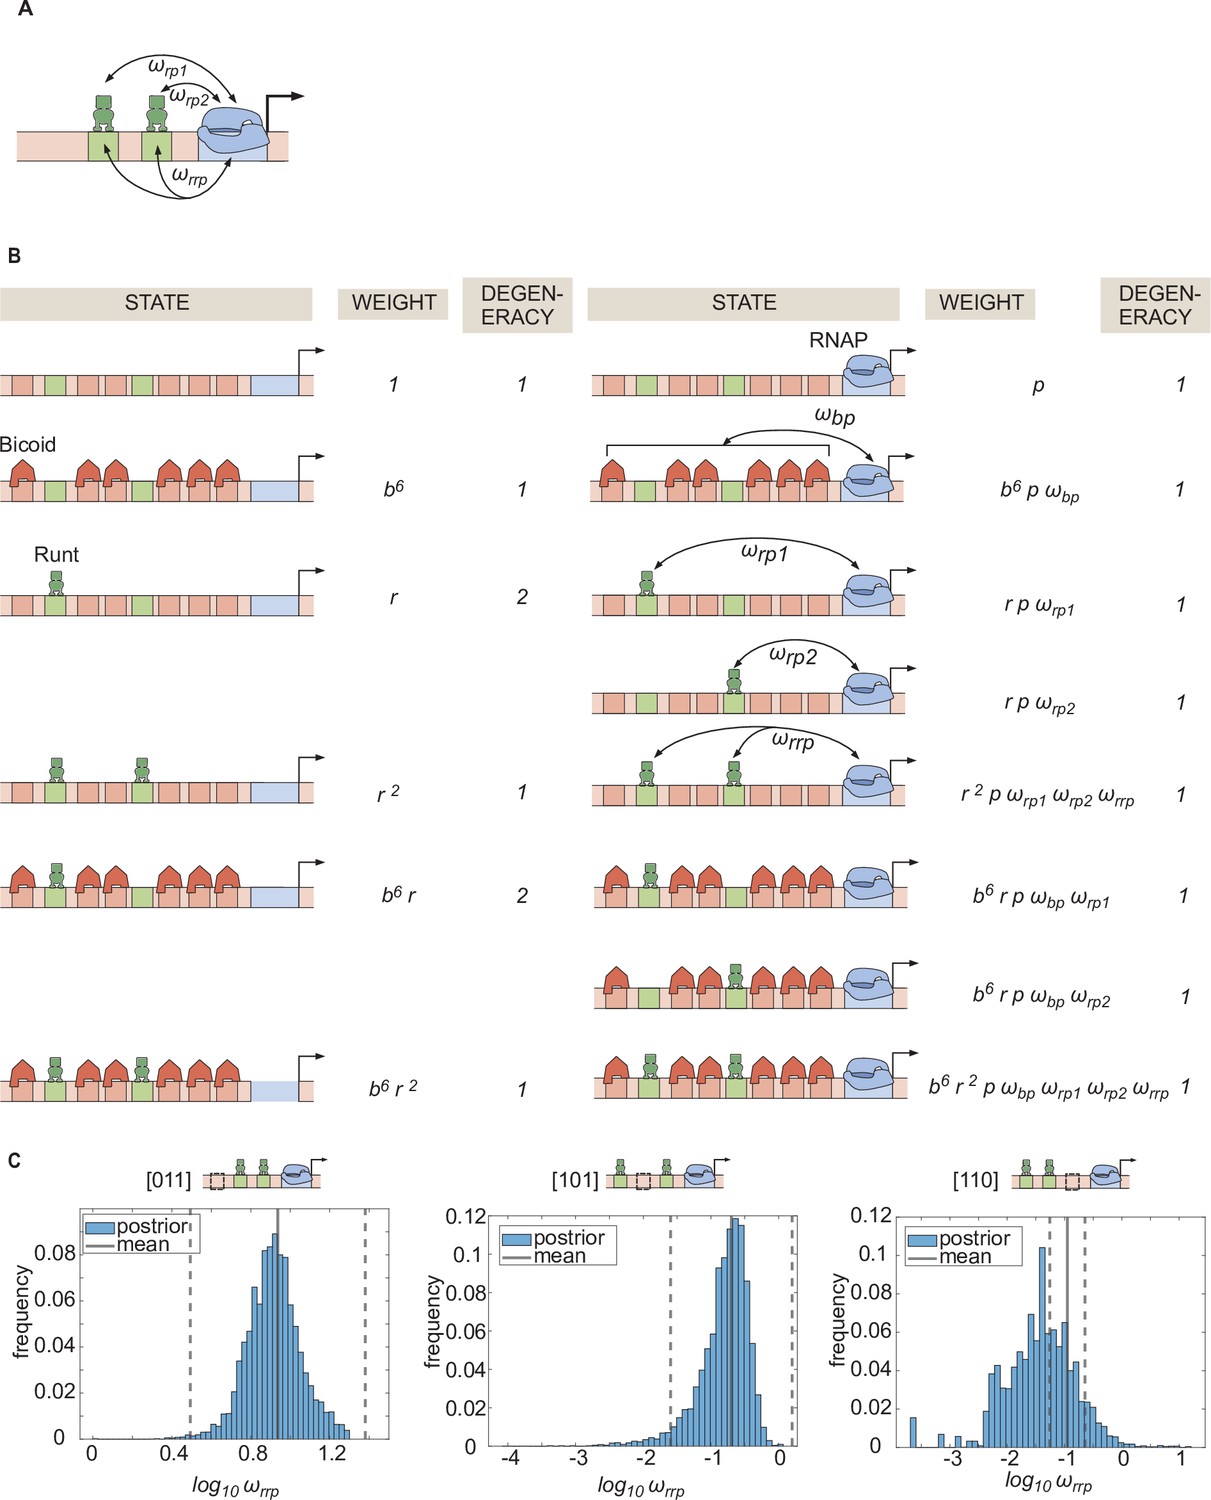
Statistical mechanics model incorporating Runt-Runt-RNAP higher-order cooperativity.
(A) Schematic of a model where we add Runt-Runt-RNAP higher-order cooperativity represented by . (B) Thermodynamic model states and weights for hunchback P2 with two Runt binding sites in the presence of Runt-Runt-RNAP higher-order cooperativity. (C) Histograms showing the posterior distribution of the inferred parameter from the best MCMC fit shown in Figure 6D. The black line represents the mean and the dotted lines represent standard deviation from the mean.
Figure 6—figure supplement 6
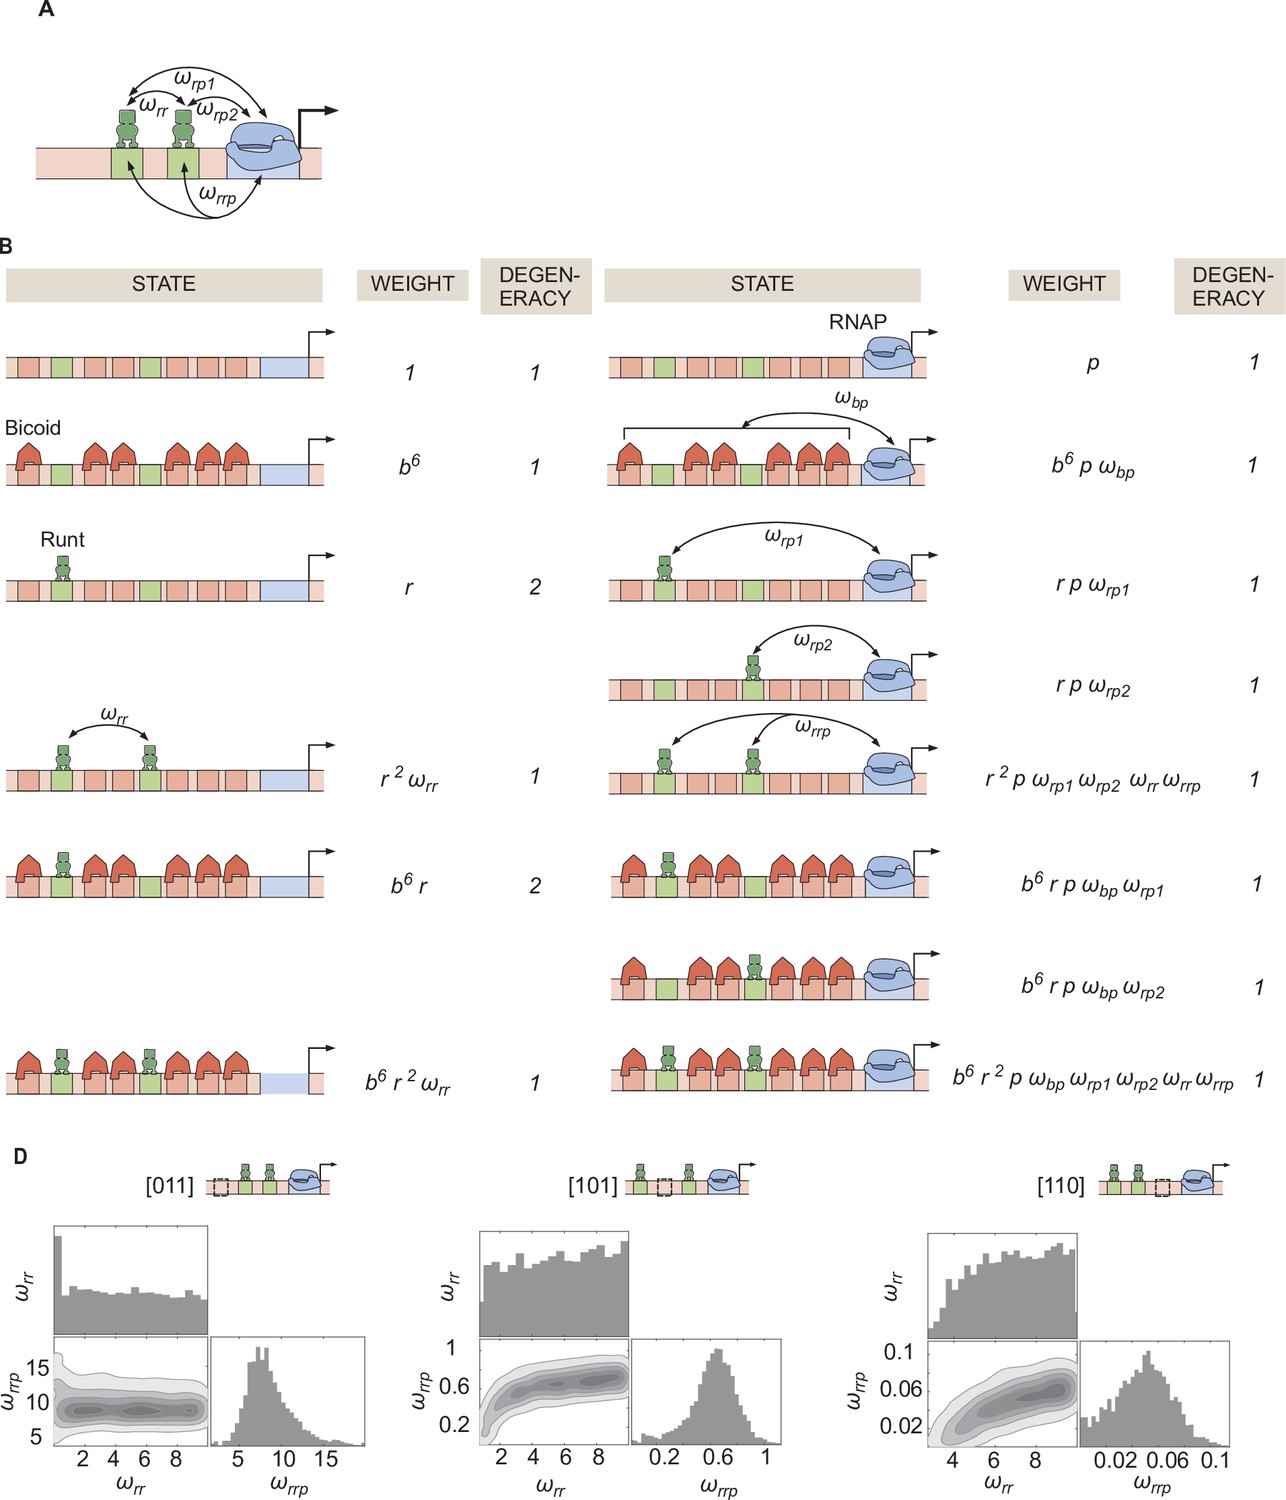
Invoking Runt-Runt cooperativity and higher-order cooperativity can explain the experimental data from hunchback P2 with two Runt binding sites.
(A) Schemati showing Runt-Runt cooperativity and higher-order cooperativity. (B) States and weights for hunchback P2 with two Runt binding sites with Runt-Runt cooperativity and higher-order cooperativity. (C) Corner plots associated with the MCMC inference performed on two-Runt binding sites data from the best MCMC fit shown in Figure 6E. While is not very well constrained, shows a unique optimal value.
Figure 6—figure supplement 7
Sensitivity test for by repeating the MCMC inference for different scenarios of cooperativities with different values of .
(A) Direct repression model for hunchback P2 with two-Runt binding sites featuring Runt-RNAP interaction terms given by and , Runt-Runt cooperativity captured by , and Runt-Runt-RNAP higher-order cooperativity accounted for by . (B) Parameter-free model prediction for a two-Runt binding site construct ([110]) with different values (Left: inferred from Figure 5; Center: ; Right: ) in the case where the two Runt molecules bind the DNA and interact with RNAP independently of each other. (C,D,E) Best MCMC fits to the data for a two-Runt binding site construct ([110]) with different values for models with various combinations of cooperativity parameters (Left: inferred from Figure 5; Center: ; Right: ). (C) Model incorporating Runt-Runt cooperativity. (D) Model incorporating Runt-Runt-RNAP higher-order cooperativity. (E) Model accounting for both Runt-Runt cooperativity and Runt-Runt-RNAP higher-order cooperativity.
Figure 7
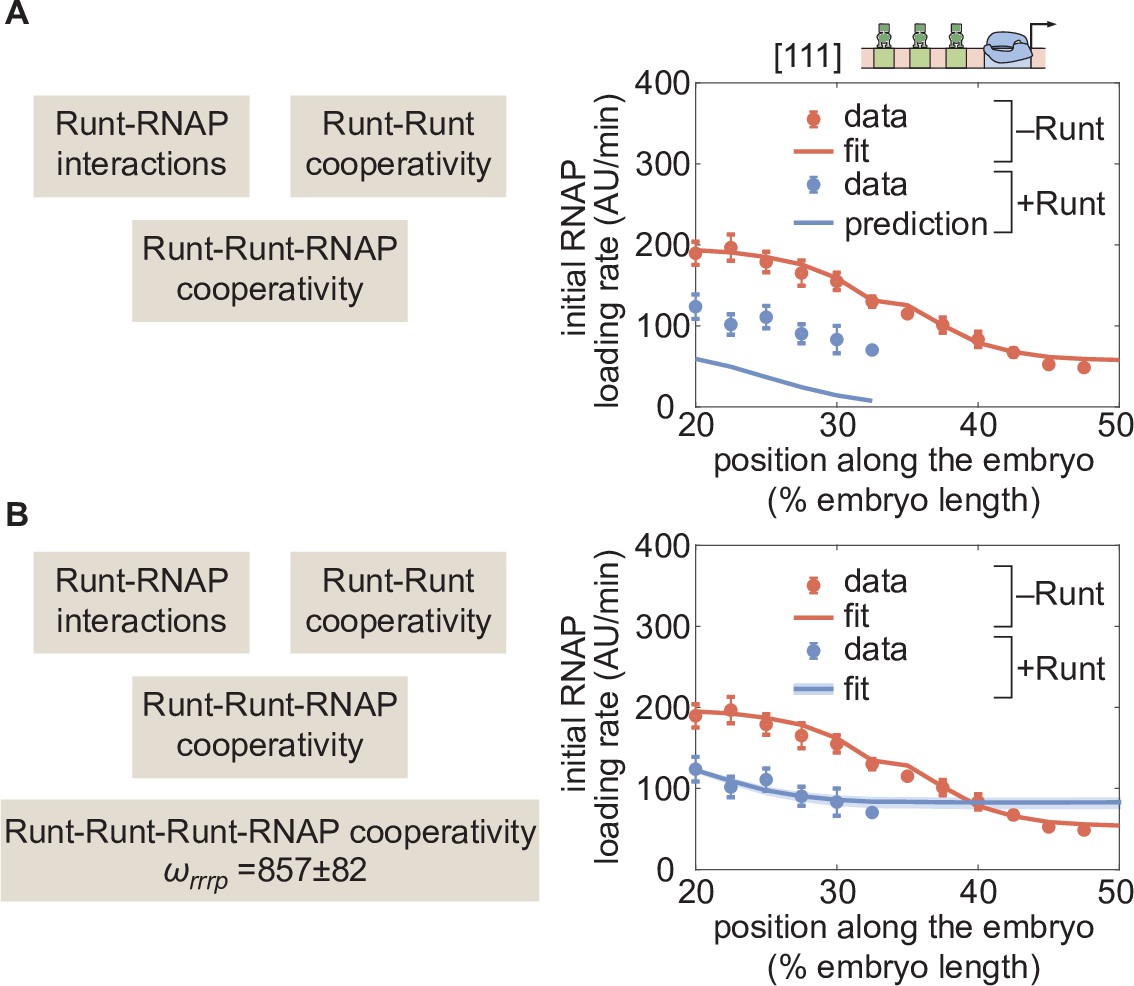
Prediction for hunchback P2 with three-Runt binding sites and multiple sources of cooperativity.
(A) Prediction using previously inferred Runt-RNAP, Runt-Runt, and Runt-Runt-RNAP cooperativity parameters. (B) Best MCMC fit obtained by incorporating an additional Runt-Runt-Runt-RNAP higher-order cooperativity parameter of , corresponding to roughly of free energy. (A,B, data points represent mean and standard error of the mean over>3 embryos; B, shaded regions represent 95% confidence intervals for the best MCMC fit.).
Author response image 1
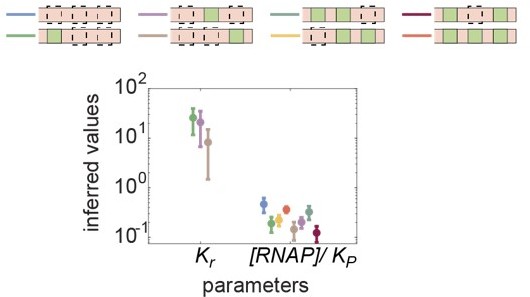
Inferred values of Kr and [RNAP]/Kp across all synthetic enhancer constructs.
Kr is inferred from one-Runt binding site constructs, and [RNAP]/Kp is inferred from all constructs in the absence of Runt protein.
Author response image 2
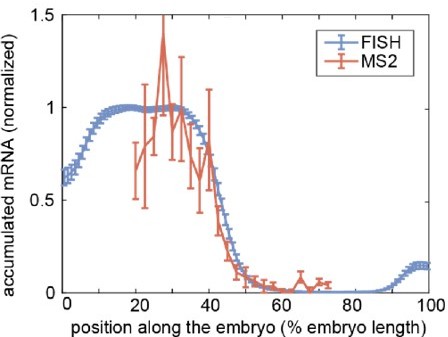
Comparison of accumulated mRNA profiles measured by FISH and MS2 for a reporter construct driven by the hunchback P2 enhancer.
Normalized profiles of accumulated mRNA averaged over embryos from FISH (blue, Park et al., eLife 8:e41266, 2019) and MS2 (red, Eck and Liu et al., eLife 9:e56429). The blue and red curves show the mean and standard error of the mean over 16 and 9 embryos, respectively. The accumulated mRNA profiles were normalized to the average level within 25%-35% of the embryo length.
Tables
Table 1
Interaction energies for the Runt-related cooperativity parameters from one-, two-, and three-Runt sites constructs.
Note that we used the Boltzmann relation of , where the is the interaction energy, is the Boltzmann constant, and is the temperature.
| Interaction energies for the Runt-related cooperativity parameters | ||
|---|---|---|
| model parameter | construct | interaction energy (KBT) |
| Runt-RNAP interaction, | [001] | 2.34 ± 0.63 |
| [010] | 1.36 ± 0.36 | |
| [100] | 0.18 ± 0.24 | |
| Runt-Runt interaction, | [011] | 0 (manually set) |
| [110] | -0.95 ± 0.12 | |
| [101] | 0 (manually set) | |
| Runt-Runt-RNAP interaction, | [011] | -2.09 ± 0.27 |
| [110] | 4.15 ± 1.14 | |
| [101] | 1.12 ± 0.51 | |
| Runt-Runt-Runt-RNAP interaction, | [111] | -2.12 ± 0.14 |
Table 2
List of plasmids used to create the transgenic fly lines used in this study.
| Plasmids | |
|---|---|
| Name (hyperlinked to Benchling) | Function |
| pIB-hbP2-evePr-MS2v5-LacZ-Tub3UTR | [000]-MS2v5 reporter construct |
| pIB-hbP2+r1-far-evePr-MS2v5-LacZ-Tub3UTR | [100]-MS2v5 reporter construct |
| pIB-hbP2+r1-mid-evePr-MS2v5-LacZ-Tub3UTR | [010]-MS2v5 reporter construct |
| pIB-hbP2+r1-close-evePr-MS2v5-LacZ-Tub3UTR | [001]-MS2v5 reporter construct |
| pIB-hbP2+r2-2+3-evePr-MS2v5-LacZ-Tub3UTR | [011]-MS2v5 reporter construct |
| pIB-hbP2+r2-1+3-evePr-MS2v5-LacZ-Tub3UTR | [101]-MS2v5 reporter construct |
| pIB-hbP2+r2-1+2-evePr-MS2v5-LacZ-Tub3UTR | [110]-MS2v5 reporter construct |
| pIB-hbP2+r3-evePr-MS2v5-LacZ-Tub3UTR | [111]-MS2v5 reporter construct |
| pHD-scarless-LlamaTag-Runt | Donor plasmid for LlamaTag-Runt CRISPR knock-in fusion for the N-terminal |
| pU6:3-gRNA(Runt-N-2) | gRNA plasmid for LlamaTag-Runt CRISPR knock-in fusion for the N-terminal |
| pCasper-vasa-eGFP | vasa maternal driver for ubiquitous eGFP expression in the early embryo |
Table 3
List of fly lines used in this study and their experimental usage.
| Fly lines | |
|---|---|
| Genotype | Use |
| LlamaTag-Runt; +; vasa-eGFP, His2Av-iRFP | Visualize LlamaTagged Runt protein and label nuclei |
| LlamaTag-Runt; +; MCP-eGFP(4F), His2Av-iRFP | Visualize LlamaTagged Runt protein, nascent transcripts and label nuclei |
| run3/FM6; +; + | Visualize LlamaTagged Runt protein, nascent transcripts and label nuclei |
| yw; His2Av-mRFP; MCP-eGFP | Females to label nascent RNA and nuclei |
| yw; [000]-MS2v5; + | Males carrying the MS2 reporter transgene |
| yw; [100]-MS2v5; + | Males carrying the MS2 reporter transgene |
| yw; [010]-MS2v5; + | Males carrying the MS2 reporter transgene |
| yw; [001]-MS2v5; + | Males carrying the MS2 reporter transgene |
| yw; [011]-MS2v5; + | Males carrying the MS2 reporter transgene |
| yw; [101]-MS2v5; + | Males carrying the MS2 reporter transgene |
| yw; [110]-MS2v5; + | Males carrying the MS2 reporter transgene |
| yw; [111]-MS2v5; + | Males carrying the MS2 reporter transgene |
Additional files
Download links
A two-part list of links to download the article, or parts of the article, in various formats.
Downloads (link to download the article as PDF)
Open citations (links to open the citations from this article in various online reference manager services)
Cite this article (links to download the citations from this article in formats compatible with various reference manager tools)
Predictive modeling reveals that higher-order cooperativity drives transcriptional repression in a synthetic developmental enhancer
eLife 11:e73395.
https://doi.org/10.7554/eLife.73395


