Thermosynechococcus switches the direction of phototaxis by a c-di-GMP-dependent process with high spatial resolution
- Department of Engineering Science, Graduate School of Informatics and Engineering, The University of Electro-Communications, Japan
- Institute of Biology III, University of Freiburg, Germany
- Research Core Unit Metabolomics, Hannover Medical School, Germany
- Department of Applied Chemistry and Life Science, Toyohashi University of Technology, Japan
- BIOSS Centre for Biological Signaling Studies, University of Freiburg, Germany
- Department of Physics, Gakushuin University, Japan
Figures
Figure 1
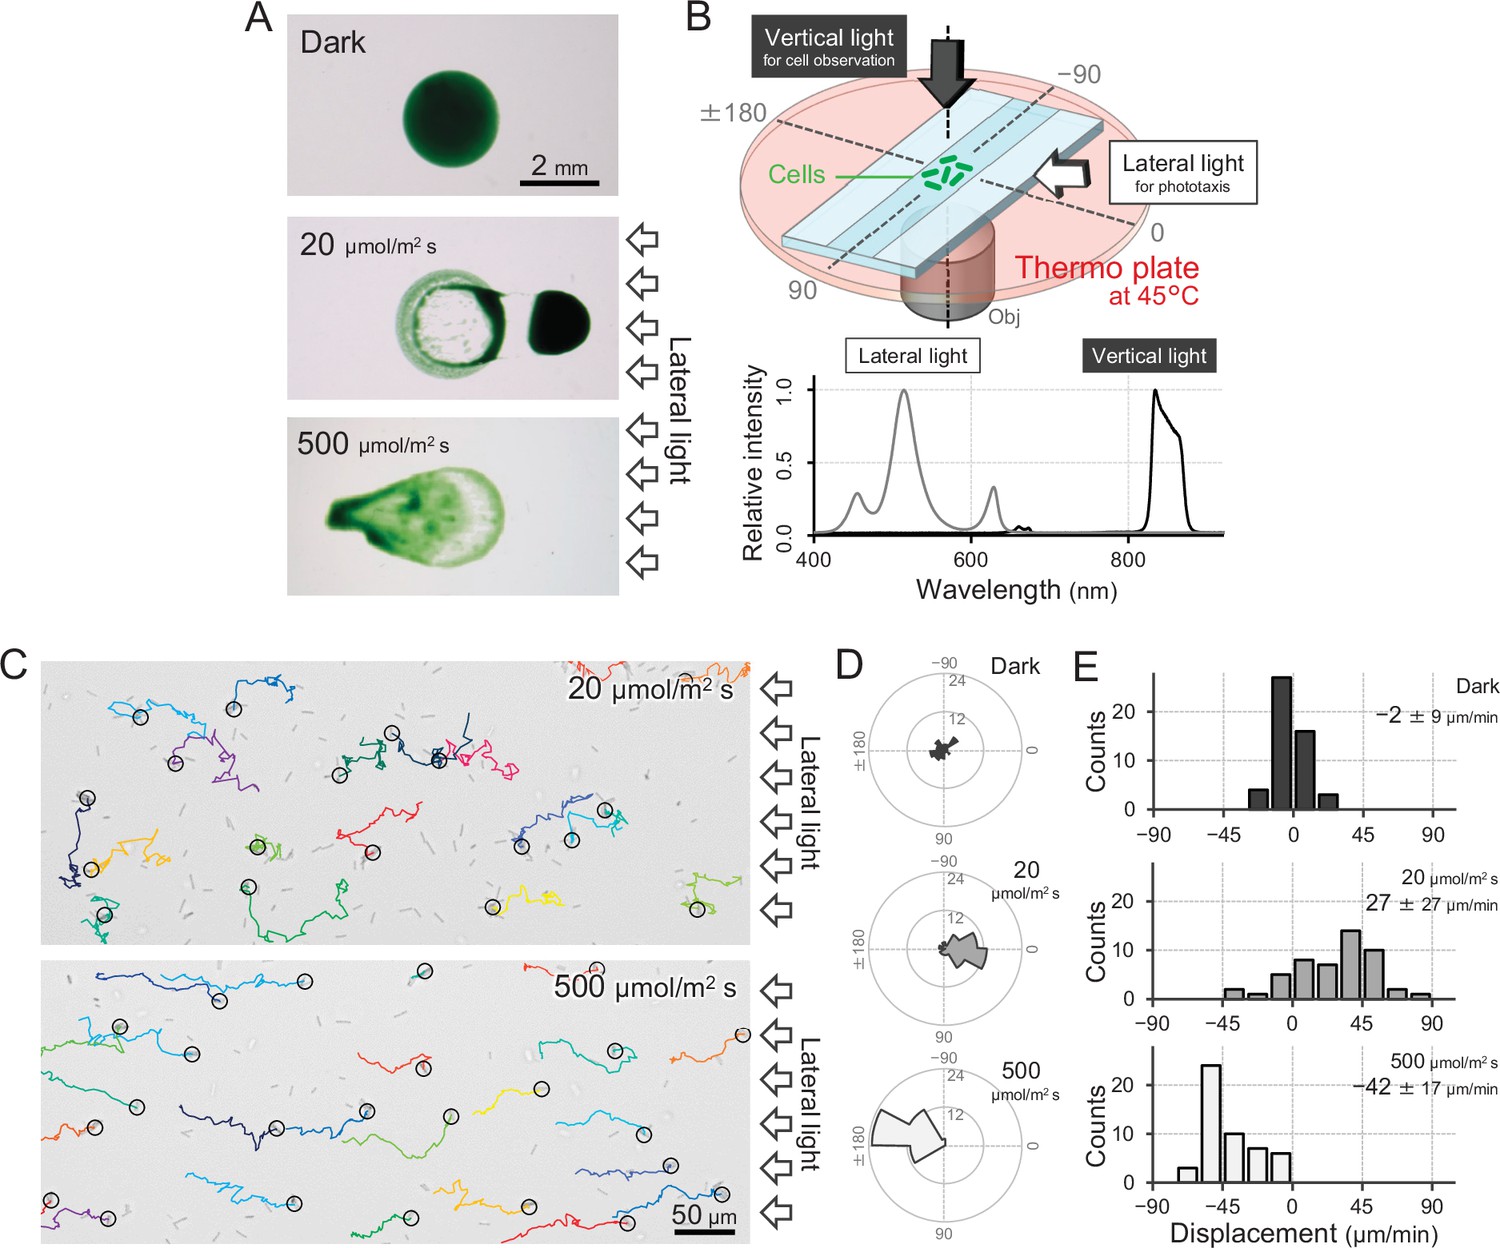
Positive and negative phototaxis of T.
vulcanus. (A) Phototaxis on agar plates. Images were taken 8 hr after spotting the cell suspension. (B) Diagram of the experimental setup to visualize single cellular behaviour under optical microscopy. The glass chamber was heated at 45°C with a thermoplate on a microscope stage. Vertical and lateral light sources were used for cell observation and stimulation of phototaxis, respectively. Light spectra are presented at the bottom. (C) Bright-field cell image and their moving trajectories for 120 s (colour lines) on a glass surface. The cell at the start position of a trajectory is marked by the black circle. The white arrows on the right side of the image represent the direction of the light axis. (D) Rose plots under dark, weak light, and strong light illumination. The moving direction of a cell that translocated more than 6 μm min−1 was counted. Angle 0 was the direction towards the lateral light source (N = 50 cells). (E) Histograms of the cell displacement along the lateral light axis. The cell displacement for a duration of 1 min was measured at 4 min after lateral illumination was turned on (N = 50 cells). Cell movements towards the light source are shown as a positive value.
-
Figure 1—source data 1
Rose plots.
- https://cdn.elifesciences.org/articles/73405/elife-73405-fig1-data1-v1.xlsx
-
Figure 1—source data 2
Cell displacement.
- https://cdn.elifesciences.org/articles/73405/elife-73405-fig1-data2-v1.xlsx
Figure 2 with 6 supplements
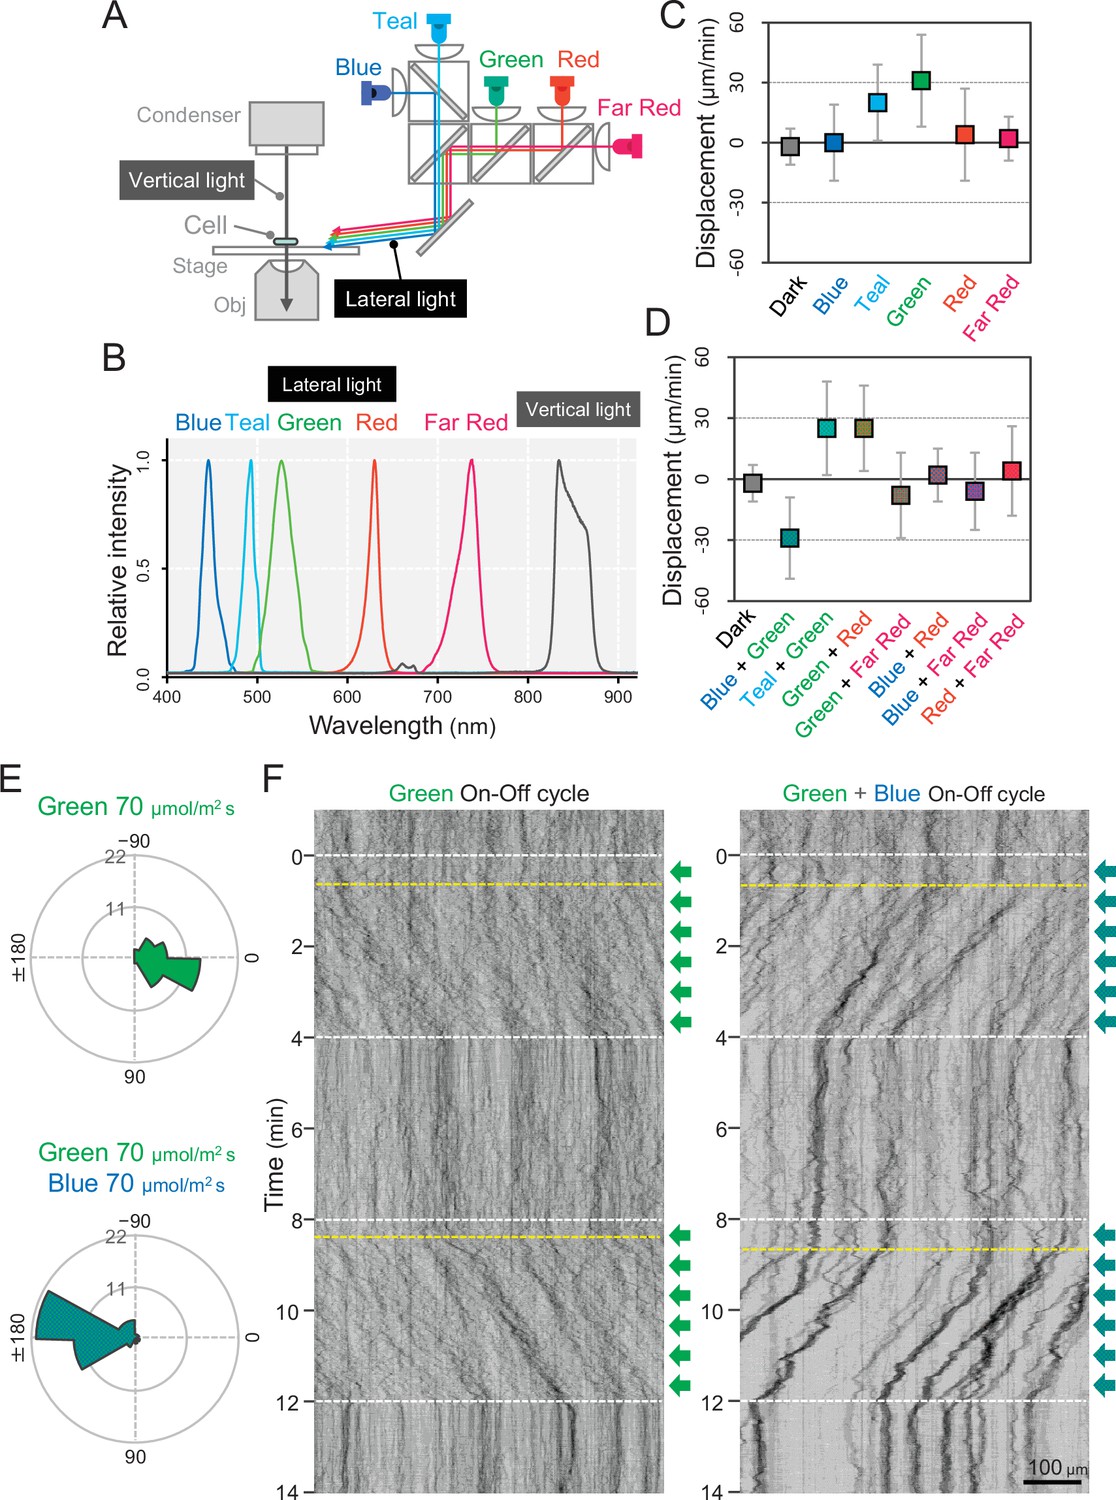
Wavelength dependency of phototaxis via optical microscopy.
(A) Schematics of the lateral illumination for phototaxis. Five LEDs were simultaneously applied through dichroic mirrors from the right side. (B) Spectra of lateral and vertical light for phototaxis. (C) Effects of the monochromatic light source on the phototactic behaviour of cells on a glass surface. (D) Effects of dichromatic light source on the phototactic behaviour of cells over the glass surface. Each lateral light was used at a fluence rate of 70 μmol m−2 s−1. The average and standard deviation (SD) of the cell displacement along the light axis are presented (N = 50). (E) Rose plots under green light at 70 μmol m−2 s−1 (upper) and green and blue light at 70 μmol m−2 s−1 (lower). The moving direction of a cell that translocated more than 6 μm min−1 was counted. Angle 0 was the direction towards the lateral light source (N = 50 cells). (F) On–off control of phototaxis. A kymogram of cell movements along the optical axis of lateral illumination is presented. Directional movements of cells are shown by the tilted lines over time. The tilted lines from the left-upper to the right-lower side and from the right-upper to the left-lower side presented positive and negative phototaxis, respectively. Lateral illumination was applied with a time interval of 4 min and indicated by the dashed white lines (see also Videos 5 and 6). The delay of the cell response after the illumination was turned on is indicated by the dashed yellow lines.
-
Figure 2—source data 1
Effects of the light source on the phototactic behaviour of cells on a glass surface.
- https://cdn.elifesciences.org/articles/73405/elife-73405-fig2-data1-v1.xlsx
-
Figure 2—source data 2
Rose plots.
- https://cdn.elifesciences.org/articles/73405/elife-73405-fig2-data2-v1.xlsx
Figure 2—figure supplement 1
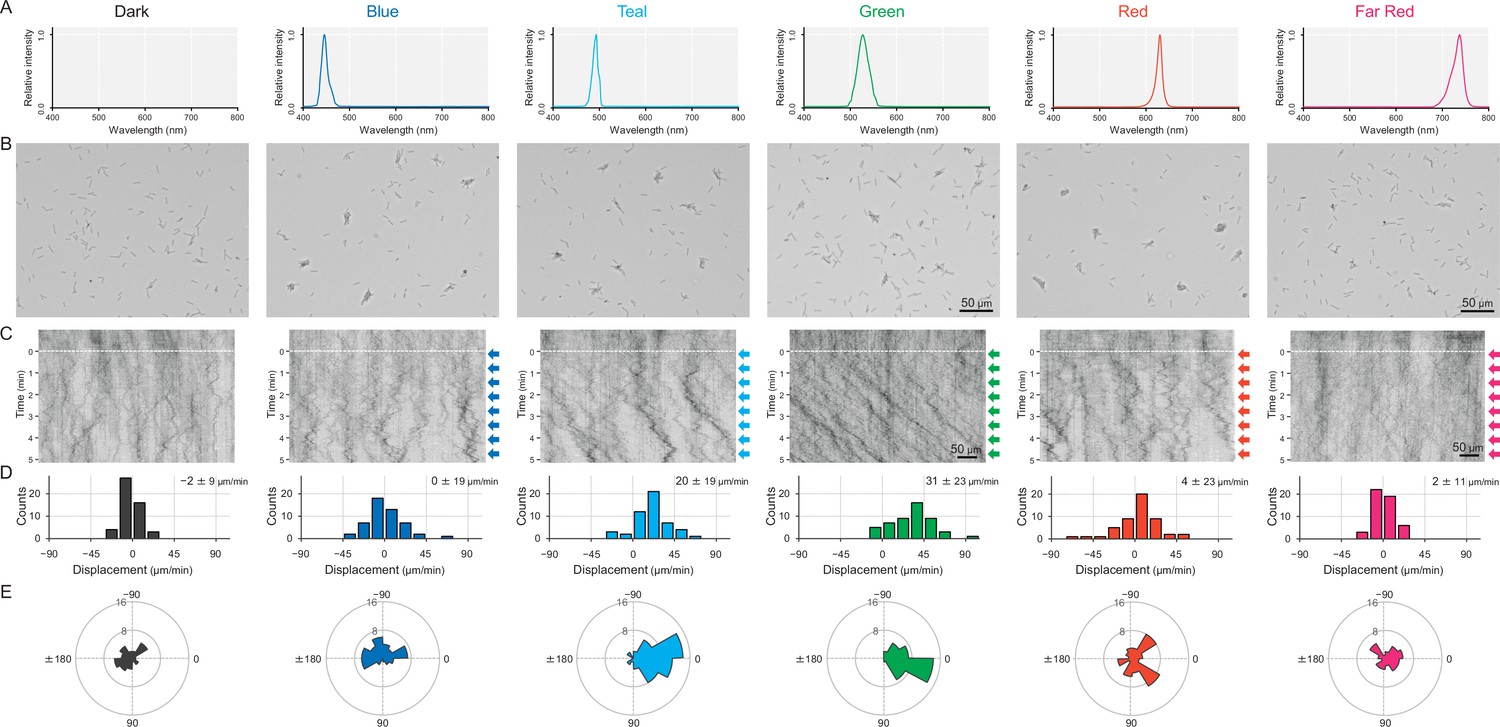
Cell movement after applying a monochromatic light source.
(A) Spectra of each LED used for stimulation. No lateral illumination in the dark condition. Infrared light was used for cell observation from a halogen lamp through a bandpass filter (see more detail in Figure 2A,B and Materials and methods). (B) Cell images at 4 min after the lateral light was turned on. Lateral light from each LED was adjusted at a fluence rate of 70 μmol m−2 s−1 and applied from the right side of the image. (C) Kymograph of cell movements along the optical axis of lateral illumination. Directional movements of cells are presented by the tilted lines over time. Lateral light illumination was turned on at time 0, presented as a dashed white line. (D) Histograms of the cell displacement along the lateral light axis. Cell movements towards the light source are shown as a positive value. (E) Rose plots. The moving direction of a cell that translocated more than 6 μm min−1 was counted. Angle 0 was the direction towards the lateral light source. The cell displacement for a duration of 1 min was measured at 4 min after lateral illumination was turned on (N = 50 cells).
Figure 2—figure supplement 2
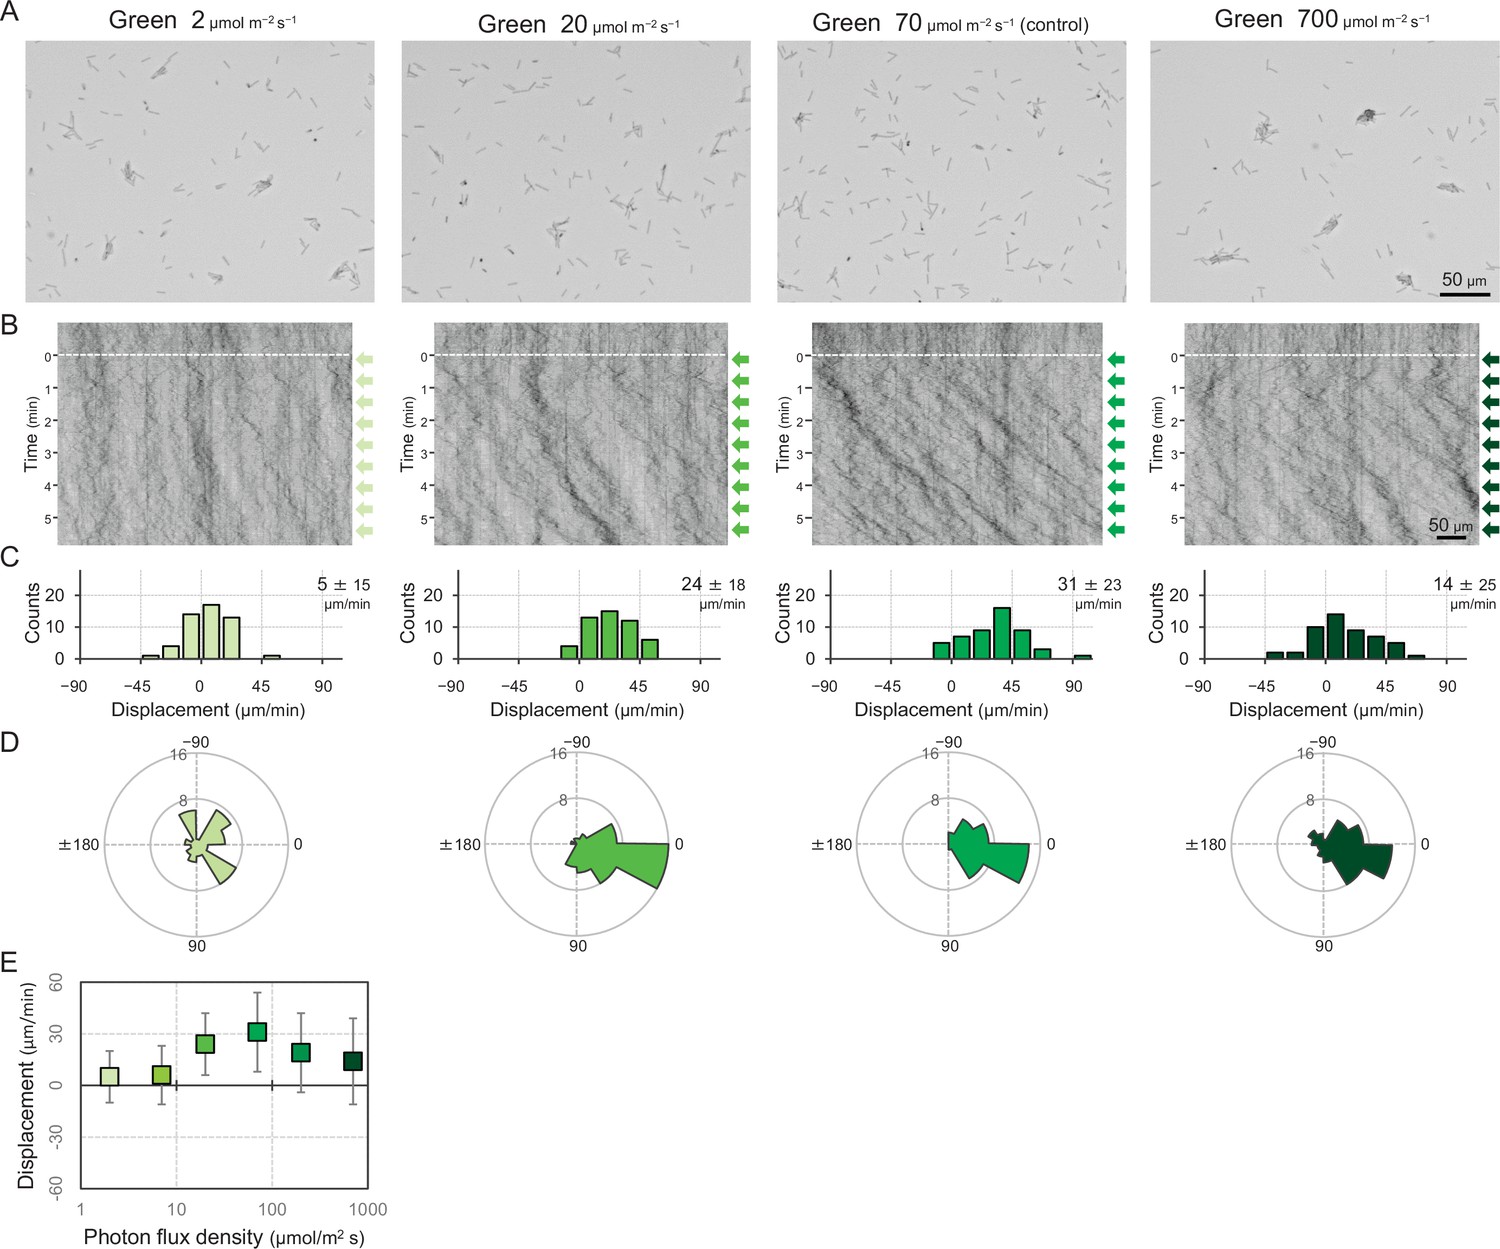
Cell movement at various fluence rates of a lateral green light.
(A) Cell images at 4 min after the lateral light was turned on. (B) Kymograph of cell movements along the optical axis of lateral illumination. Directional movements of cells are presented by the tilted lines over time. Lateral light illumination was turned on at time 0, presented as a dashed white line. (C) Histograms of the cell displacement along the lateral light axis. Cell movements towards the light source are shown as a positive value. (D) Rose plots. The moving direction of a cell that translocated more than 6 μm min−1 was counted. Angle 0 was the direction towards the lateral light source. The cell displacement for a duration of 1 min was measured at 4 min after lateral illumination was turned on (N = 50 cells). (E) Effects of the fluence rate on the phototactic behaviour of cells. The average and standard deviation (SD) of the cell displacement along the light axis are presented (N = 50).
Figure 2—figure supplement 3
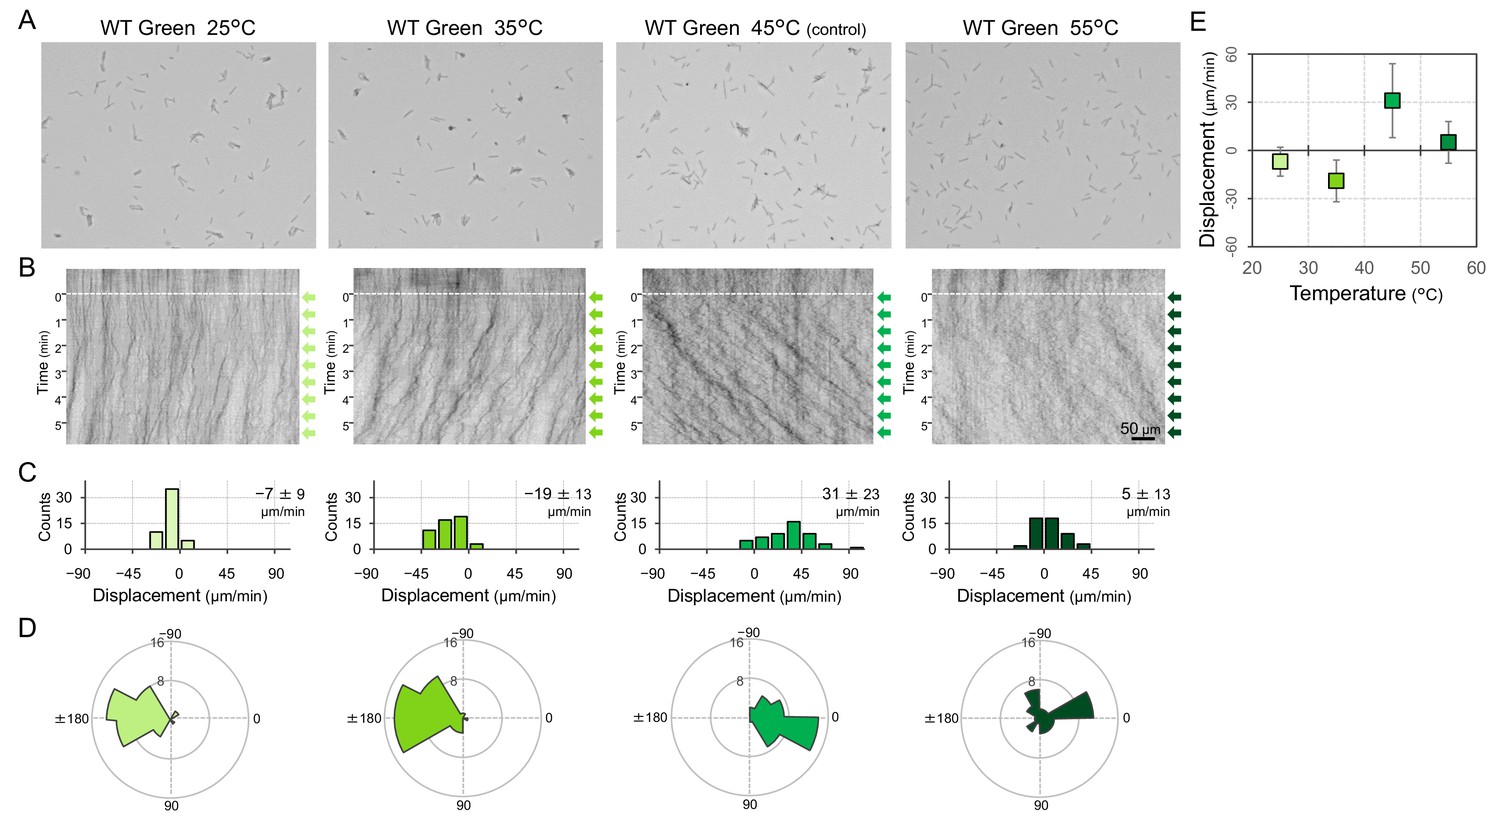
Phototactic behaviour of wild type (WT) cells at various temperatures.
Lateral light from a single LED was adjusted to a fluence rate of 70 μmol m−2 s−1 and applied from the right side of the image. (A) Cell image at 4 min after the lateral light was turned on. (B) Kymograph of cell movements along the optical axis of lateral illumination. Directional movements of cells are presented by the tilted lines over time. Lateral light illumination was turned on at time 0, presented as a dashed white line. (C) Histograms of the cell displacement along the lateral light axis. Cell movements towards the light source are shown as a positive value. (D) Rose plots. The moving direction of a cell that translocated more than 6 μm min−1 was counted. Angle 0 was the direction towards the lateral light source. The cell displacement for a duration of 1 min was measured at 4 min after lateral illumination was turned on (N = 50 cells). (E) Effects of the fluence rate on the phototactic behaviour of WT cells. The average and standard deviation (SD) of the cell displacement along the light axis are presented (N = 50).
Figure 2—figure supplement 4
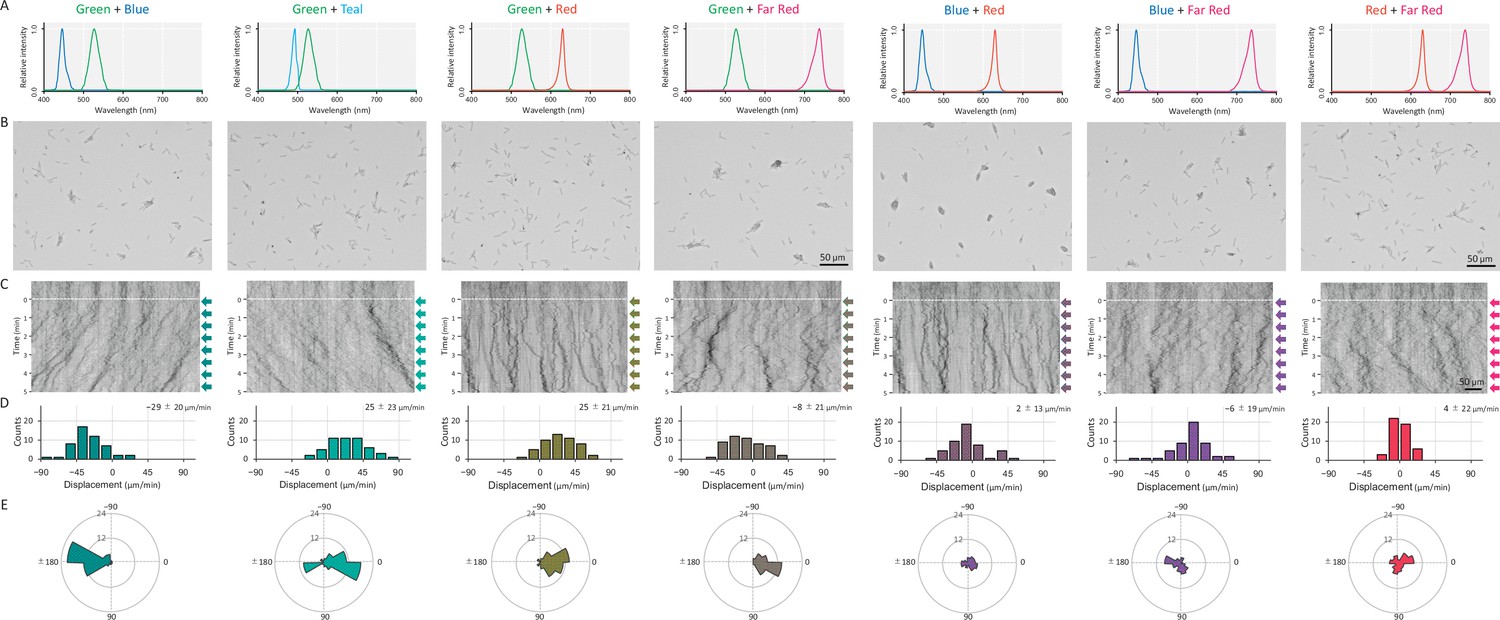
Cell movement after applying a dichromatic light source.
(A) Spectra of two LEDs used for stimulation. (B) Cell images at 4 min after the lateral light was turned on. Lateral light from two LEDs was adjusted at a fluence rate of 70 μmol m−2 s−1 for each LED and applied from the right side of the image. (C) Kymograph of cell movements along the optical axis of lateral illumination. Directional movements of cells are presented by the tilted lines over time. Lateral light illumination was turned on at time 0, presented as a dashed white line. (D) Histograms of the cell displacement along the lateral light axis. Cell movements towards the light source are shown as a positive value. (E) Rose plots. The moving direction of a cell that translocated more than 6 μm min−1 was counted. Angle 0 was the direction towards the lateral light source. The cell displacement for a duration of 1 min was measured at 4 min after lateral illumination was turned on (N = 50 cells).
Figure 2—figure supplement 5
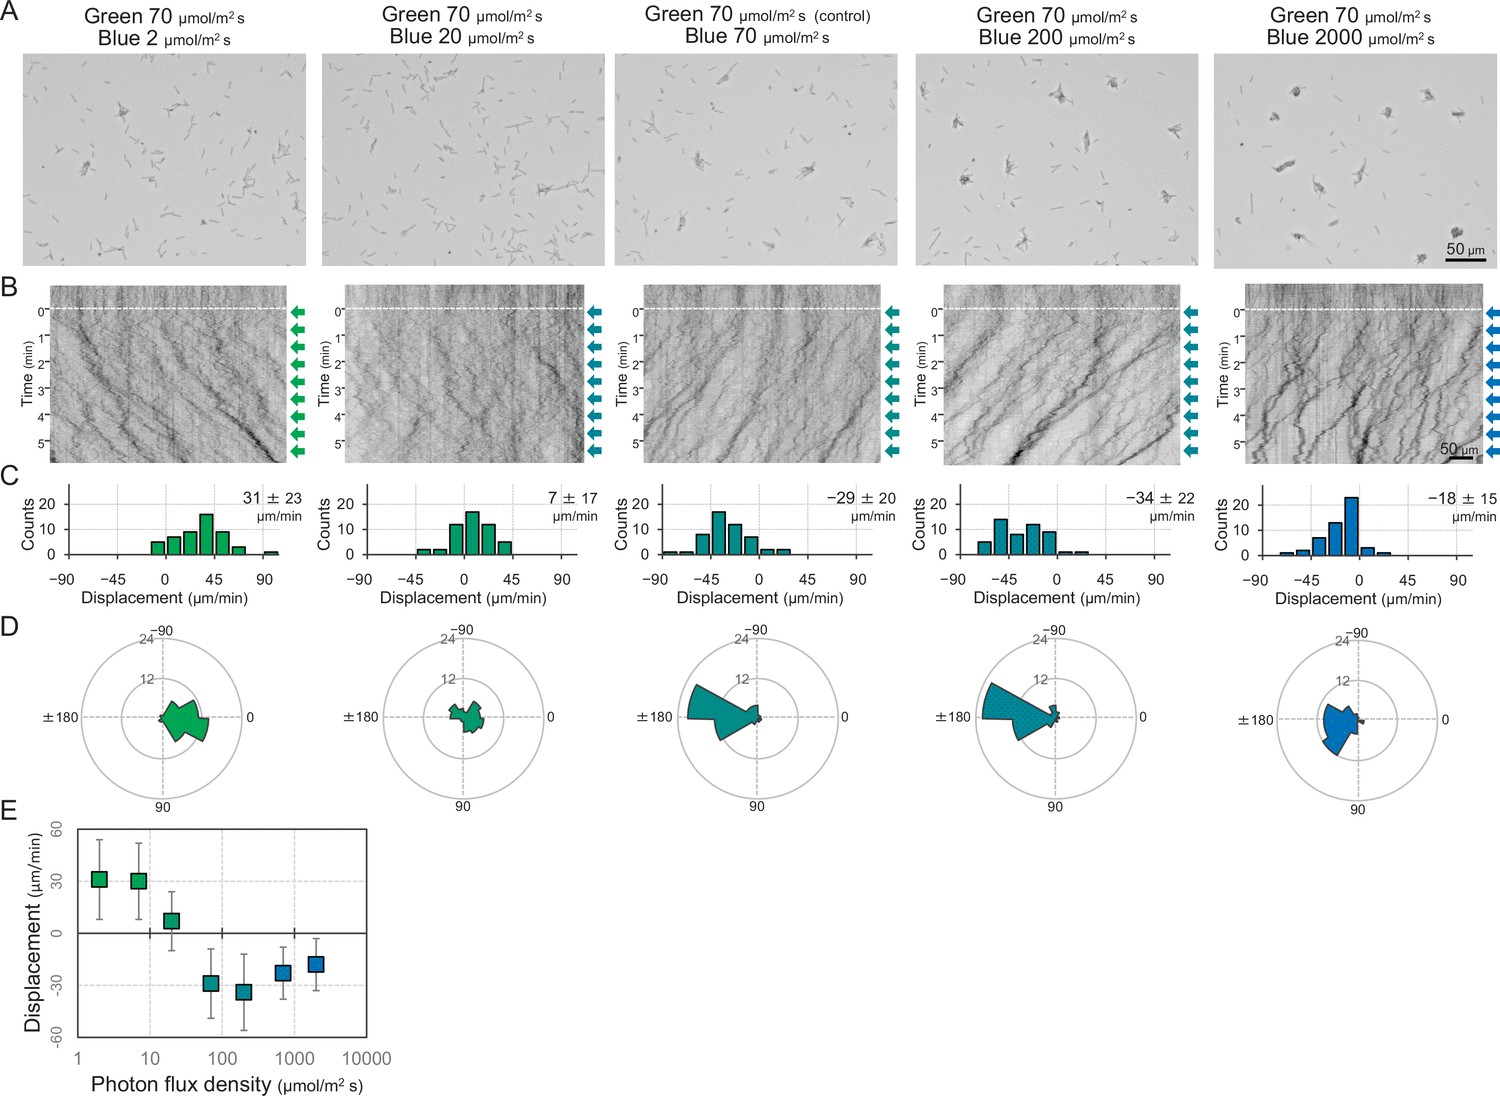
Dose dependency of blue light to induce negative phototaxis.
Lateral blue light was adjusted at various fluence rates, while lateral green light was fixed at 70 μmol m−2 s−1, as presented at the top. (A) Cell images at 4 min after the lateral light was turned on. (B) Kymograph of cell movements along the optical axis of lateral illumination. Directional movements of cells are presented by the tilted lines over time. Lateral light illumination was turned on at time 0, presented as a dashed white line. (C) Histograms of the cell displacement along the lateral light axis. Cell movements towards the light source are shown as a positive value. (D) Rose plots. The moving direction of a cell that translocated more than 6 μm min−1 was counted. Angle 0 was the direction towards the lateral light source. The cell displacement for a duration of 1 min was measured at 4 min after lateral illumination was turned on (N = 50 cells). (E) Effects of the fluence rate of blue light to induce negative phototaxis. The average and standard deviation (SD) of the cell displacement along the light axis are presented (N = 50).
Figure 2—figure supplement 6
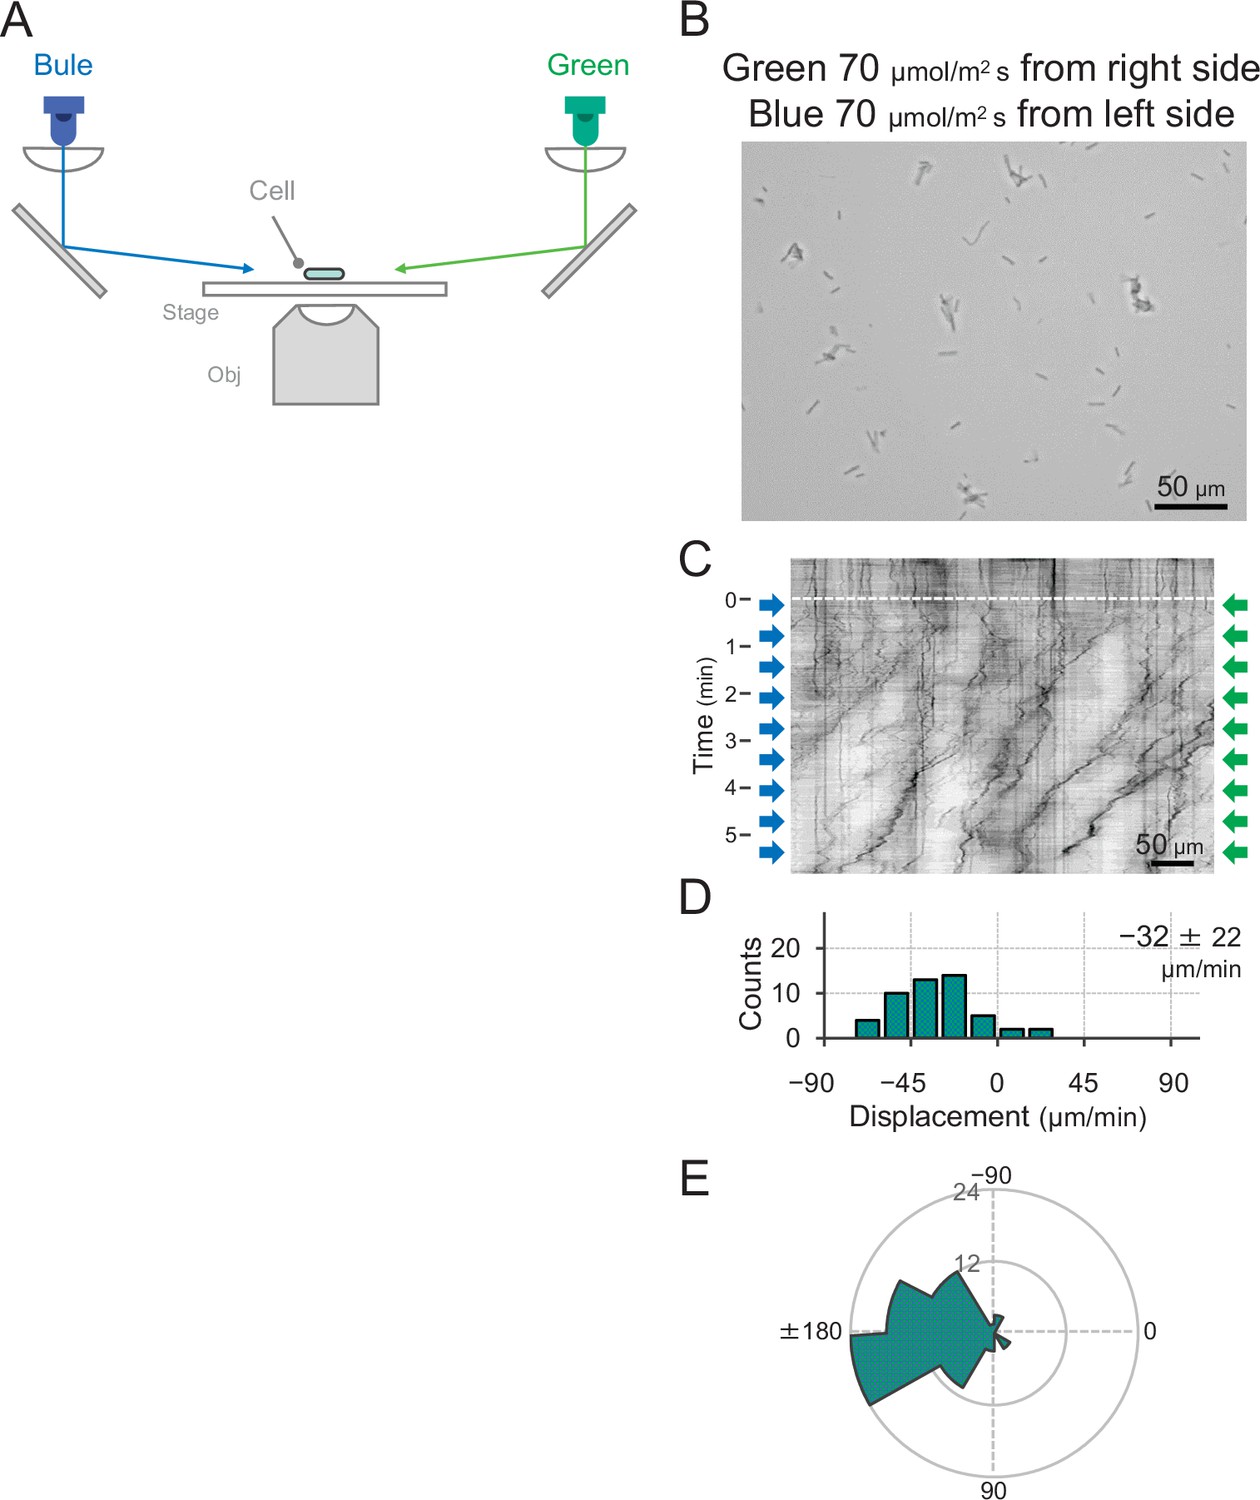
Effect of blue light illumination from the other side of green light on phototaxis.
(A) Schematic of the lateral light illumination. Blue and green light were applied from the left and right sides of the image at 70 μmol m−2 s−1, respectively. (B) Cell images at 4 min after the lateral light was turned on. (C) Kymograph of cell movements along the optical axis of lateral illumination. Directional movements of cells are presented by the tilted lines over time. Lateral light illumination was turned on at time 0, presented as a dashed white line. (D) Histograms of the cell displacement along the lateral light axis. Cell movements towards the light source are shown as a positive value. The average and standard deviation (SD) of the cell displacement along the light axis are presented (N = 50). (E) Rose plots. The moving direction of a cell that translocated more than 6 μm min−1 was counted. Angle 0 was the direction towards the lateral light source of the green light. The cell displacement for a duration of 1 min was measured at 4 min after lateral illumination was turned on (N = 50 cells).
Figure 3 with 1 supplement
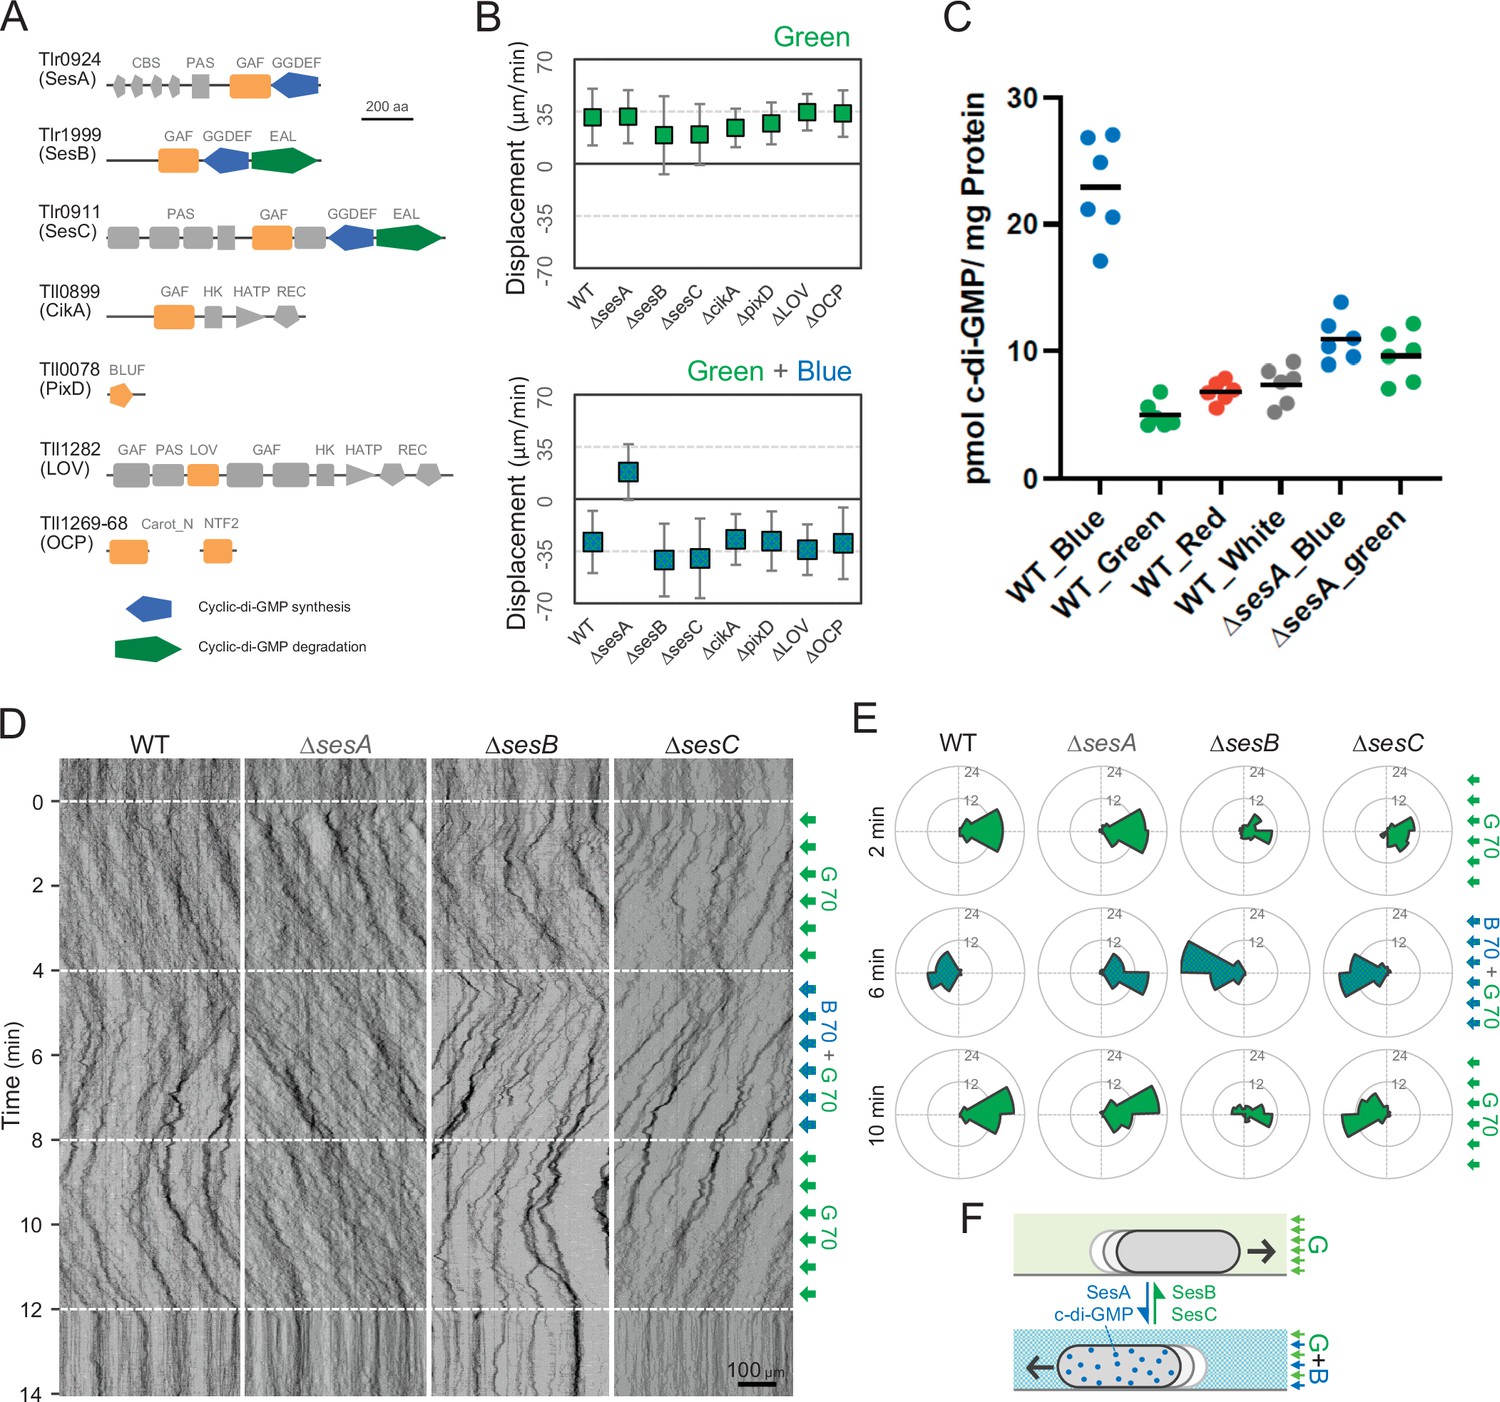
Photoreceptors for phototaxis.
(A) Domain composition of candidate photoreceptor-containing proteins in T. vulcanus. (B) Mutant cell behaviour after lateral light illumination. Upper: lateral green light at a fluence rate of 70 μmol m−2 s−1. Lower: lateral green and blue light at a fluence rate of 70 μmol m−2 s−1. The cell displacement for a duration of 1 min was measured at 3 min after lateral illumination was turned on (N = 50 cells). Cell movements towards the light source are shown as a positive value. (C) Intracellular cyclic dimeric GMP (c-di-GMP) concentrations in wild type (WT) and ∆sesA. The cells were cultivated under blue, green, red, or white light illumination for 30 min, and c-di-GMP was extracted and quantified. The shown data are biological triplicates with technical duplicates, and the mean values are given with the bars. (D) Kymograph of cell movements in the WT, ΔsesA, ΔsesB, and ΔsesC mutants along the optical axis of lateral illumination. The cell position was visualized by near-infrared light. Phototaxis was stimulated by the lateral illumination of green and green/blue light. Green light was applied from time 0 to 4 and from 8 to 12 min, and green/blue light was applied from time 4 to 8 min (see also Videos 7–10). (E) Rose plot. The moving direction of a cell that translocated more than 6 μm min−1 was counted. Lateral light was applied from the right side. The cell displacement was measured at each time point, as presented on the left (N = 50 cells). The data come from Panel D. (F) Schematic model of the reversal in phototaxis induced by the intracellular concentration of c-di-GMP.
-
Figure 3—source data 1
Mutant cell behaviour after lateral light illumination.
- https://cdn.elifesciences.org/articles/73405/elife-73405-fig3-data1-v1.xlsx
-
Figure 3—source data 2
Rose plots.
- https://cdn.elifesciences.org/articles/73405/elife-73405-fig3-data2-v1.xlsx
-
Figure 3—source data 3
Intracellular cyclic dimeric GMP (c-di-GMP) concentrations in wild type (WT) and ∆sesA.
- https://cdn.elifesciences.org/articles/73405/elife-73405-fig3-data3-v1.xlsx
Figure 3—figure supplement 1
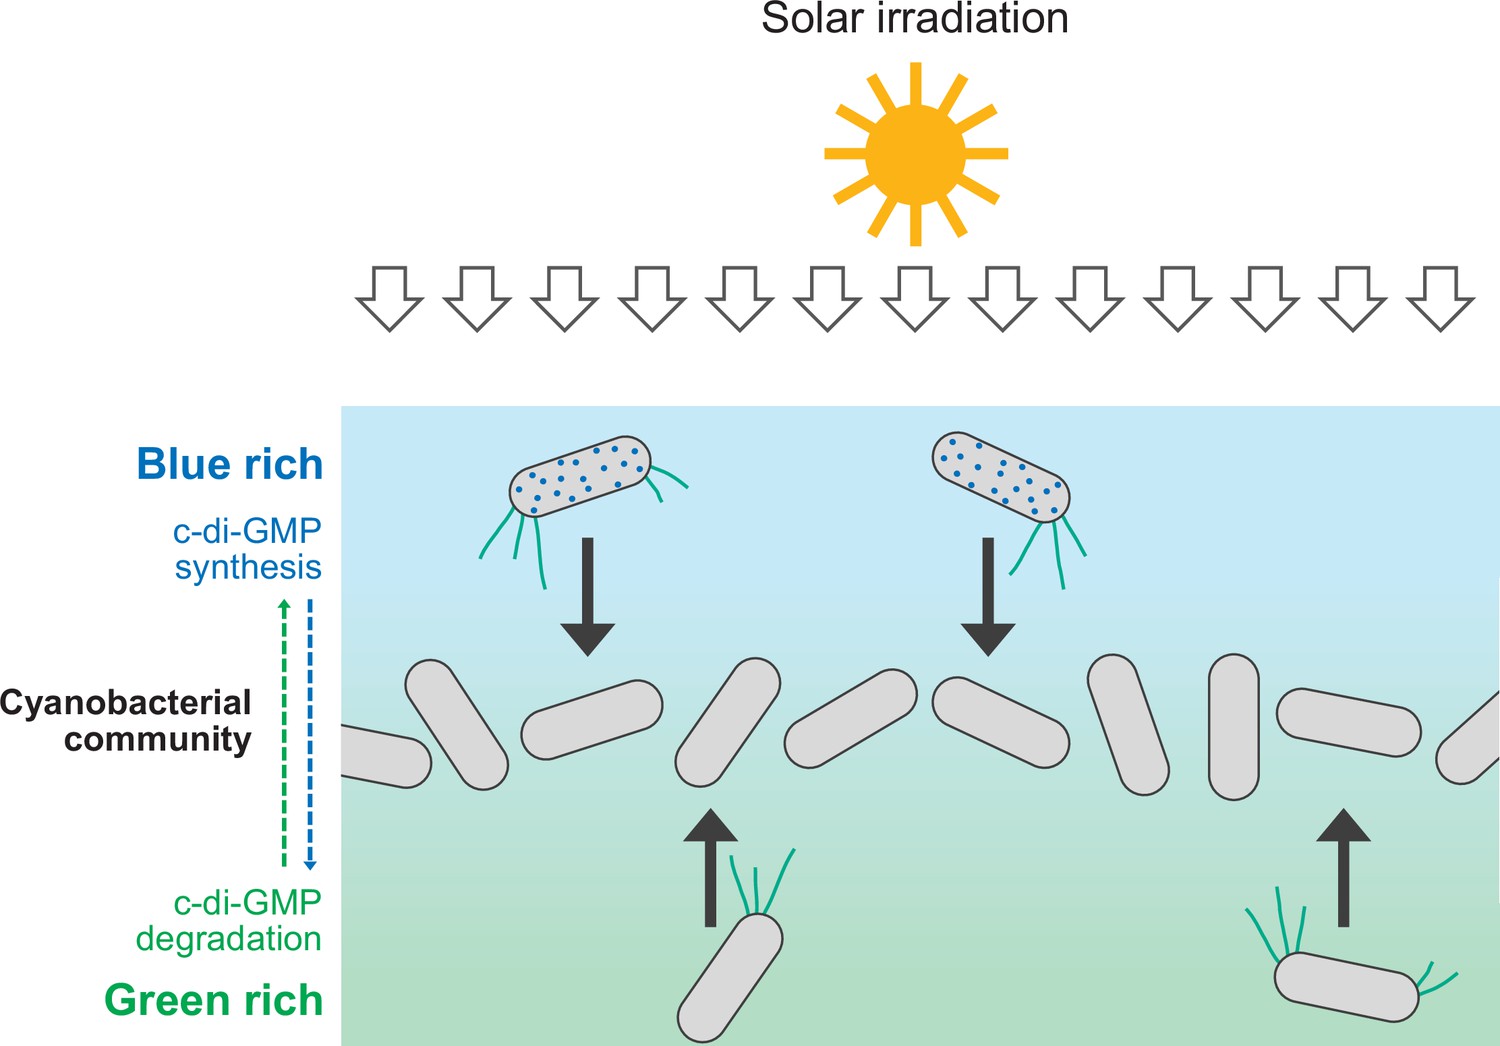
Schematic illustration of cellular cyclic dimeric GMP (c-di-GMP) levels and cell migration within a dense cyanobacterial community under solar irradiation.
Blue light is rich at the surface of such a community (e.g., a phototrophic mat in a hot spring). Synthesis of c-di-GMP induces downward migration at the surface, while degradation of c-di-GMP induces upward migration inside.
Figure 4
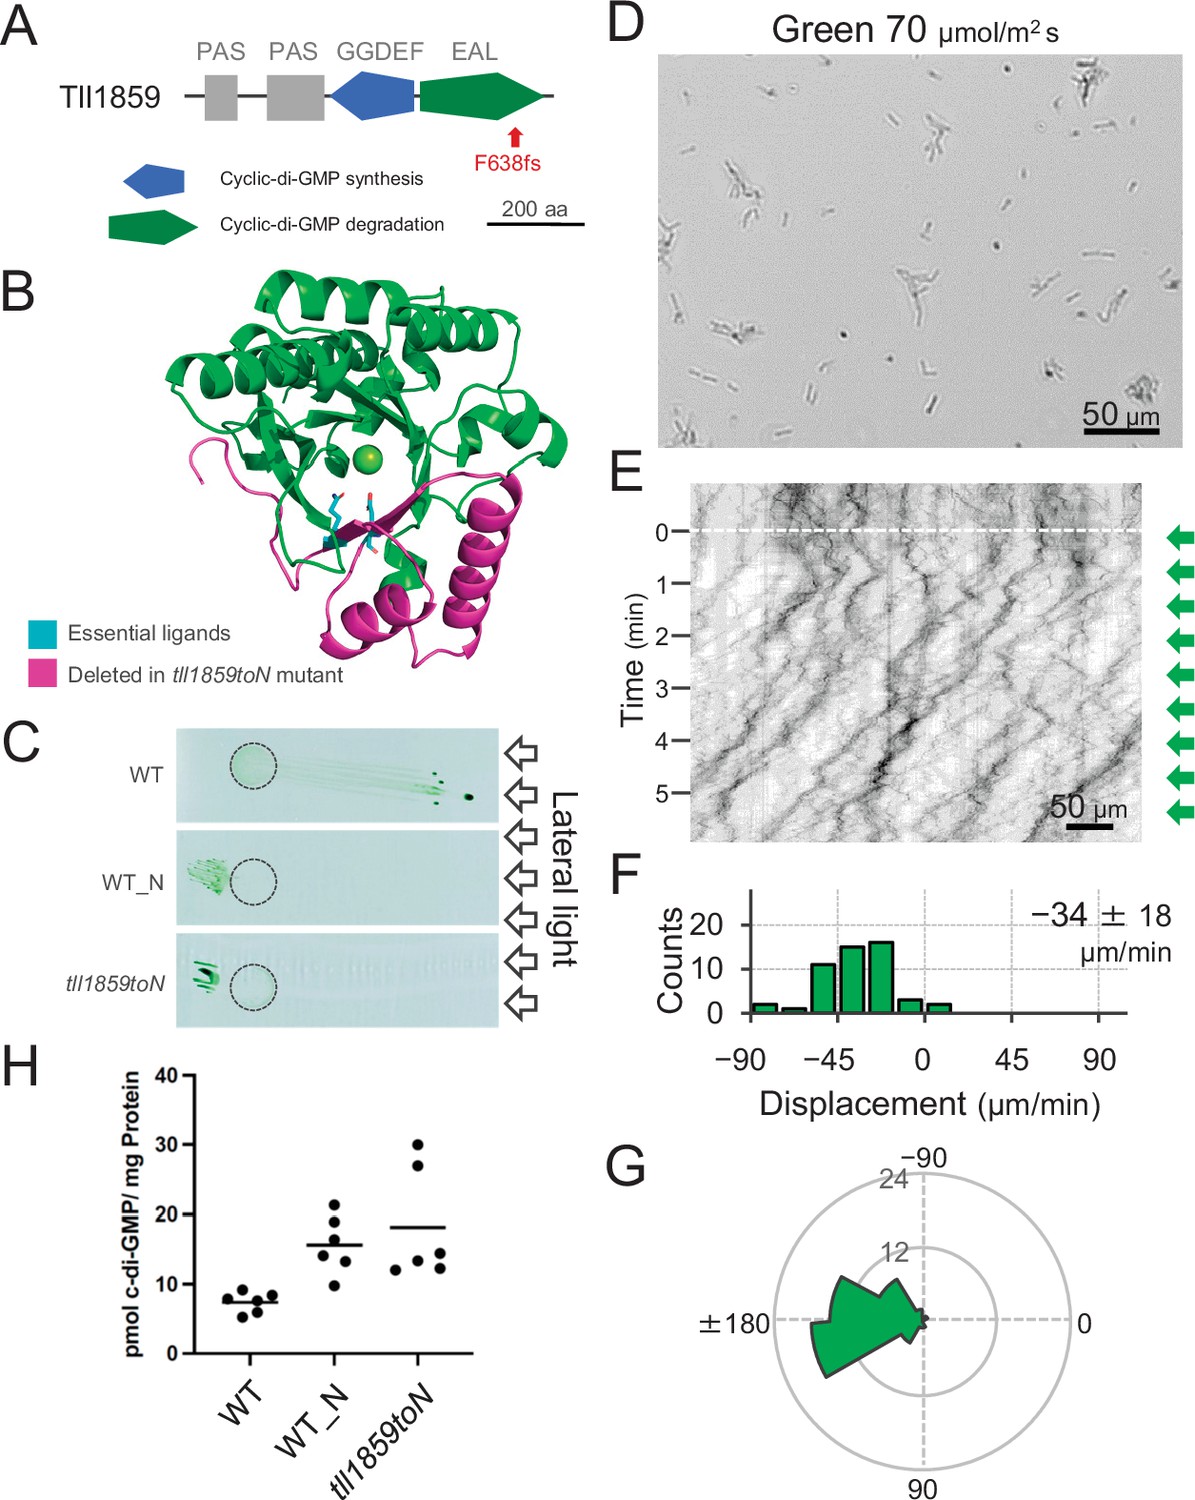
Effect of the tll1859 mutation on phototaxis and intracellular cyclic dimeric GMP (c-di-GMP) concentrations.
(A) Domain composition of Tll1859 protein. The WT_N strain has a frameshift mutation in the gene sequence of the EAL domain. (B) Predicted structure of the Tll1859-EAL domain by SWISS-MODEL. The deleted region in WT_N strain is coloured by magenta. The putative ligand residues essential for metal ion binding (Glu669 and Gln689) which are absent in WT_N, are highlighted in cyan. (C) Phototaxis on agar plates under lateral illumination of white light at a fluence rate of 150 μmol m−2 s−1. (D) Intracellular c-di-GMP concentrations in WT, WT_N, and the independently created tll1859toN mutant. The shown data are biological triplicates with technical duplicates, and the mean values are given with the bars. (E) Cell images at 4 min after the lateral green light was turned on. (F) Kymograph of cell movements along the optical axis of lateral illumination. Directional movements of cells are presented by the tilted lines over time. Lateral green-light illumination was turned on at time 0, presented as a dashed white line. (G) Histograms of the cell displacement along the lateral light axis. Cell movements towards the light source are shown as a positive value. The average and standard deviation (SD) of the cell displacement along the light axis are presented (N = 50). (H) Rose plots. The moving direction of a cell that translocated more than 6 μm min−1 was counted. Angle 0 was the direction towards the lateral light source of the green light. The cell displacement for a duration of 1 min was measured at 4 min after lateral illumination was turned on (N = 50 cells).
-
Figure 4—source data 1
Intracellular cyclic dimeric GMP (c-di-GMP) concentrations in WT_N and tll1859toN mutant.
- https://cdn.elifesciences.org/articles/73405/elife-73405-fig4-data1-v1.xlsx
-
Figure 4—source data 2
List of nucleotide differences found in ‘WT_N’ compared with ‘WT’ of T.
vulcanus.
- https://cdn.elifesciences.org/articles/73405/elife-73405-fig4-data2-v1.xlsx
Figure 5
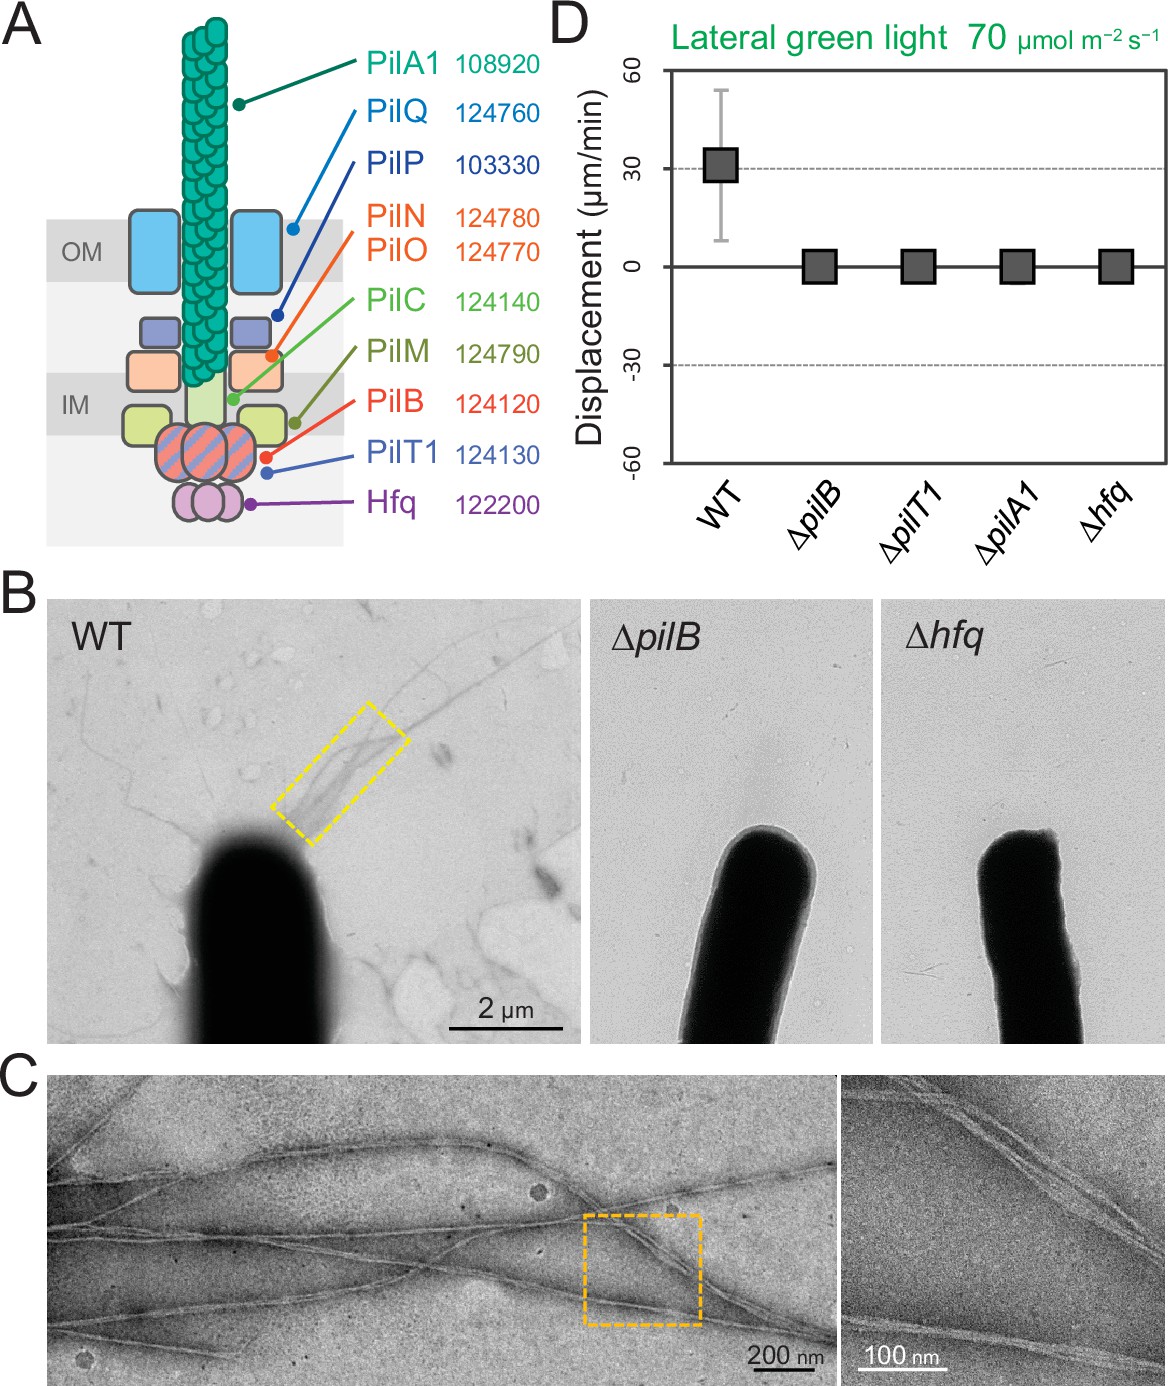
Type IV pili (T4P) machinery and phototaxis.
(A) Schematic of the T4P machinery. Protein components and their gene IDs from the genome of T. vulcanus are indicated. The location of the components is presented in reference to other species (Chang et al., 2016). (B) Electron microscopy (EM) image of a cell. (C) Magnified images of the yellow and orange boxed areas are presented. (D) Effect of lateral light illumination on mutant cells. Lateral green light was applied at a fluence rate of 70 μmol m−2 s−1. The average and standard deviation (SD) of the cell displacement on the glass surface along the light axis are presented (N = 50). Hfq was previously suggested to be involved in the formation of T4P machinery in other cyanobacteria (Schuergers et al., 2014).
-
Figure 5—source data 1
Effect of lateral light illumination on mutant cells.
- https://cdn.elifesciences.org/articles/73405/elife-73405-fig5-data1-v1.xlsx
Figure 6
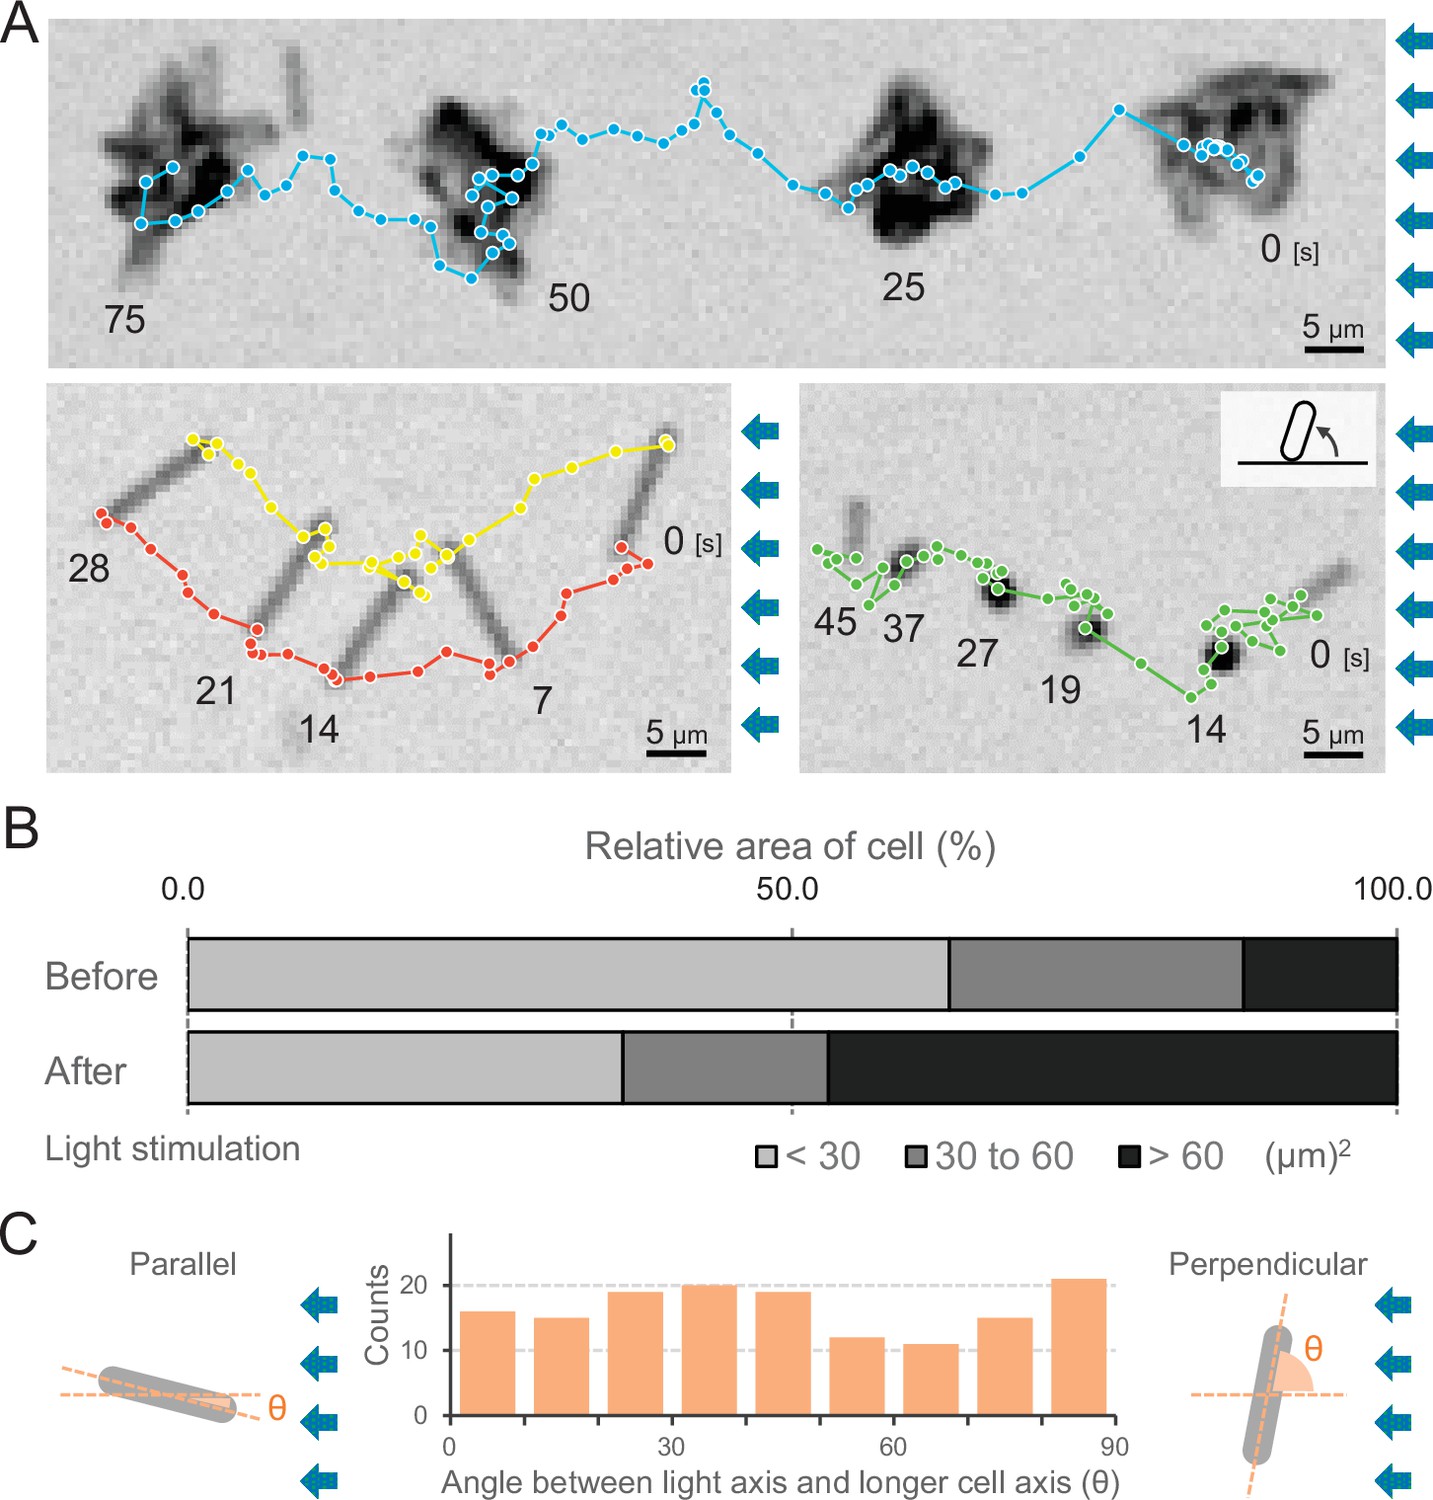
Moving trajectories of cells during negative phototaxis.
(A) Cell images and moving trajectories. Images were integrated with a single image at each time duration presented (see also Videos 12–14). Upper: movement of microcolonies. Left bottom: cell perpendicular to lateral light axis. Right bottom: cell that stood up and kept binding at a cell pole. (B) Cell–cell interaction. The area of a cell moving as a single unit was measured before and after the induction of negative phototaxis and presented as the ratio by the area (N = 353). (C) Moving direction of a cell in relation to the light source. The orientation of single cells during negative phototaxis was measured, and the distribution is presented (N = 148). The absolute angle of the longer axis of a cell was measured in relation to the lateral light axis. The parallel cellular orientation to the light axis (shown on the left) was taken as 0°, whereas the perpendicular orientation (shown on the right) was ideally 90°.
-
Figure 6—source data 1
Moving trajectories.
- https://cdn.elifesciences.org/articles/73405/elife-73405-fig6-data1-v1.xlsx
-
Figure 6—source data 2
Area of a cell.
- https://cdn.elifesciences.org/articles/73405/elife-73405-fig6-data2-v1.xlsx
-
Figure 6—source data 3
Moving direction of a cell in relation to the light source.
- https://cdn.elifesciences.org/articles/73405/elife-73405-fig6-data3-v1.xlsx
Figure 7 with 3 supplements
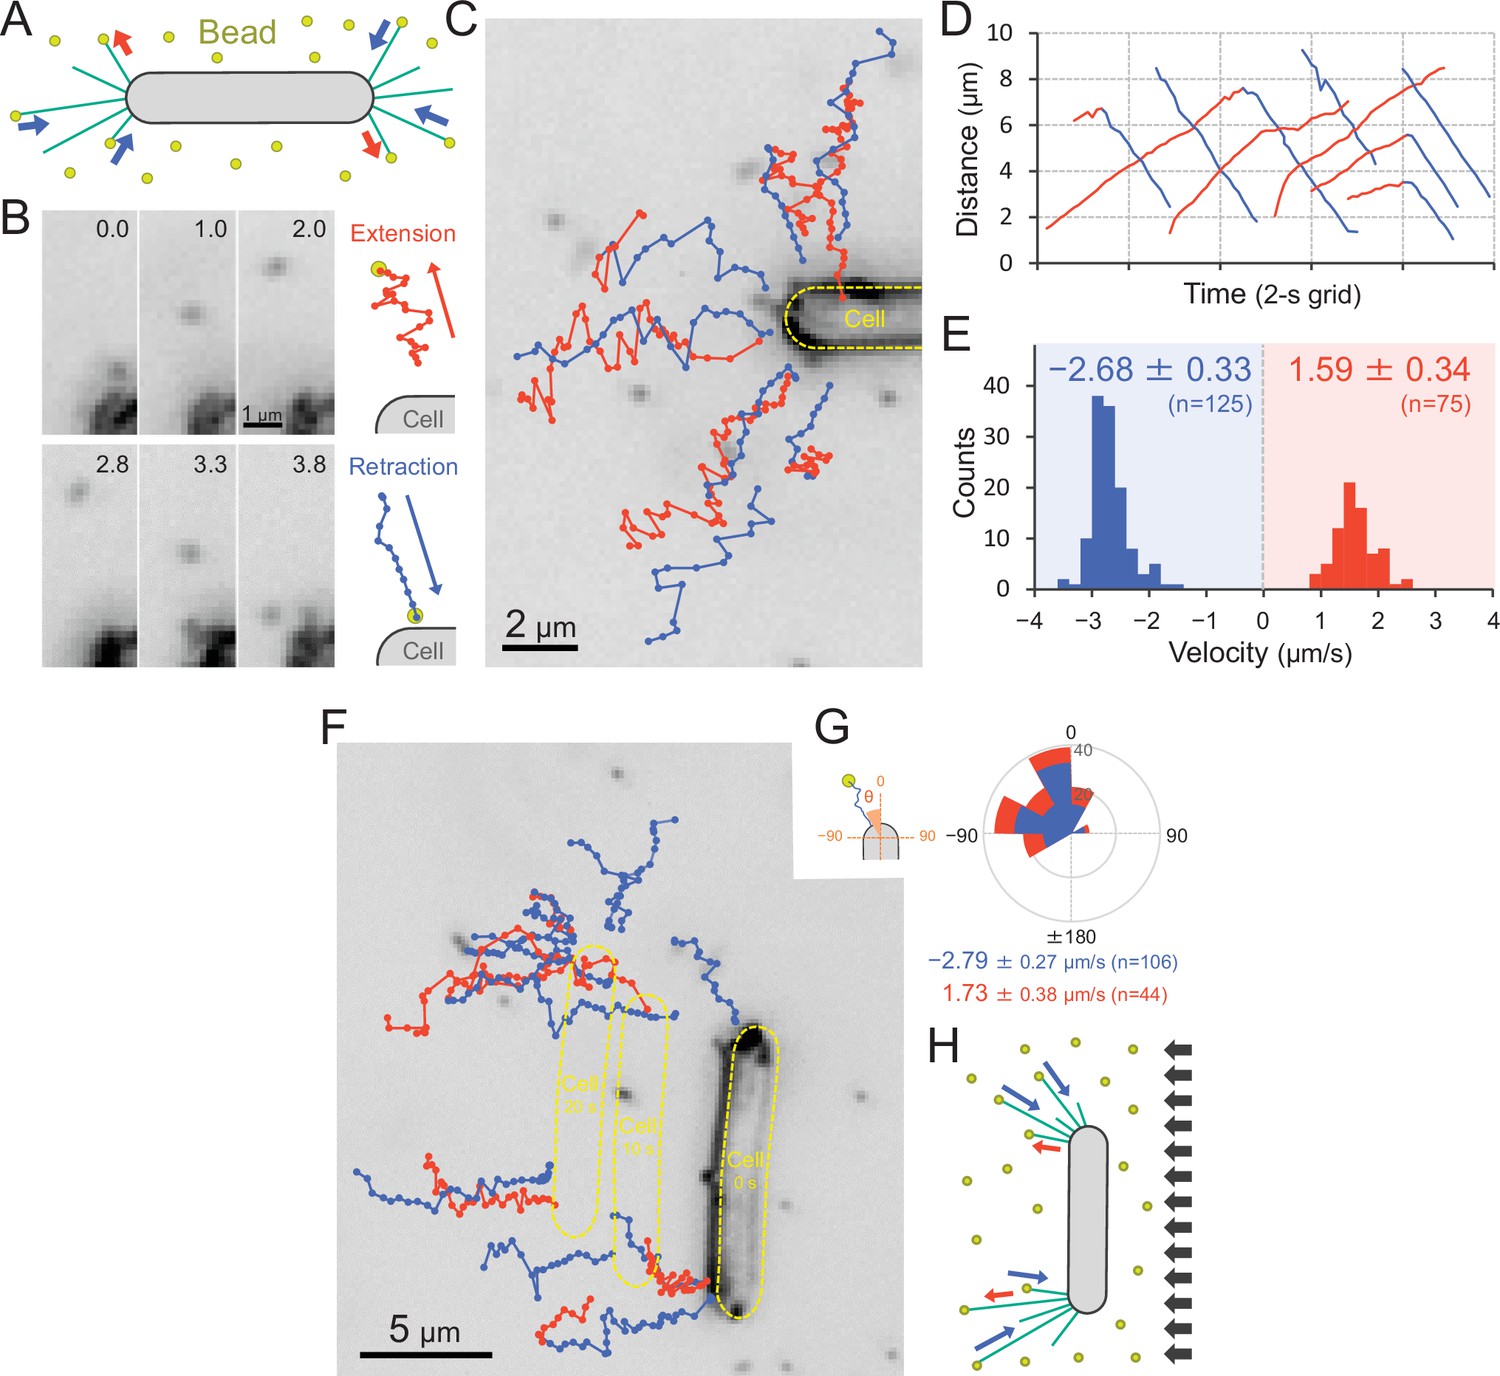
Visualization of type IV pili (T4P) dynamics through nano-beads.
(A) Schematic of the beads’ assay. Sulfate beads (200 nm in diameter) were added to the cells on a glass surface. (B) Typical trajectories of beads. Left: a series of images. Time was presented at the right upper corner of the image. Right: trajectories of the bead moving away from and towards the cell. (C) Trajectories of beads. Red and blue indicate bead movement away from and towards the cell, respectively. The bead trajectories with a time interval of 0.1 s were overlaid onto the cell image. (D) Time course of the distance between the bead and a cell pole. The data came from Panel C. (E) Distribution of the bead velocity. The velocity was measured by the time course of bead displacement. The movement towards the cell was measured as a negative value. The average and standard deviation (SD) of the plus and minus regions are presented (N = 200 in 12 cells). (F) Trajectories of beads during negative phototaxis. Lateral light illumination was applied from the right side of the image. The cell perpendicular to the lateral light axis is presented. The cell showed directional movement towards the left side of the image, and the cell position is presented by the dashed yellow lines every 10 s. The trajectories of beads with a time interval of 0.1 s were overlaid onto the cell image. (G) Distribution of the bead angle. Left: schematic of the angle definition. The cells perpendicular to the lateral light axis were used for analysis. Right: the angle formed by the longer cell axis and the bead trajectories around the cell pole at the upper side were measured (N = 150 in 10 cells). (H) Schematic of T4P dynamics during negative phototaxis of the cell perpendicular to the lateral light axis. T4P was asymmetrically activated on the other side of the light source.
-
Figure 7—source data 1
Moving trajectories of beads in Figure 7BF.
- https://cdn.elifesciences.org/articles/73405/elife-73405-fig7-data1-v1.xlsx
-
Figure 7—source data 2
Time course of the distance between the bead and a cell pole.
- https://cdn.elifesciences.org/articles/73405/elife-73405-fig7-data2-v1.xlsx
-
Figure 7—source data 3
Distribution of the bead velocity in Figure 7E, Figure 7—figure supplement 2 −.
- https://cdn.elifesciences.org/articles/73405/elife-73405-fig7-data3-v1.xlsx
-
Figure 7—source data 4
Rose plot.
- https://cdn.elifesciences.org/articles/73405/elife-73405-fig7-data4-v1.xlsx
Figure 7—figure supplement 1
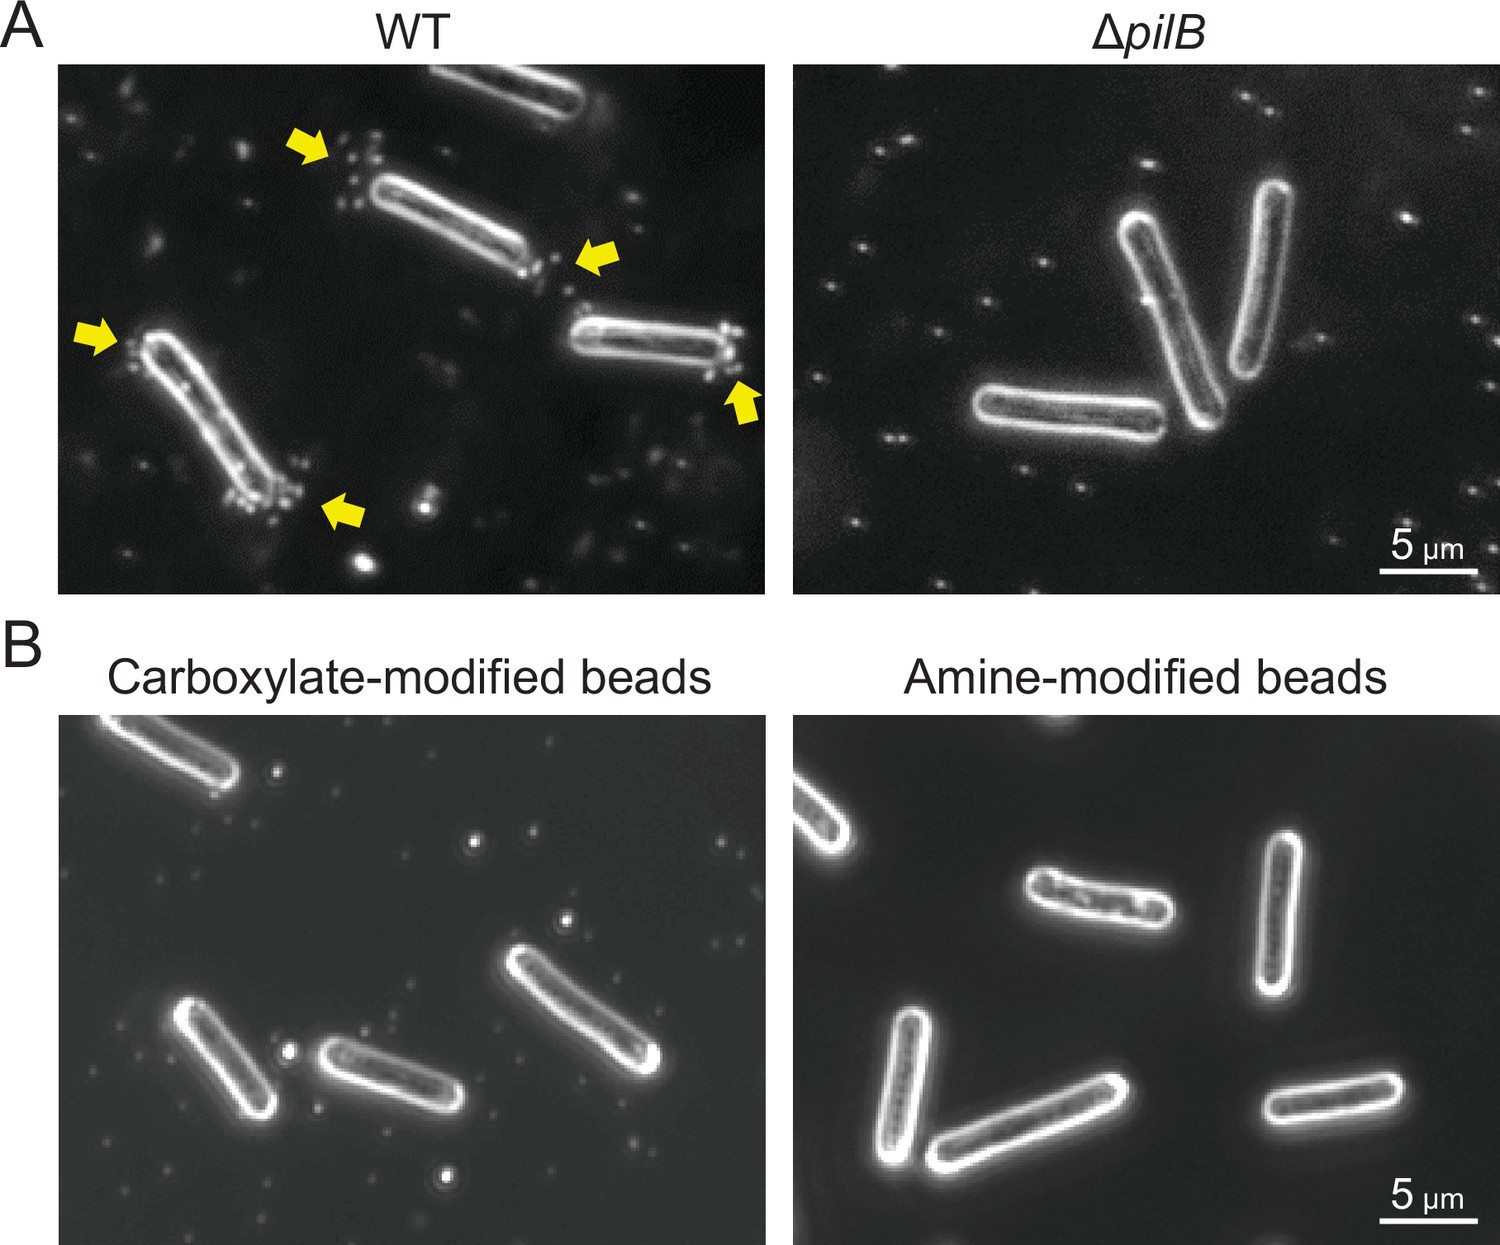
Optimization of beads assay.
(A) Type IV pili (T4P)-dependent bead accumulation at the cell pole. Cell images were observed by dark-field microscopy 2 min after adding 200-nm diameter sulfate beads. Yellow indicates bead accumulation at the cell pole. (B) Preference of bead accumulation. Dark-field images 2 min after adding 200-nm diameter carboxylate- and amine-modified beads are presented.
Figure 7—figure supplement 2
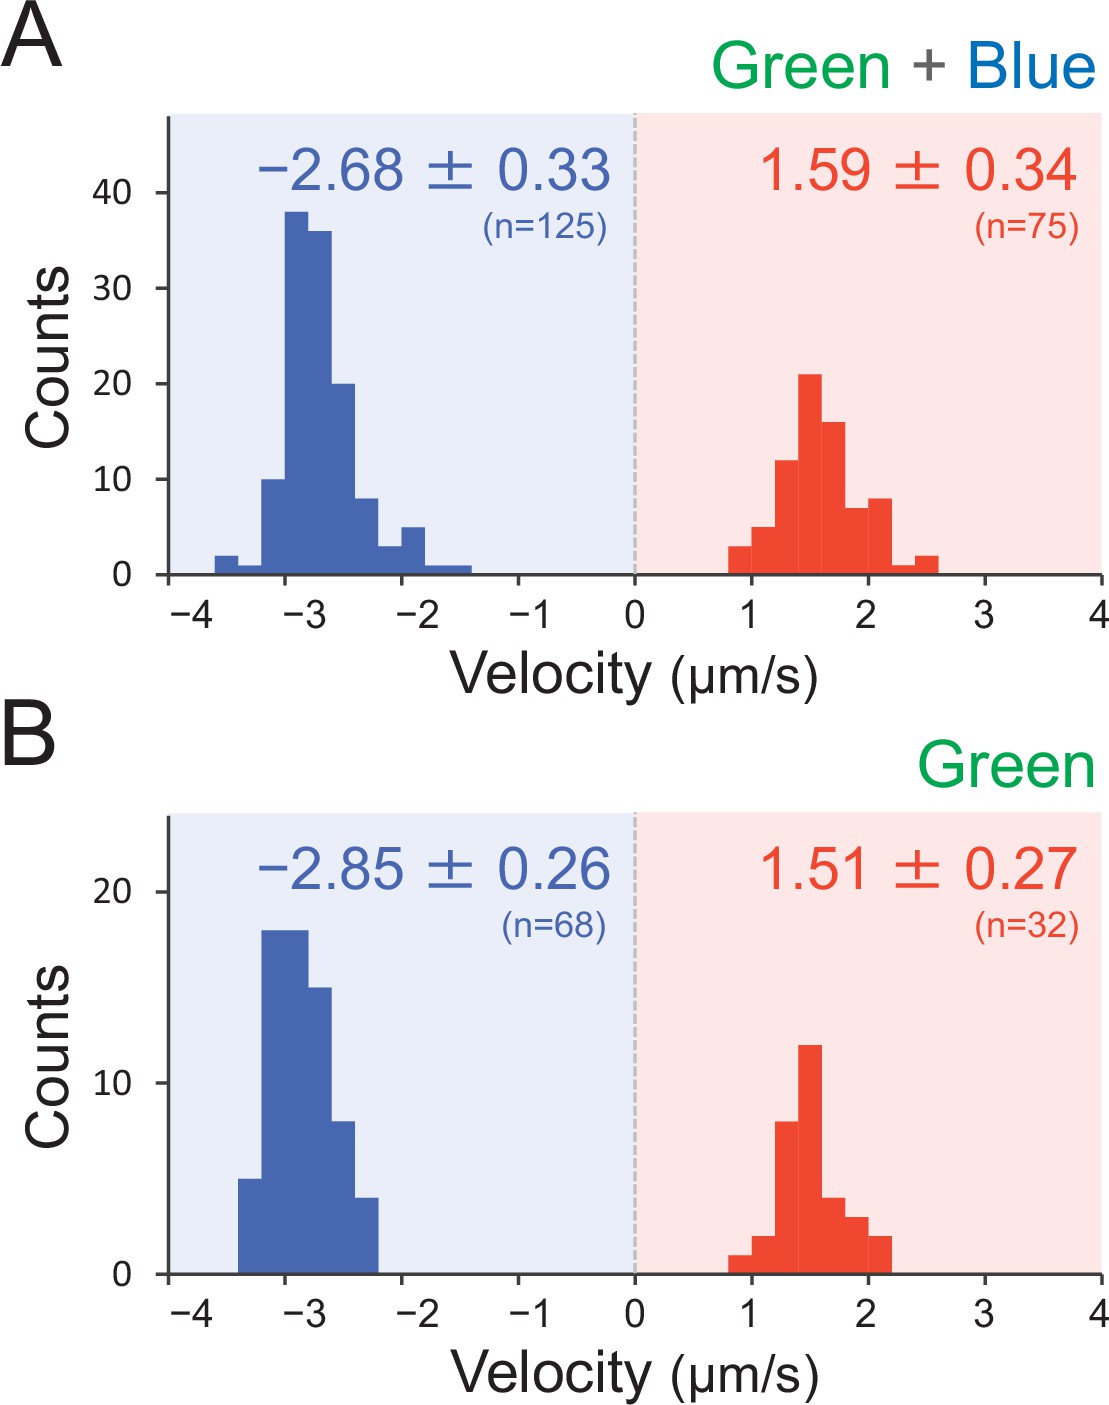
Effect of the illumination of green and green blue light on type IV pili (T4P) dynamics.
T4P dynamics were visualized through 200-nm diameter sulfate beads. The velocity of bead movement was measured by the time course of bead displacement. The movement towards the cell was measured as a negative value. The average and standard deviation (SD) of the plus and minus regions are presented. (A) Green light at 70 μmol m−2 s−1 (N = 200 in 12 cells). The same data are presented in Figure 7E as a control. (B) Green and blue light at each 70 μmol m−2 s−1 (N = 100 in 10 cells).
Figure 7—figure supplement 3
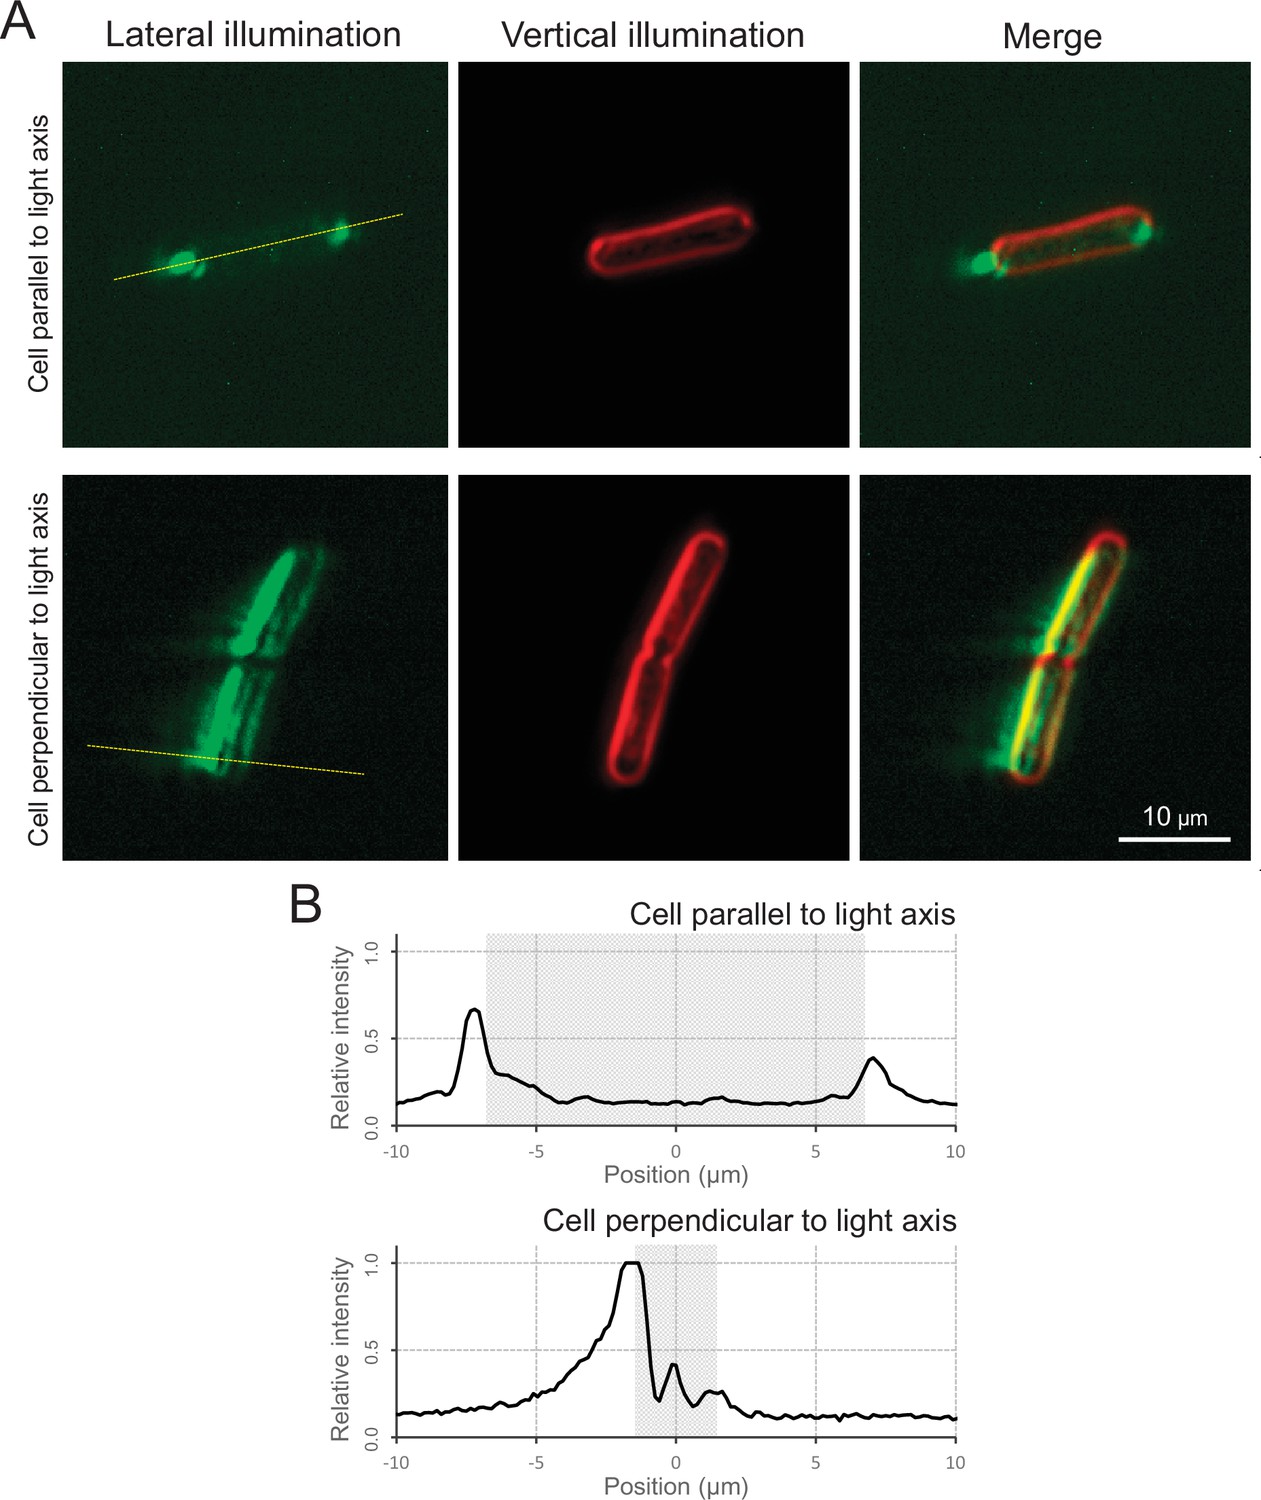
Micro-optics effect.
(A) Cell image via optical microscopy. Left: cell image visualized by the lateral illumination of green light from the right side of the image. Middle: cell outline visualized by the vertical illumination of green light. Right: merged image. The cells attached on the glass surface parallel and perpendicular to the lateral light axis are presented at the top and bottom, respectively. (B) Intensity profiles. Light intensity along the yellow dashed line in Panel A is presented. The cell positions were marked by the grey regions.
Figure 8
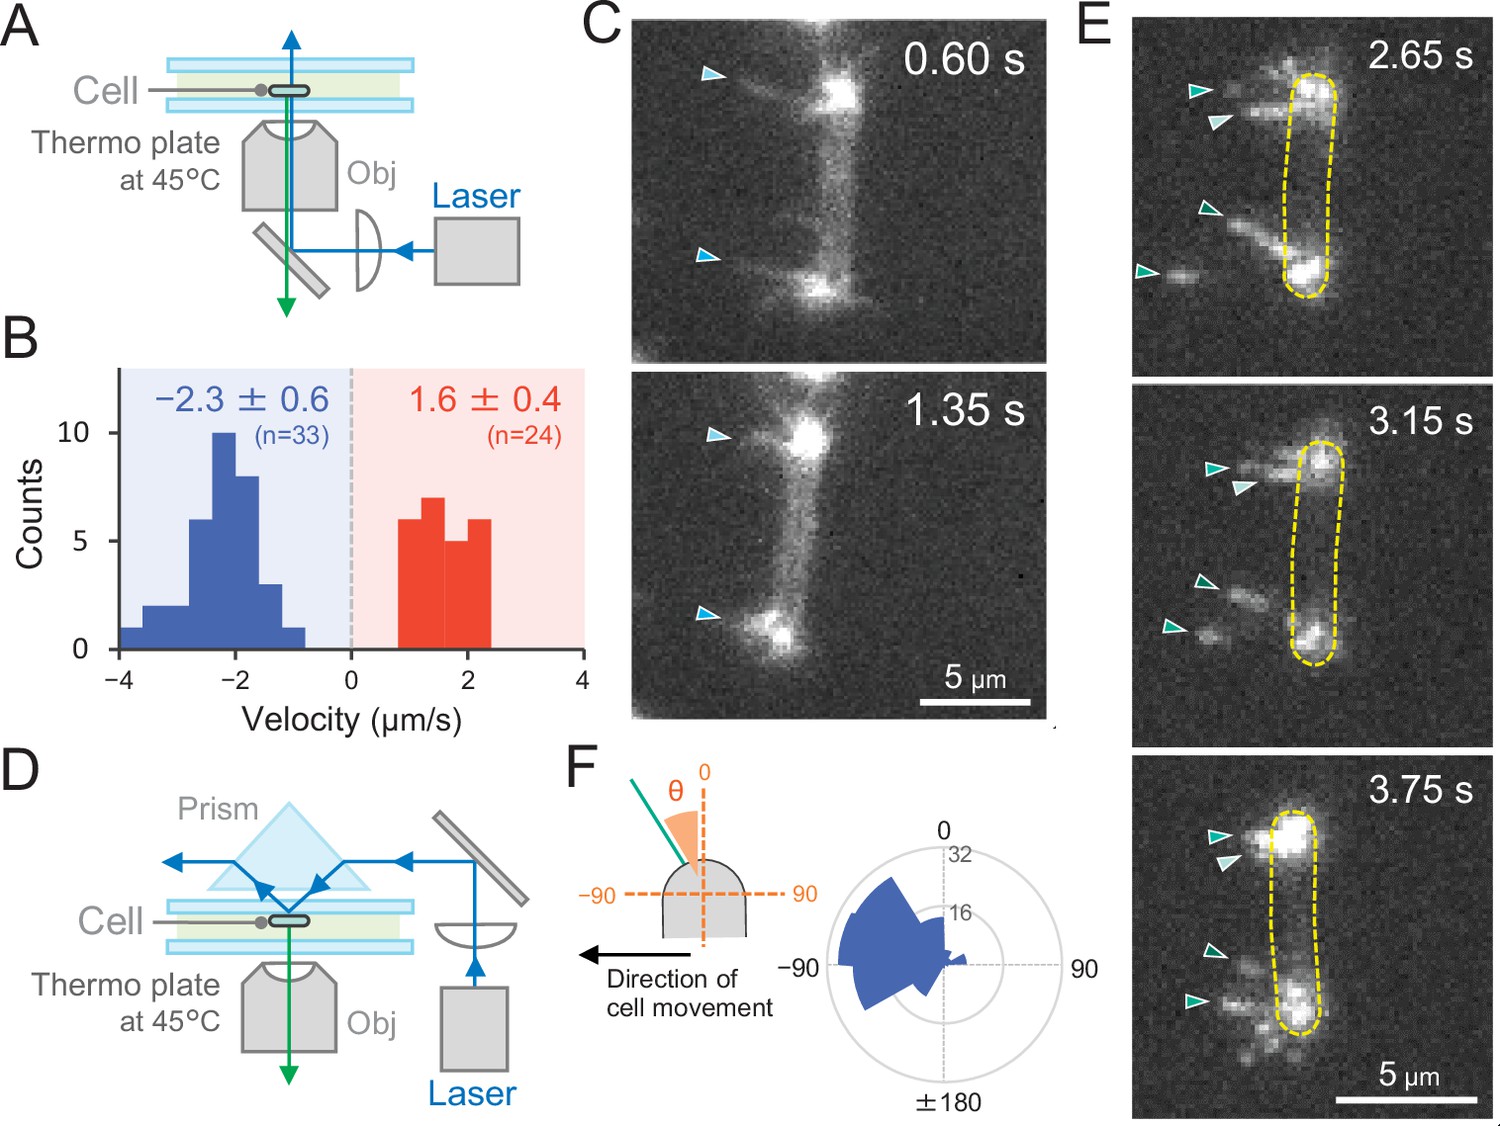
Direct visualization of type IV pili (T4P) dynamics by PilA labelling in living cells.
(A) Schematic of the epi-fluorescent microscopy setup. (B) Distribution of the velocity of T4P dynamics. The velocity of pilus dynamics was measured as the time course of the displacement of the identified tip part of a T4P filament towards or away from a cell pole. The retraction of T4P was measured as a negative value. The average and standard deviation (SD) of the plus and minus values are presented (N = 57 in 10 cells). The non-moving cells under epi-fluorescence microscopy were used for the data analysis. (C) Consecutive time-lapse images of a cell moving towards the left side under epi-fluorescence microscopy. The time is shown at the right upper corner of the image. (D) Schematic of the total internal reflection fluorescence (TIRF) microscopy setup. (E) Image sequence of a cell moving towards the left side under TIRF microscopy. The time frame is presented at the right upper corner of the image. (F) Distribution of the T4P filaments. Left: schematic of the angle definition. The cells moving towards the left side aligned perpendicular to the x axis of the image under TIRF microscopy were used for the data analysis. The angle relative to the cell axis in the direction of movement was measured as a negative value. The angle formed by the longer cell axis and the tip of T4P filaments around the cell pole were measured (N = 119 in 20 cell poles).
-
Figure 8—source data 1
Distribution of the velocity of type IV pili (T4P) dynamics in Figure 8B.
- https://cdn.elifesciences.org/articles/73405/elife-73405-fig8-data1-v1.xlsx
-
Figure 8—source data 2
Rose plot of the type IV pili (T4P) filaments in Figure 8F.
- https://cdn.elifesciences.org/articles/73405/elife-73405-fig8-data2-v1.xlsx
Videos
Video 1
Positive phototaxis.
Lateral illumination of green light was turned on at time 0 from the right side of the movie. Wild type (WT) cells at 45°C. Area 750 × 563 μm.
Video 2
Microcolony formation.
Lateral illumination of blue light was turned on at time 0 from the right side of the movie. Wild type (WT) cells at 45°C. Area 750 × 563 μm.
Video 3
Phototaxis at low temperature.
Lateral illumination of green light was turned on at time 0 from the right side of the movie. Wild type (WT) cells at 25°C. Area 750 × 563 μm.
Video 4
Negative phototaxis.
Lateral illumination of green and blue light was turned on at time 0 from the right side of the movie. Wild type (WT) cells at 45°C. Area 750 × 563 μm.
Video 5
On–off control of positive phototaxis.
Lateral illumination of green light was applied with 4-min intervals from the right side of the movie. Wild type (WT) cells at 45°C. Area 750 × 563 μm.
Video 6
On–off control of negative phototaxis.
Lateral illumination of green and blue light was applied with 4-min intervals from the right side of the movie. Wild type (WT) cells at 45°C. Area 750 × 563 μm.
Video 7
Directional switch of phototaxis in wild type (WT).
Lateral illumination was turned on at time 0 from the right side of the movie. The illumination was applied with three phases in the order of green, green/blue, and green with a time interval of 4 min. WT cells at 45°C. Area 750 × 563 μm.
Video 8
Cell behaviour in ΔsesA mutant.
Lateral illumination was turned on at time 0 from the right side of the movie. The illumination was applied with three phases in the order of green, green/blue, and green with a time interval of 4 min. ΔsesA cells. Area 750 × 563 μm.
Video 9
Cell behaviour in ΔsesC mutant.
Lateral illumination was turned on at time 0 from the right side of the movie. The illumination was applied with three phases in the order of green, green/blue, and green with a time interval of 4 min. ΔsesC cells. Area 750 × 563 μm.
Video 10
Cell behaviour in ΔsesB mutant.
Lateral illumination was turned on at time 0 from the right side of the movie. The illumination was applied with three phases in the order of green, green/blue, and green with a time interval of 4 min. ΔsesB cells. Area 750 × 563 μm.
Video 11
Cell behaviour of a ΔpilB mutant.
Lateral illumination of green light was turned on at time 0 from the right side of the movie. ΔpilB cells at 45°C. Area 750 × 563 μm.
Video 12
Phototaxis of microcolony.
Lateral illumination of green and blue light was applied from the right side of the movie. Wild type (WT) cells at 45°C. Area 117 × 88 μm.
Video 13
Phototaxis of cell perpendicular to the lateral light axis.
Lateral illumination of green and blue light was applied from the right side of the movie. Wild type (WT) cell at 45°C. Area 171 × 44 μm.
Video 14
Phototaxis of cell that stood up and kept binding at a cell pole.
Lateral illumination of green and blue light was applied from the right side of the movie. Wild type (WT) cell at 45°C. Area 171 × 44 μm.
Video 15
Type IV pili (T4P) dynamics through beads.
Extension and retraction of the T4P filament were visualized by sulfate beads with a size of 200 nm. Wild type (WT) cells at 45°C. Area 42.0 × 31.5 μm.
Video 16
Type IV pili (T4P) dynamics through beads during negative phototaxis.
Lateral illumination was applied from the right side of the movie. Extension and retraction of the T4P filament were visualized by beads with a size of 200 nm. Dark-field microscopy. Wild type (WT) cell at 45°C. Area 42.0 × 31.5 μm.
Video 17
Type IV pili (T4P) dynamics under epi-fluorescence microscopy.
Extension and retraction of the T4P filaments were visualized by fluorescence labelling of PilA1 at 45°C. Area 39.0 × 29.3 μm.
Video 18
Type IV pili (T4P) dynamics during directional movement under epi-fluorescence microscopy.
Extension and retraction of the T4P filaments were visualized by fluorescence labelling of PilA1. The cell showed directional movement towards the left side at 45°C. Area 26.0 × 19.5 μm.
Video 19
Type IV pili (T4P) dynamics under total internal reflection fluorescence (TIRF) microscopy.
Surface attachment of the T4P filaments was visualized by fluorescence labelling of PilA1 under TIRF illumination at 45°C. Area 39.0 × 29.3 μm.
Video 20
Type IV pili (T4P) dynamics during directional movement under total internal reflection fluorescence (TIRF) microscopy.
Surface attachment of the T4P filaments was visualized by fluorescence labelling of PilA1 under TIRF illumination. The cell showed directional movement towards the left side at 45°C. Area 26.0 × 19.5 μm.
Tables
Table 1
Oligonucleotides used in this study.
| Name | Sequence (5′–3′) | Purpose |
|---|---|---|
| pUC19-5R_tvsesA | ATGATACGCGGGTGATTACCGAGCTCGAATTCAC | ∆sesA |
| pUC19-6F_tvsesA | GTGGCAAAACCACCTTTGCAAGCTTGGCGTAATC | |
| tvsesA-1F_pUC19 | GAATTCGAGCTCGGTAATCACCCGCGTATCATTG | |
| tvsesA-2R_Cm | TTCTATCAGCTGTCCCATCAATCCCCGAAACTGC | |
| Cm-3F_tvsesA | AGTTTCGGGGATTGATGGGACAGCTGATAGAAAC | |
| Cm-4R_tvsesA | ATGGGTGATATTGGCTTTTATCAGGCTCTGGGAG | |
| tvsesA-3F_Cm | CCCAGAGCCTGATAAAAGCCAATATCACCCATGC | |
| tvsesA-4R_pUC19 | TTACGCCAAGCTTGCAAAGGTGGTTTTGCCACAG | |
| pUC19-7R_tvsesB | TCAGGGGAGTCCAAAATACCGAGCTCGAATTCAC | ∆sesB |
| pUC19-8F_tvsesB | ACGGATTGCCATTGGTTGCAAGCTTGGCGTAATC | |
| tvsesB-1F_pUC19 | GAATTCGAGCTCGGTATTTTGGACTCCCCTGATG | |
| tvsesB-2R_Km | AGCAGGGGAATTGTTACACAGACTCTTCTGTGAC | |
| Km-5F_tvsesB | CACAGAAGAGTCTGTGTAACAATTCCCCTGCTCG | |
| Km-6R_tvsesB | GTTCAAGGTCCTCTTGCCAACCTTTCATAGAAGGC | |
| tvsesB-3F_Km | TTCTATGAAAGGTTGGCAAGAGGACCTTGAACTG | |
| tvsesB-4R_pUC19 | TTACGCCAAGCTTGCAACCAATGGCAATCCGTAG | |
| pUC19-21R_tvcikA | AGATGCGATTGTCCATTACCGAGCTCGAATTCAC | ∆cikA |
| pUC19-22F_tvcikA | TTCATTGGGCTTACAGTGCAAGCTTGGCGTAATC | |
| tvcikA-1F_pUC19 | GAATTCGAGCTCGGTAATGGACAATCGCATCTGC | |
| tvcikA-2R_Cm | TTCTATCAGCTGTCCCGCTGATAGCTACTGCTAG | |
| Cm-18F_tvcikA | AGCAGTAGCTATCAGCGGGACAGCTGATAGAAAC | |
| Cm-19R_tvcikA | AGATATTCCCGCTGTTTTTATCAGGCTCTGGGAG | |
| tvcikA-3F_Cm | CCCAGAGCCTGATAAAAACAGCGGGAATATCTGG | |
| tvcikA-4R_pUC19 | TTACGCCAAGCTTGCACTGTAAGCCCAATGAACC | |
| pUC19-19R_tvpixD | GTTACCATTCGCAAGTTACCGAGCTCGAATTCAC | ∆pixD |
| pUC19-20F_tvpixD | GCTAGTCCTGAACCAATGCAAGCTTGGCGTAATC | |
| tvpixD-1F_pUC19 | GAATTCGAGCTCGGTAACTTGCGAATGGTAACCG | |
| tvpixD-2R_Cm | TTCTATCAGCTGTCCCAATCAGGCGATGTAGTCC | |
| Cm-15F_tvpixD | ACTACATCGCCTGATTGGGACAGCTGATAGAAAC | |
| Cm-16R_tvpixD | CAGCATTCCCGTAATGTTTATCAGGCTCTGGGAG | |
| tvpixD-3F_Cm | CCCAGAGCCTGATAAACATTACGGGAATGCTGTG | |
| tvpixD-4R_pUC19 | TTACGCCAAGCTTGCATTGGTTCAGGACTAGCTG | |
| pUC19-23R_tvtll1282 | TTTGGCATCTTCAAGGTACCGAGCTCGAATTCAC | ∆LOV |
| pUC19-24F_tvtll1282 | TGAGCAAAGGGATCATTGCAAGCTTGGCGTAATC | |
| tvtll1282-1F_pUC19 | GAATTCGAGCTCGGTACCTTGAAGATGCCAAAGC | |
| tvtll1282-2R_Cm | TTCTATCAGCTGTCCCAGCATAGCGTTCCATCTC | |
| Cm-20F_tvtll1282 | GATGGAACGCTATGCTGGGACAGCTGATAGAAAC | |
| Cm-21R_tvtll1282 | AATAGGCTCAGGACATTTTATCAGGCTCTGGGAG | |
| tvtll1282-3F_Cm | CCCAGAGCCTGATAAAATGTCCTGAGCCTATTGG | |
| tvtll1282-4R_pUC19 | TTACGCCAAGCTTGCAATGATCCCTTTGCTCAGC | |
| pUC19-25R_tvHCP | TGAACTTTGCCCTTGTTACCGAGCTCGAATTCAC | ∆OCP |
| pUC19-26F_tvCTDH | GATAGGGAGATTGCATTGCAAGCTTGGCGTAATC | |
| tvHCP-1F_pUC19 | GAATTCGAGCTCGGTAACAAGGGCAAAGTTCAGC | |
| tvHCP-2R_Cm | TTCTATCAGCTGTCCCGCTCATCAAAACTGAGGG | |
| Cm-22F_tvHCP | CTCAGTTTTGATGAGCGGGACAGCTGATAGAAAC | |
| Cm-23R_tvCTDH | TCTTCAAAGGGTGGATTTTATCAGGCTCTGGGAG | |
| tvCTDH-1F_Cm | CCCAGAGCCTGATAAAATCCACCCTTTGAAGAGC | |
| tvCTDH-2R_pUC19 | TTACGCCAAGCTTGCAATGCAATCTCCCTATCCG | |
| pUC19-15R_tvpilB | CAGTTGAATCTGGGTTTACCGAGCTCGAATTCAC | ∆pilB |
| pUC19-16F_tvpilB | ACAGGTTTTGGAGGTCTGCAAGCTTGGCGTAATC | |
| tvpilB-1F_pUC19 | GAATTCGAGCTCGGTAAACCCAGATTCAACTGGG | |
| tvpilB-2R_Cm | TTCTATCAGCTGTCCCTTGTGGTACTGGCGTAAC | |
| Cm-11F_tvpilB | TACGCCAGTACCACAAGGGACAGCTGATAGAAAC | |
| Cm-12R_tvpilB | AGATCTTGAAGCGGGATTTATCAGGCTCTGGGAG | |
| tvpilB-3F_Cm | CCCAGAGCCTGATAAATCCCGCTTCAAGATCTTG | |
| tvpilB-4R_pUC19 | TTACGCCAAGCTTGCAGACCTCCAAAACCTGTAC | |
| pUC19-17R_tvpilT1 | TTTTTGCCAGCACCTTTACCGAGCTCGAATTCAC | ∆pilT1 |
| pUC19-18F_tvpilT1 | TCTTGGCTGGCTTGATTGCAAGCTTGGCGTAATC | |
| tvpilT1-1F_pUC19 | GAATTCGAGCTCGGTAAAGGTGCTGGCAAAAAGC | |
| tvpilT1-2R_Cm | TTCTATCAGCTGTCCCAAGTCTGAACCACCGTTG | |
| Cm-13F_tvpilT1 | ACGGTGGTTCAGACTTGGGACAGCTGATAGAAAC | |
| Cm-14R_tvpilT1 | TGGCAAGCTGAATCGTTTTATCAGGCTCTGGGAG | |
| tvpilT1-3F_Cm | CCCAGAGCCTGATAAAACGATTCAGCTTGCCATC | |
| tvpilT1-4R_pUC19 | TTACGCCAAGCTTGCAATCAAGCCAGCCAAGAAG | |
| pUC19-11R_tvpilA1 | CTATTCTCTTTGCAGGTACCGAGCTCGAATTCAC | ∆pilA1 |
| pUC19-12F_tvpilA1 | TGGTTTGGTGCCAGTATGCAAGCTTGGCGTAATC | |
| tvpilA1-1F_pUC19 | GAATTCGAGCTCGGTACCTGCAAAGAGAATAGCG | |
| tvpilA1-7R_Cm | TTCTATCAGCTGTCCCAGTTGCCGTCTGCTACAG | |
| Cm-32F_tvpilA1 | GTAGCAGACGGCAACTGGGACAGCTGATAGAAAC | |
| Cm-6R_tvpilA1 | GCAGTTGCACTATTGCTTTATCAGGCTCTGGGAG | |
| tvpilA1-3F_Cm | CCCAGAGCCTGATAAAGCAATAGTGCAACTGCTC | |
| tvpilA1-4R_pUC19 | TTACGCCAAGCTTGCATACTGGCACCAAACCATG | |
| pUC19-13R_tvHfq | CAGCGGGATGTGAATATACCGAGCTCGAATTCAC | ∆hfq |
| pUC19-14F_tvHfq | AAATGCGGCTTTCCTATGCAAGCTTGGCGTAATC | |
| tvHfq-1F_pUC19 | GAATTCGAGCTCGGTATATTCACATCCCGCTGTG | |
| tvHfq-2R_Cm | TTCTATCAGCTGTCCCTACTTGGCGAATGCTAGG | |
| Cm-9F_tvHfq | TAGCATTCGCCAAGTAGGGACAGCTGATAGAAAC | |
| Cm-10R_tvHfq | ACCTCGGTGCTATCTTTTTATCAGGCTCTGGGAG | |
| tvHfq-3F_Cm | CCCAGAGCCTGATAAAAAGATAGCACCGAGGTTG | |
| tvHfq-4R_pUC19 | TTACGCCAAGCTTGCATAGGAAAGCCGCATTTGC | |
| pUC19-43R_tvtll1859 | ATCCATCGAACAAGCCTACCGAGCTCGAATTCAC | tll1859toN |
| pUC19-44F_tvtll1859 | GTCCCGTTCATTGATGTGCAAGCTTGGCGTAATC | |
| tvtll1859-1F_pUC19 | GAATTCGAGCTCGGTAGGCTTGTTCGATGGATTG | |
| tvtll1859-2R_Kmv2 | cctgagtgcttgcggcTTTCTAGGGGGTGTGAATC | |
| Km-21F_tvtll1859 | TCACACCCCCTAGAAAgccgcaagcactcagg | |
| Km-22R_tvtll1859 | TTGCAACACAGTTGTCcctttcatagaaggcggc | |
| tvtll1859-3F_Kmv2 | cgccttctatgaaaggGACAACTGTGTTGCAAACC | |
| tvtll1859-4R_pUC19 | TTACGCCAAGCTTGCACATCAATGAACGGGACTG | |
| pUC19-67F_tvpilA1 | gattggtttcaggcaaTGCAAGCTTGGCGTAATC | PilA1S114C |
| pUC19-68R_tvPilA1 | aacgatagggagacatTACCGAGCTCGAATTCAC | |
| tvPilA1-8F_pUC19 | GAATTCGAGCTCGGTAatgtctccctatcgttctag | |
| TvPilA1-9R_CmR | TTCTATCAGCTGTCCCttaagaacagttaggagcag | |
| Cm-44F_TvPilA1 | tcctaactgttcttaaGGGACAGCTGATAGAAAC | |
| Cm-45R_TvPilA1 | gttaattcctaaggtcTTTATCAGGCTCTGGGAG | |
| TvPilA1-10F_Cm | CCCAGAGCCTGATAAAgaccttaggaattaacagag | |
| TvPilA1-11R_pUC19 | TTACGCCAAGCTTGCAttgcctgaaaccaatcgg | |
| tvPilA1(S114C)–1F | caaacaTGCgctaatgatccccaaggg | |
| tvPilA1(S114C)–2R | attagcGCAtgtttgaacataagcatcattc |
Table 2
Plasmids used in this study.
| Name | Description | Reference/source |
|---|---|---|
| pUC19-∆tvsesA_Cm | pUC19-based construct for knockout of sesA gene (NIES2134_109940) containing a chloramphenicol resistance cassette flanked by ~2500 bp regions upstream and downstream of sesA, resulting in ~2000 bp deletion within ORF; CmR, AmpR | This study |
| pUC19-∆tvsesB_Km | pUC19-based construct for knockout of sesB gene (NIES2134_119260) containing a kanamycin resistance cassette flanked by ~2500 bp regions upstream and downstream of sesB, resulting in ~2000 bp deletion within ORF; KmR, AmpR | This study |
| pS-∆tlr0911_Sp(F) | pCR-Script-based construct for knockout of sesC gene (NIES2134_110090) containing a spectinomycin/streptomycin resistance cassette flanked by ~1500 bp regions upstream and downstream of sesC, resulting in ~3400 bp deletion within ORF; SpR/SmR, AmpR | Enomoto et al., 2015 |
| pUC19-∆tvcikA_Cm | pUC19-based construct for knockout of cikA gene (NIES2134_110210) containing a chloramphenicol resistance cassette flanked by ~2500 bp regions upstream and downstream of cikA, resulting in ~500 bp deletion within ORF; CmR, AmpR | This study |
| pUC19-∆tvpixD_Cm | pUC19-based construct for knockout of pixD gene (NIES2134_124540) containing a chloramphenicol resistance cassette flanked by ~2500 bp regions upstream and downstream of pixD, resulting in ~100 bp deletion within ORF; CmR, AmpR | This study |
| pUC19-∆tvtll1282_Cm | pUC19-based construct for knockout of LOV gene (tll1282; NIES2134_112750) containing a chloramphenicol resistance cassette flanked by ~2500 bp regions upstream and downstream of cikA, resulting in ~2000 bp deletion within ORF; CmR, AmpR | This study |
| pUC19-∆tvHCPCTDH_Cm | pUC19-based construct for knockout of OCP genes (HCP; NIES2134_112880 and CTDH; NIES2134_112890) containing a chloramphenicol resistance cassette flanked by ~2500 bp regions upstream and downstream of OCP, resulting in the deletion of the latter half of HCP ORF, the intergenic region, and the first half of CTDH ORF; CmR, AmpR | This study |
| pUC19-∆tvpilB_Cm | pUC19-based construct for knockout of pilB gene (NIES2134_124120) containing a chloramphenicol resistance cassette flanked by ~2500 bp regions upstream and downstream of pilB, resulting in ~600 bp deletion within ORF; CmR, AmpR | This study |
| pUC19-∆tvpilT1_Cm | pUC19-based construct for knockout of pilT1 gene (NIES2134_124130) containing a chloramphenicol resistance cassette flanked by ~2500 bp regions upstream and downstream of pilT1, resulting in ~600 bp deletion within ORF; CmR, AmpR | This study |
| pUC19-∆tvpilA1_Cm | pUC19-based construct for knockout of pilA1 gene (NIES2134_108920) containing a chloramphenicol resistance cassette flanked by ~2500 bp regions upstream and downstream of pilA1, resulting in ~550 bp deletion within ORF and the promoter region; CmR, AmpR | This study |
| pUC19-∆tvHfq_Cm | pUC19-based construct for knockout of hfq gene (NIES2134_124130) containing a chloramphenicol resistance cassette flanked by ~2500 bp regions upstream and downstream of hfq, resulting in ~10 bp deletion within ORF; CmR, AmpR | This study |
| pUC19-tvtll1859toN_Kmv2 | pUC19-based construct for introduction of the frameshift mutation present in WT_N within tll1859 gene (NIES2134_117830) containing a kanamycin resistance cassette inserted after tll1859 ORF, flanked by ~2500 bp regions upstream and downstream of tll1859 gene without any nucleotide deletion; KmR, AmpR | This study |
| pUC19-tvpilA1(S114C)_Cm | pUC19-based construct for Cys knockin in pilA1 gene (NIES2134_108920) containing a chloramphenicol resistance cassette inserted after pilA1 ORF, flanked by ~2500 bp regions upstream and downstream of pilA1 without any nucleotide deletion; CmR, AmpR | This study |
Table 3
Strains used in this study.
| Name | Description | Reference/source |
|---|---|---|
| Thermosynechococcus vulcanus WT | Isolated as wild type showing positive phototaxis towards moderate white light from NIES-2134 | Whole genome: AP018202 |
| Thermosynechococcus vulcanus WT_N | Isolated showing negative phototaxis towards moderate white light from NIES-2134 | Seq reads in DDBJ: DRA013349 |
| ∆sesA | sesA knockout mutant (CmR) | This study |
| ∆sesB | sesB knockout mutant (KmR) | This study |
| ∆sesC | sesC knockout mutant (SpR/SmR) | Enomoto et al., 2015 |
| ∆cikA | cikA knockout mutant (CmR) | This study |
| ∆pixD | pixD knockout mutant (CmR) | This study |
| ∆LOV | LOV knockout mutant (CmR) | This study |
| ∆OCP | OCP knockout mutant (CmR) | This study |
| ∆pilB | pilB knockout mutant (CmR) | This study |
| ∆pilT1 | pilT1 knockout mutant (CmR) | This study |
| ∆pilA1 | pilA1 knockout mutant (CmR) | This study |
| ∆hfq | hfq knockout mutant (CmR) | This study |
| tll1859toN | tll1859 frameshift mutant (KmR) | This study |
| PilA1S114C | pilA1 Cys knockin mutant (CmR) | This study |
Additional files
Download links
A two-part list of links to download the article, or parts of the article, in various formats.
Downloads (link to download the article as PDF)
Open citations (links to open the citations from this article in various online reference manager services)
Cite this article (links to download the citations from this article in formats compatible with various reference manager tools)
Thermosynechococcus switches the direction of phototaxis by a c-di-GMP-dependent process with high spatial resolution
eLife 11:e73405.
https://doi.org/10.7554/eLife.73405


