DunedinPACE, a DNA methylation biomarker of the pace of aging
- Department of Epidemiology & Butler Columbia Aging Center, Columbia University, United States
- Center for Genomic and Computational Biology, Duke University, United States
- Department of Psychology and Neuroscience, Duke University, United States
- Department of Psychology, University of Otago, New Zealand
- Social, Genetic, and Developmental Psychiatry Centre, King's College London, United Kingdom
- Department of Environmental Health Sciences, Columbia University, United States
- Department of Occupational and Environmental Health, Peking University, China
- Complex Disease Epigenetics Group, University of Exeter, United Kingdom
- Robert N Butler Columbia Aging Center, Columbia University, United States
- Department of Environmental Health Sciences, Harvard TH Chan School of Public Health, Harvard University, United States
- Department of Medicine, VA Boston Healthcare System, United States
Figures
Figure 1 with 4 supplements
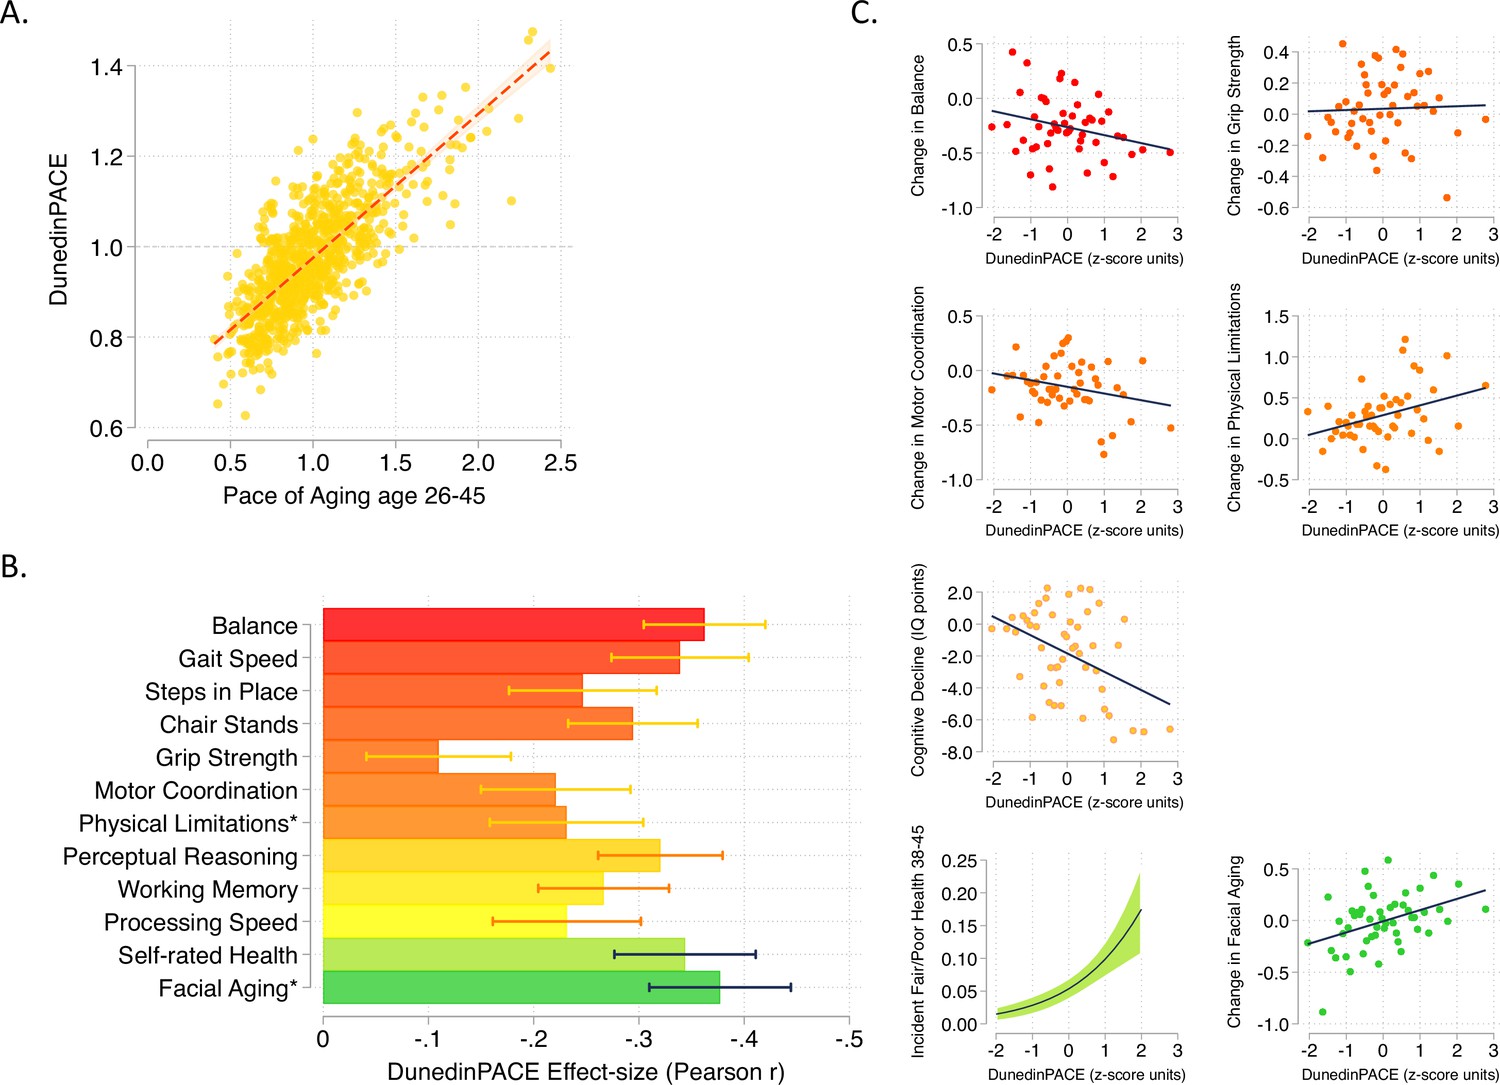
DunedinPACE correlation with 20-year Pace of Aging and association with decline in physical and cognitive functions and subjective signs of aging.
Panel A shows the association of DunedinPACE with the 20-year Pace of Aging in the Dunedin Study cohort (r = 0.78). Panel B shows effect-sizes for associations of DunedinPACE with measures of physical and cognitive functioning and subjective signs of aging in Dunedin Study members at age 45 years. Colors indicate groupings of measures (physical functions in shades of orange, cognitive functions in shades of yellow, subjective signs of aging in shades of green). Stars next to labels for Physical Limitations and Facial Aging indicate that these meaures were reverse-coded for this analysis. Panel C shows binned scatterplots of associations of DunedinPACE with declines in physical and cognitive function and subjective signs of aging. Plotted points show average values for ‘bins’ of approximately 20 Study members. Regression slopes are estimated from the raw, un-binned data. In Panel C, y-axis scales are denominated in units of standard deviations computed from the baseline measurement for all outcomes except self-rated health, for which the y-axis shows probability of incident fair/poor self-rated health. Changes were calculated over the interval between age-38 and age-45 assessments for all measures except cognition, for which change was calculated over the interval between the age-13 and age-45 assessments. DunedinPACE and DunedinPoAm were developed from analysis of Pace of Aging in the Dunedin cohort; effect-sizes for these measures may be over-estimated.
Figure 1—figure supplement 1

Correlations among the 12-year and 20-year Pace of Aging measures and the DunedinPoAm and DunedinPACE DNA methylation measures.
Figure 1—figure supplement 2

Effect-sizes for associations of DunedinPACE and the 20-year Pace of Aging with measures of physical and cognitive functioning and subjective signs of aging measured when Dunedin Study participants were aged 45 years.
The * indicates measures reverse-coded for analysis.
Figure 1—figure supplement 3
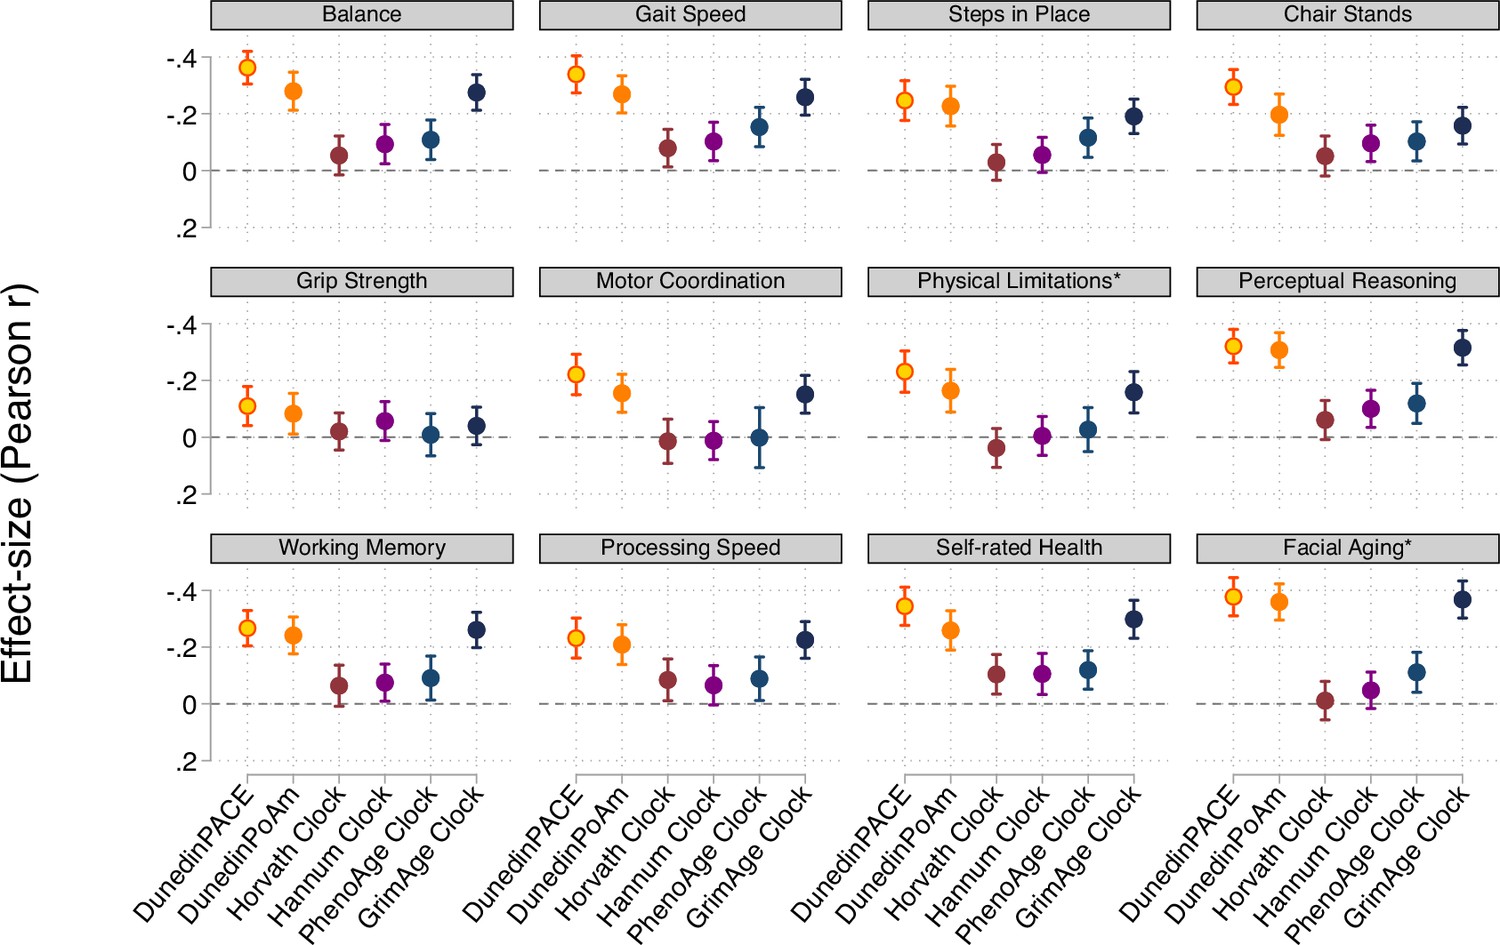
Effect-sizes for associations of DunedinPACE, DunedinPoAm, and the DNA methylation clocks proposed by Horvath, 2013, Hannum et al., 2013, Levine et al., 2018 (PhenoAge), and Lu et al., 2019 (GrimAge) with measures of physical and cognitive functioning and subjective signs of aging measured when Dunedin Study participants were aged 45 years.
The * indicates measures reverse-coded for analysis. DunedinPACE and DunedinPoAm were developed from analysis of Pace of Aging in the Dunedin cohort; effect-sizes for these measures may be over-estimated.
Figure 1—figure supplement 4
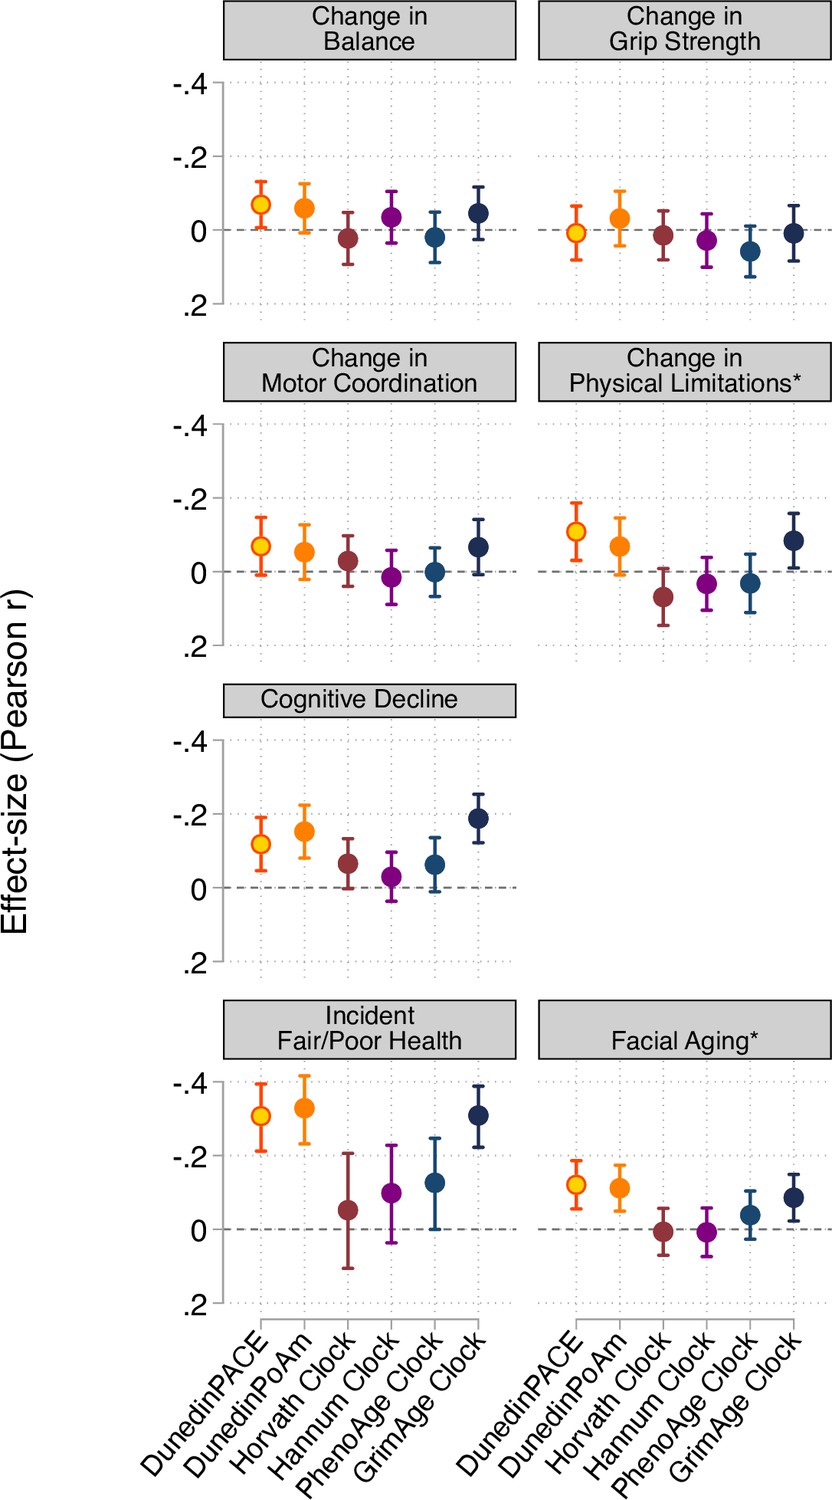
Effect-sizes for associations of aging measures with measures of change in physical functioning and subjective signs of aging over ages 38–45 years and with cognitive functioning from adolescent baseline to age-45 follow-up.
The * indicates measures reverse-coded for analysis. DunedinPACE and DunedinPoAm were developed from analysis of Pace of Aging in the Dunedin cohort; effect-sizes for these measures may be over-estimated.
Figure 2 with 1 supplement
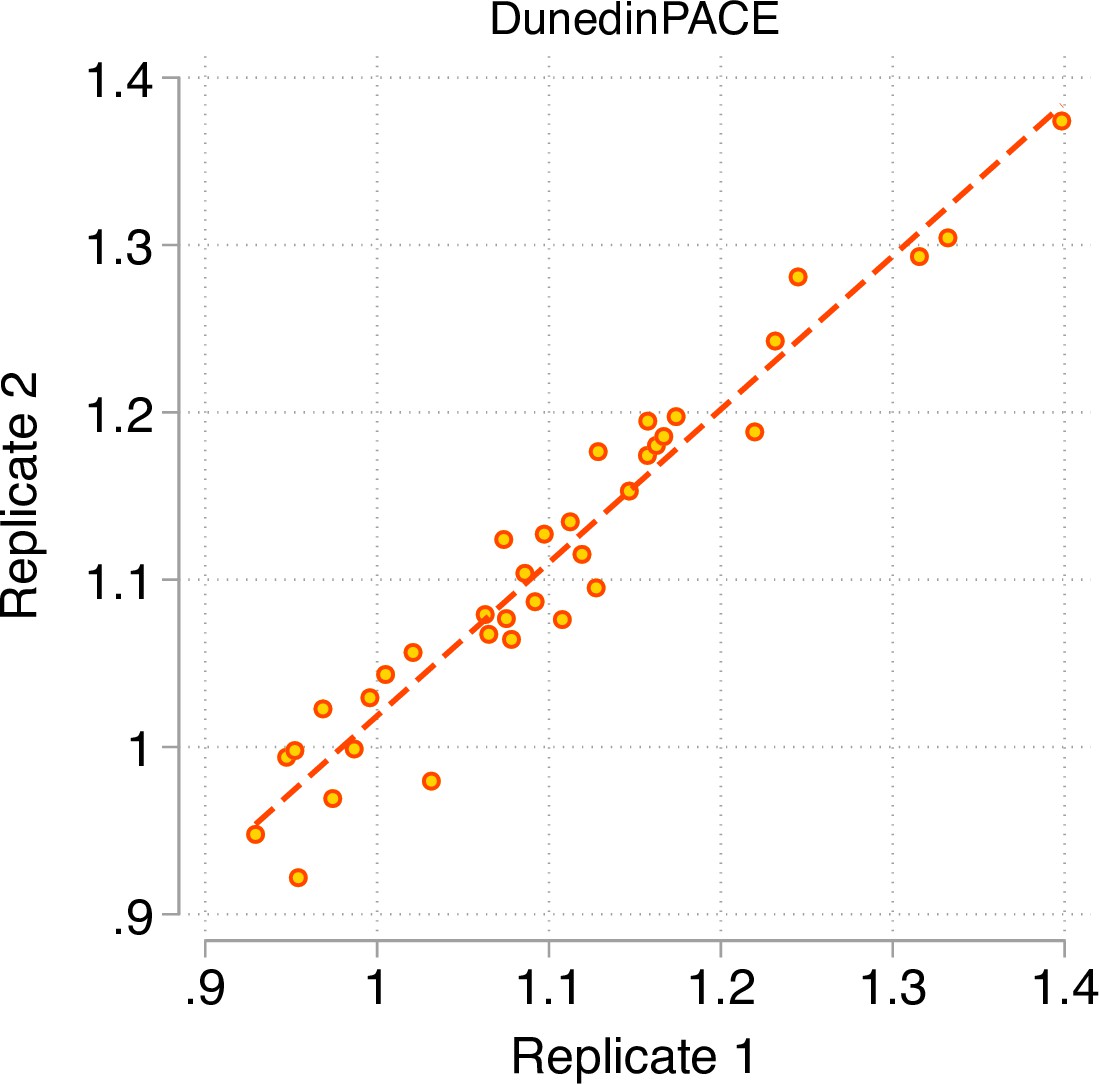
Test-retest reliability of DunedinPACE.
The figure graphs DunedinPACE values for replicate Illumnina450k datasets for n = 36 individuals in the dataset published by Lehne and colleagues (Lehne et al., 2015) (GEO Accession GSE55763). The ICC for DunedinPACE in the Lehne dataset is 0.96 95% CI [0.92–0.98].
Figure 2—figure supplement 1

Reliability of DunedinPACE, DunedinPoAm, and DNA methylation clocks.
The figure plots intraclass correlation coefficients (ICCs) estimated from replicate DNA methylation datasets for DunedinPACE, original DunedinPoAm, and the DNA methylation clocks proposed by Horvath, Hannum et al., Levine et al. (PhenoAge), and Lu et al. (GrimAge). Error bars show 95% confidence intervals. Data are graphed from three datasets, 36 Illumina 450 k technical replicates from GSE55763 (Lehne et al., 2015), and 28 Illumina EPIC array technical replicates and 350 Illumina 450k-EPIC replicates from Sugden et al., 2020. The Sugden et al. EPIC technical replicate dataset (Sugden A) included arrays analyzed as part of the Dunedin Study dataset. The Sugden et al. 450k-EPIC dataset (Sugden B) was used to identify probes for inclusion in the machine learning analysis from which DunedinPACE was derived.
Figure 3 with 1 supplement
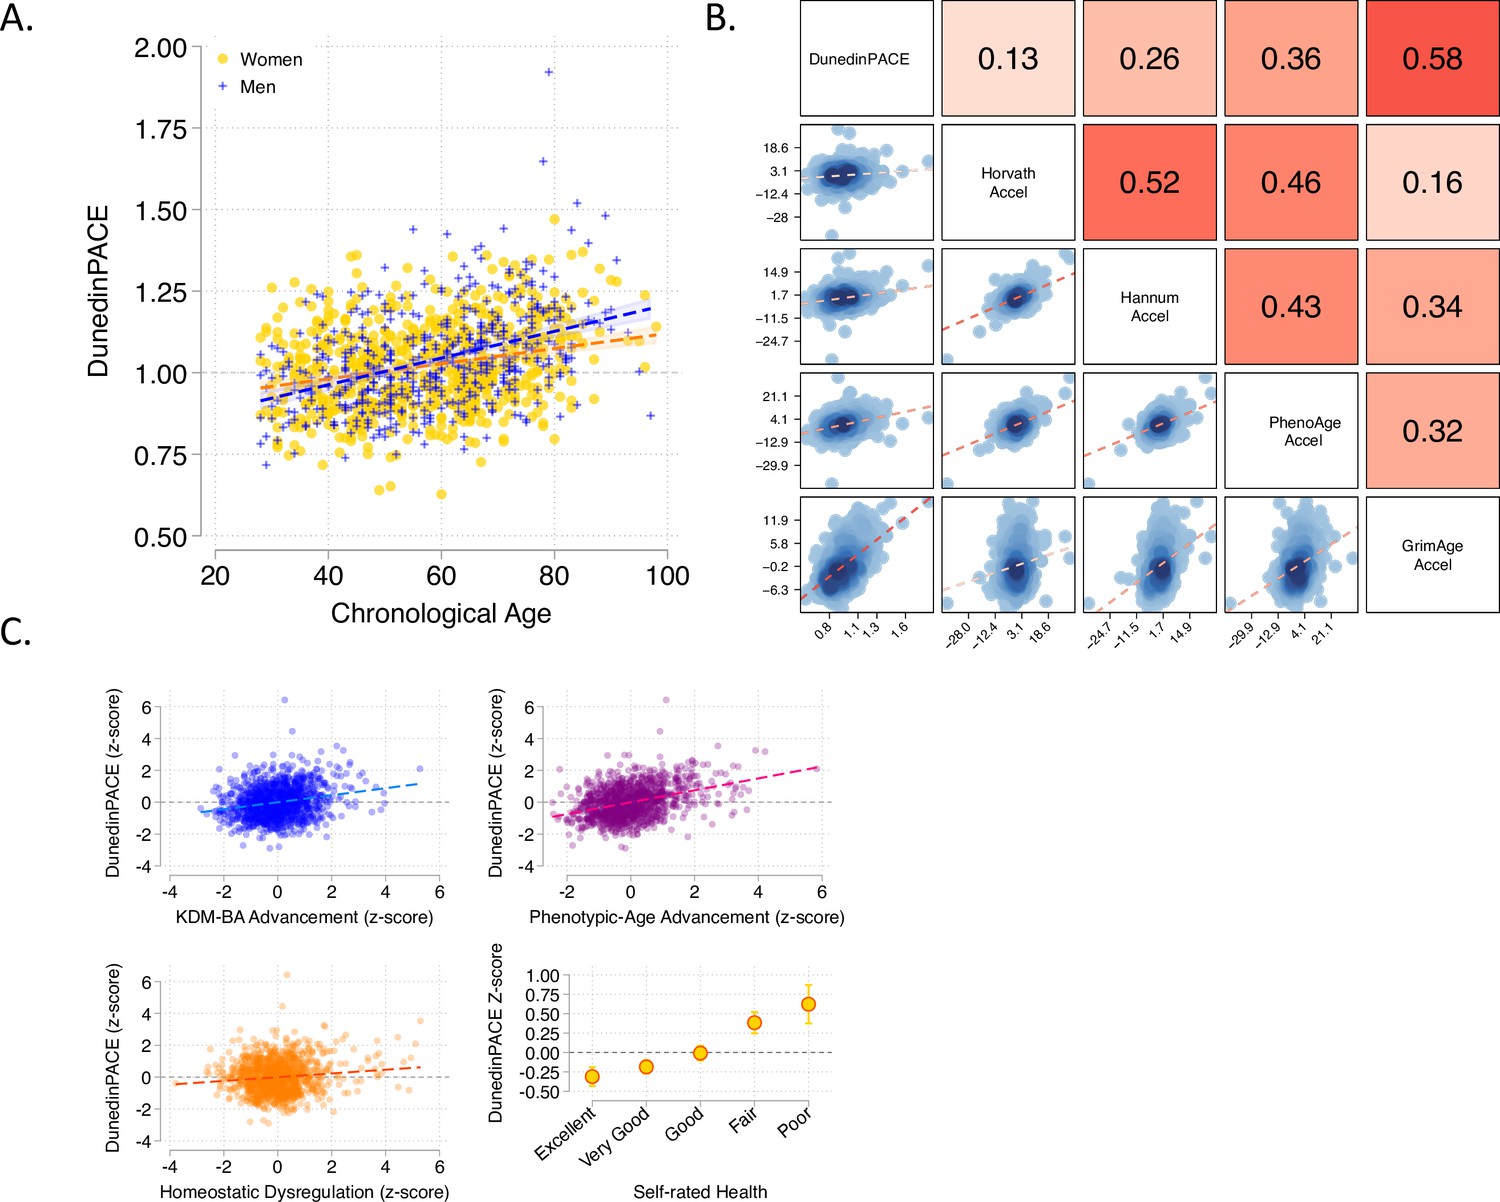
Associations of DunedinPACE with chronological age, epigenetic clocks, Physiology-based measures of biological age, and self-rated health in Understanding Society.
Panel A shows a scatterplot and fitted slopes illustrating the association between chronological age (x-axis) and DunedinPACE (y-axis) in women and men in the Understanding Society sample. Data for women are plotted with yellow dots (orange slope) and for men with blue crosses (navy slope). The figure illustrates a positive association between chronological age and DunedinPACE (Pearson r = 0.32). Panel B shows a matrix of correlations and association plots among DunedinPACE and age-acceleration residuals of Horvath, Hannum, Levine-PhenoAge and Lu-GrimAge epigenetic clocks. The diagonal cells of the matrix list the DNA methylation measures. The half of the matrix below the diagonal shows scatter plots of associations. For each scatter-plot cell, the y-axis corresponds to the variable named along the matrix diagonal to the right of the plot and the x-axis corresponds to the variable named along the matrix diagonal above the plot. The half of the matrix above the diagonal lists Pearson correlations between the DNA methylation measures. For each correlation cell, the value reflects the correlation of the variables named along the matrix diagonal to the left of the cell and below the cell. Panel C graphs scatterplots of associations of DunedinPACE with three physiology-based measures of biological age (KDM Biological Age Advancement, r = 0.30 [0.24–0.36]; Phenotypic Age Advancement, r = 0.32 95% CI [0.26–0.38]; and Homeostatic Dysregulation r = 0.09 [0.03–0.16]) and a plot of DunedinPACE means and 95% confidence intervals by self-rated health category (r = 0.20 [0.15–0.26]).
Figure 3—figure supplement 1
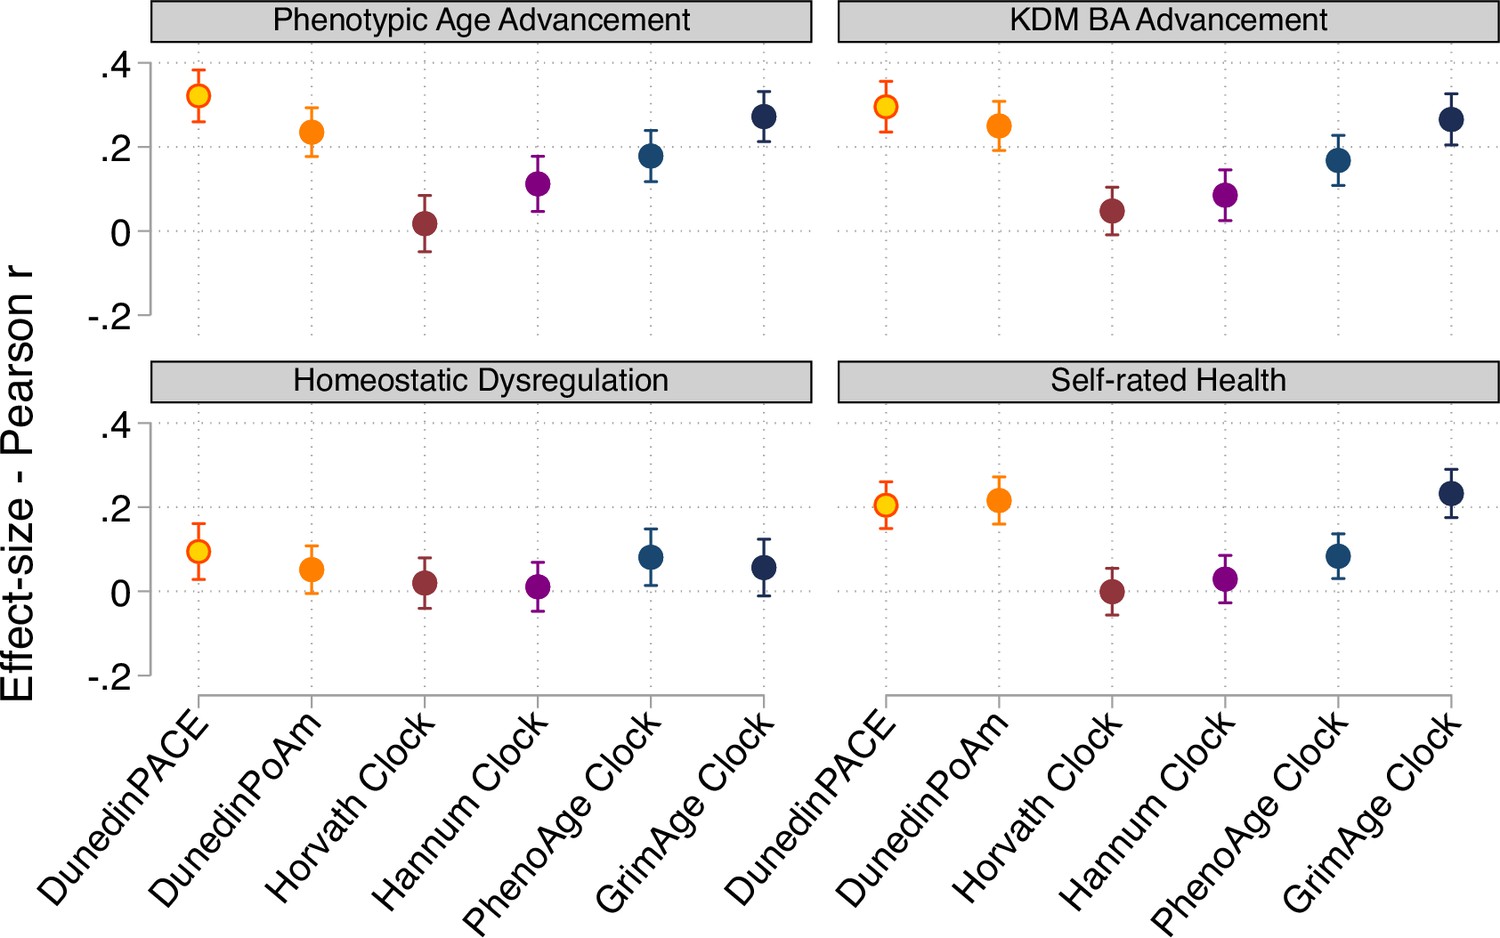
Effect-sizes for associations of DunedinPACE, DunedinPoAm, and DNA methylation clocks with physiology-based measures of biological age and self-rated health.
Figure shows effect-sizes estimated from the Understanding Society data (n=1,175). Effect-sizes are reported as standardized regression coefficients interpretable as Pearson r values. Error bars show 95% confidence intervals. DNA methylation clocks were residualized for chronological age prior to analysis. Models included covariates for chronological age and sex. Physiology-based measures of biological age were computed from Understanding Society biomarker data (albumin, alkaline phosphatase, creatinine, C-reactive protein, blood urea nitrogen, glycated hemoglobin, systolic blood pressure, and forced expiratory volume in 1second) based on algorithms derived in data from the US NHANES according to the methods developed by Levine et al., 2018, (Klemera and Doubal, 2006), and (Cohen et al., 2013).
Figure 4 with 4 supplements
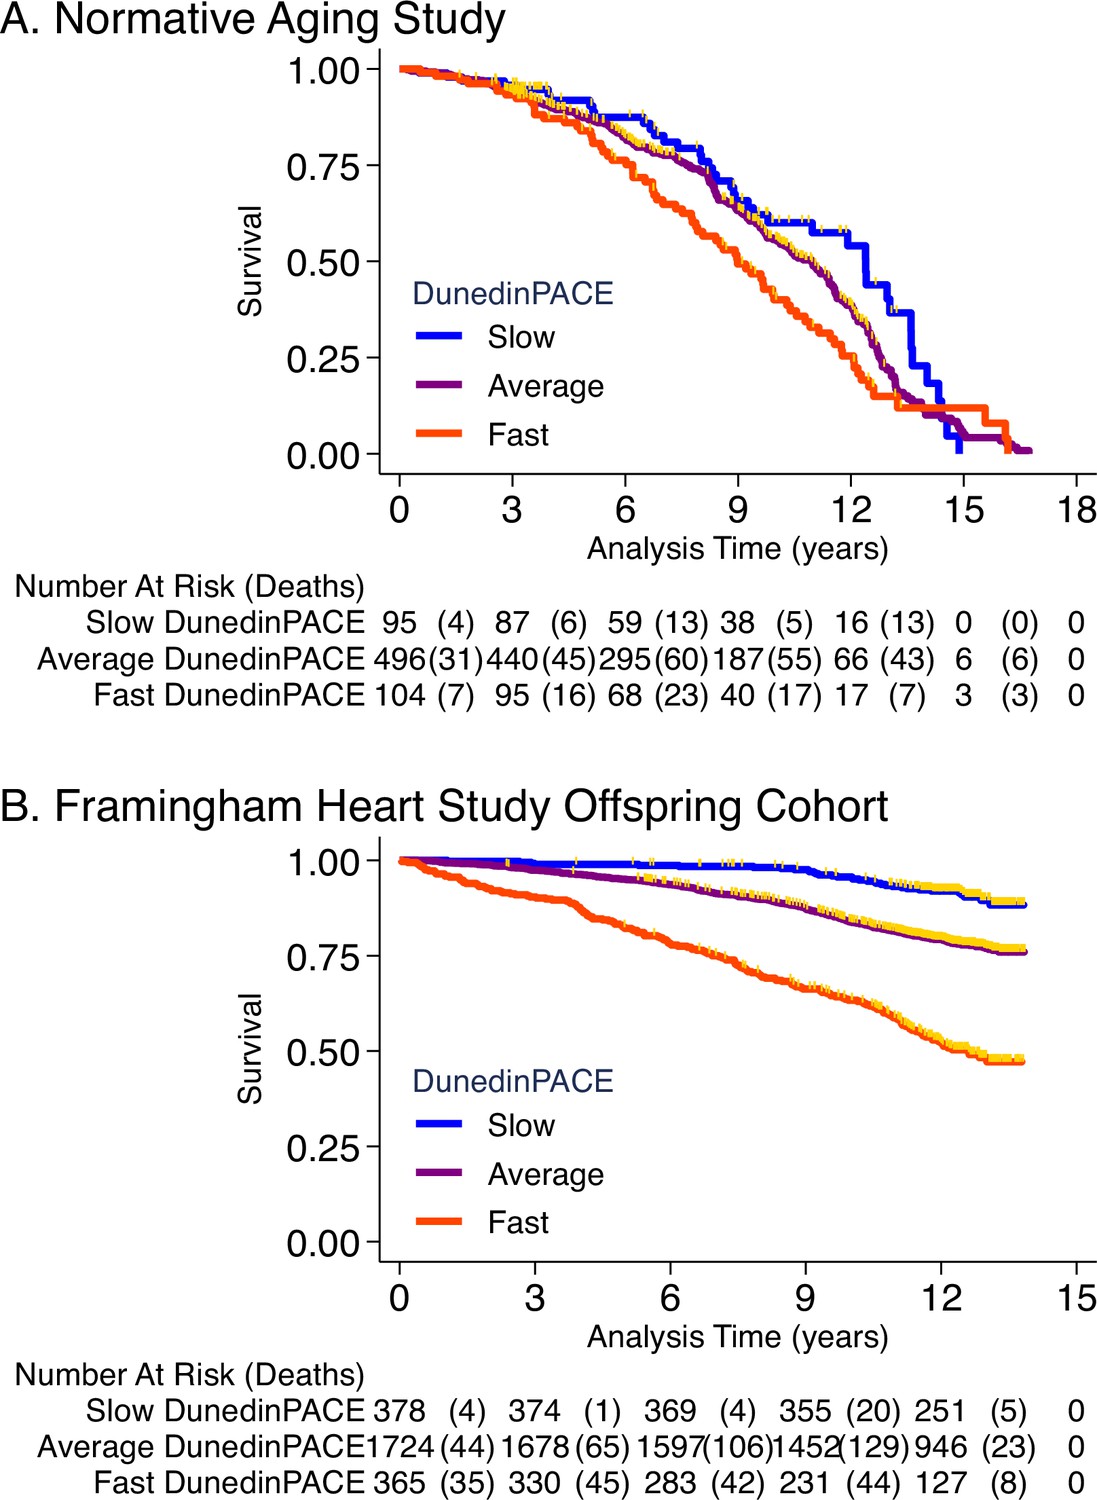
Association of DunedinPACE with mortality.
Panel A shows mortality in the Normative Aging Study (NAS). Panel B shows mortality in the Framingham Heart Study Offspring Cohort. The figure plots Kaplan-Meier curves for three groups of participants in each of the two cohorts: those with DunedinPACE 1 SD or more below the mean (‘slow’ DunedinPACE, blue line); those with DunedinPACE within 1 SD of the mean (‘average’ DunedinPACE, purple line); and those with DunedinPACE 1 SD or more above the mean (‘fast’ DunedinPACE, red line). Censoring of participants prior to death is indicated with a gold hash marks. The table below the figure details the number of participants at risk per 3-year interval and, in parentheses, the number who died during the interval.
Figure 4—figure supplement 1
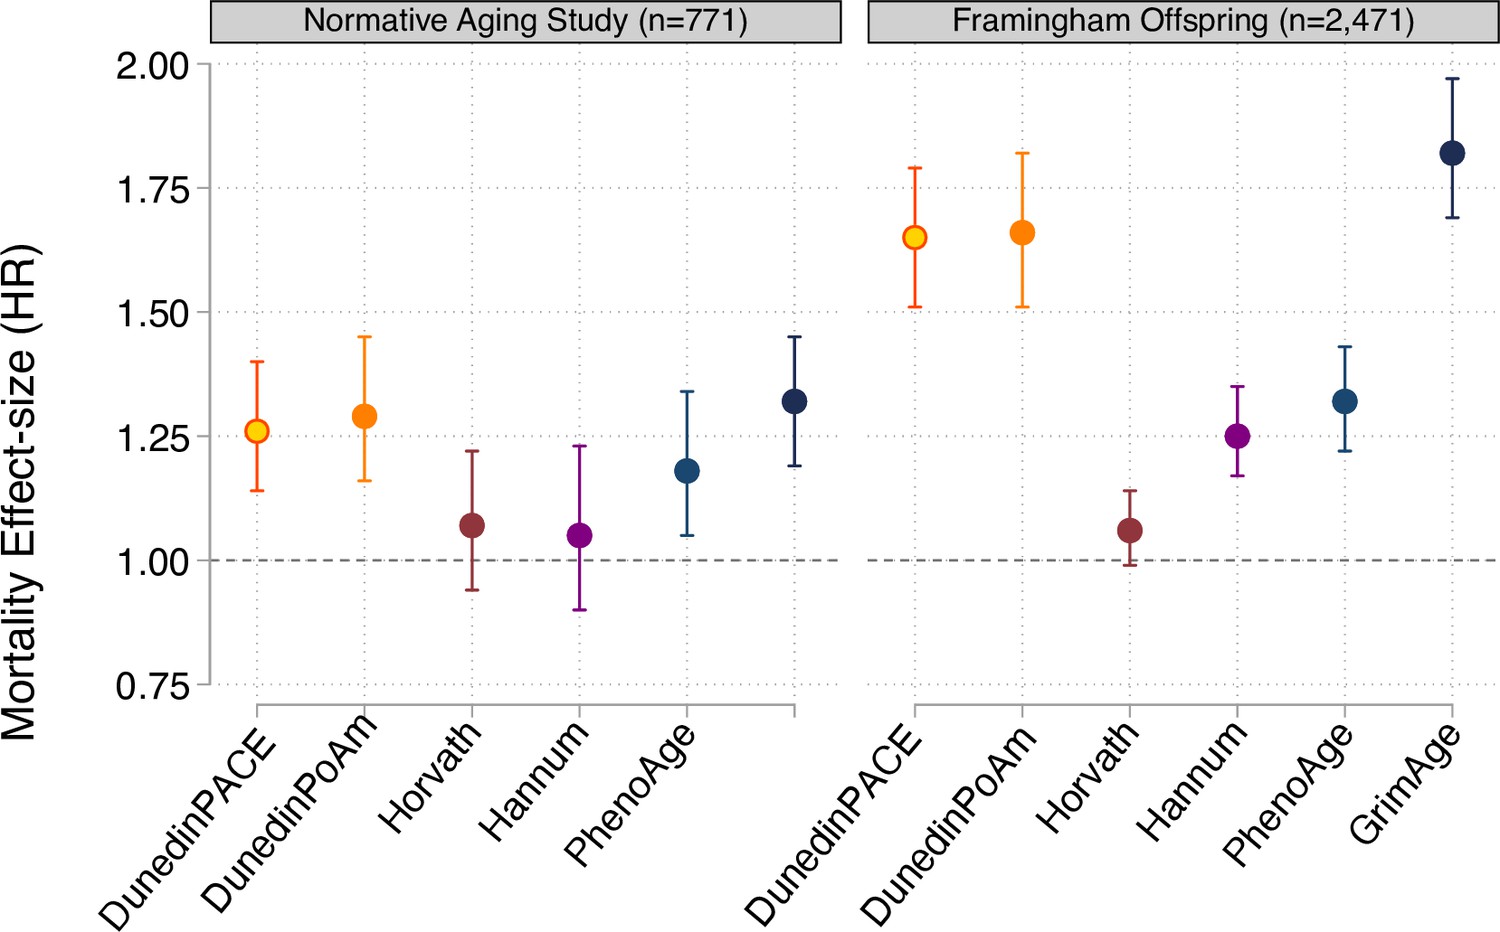
Effect-sizes for analysis of mortality in the Normative Aging Study and the Framingham Heart Study Offspring cohort.
Effect-sizes are reported as hazard ratios (HR) per standard deviation increment of the aging measures estimated from Cox proportional hazard regression. All models included covariates for chronological age and sex.
Figure 4—figure supplement 2
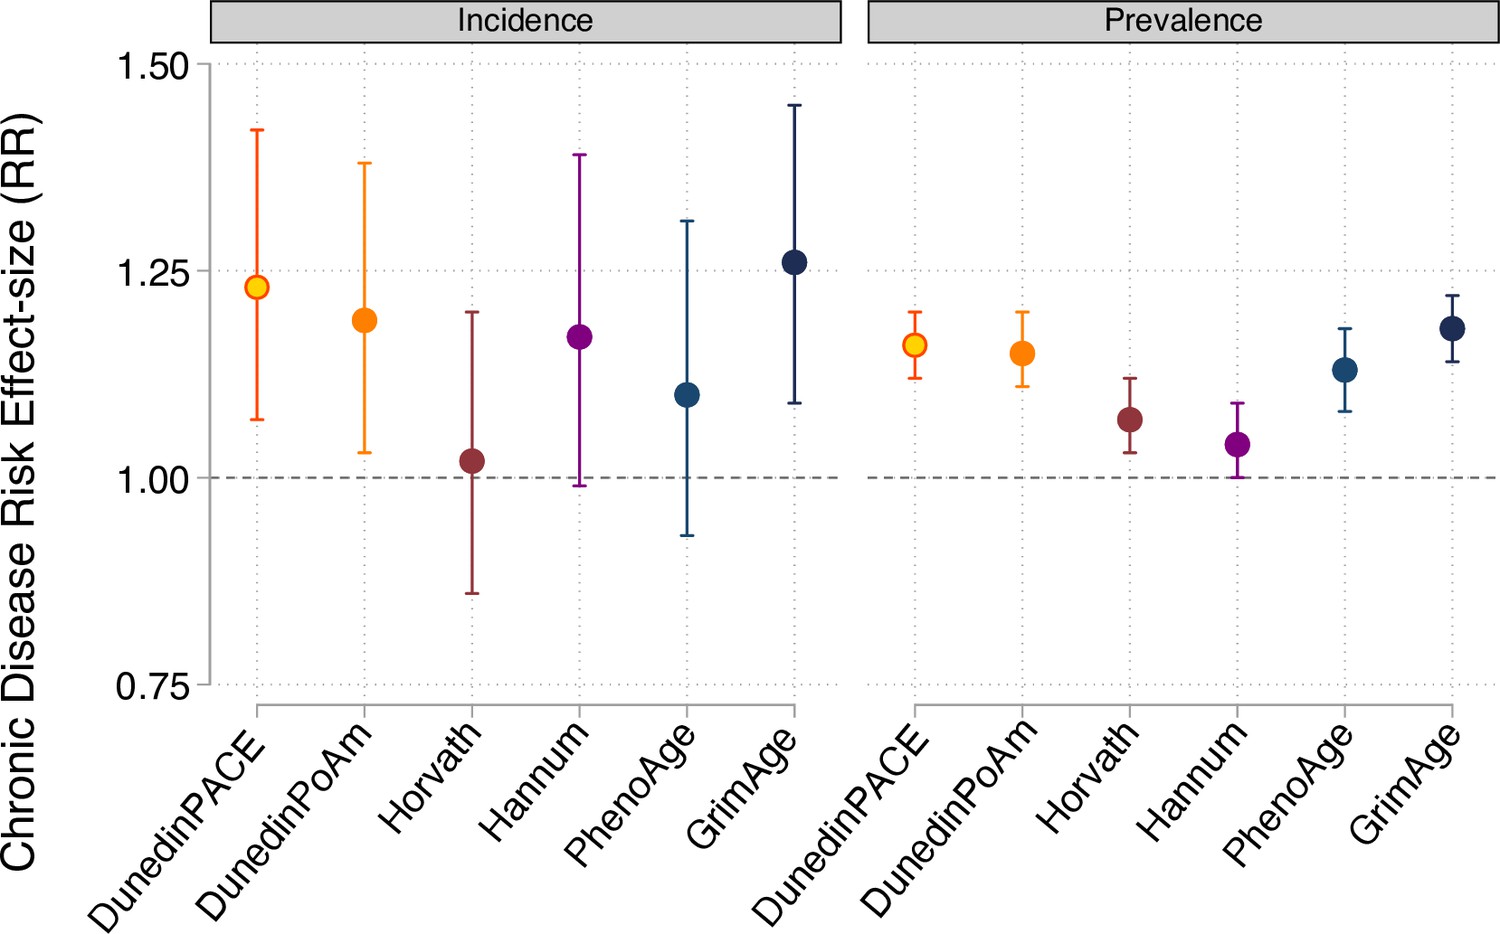
Effect-sizes for analysis of incident and prevalent chronic disease morbidity in the Normative Aging Study.
Effect-sizes are reported as relative risks (RR) per standard deviation increment of the aging measures estimated from Poisson regression. All models included covariates for chronological age and sex.
Figure 4—figure supplement 3

Effect-sizes for analysis of time-to-diagnosis with cardiovascular disease (CVD) and time to stroke or transient ischemic attack (TIA) in the Framingham Heart Study Offspring Cohort.
Effect-sizes are reported as hazard ratios (HR) per standard deviation increment of the aging measures estimated from Cox proportional hazard regression. All models included covariates for chronological age and sex.
Figure 4—figure supplement 4
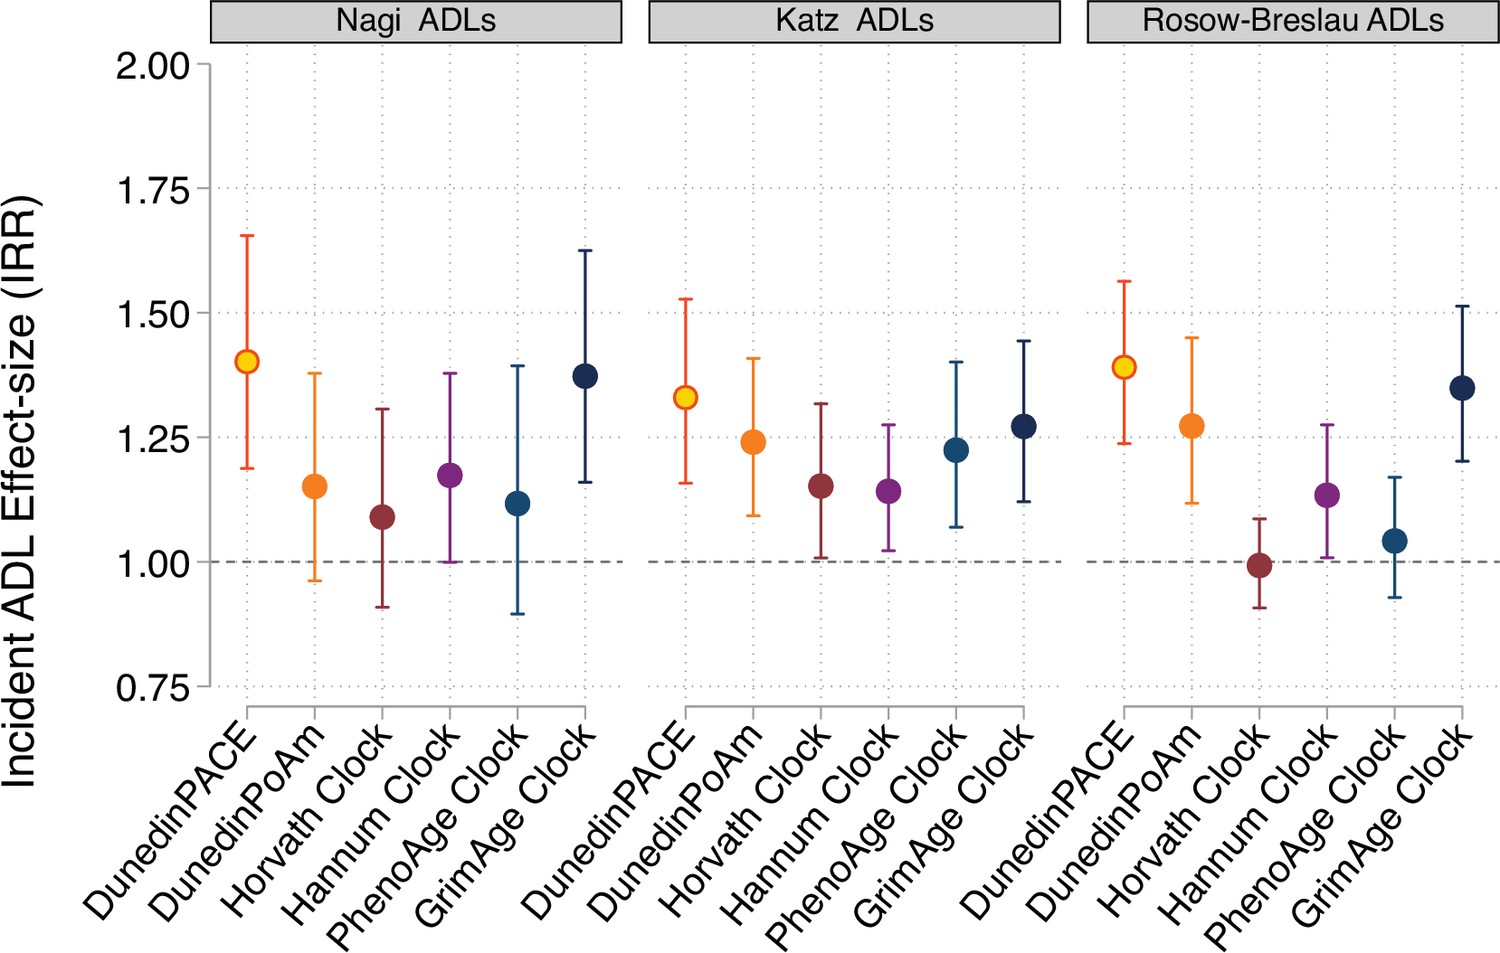
Effect-sizes for analysis of incident disability from repeated-measures of limitations to activities of daily living (ADLs).
For all panels, error bars show 95% confidence intervals. DNA methylation clocks were residualized for chronological age prior to analysis. All models included covariates for chronological age and sex.
Figure 5 with 1 supplement
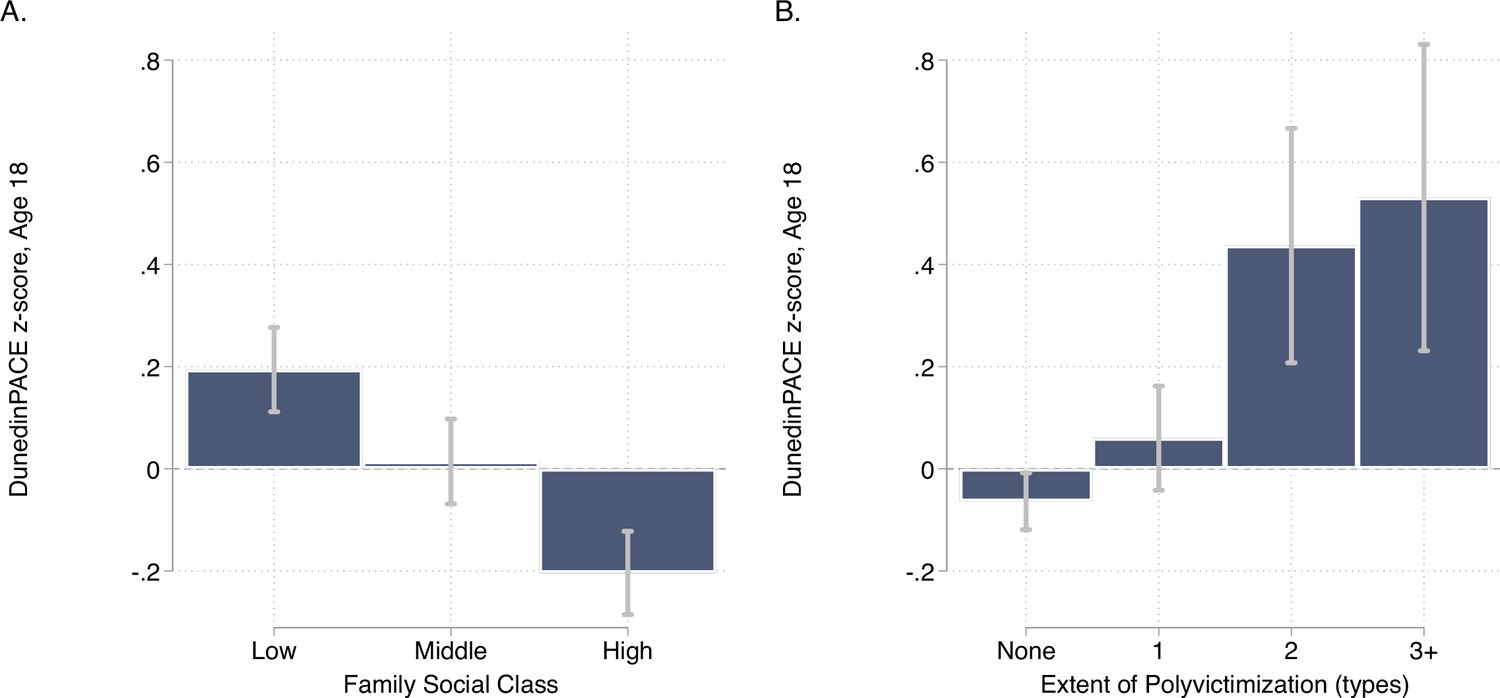
DunedinPACE levels by strata of childhood socioeconomic status (SES) and victimization in the E-Risk Study.
Panel A (left side) plots means and 95% CIs for DunedinPACE measured at age 18 among E-Risk participants who grew up low, middle, and high socioeconomic status households. Panel B (right side) plots means and 95% CIs for DunedinPACE measured at age 18 among E-Risk participants who experienced 0, 1, 2, or 3 or more types of victimization through age 12 years.
Figure 5—figure supplement 1
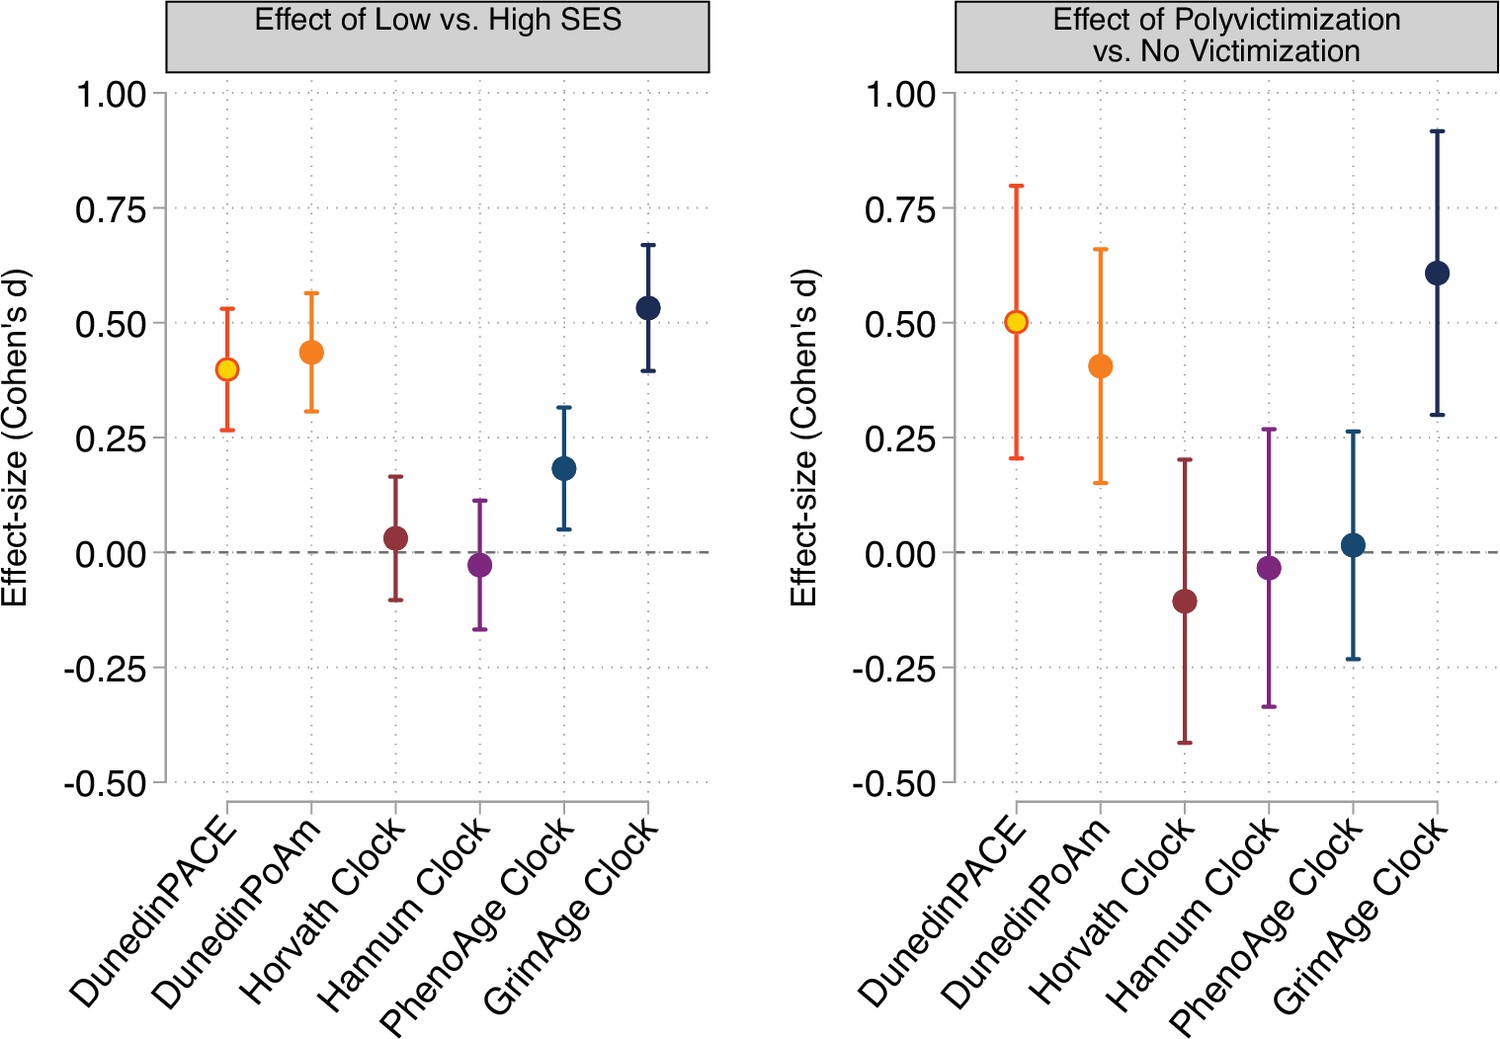
Effect-sizes for associations of childhood socioeconomic conditions and childhood victimization history with DunedinPACE, DunedinPoAm, and DNA methylation clocks at age 18.
Panel A plots effect-sizes for low socioeconomic status (SES) in childhood (vs. high SES in childhood). Panel B plots effect-sizes for childhood polyvictimization (vs. no childhood victimization). Effect-sizes are reported as Cohen’s d. For both panels, error bars show 95% confidence intervals. DNA methylation clocks were residualized for chronological age prior to analysis. All models included sex as a covariate. (All E-Risk participants are the same chronological age; no age covariate is needed.).
Additional files
-
Supplementary file 1
Supplementary file 1A-E.
(A) Measurements included in modeling Pace of Aging in the Dunedin Study Birth Cohort. We measured Pace of Aging from repeated assessments of a panel of 19 biomarkers: Body mass index (BMI), Waist-hip ratio, Glycated hemoglobin, Leptin, Blood pressure (mean arterial pressure), Cardiorespiratory fitness (VO2Max), Forced vital capacity ratio (FEV1/FVC), Forced expiratory volume in one second (FEV1), Total cholesterol, Triglycerides, High density lipoprotein (HDL), Lipoprotein(a), Apolipoprotein B100/A1 ratio, estimated Glomerular Filtration Rate (eGFR), Blood Urea Nitrogen (BUN), High Sensitivity C-reactive Protein (hs-CRP), White blood cell count, mean periodontal attachment loss (AL), and the number of dental-caries-affected tooth surfaces (tooth decay). This list includes two new biomarkers, leptin and caries, not included in the original Pace of Aging (Belsky et al., 2015), both of which have now been assessed at multiple waves, allowing growth curve modeling. Telomere length was dropped because of an emerging and yet-unresolved field-wide debate about its measurement (Nettle et al., 2021). All other biomarkers were the same. The 20 year Pace of Aging measure is described in detail elsewhere (Elliott et al., 2021b). (B) CpGs included in the DunedinPACE DNA methylation algorithm, their mean values in the Dunedin Study, and the coefficients for their weights in the DunedinPACE algorithm. (C) Independent associations of DunedinPACE with mortality, morbidity, and disability in models including covariate adjustment for DNA methylation clocks. The table reports effect-sizes for DunedinPACE and DNA methylation clocks from time-to-event analysis of mortality, cardiovascular disease (CVD), and stroke or transient ischemic attack (TIA) and repeated-measures analysis of incident limitations to activities of daily living (ADLs) in the Framingham Heart Study Offspring cohort. Each model includes DunedinPACE, one of the DNA methylation clocks, and covariates for age and sex. Time-to-event model effect-sizes are reported as hazard ratios (HR). Repeated-measures model effect-sizes are reported as incidence-rate ratios (IRR). (D) Physical and cognitive functioning and subjective signs of aging measures in the Dunedin Study. (E) Items included in Nagi, Katz, and Rosow-Breslau scales of limitations to Activities of Daily Living (ADLs).
- https://cdn.elifesciences.org/articles/73420/elife-73420-supp1-v2.docx
-
Supplementary file 2
Effect-sizes for analysis of DunedinPACE, DunedinPoAm, and DNA methylation clocks in models with covariate adjustment for age and sex only and for models with additional covariate adjustment for DNA methylation estimated cell counts and for smoking.
Effect-sizes are reported for a one standard deviation increment of DunedinPACE. Outcome variables in Dunedin Study, Understanding Society Study, and E-Risk Study (Panels A, B, C, and E) were z-transformed for analysis; effect-sizes are interpretable as Pearson r or Cohen’s d. For Normative Aging Study and Framingham Analysis (Panel C), effect-sizes for time-to event outcomes are reported as hazard ratios (HR), effect-sizes for prevalent chronic disease are reported as Risk Ratios (RR), and effect-sizes for incident disability are reported as incidence rate ratios (IRR). (A) Effect-sizes for associations of DunedinPACE, DunedinPoAm, and DNA methylation clocks with functional assessments at age 45 in the Dunedin Study. Effect-sizes are standardized coefficients from linear regressions of the outcomes on the aging measures. The models adjusted for cell counts (middle column of results) were adjusted for cell counts measured from complete blood count data (white blood cell count and percentages of lymphocytes, monocytes, neutrophils, eosinophils, and basophils). The models adjusted for smoking (left-most column of results) included a covariate for number of pack-years smoked. (B) Effect-sizes for associations of DunedinPACE, DunedinPoAm, and DNA methylation clocks with functional decline in the Dunedin Study. Decline was measured as change between the age-38 and age-45 assessments for all measures except cognition, for which change was computed over the interval beginning with an adolescent baseline test at age 13 and ending with the most recent cognitive assessment at age 45. Effect-sizes are coefficients from linear regressions of change scores on aging measures for all outcomes except incident fair/poor health, for which effect-sizes are risk ratios (RR) estimated from Poisson regression of incidence on the aging measures. Change scores were computed by standardizing baseline and follow-up measurements using the mean and standard deviation (SD) of the baseline assessment and computing the difference in standardized scores. A single unit of change therefore corresponds to 1 SD of variation at baseline. Effect-sizes are reported for a one SD difference in the aging measures. The models adjusted for smoking (left-most column of results) included a covariate for number of pack-years smoked. (C) Effect-sizes for associations of DunedinPACE, DunedinPoAm, and DNA methylation clocks with clinical-biomarker measures of biological age and self-rated health in the Understanding Society Study. Effect-sizes are standardized coefficients from linear regressions of the outcomes on the DNA methylation measures of aging. The models adjusted for smoking included covariates for smoking status and current smoking quantity (cigarettes per day). (D) Effect-sizes for associations of DunedinPACE, DunedinPoAm, and DNA methylation clocks with mortality, morbidity, and disability in the Normative Aging Study and the Framingham Heart Study Offspring Cohort. Effect-sizes are hazard ratios (HR) for time-to-event analyses and relative risks (RR) and incidence rate ratios (IRR) for repeated-measures analyses. Analysis of mortality was conducted in both cohorts. Analysis of incident and prevalent chronic disease morbidity was conducted only in the Normative Aging Study. Time-to-event analysis of cardiovascular disease (CVD) and stroke/transient ischemic attack (TIA) and repeated measures analysis of incident disability were conducted only in the Framingham Heart Study Offspring Cohort. The models adjusted for smoking included covariates for smoking history (pack-years smoked) in the Normative Aging Study and for smoking status and current smoking quantity (cigarettes per day) in the Framingham Heart Study. (E) Effect-sizes for associations of childhood socioeconomic status (SES) and childhood victimization with aging measures in the E-Risk Study. Effect-sizes are standardized coefficients (Cohen’s d) from linear regressions of the aging measures on exposure groups (low and middle SES vs. high SES; one, two, and three or more types of victimization vs. no victimization). Models included covariate adjustment for sex. Standard errors were clustered at the family level to account for non-independence of sibling data.
- https://cdn.elifesciences.org/articles/73420/elife-73420-supp2-v2.xlsx
-
Transparent reporting form
- https://cdn.elifesciences.org/articles/73420/elife-73420-transrepform1-v2.pdf
Download links
A two-part list of links to download the article, or parts of the article, in various formats.
Downloads (link to download the article as PDF)
Open citations (links to open the citations from this article in various online reference manager services)
Cite this article (links to download the citations from this article in formats compatible with various reference manager tools)
DunedinPACE, a DNA methylation biomarker of the pace of aging
eLife 11:e73420.
https://doi.org/10.7554/eLife.73420


