Oxytocin neurons mediate the effect of social isolation via the VTA circuits
- Department of Basic Neuroscience, University of Geneva, Switzerland
- Laboratory of Child Growth and Development, University of Geneva, Switzerland
- Division of Neonatology and Pediatric Intensive Care, Children's University Hospital of Geneva, Switzerland
Figures
Figure 1 with 3 supplements
Adolescence acute social isolation induces social craving.
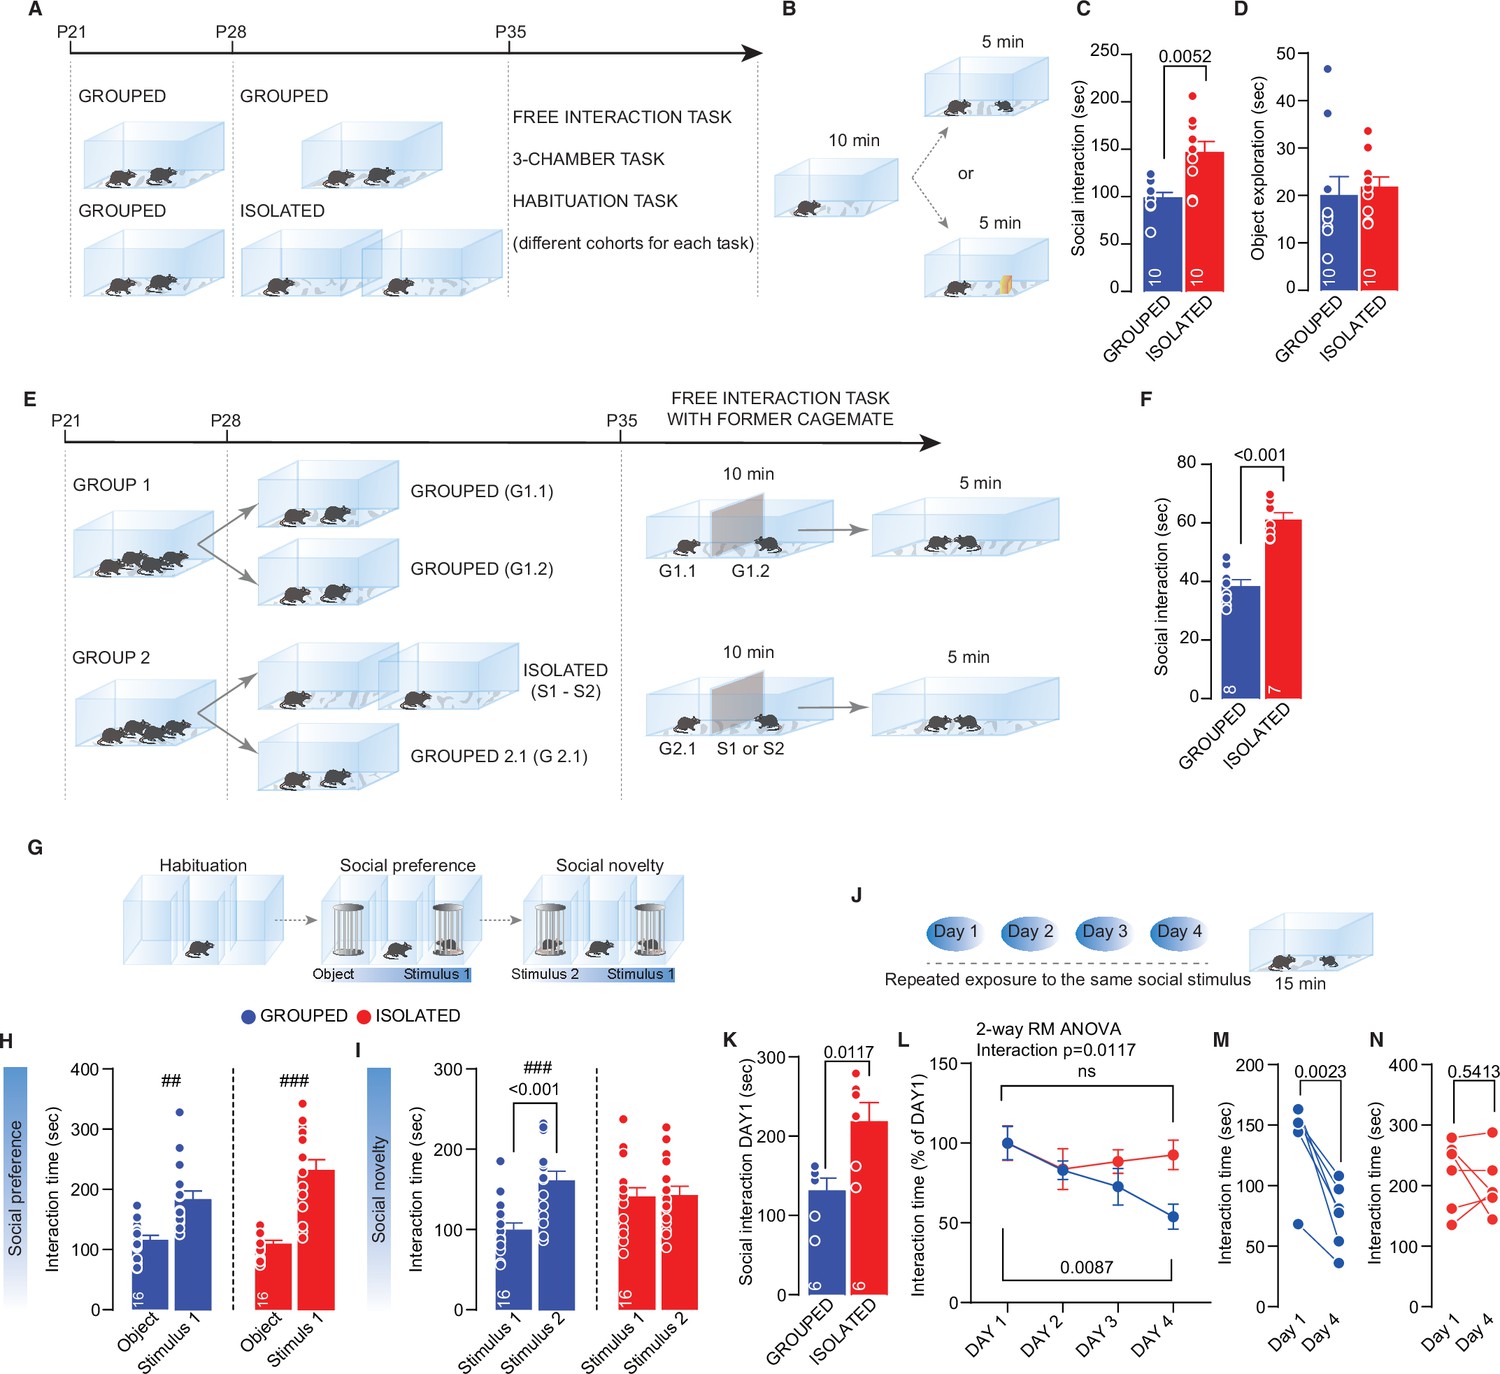
(A) Experimental design: WT mice were isolated between P28 and P35 or kept in group. After isolation, mice (from different cohorts) were subjected to different behavioral task. (B) Free direct interaction task paradigm. (C) Time exploring social stimulus (Mann-Whitney U-test=14, p=0.0052, n=10 mice each group). (D) Time exploring object (Mann-Whitney U-test=33, p=0.2176, n=10 mice each group). (E) Experimental design: mice were house four per cage from P21 to P28. At P28, one group of mice were divided in two cages with two mice each, while a second group was divided in one cage with two mice and two cages with one mouse until P35. After isolation, a free-interaction with former cage mate was carried out. (F) Interaction time with former cage mate (Unpaired sample t-test, t(13)=6.885, p<0.001). (G) Three-chamber task experimental paradigm. (H) Interaction time with object or social stimulus 1 (Grouped ## Wilcoxon matched-pairs signed rank test, W=118, p=0.001; Isolated ### Paired sample t-test, t(15)=5.975, p<0.001. Two-way RM-ANOVA. Target main effect F(1, 30)=51.47, p<0.001; House condition main effect F(1, 30)=3.935, p=0.0565; Target × House condition F(2, 60)=9.487, p>0.001, n=16). (I) Interaction time with stimulus 1 (familiar) and stimulus 2 (unfamiliar) (Grouped ### Paired sample t-test, t(15)=5.774, p<0.001; Isolated ### Paired sample t-test, t(15)=0.102, p=0.9201. Two-way RM-ANOVA followed by Bonferroni’s multiple comparisons test. Target main effect F(1, 30)=9.251, p=0.0049; House condition main effect F(1, 30)=1.164, p=0.2892; Target × House condition F(1, 30)=8.215, p=0.0075, n=16). (J) Habituation task paradigm. (K) Interaction time on Day 1 (Unpaired-samples t-test, t(10)=3.076, p=0.0117, n=6 mice each group). (L) Interaction time across 4 days (Two-way RM ANOVA followed by Tukey’s multiple comparisons test, Days main effect F(2.215, 22.15)=6.775, p=0.0041, House condition main effect F(1, 10)=1.455, p=0.2555, Days × House condition F(3, 30)=4.349, p=0.0117, Grouped Day 1 versus Day 4, p=0.0087, Isolated Day 1 versus Day 4, p=0.9094, n=6 mice each group). (M) Interaction time during Day 1 and Day 4 for Grouped mice (Paired samples t-test, t(5)=5.706, p=0.0023). (N) Interaction time during Day 1 and Day 4 for isolated mice (Paired samples t-test, t(5)=0.6552, p=0.5413). Data are represented as mean ± SEM.
-
Figure 1—source data 1
Figure 1 - raw data and statistical output.
- https://cdn.elifesciences.org/articles/73421/elife-73421-fig1-data1-v2.xlsx
Figure 1—figure supplement 1
Effects of social isolation on social behavior.
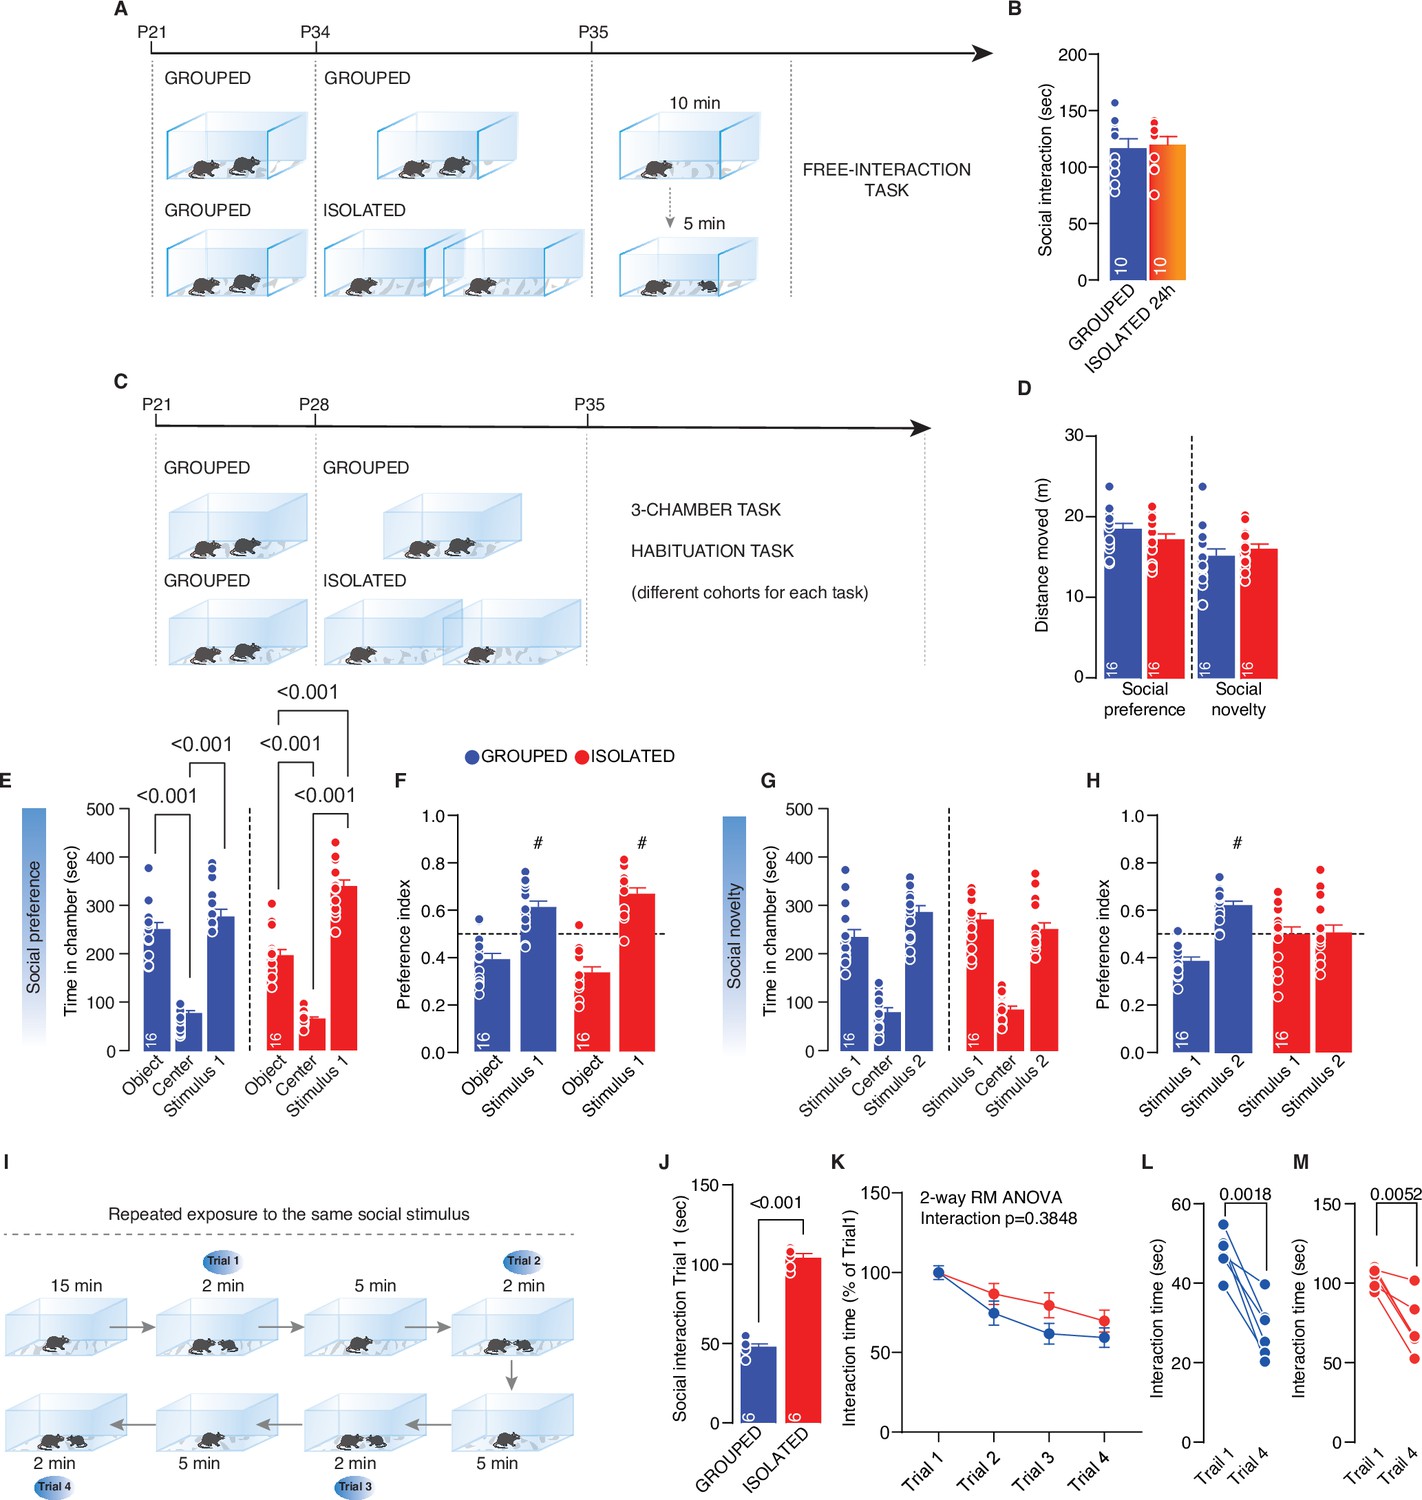
(A) Experimental design: WT mice were isolated for 24 hr between P34 and P35 or kept in group. After isolation, mice were subjected to free direct interaction task paradigm. (B) Time exploring social stimulus (Unpaired-samples t-test, t(18)=0.2817, p=0.7814, n=10 mice each group). (C) Experimental design: WT mice were isolated between P28 and P35 or kept in group. After isolation, mice were subjected to three-chamber task and habituation task (different cohorts). (D) Distance moved during the three-chamber task related to Figure 1G–I (Social preference: unpaired samples t-test t(30)=1.383, p=0.1786. Social novelty: unpaired samples t-test t(30)=0.8638, p=0.3946, Grouped n=16, Isolated n=16). (E) Time in chamber during social preference phase (Two-way RM-ANOVA followed by Tukey’s multiple comparisons test. Chamber main effect F(1.168, 35.03)=156.7, p<0.001; House condition main effect F(1, 30)=1.155, p=0.2911; Chamber × House condition F(2, 60)=9.487, p>0.001, n=16). (F) Preference index calculated as object interaction time/(object+stimulus 1) or stimulus 1 interaction time/(object+stimulus 1) (# One-sample t-test against chance level 0.5; Grouped t(15)=4.443, p<0.001; Isolated t(15)=6.766, p<0.001). (G) Time in chamber during social preference phase (Two-way RM-ANOVA followed by Tukey’s multiple comparisons test. Chamber main effect F(1.5, 44.99)=97.47, p<0.001; House condition main effect F(1, 30)=1.1376, p=0.2501; Chamber × House condition F(2, 60)=9.938, p=0.061, n=16).(H) Preference index calculated as stimulus 1 interaction time/(stimulus 2+stimulus 1) or stimulus 2 interaction time/(stimulus 2+stimulus 1) (# One-sample t-test against chance level 0.5; Grouped t(15)=7.104, p<0.001; Isolated t(15)=0.077, p=0.9). (I) Experimental paradigm: WT mice were isolated between P28 and P29 or kept in group. After isolation, mice were subjected to habituation task consisted in four repeated exposure to a same social stimulus within the same day. (J) Interaction time during trail 1 (Unpaired sample t-test, t(10)=17.01, p<0.001, n=6 each group). (K) Intercation time across Trails normalized on Trial 1 (Two-way RM-ANOVA, Trial main affect F(2.007, 20.07)=18.47, p<0.001, House condition main effect F(1. 10)=2.6, p=0.1379, Trial × House condition F(3, 30)=1.050, p=0.3848). (L–M) Interaction time within Trial 1 and Trial 4 (Paired samples t-test, Grouped (L) t(5)=6.020, p=0.0018; Isolated (M) t(5)=4.735, p=0.0052). Data are represented as mean ± SEM.
-
Figure 1—figure supplement 1—source data 1
Figure 1—figure supplement 1 - raw data and statistical output.
- https://cdn.elifesciences.org/articles/73421/elife-73421-fig1-figsupp1-data1-v2.xlsx
Figure 1—figure supplement 2
Effects of social isolation on social behavior.
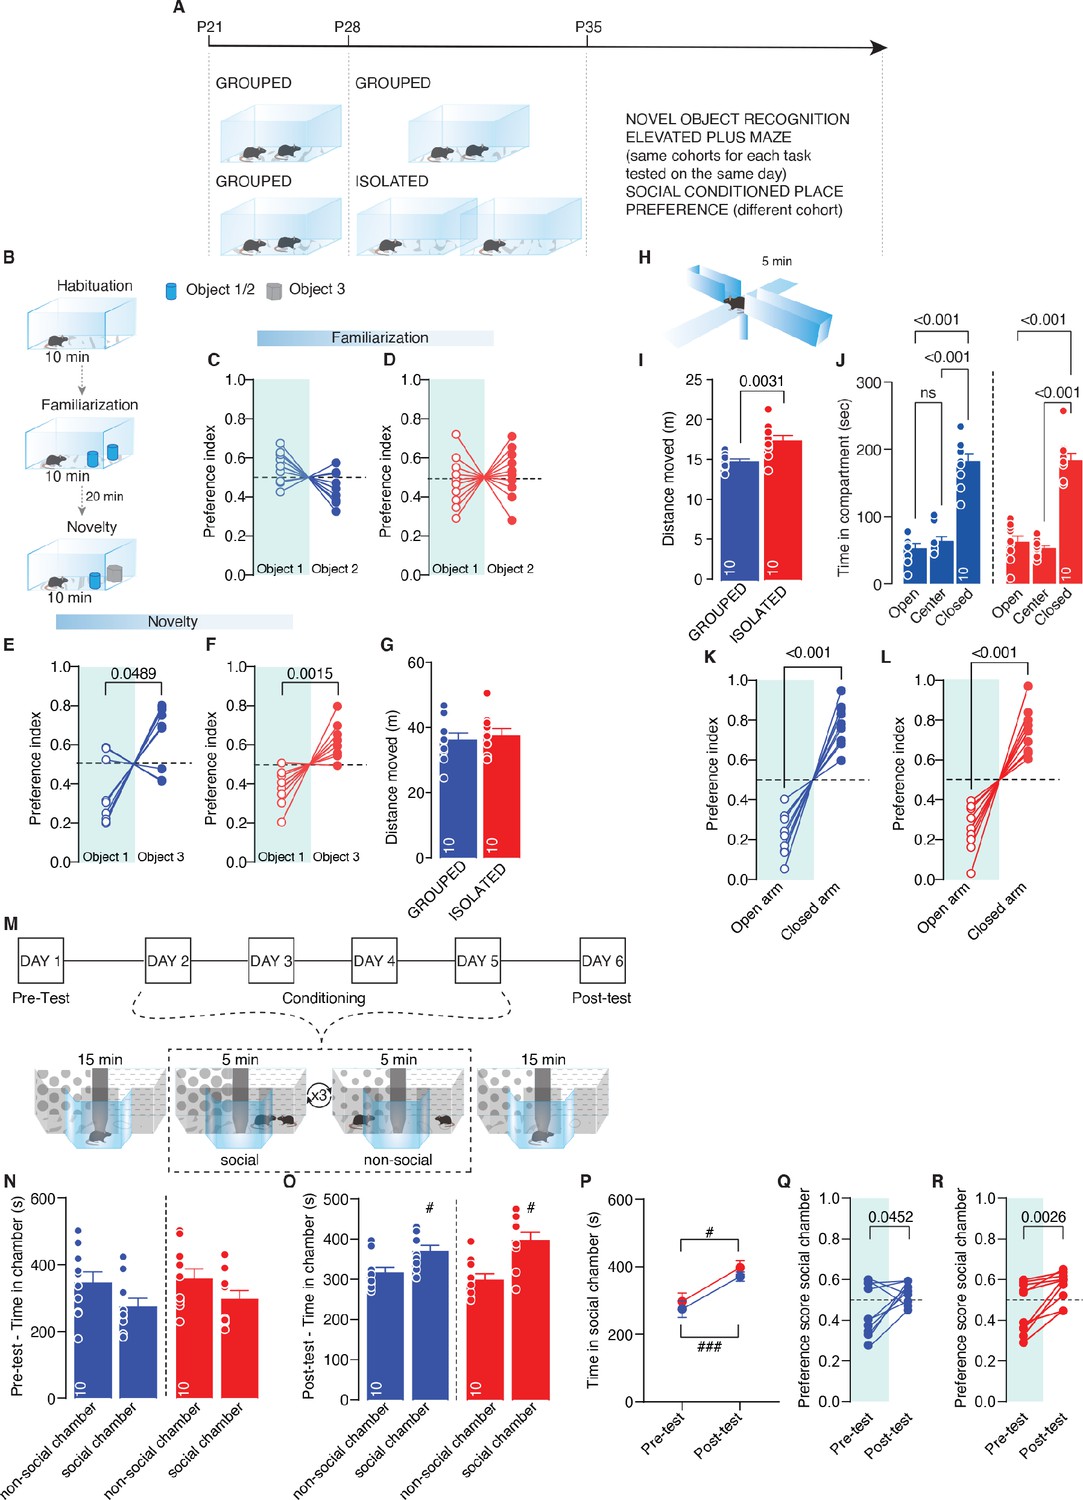
(A) Experimental design: WT mice were isolated between P28 and P35 or kept in group. After isolation, mice were subjected to Novel object recognition (NORT) and Elevated plus maze (same cohorts). (B) NORT task experimental paradigm. (C–D) Preference index during familiarization phase calculated as object 1 interaction time/(object 1+object 2) or object 2 interaction time/(object 1+object 2) (Grouped: Paired-samples t-test t(9)=2.181, p=0.0571, n=10, Isolated: Paired-samples t-test t(9)=0.5301, p=0.6088, n=10). (E–F) Preference index during novelty phase calculated as object 1 interaction time/(object 1 +object 3) or object 3 interaction time/(object 1+object 3) (Grouped: Paired-samples t-test t(9)=2.276, p=0.0489, n=10, Isolated: Paired-samples t-test t(9)=4.487, p=0.0015, n=10). (G) Distance moved (Unpaired sample t-test t(18)=0.4078, p=0.6434, Grouped n=10, Isolated n=10). (H) Elevated Plus Maze experimental paradigm. (I) Distance moved (Unpaired sample t-test t(18)=3.419, p=0.0031, Grouped n=10, Isolated n=10). (J) Time spent in compartment (One-way RM-ANOVA followed by Tukey’s multiple comparisons test. Grouped; compartment main effect F(1.306,11.76)=50.54, p<0.001, n=10; Isolated: compartment main effect F(1.182, 10.64)=56.21, p<0.001, n=10). (K–L) Preference index calculated as time in open arm/(open+close) or time in close arm/(open+close) (Grouped: Paired-samples t-test t(9)=8.101, p<0.001, n=10, Isolated: Paired-samples t-test t(9)=7.025, p<0.001, n=10). (M) social conditioned place preference (sCPP) task experimental paradigm. (N) Time in chamber during Pre-test (Grouped: Paired-samples t-test t(9)=1.448, p=0.1815, Isolated: Paired-samples t-test t(9)=1.157, p=0.2772; Two-way RM-ANOVA, Chamber main effect F(1, 18)=3.372, p=0.0829, House condition main effect F(1, 18)=1.027, p=0.3243, Chamber × House condition F(1, 18)=0.02581, p=0.8742, n=10). (O) Time in chamber during Post-test (Grouped: # Paired-samples t-test t(9)=2.297, p=0.0472, Isolated: # Paired-samples t-test t(9)=3.075, p=0.0132; Two-way RM-ANOVA, Chamber main effect F(1, 18)=14.73, p=0.0012, House condition main effect F(1, 18)=0.1818, p=0.6749, Chamber × House condition F(1, 18)=1.279, p=0.273, n=10). (P) Time in social chamber during Pre/Post-test (Grouped: # Paired-samples t-test t(9)=3.183, p=0.0111, Isolated: ### Paired-samples t-test t(9)=6.638, p<0.001; Two-way RM-ANOVA, House condition main effect F(1, 18)=0.9767, p=0.3361, Time main effect F(1, 18)=33.81, p<0.001, Time × House condition F(1, 18)=0.01413, p=0.9067, n=10). (Q–R) Preference score for social chamber (Grouped: Paired-samples t-test t(9)=2.323, p=0.0452, Isolated: Paired-samples t-test t(9)=4.118, p=0.0026, n=10). Data are represented as mean ± SEM.
-
Figure 1—figure supplement 2—source data 1
Figure 1—figure supplement 2 - raw data and statistical output.
- https://cdn.elifesciences.org/articles/73421/elife-73421-fig1-figsupp2-data1-v2.xlsx
Figure 1—figure supplement 3
Effects of social isolation during adulthood.
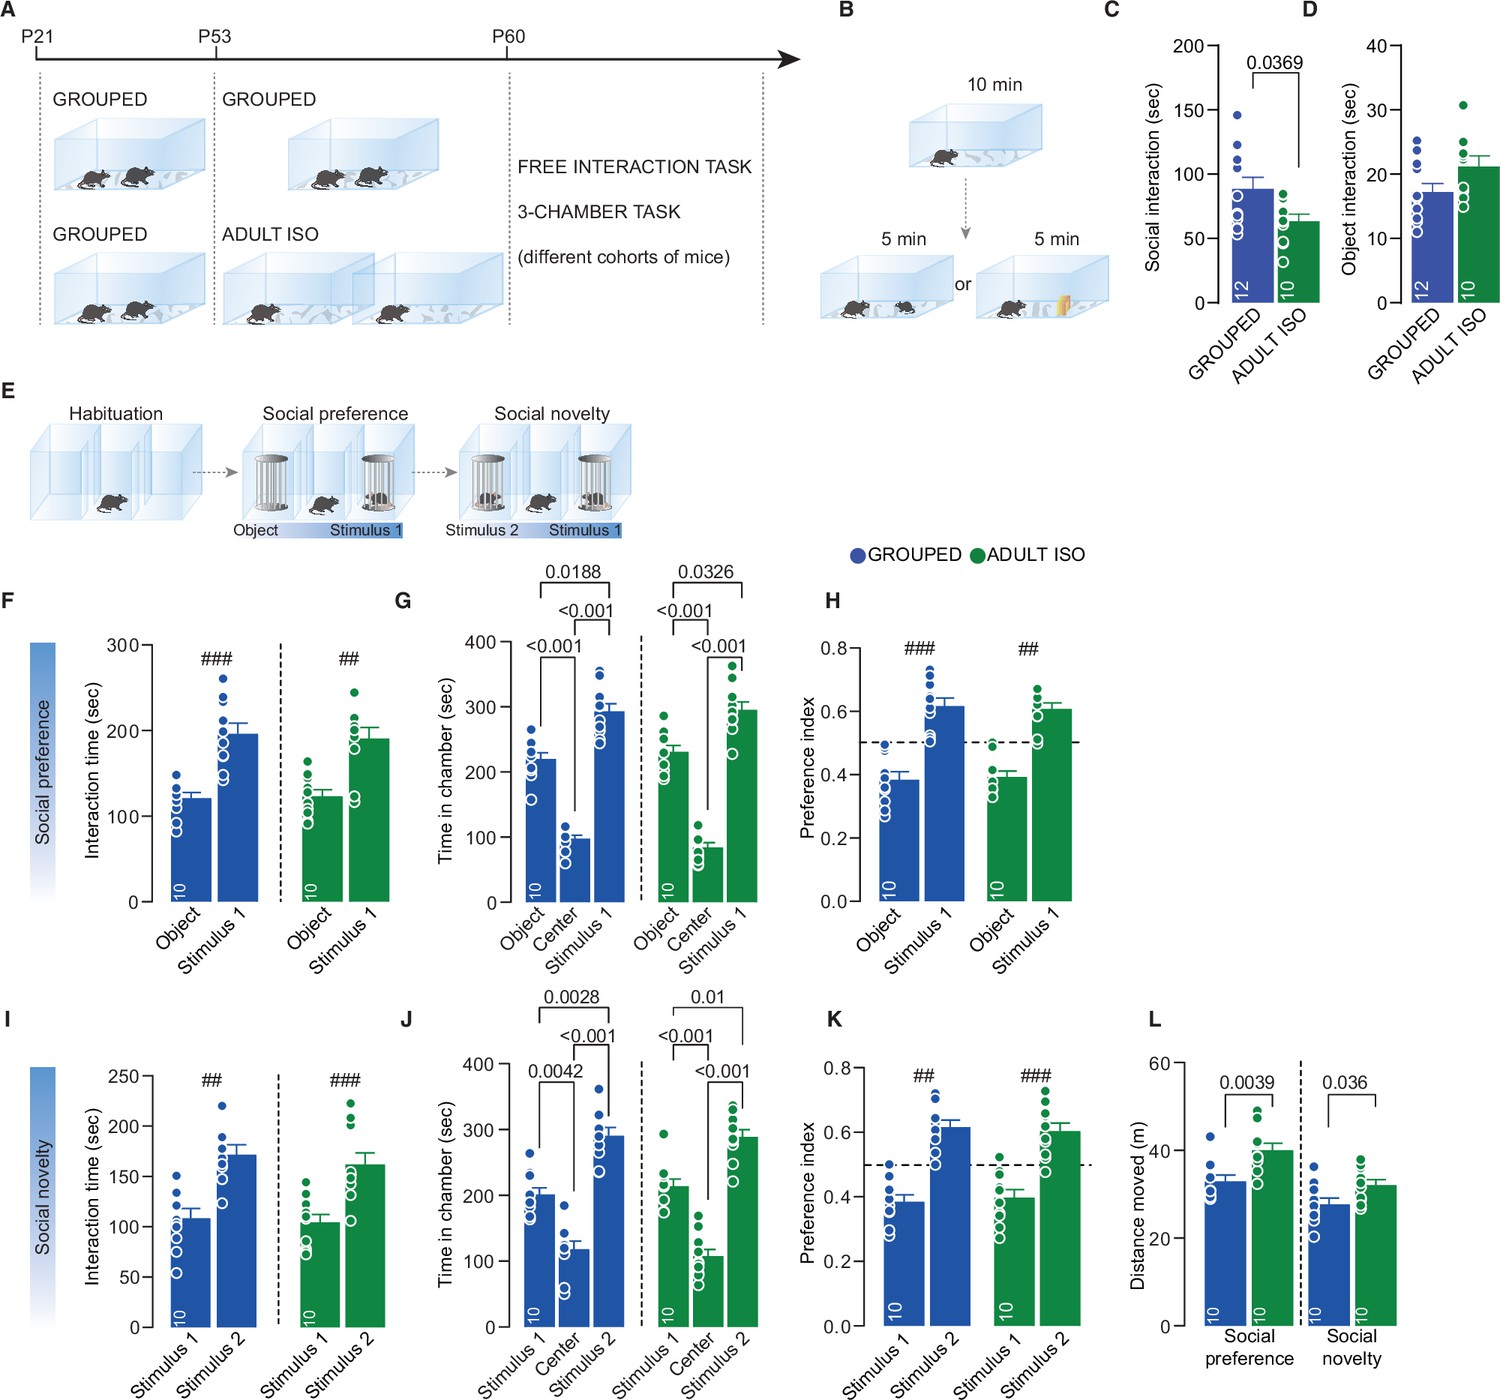
(A) Experimental design: WT mice were isolated between P53 and P60 or kept in group. After isolation, mice were subjected to different behavioral task. (B) Free direct interaction task paradigm. (C) Time exploring social stimulus (Unpaired-samples t-test, t(20)=2.237, p=0.0369, Grouped n=12, Isolated n=10). (D) Time exploring object (Unpaired-samples t-test, t(19)=1.876, p=0.0761, Grouped n=12, Isolated n=9). (E) Three-chamber task experimental paradigm. (F) Interaction time with object or social stimulus 1 (Paired sample t-test. ### Grouped: t(9)=4.941, p<0.01, n=10. ## Isolated: t(9)=4.082, p=0.0027. Two-way RM-ANOVA. Target main effect F(1, 18)=40.32, p<0.001; House condition main effect F(1, 18)=0.02823, p=0.8684; Target × House condition F(1, 18)=0.1188, p=0.7343, n=10). (G) Time in chamber during social preference phase (One-way RM-ANOVA followed by Tukey’s multiple comparisons test. Grouped; chamber main effect F(1.270, 11.43)=71.56, p<0.001, n=10; Isolated: chamber main effect F(1.594, 14.35)=75.35, p<0.001, n=10). (H) Preference index calculated as object interaction time/(object+stimulus 1) or stimulus 1 interaction time/(object+stimulus 1) (One-sample t-test against chance level 0.5; ### Grouped t(9)=5.329, p<0.001; ## Isolated t(9)=4.026, p=0.003). (I) Interaction time with stimulus 1 (familiar) and stimulus 2 (unfamiliar) (Paired sample t-test. ###Grouped: t(9)=4.736, p=0.0011; ### Isolated: t(9)=4.939, p<0.001. Two-way RM-ANOVA. Target main effect F(1, 18)=46.45, p<0.001; House condition main effect F(1, 18)=0.4045, p=0.5328; Target × House condition F(1, 18)=0.1068, p=0.7476, n=10). (J) Time in chamber during social preference phase (One-way RM-ANOVA followed by Tukey’s multiple comparisons test. Grouped; chamber main effect F(1.871 16.84) = 36.35 p < 0.001, n = 10; Isolated: chamber main effect F(1.993, 17.93) = 46.27 p < 0.001 n = 10). (K) Preference index calculated as stimulus1 interaction time/(stimulus1 +stimulus2) or stimulus2 interaction time/(stimulus1 +stimulus2) (One-sample t-test against chance level 0.5; ## Grouped t(9)=4.494 P = 0.0015; ### Isolated t(9)=5.502 p < 0.001). (L) Distance moved during the 3-chamber task (Social preference: Mann Whitney test U = 13, P = 0.0039. Social novelty: Unpaired samples t-test t(18)=2.26 P = 0.0364, n = 10 mice each group). Data are represented as mean ± SEM.
-
Figure 1—figure supplement 3—source data 1
Figure 1—figure supplement 3 - raw data and statistical output.
- https://cdn.elifesciences.org/articles/73421/elife-73421-fig1-figsupp3-data1-v2.xlsx
Figure 2
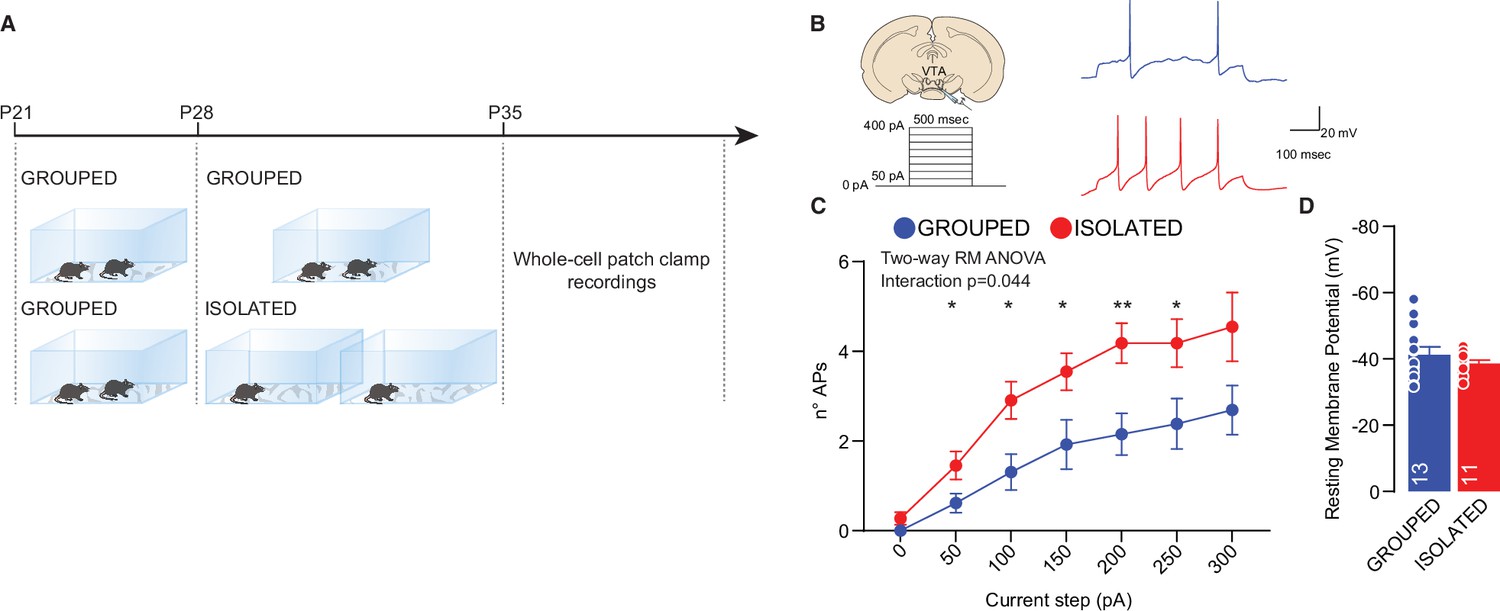
Adolescence acute social isolation induces putative VTA DA neurons hyperexcitability.
(A) Experimental design: WT mice were isolated between P28 and P35 or kept in group. After isolation, mice were subjected whole-cell patch-clamp recordings. (B) Left: experimental paradigm, putative VTA DA neurons were subjected at multiple depolarizing current steps. Right: example traces from 250 pA depolarizing current injection. (C) Number of action potentials (APs) across increasing depolarizing current steps (Two-way RM ANOVA followed by uncorrected Fisher’s LSD post doc analysis, House condition × Current step F(6, 132)=2.230, p=0.044, current step main effect F(2.310, 50.82)=36.65, p<0.001, House condition main effect F(1, 22)=8.016, p=0.0097). (D) Resting membrane potential of recorded cells (Mann-Whitney U-test=66, p=0.7762. Grouped n=13, Isolated n=11 from three mice each group). Data are represented as mean ± SEM.
-
Figure 2—source data 1
Figure 2 - raw data and statistical output.
- https://cdn.elifesciences.org/articles/73421/elife-73421-fig2-data1-v2.xlsx
Figure 3 with 1 supplement
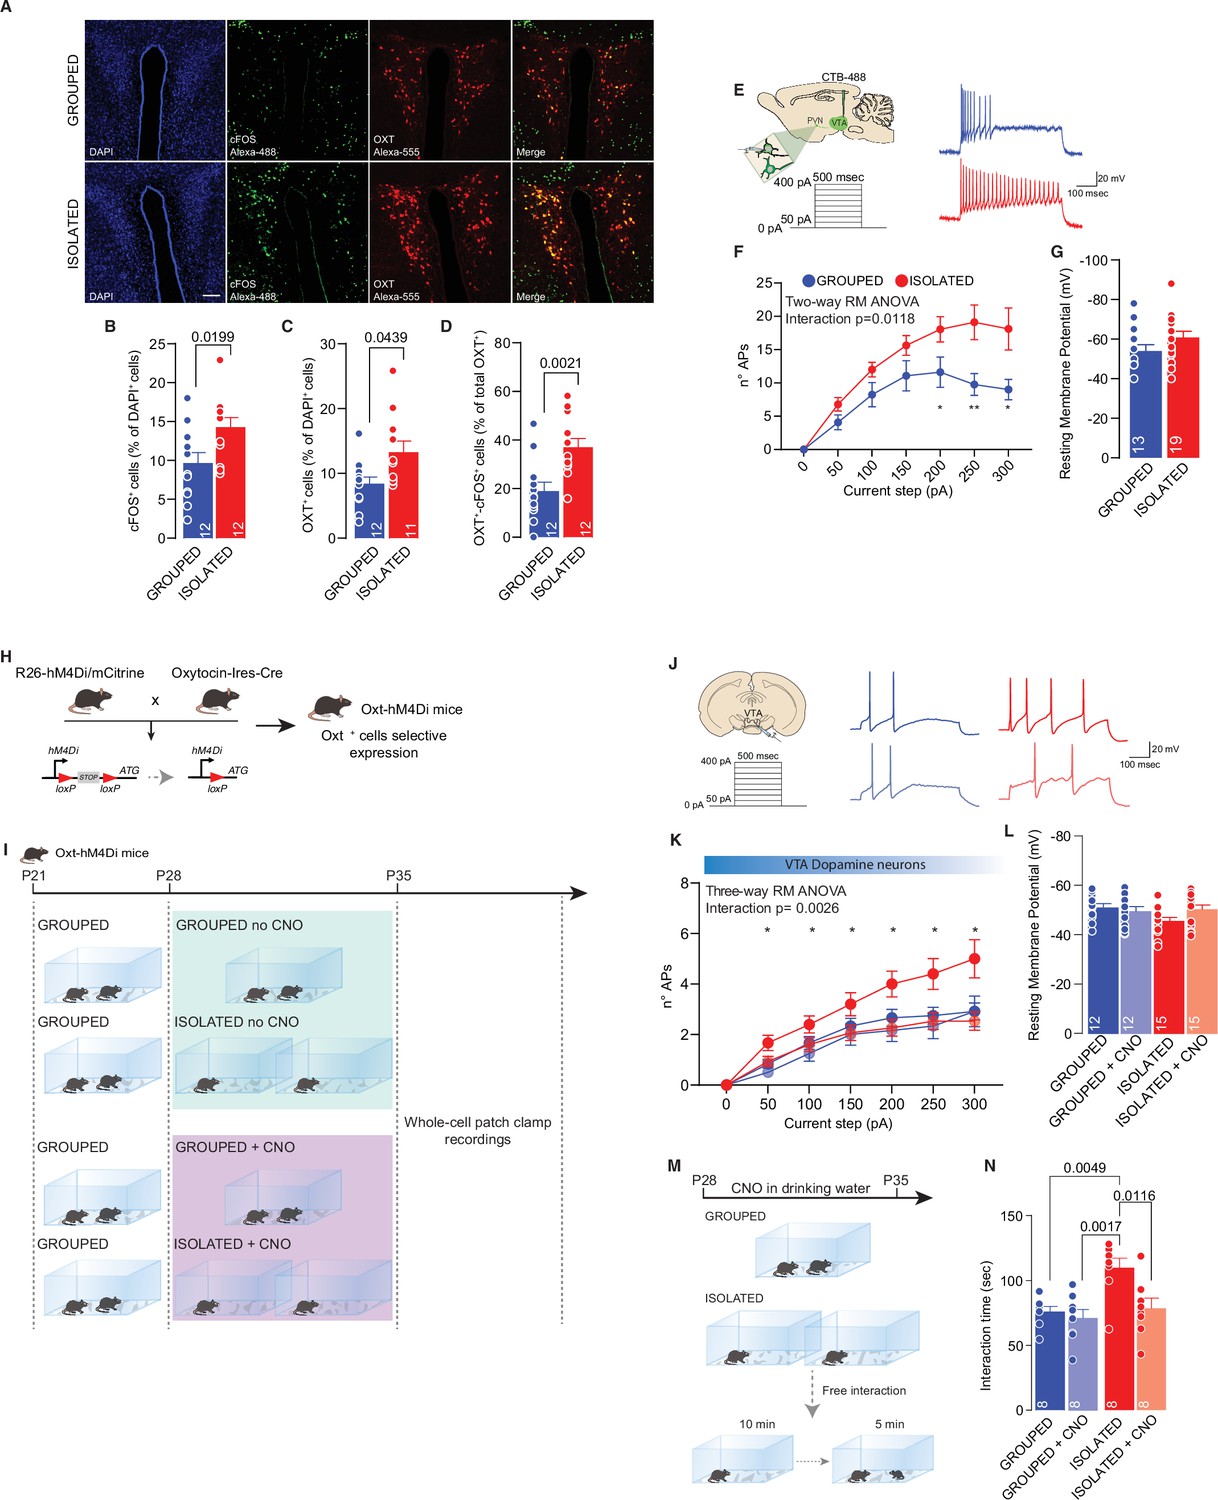
PVN OXT neurons as main orchestrator of social isolation induced social craving.
(A) Representative confocal images of PVN stained with cFOS, OXT, and AVP antibody (scale bar: 20 µm). (B) cFos+ cells (as % of DAPI+ cells) (Unpaired samples t-test, t(22)=2.510, p=0.0199, n=12 slices from three mouse each group). (C) OXT+ cells (as % of DAPI+ cells) (Mann-Whitney U-test=33, p=0.0439, n=11–12 slices from three mouse each group). (D) OXT+/ cFos+ cells (as % of total OXT+ cells) (Unpaired samples t-test, t(22)=3.491, p=0.021, n=12 slices from three mouse each group). (E) Left: experimental paradigm, PVN neurons projecting to VTA (CTB-488 was injected in the VTA at P21) were subjected at multiple depolarizing current steps. Right: example traces from 250 pA depolarizing current injection. (F) Number of action potentials (APs) across increasing depolarizing current steps (Two-way RM ANOVA followed by uncorrected Fisher’s LSD post doc analysis, House condition main effect F(1, 30)=7.306, p=0.0112, Current step main effect F(1.857, 55.71)=30.47, p<0.001, House condition × Current step F(6, 180)=2.828, p=0.018). (G) Resting membrane potential of recorded cells (Mann-Whitney U-test=85.5, p=0.1483. Grouped n=13, Isolated n=19 from three mice each group). (H) Experimental design. R26-hM4Di/mCitrine mice were crossed with Oxytocin-Ires-Cre mice generating Oxt-hM4Di mice which express inhibitory DREAAD specifically in OXT neurons. (I) Experimental paradigm: Oxt-hM4Di mice were isolated between P28 and P35 and CNO was dissolved in the drinking water. After isolation mice were subjected whole-cell patch-clamp recordings. (J) Left: experimental paradigm, VTA pDA neurons were subjected at multiple depolarizing current steps. Right: example traces from 250 pA depolarizing current injection. (K) Number of APs across increasing depolarizing current steps (Three-way RM ANOVA followed by uncorrected Fisher’s LSD post doc analysis (see Figure 3—source data 1 for details), Current step main effect F(1.962, 98.08)=114.8, p<0.0001, House condition main effect F(1, 50)=3.456, p=0.0689, CNO treatment main effect F(1, 50)=5.826, p=0.0195, Current step × House condition F(6, 300)=1.866, p=0.0865, Current step × CNO treatment F(6, 300)=3.806, p=0.0011, House condition × CNO treatment F(1, 50)=2.293, p=0.1363, Current step × House condition × CNO treatment F(6, 300)=3.459, p=0.0026). (L) Resting membrane potential of recorded cells (Two-way ANOVA, CNO treatment main effect F(1, 50)=0.8745, p=0.3542, House condition main effect F(1, 50)=1.956, p=0.1681, CNO treatment × House condition F(1, 50)=3.531, p=0.0661, Grouped n=12, Grouped +CNO n=12, Isolated n=15, Isolated+CNO n=15 from 3 to 4 mice each group). (M) Experimental design. Oxt-hM4Di mice were isolated or kept grouped from P28 to P35. CNO was dissolved in drinking water and after isolation mice underwent to free direct social interaction task. (N) Social interaction time (Two-way ANOVA followed by Tukey’s multiple comparisons test, CNO treatment main effect F(1, 28)=7.088, p=0.0127, House condition main effect F(1, 28)=9.940, p=0.0038 CNO treatment × House condition F(1 ,28)=4.334, p=0.0466, n=8 each group). Data are represented as mean ± SEM.
-
Figure 3—source data 1
Figure 3 - raw data and statistical output.
- https://cdn.elifesciences.org/articles/73421/elife-73421-fig3-data1-v2.xlsx
Figure 3—figure supplement 1
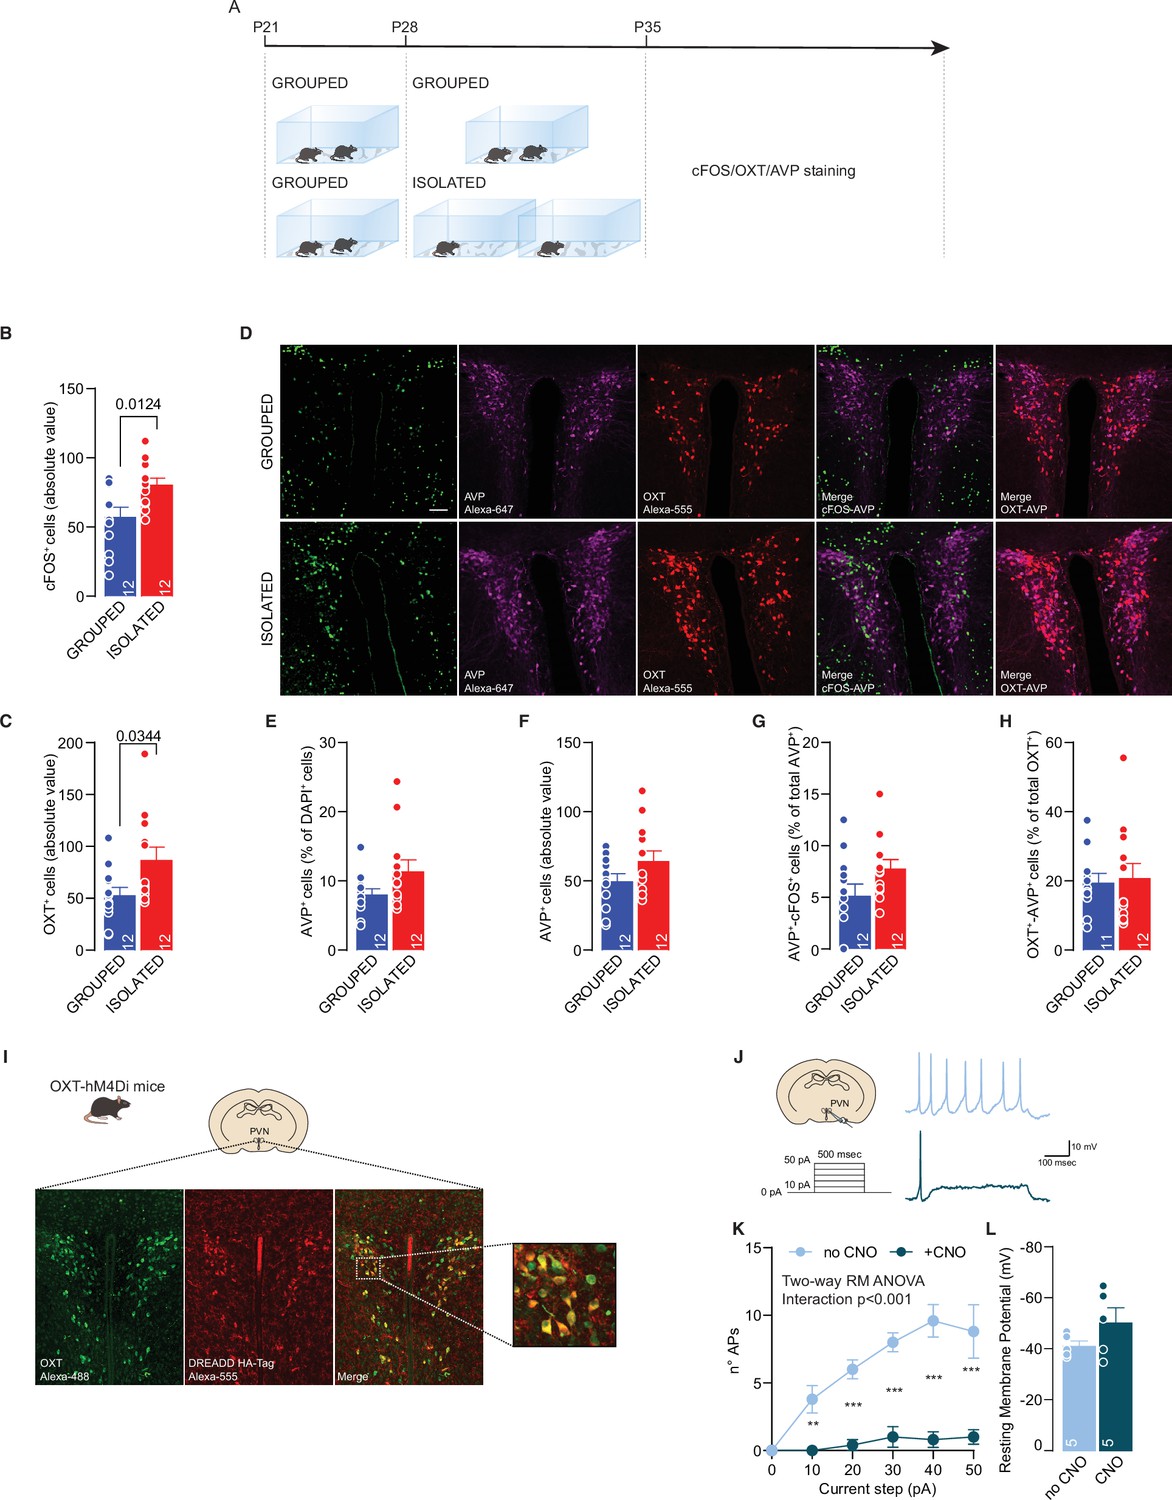
CNO validation.
(A) Experimental design: WT mice were isolated between P28 and P35 or kept in group. After isolation, mice were perfused and brain slices were immunostained with cFOS, OXT, and AVP antibody. (B) PVN cFOS+ cells (absolute value, Unpaired sample t-test, t(22)=2.723, p=0.0124). (C) PVN OXT + cells (absolute value, Mann-Whitney sample U-test=35.5, p=0.0344). (D) Representative confocal images of PNV stained with cFOS, OXT, and AVP. (E) PVN AVP+ cells (normalized on DAPI, Mann-Whitney U-test=45, p=0.1277). (F) PVN AVP+ cells (absolute value, Unpaired sample t-test, t(22)=1.569, p=0.131). (G) PVN AVP+/cFOS+ cells (Unpaired sample t-test, t(22)=1.811, p=0.0838). (H) PVN OXT+/AVP+ cells (Mann-Whitney U-test=61, p=0.7859). (I) Representative confocal images of PVN for OXT-hM4Di expression. (J) Left: experimental paradigm, OXT neurons from Oxt-hM4Di mice were subjected at multiple depolarizing current steps in absence or presence of CNO 10 µM in the recording chamber. Right: example traces from 30 pA depolarizing current injection. (K) Number of action potentials (APs) across increasing depolarizing current steps (Two-way RM ANOVA followed by uncorrected Fisher’s LSD post hoc analysis, CNO main effect F(1, 8)=90.15, p<0.001, Current step main effect F(5, 40)=11.99, p<0.001, CNO × Current step F(5, 40)=7.556, p<0.001). (L) Resting membrane potential of recorded cells (Unpaired samples t-test, t(8)=1.502, p=0.1715, n=5 from one mouse). Data are represented as mean ± SEM.
-
Figure 3—figure supplement 1—source data 1
Figure 3—figure supplement 1 - raw data and statistical output.
- https://cdn.elifesciences.org/articles/73421/elife-73421-fig3-figsupp1-data1-v2.xlsx
Figure 4 with 2 supplements
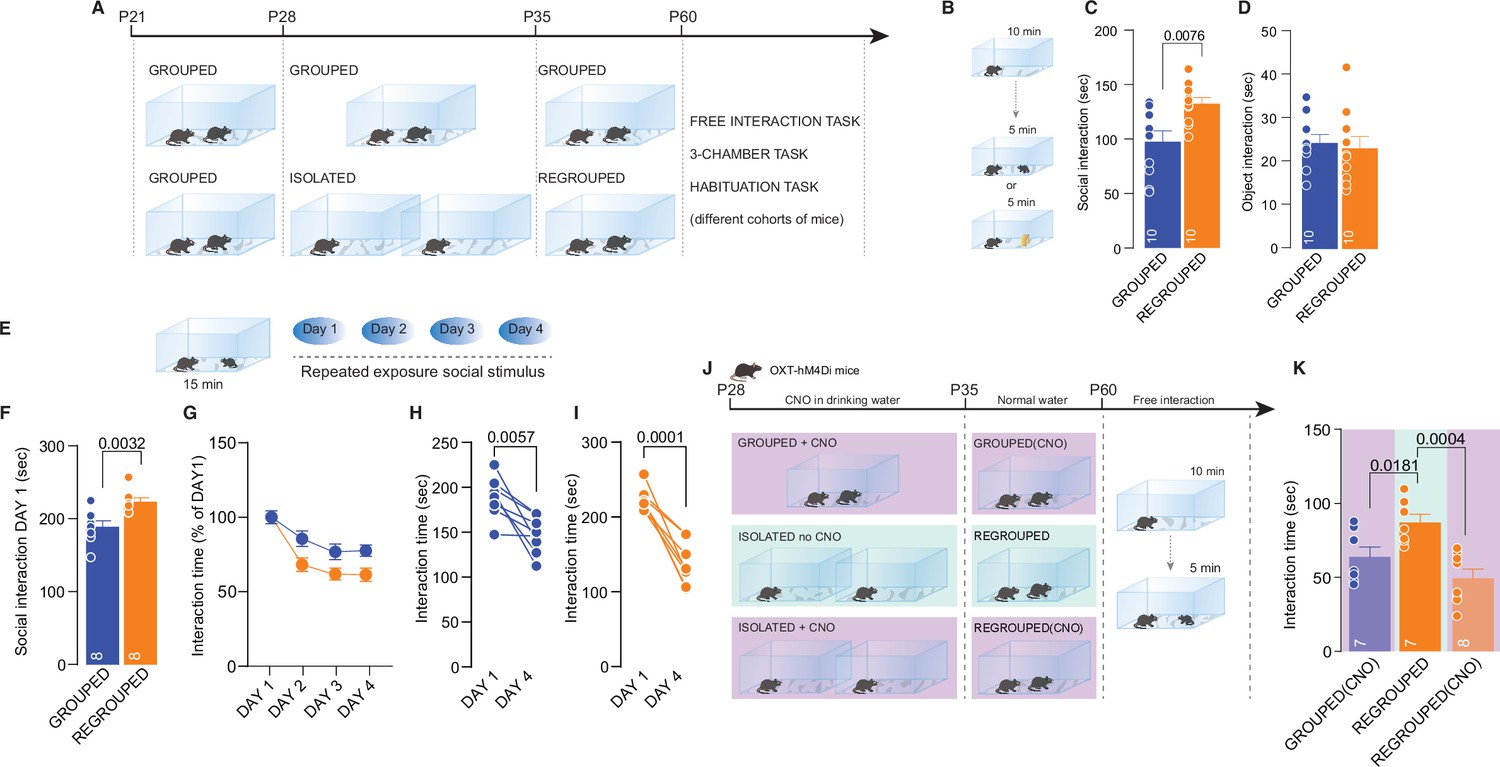
Long-lasting effects of adolescence acute social isolation.
(A) Experimental design: WT mice were isolated between P28 and P35 and regrouped until P60 or always kept in group. Mice (different cohorts) were subjected to different behavioral tasks. (B) Free-interaction task paradigm. (C) Time exploring social stimulus (Unpaired-samples t-test, t(18)=3.004, p=0.0076, n=10 mice each group). (D) Time exploring object (Unpaired-samples t-test, t(18)=3.3717, p=0.7144, n=10 mice each group). (E) Habituation task paradigm. (F) Interaction time on Day 1 (Unpaired-samples t-test, t(14)=3.553, p=0.0032, n=8 mice each group). (G) Interaction time across 4 days (Two-way RM ANOVA, Day × House condition F(3, 42)=2.607, p=0.064, Day main effect F(2.840, 39.76)=32.66, p<0.001, House condition main effect F(1, 14)=8.240, p=0.0123, n=8 mice each group). (H) Interaction time during Day 1 and Day 4 for Grouped mice (Paired samples t-test, t(7)=3.923, p=0.0057). (I) Interaction time during Day 1 and Day 4 for Regrouped mice (Paired samples t-test, t(7)=7.621, p<0.001). (J) Experimental design. Oxt-hM4Di mice were isolated from P28 to P35 and regrouped until P60 or kept always grouped. CNO was dissolved in drinking water and administered during social isolation. At P60 mice underwent to free direct social interaction task. (K) Social interaction time (One-way ANOVA followed by Tukey’s multiple comparisons test, F(2, 19)=9.430, p=0.0014, Grouped (CNO) n=7, Regrouped n=7, Regrouped (CNO) n=8). Data are represented as mean ± SEM.
-
Figure 4—source data 1
Figure 4 - raw data and statistical output.
- https://cdn.elifesciences.org/articles/73421/elife-73421-fig4-data1-v2.xlsx
Figure 4—figure supplement 1
Long-lasting effects of acute social isolation in adolescence.
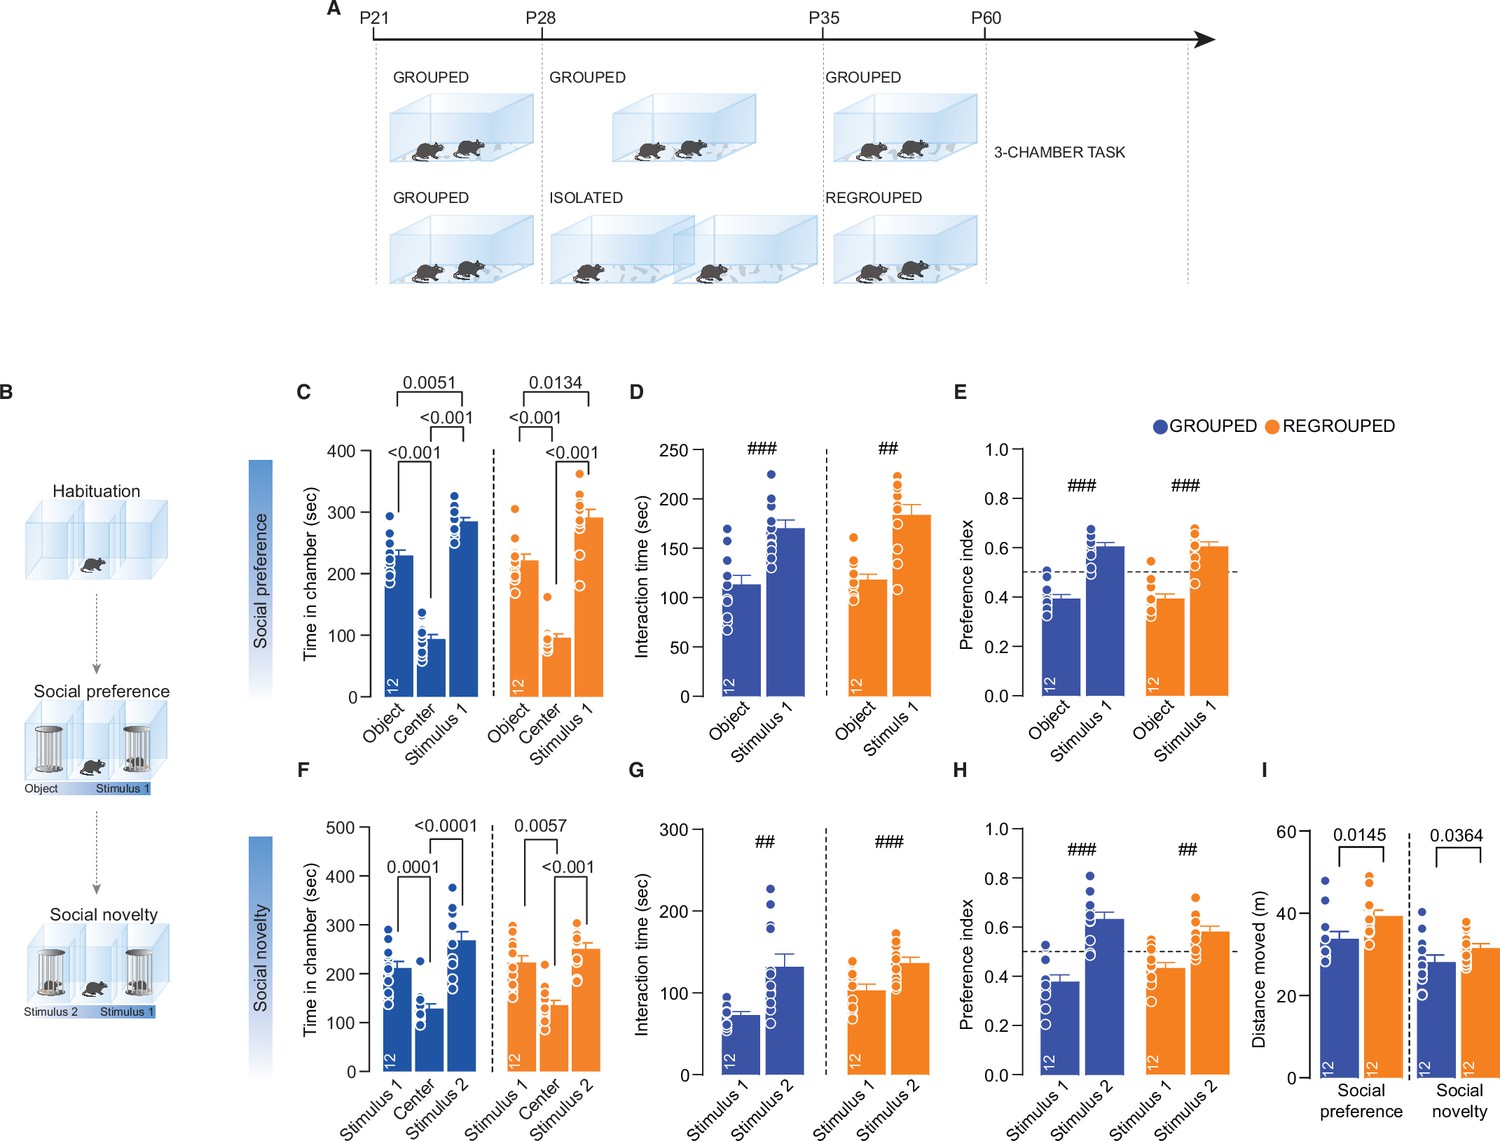
(A) Experimental design: WT mice were isolated between P28 and P35 and regrouped until P60 or always kept in group. (B) Three-chamber task experimental paradigm. (C) Time in chamber during social preference phase (One-way RM-ANOVA followed by Tukey’s multiple comparisons test. Grouped: chamber main effect F(1.684, 18.52)=111.4, p<0.001. Regrouped: chamber main effect F(1.390, 5.30)=79.34, p<0.001, n=12 mice each group). (D) Interaction time with object or social stimulus 1 (### Grouped: Paired sample t-test t(9)=4.941, p<0.001; ## Regrouped: Paired sample t-test t(9)=4.082, p=0.0027. Two-way RM-ANOVA, Target main effect F(1, 22)=0.3602, p=0.5545; House condition main effect F(1, 22)=0.8850, p=0.3571; Target × House condition F(1, 22)=0.3602, p=0.5545, n=12 mice each group). (E) Preference index calculated as object interaction time/(object+stimulus 1) or stimulus 1 interaction time/(object+stimulus 1) (One-sample t-test against chance level 0.5; ### Grouped t(11)=6.611, p<0.001; ### Regrouped t(11)=5.698, p<0.001). (F) Time in chamber during social novelty phase (One-way RM-ANOVA followed by Tukey’s multiple comparisons test. Grouped: chamber main effect F(1.416, 15,57)=16.18, p<0.001. Regrouped: chamber main effect F(1.768, 19.450)=15.61, p<0.001, n=12 mice each group). (G) Interaction time with stimulus 1 (familiar) and stimulus 2 (unfamiliar) (### Grouped: Paired sample t-test t(9)=4.736, p<0.001; ### Regrouped: Paired sample t-test t(9)=4.939, p<0.001. Two-way RM-ANOVA, Target main effect F(1, 22)=25.71, p<0.001; House condition main effect F(1, 22)=2.949, p=0.1; Target × House condition F(1, 22)=1.927, p=0.1790, n=12 mice each group). (H) Preference index calculated as stimulus 1 interaction time/(stimulus 1+stimulus 2) or stimulus 2 interaction time/(stimulus 1+stimulus 2) (One-sample t-test against chance level 0.5; ### Grouped t(11)=4.694, p<0.001; ## Regrouped t(11)=3.480, p=0.0051). (I) Distance moved during the three-chamber (Social preference: Mann-Withney U-test=30, p=0.0145. Social novelty: Unpaired samples t-test t(18)=2.260, p=0.0364, n=12 mice each group). Data are represented as mean ± SEM.
-
Figure 4—figure supplement 1—source data 1
Figure 4—figure supplement 1 - raw data and statistical output.
- https://cdn.elifesciences.org/articles/73421/elife-73421-fig4-figsupp1-data1-v2.xlsx
Figure 4—figure supplement 2
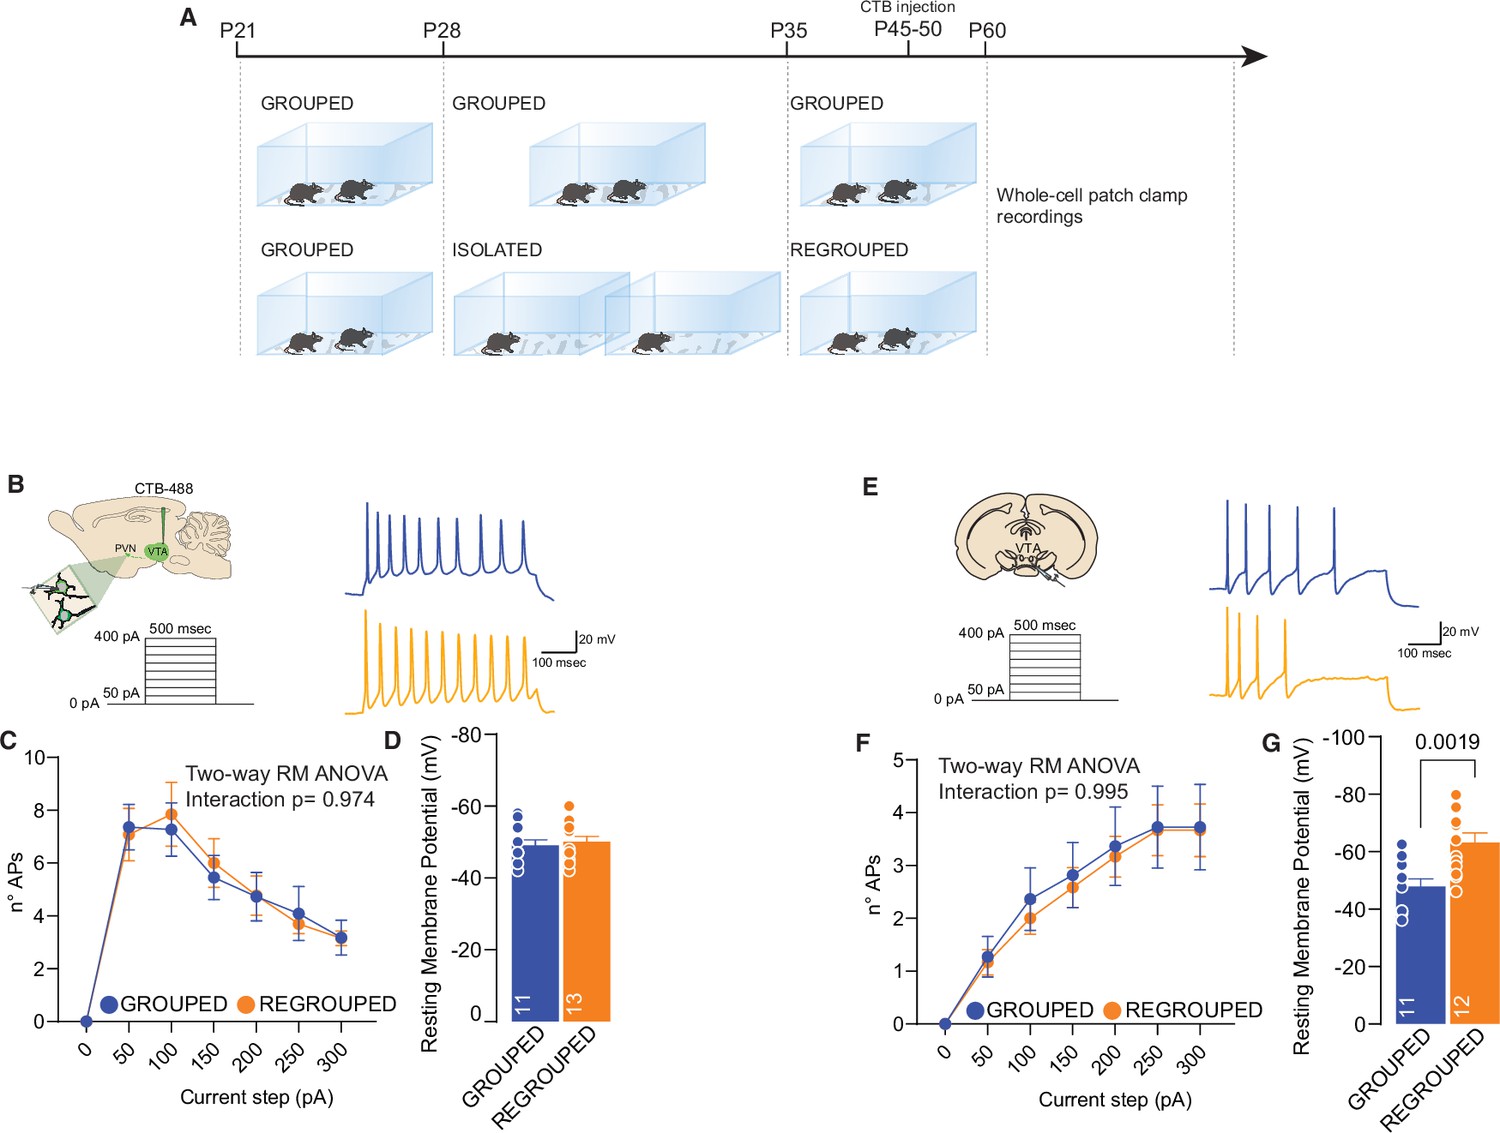
Regrouping after adolescence social isolation restore PVN and VTA excitability.
(A) Experimental design: WT mice were isolated between P28 and P35 and regrouped until P60 or always kept in group. CTB-488 was injected at p45-50. (B) Left: experimental paradigm, PVN neurons were subjected at multiple depolarizing current steps. Right: example traces from 250 pA depolarizing current injection. (C) Number of action potentials (APs) across increasing depolarizing current steps (Two-way RM ANOVA, Current step × House condition F(6, 132)=0.2047, p=0.9748, current step main effect F(2.764, 60.82)=39.55, p<0.001, House condition main effect F(1, 22)=0.006080, p=0.9386). (D) Resting membrane potential of recorded cells (Unpaired samples t-test, t(22)=0.4549, p=0.6536. Grouped n=11, Isolated n=13 from three mice each group). (E) Left: experimental paradigm, VTA pDA neurons were subjected at multiple depolarizing current steps. Right: example traces from 250 pA depolarizing current injection. (F) Number of APs across increasing depolarizing current steps (Two-way RM ANOVA, Current step × House condition F(6, 126)=0.1048, p=0.9957, Current step main effect F(1.983, 41.64)=50.14, p<0.001, House condition main effect F(1, 21)=0.05862, p=0.8110). (G) Resting membrane potential of recorded cells (Unpaired samples t-test, t(21)=3.538, p=0.0019. Grouped n=11, Isolated n=12 from three mice each group). Data are represented as mean ± SEM.
-
Figure 4—figure supplement 2—source data 1
Figure 4—figure supplement 2 - raw data and statistical output.
- https://cdn.elifesciences.org/articles/73421/elife-73421-fig4-figsupp2-data1-v2.xlsx
Figure 5 with 2 supplements
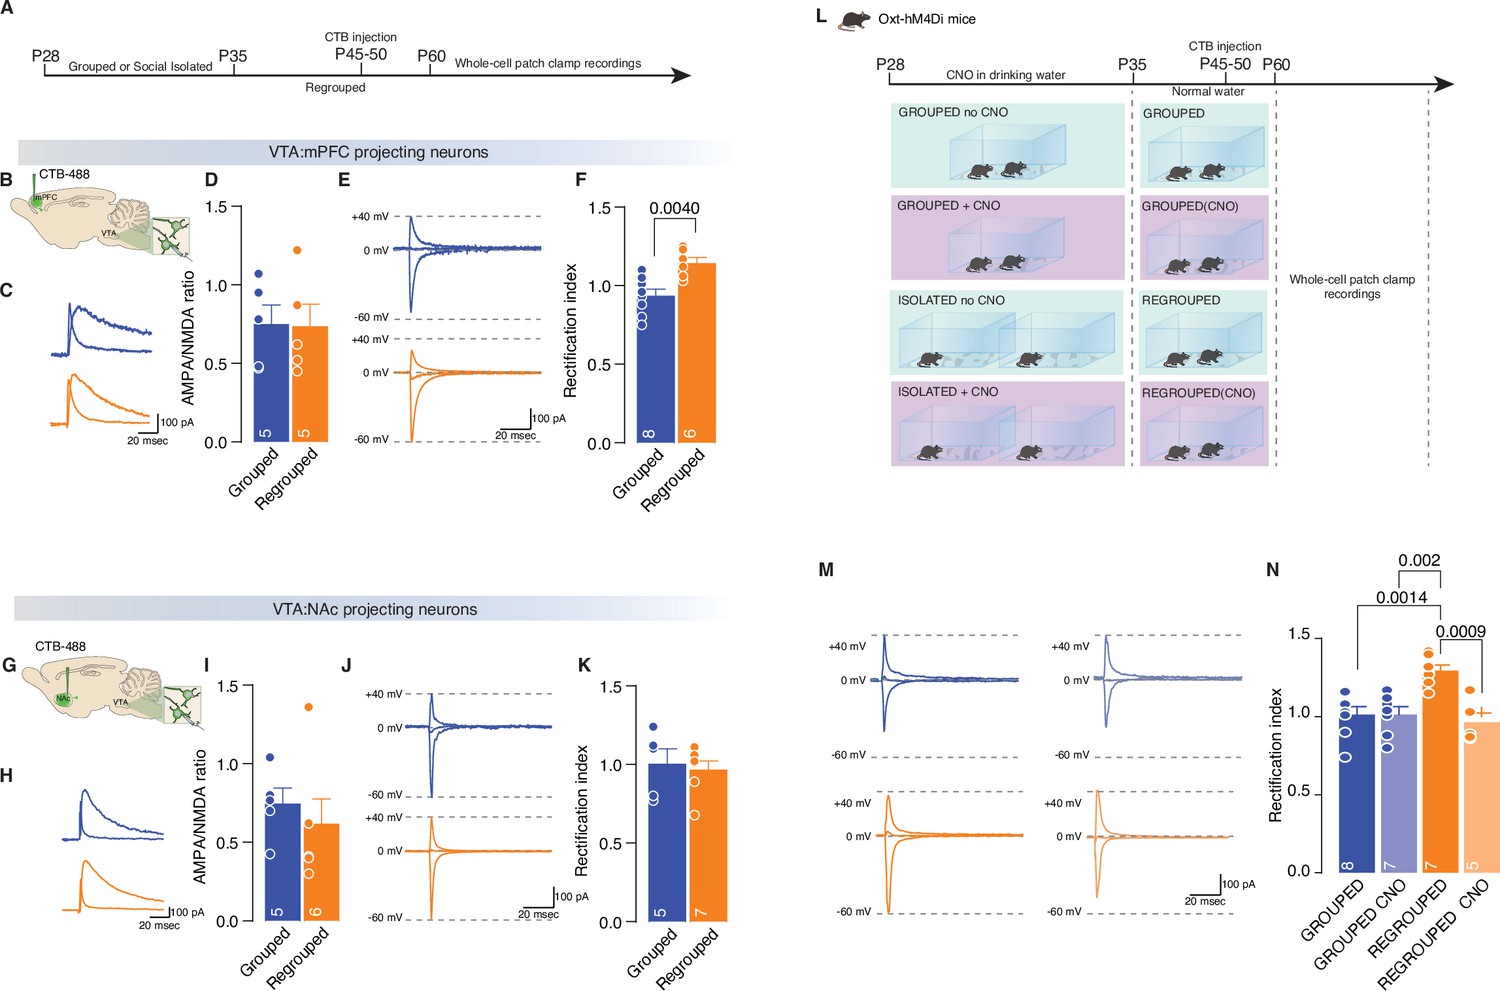
Adolescence acute social isolation induces synaptic scaling in adulthood mice.
(A, B, G) Experimental paradigm. WT mice were isolated between P28 and P35. Then mice were regrouped, injected with 488-CTB in the mPFC (B) or NAc (G) between P45–P50 and at P60 were subjected at whole-cell patch-clamp recording. (C) Example traces of isolated AMPA and NMDA currents recorded at +40 mV. (D) AMPA-NMDA ratio of VTA-DA:mPFC projecting neurons (Unpaired samples t-test, t(8)=0.07544, p=0.9417, Grouped n=5, Isolated n=5 from two mice each group). (E) Example traces of Isolated AMPA current recorded at +40, 0, and –60 mV. (F) Rectification index (RI) of VTA-pDA:mPFC projecting neurons (Unpaired samples t-test, t(12)=3.545, p=0.004, Grouped n=8, Isolated n=8 from two mice each group). (H) Example traces of isolated AMPA and NMDA currents recorded at +40 mV. (I) AMPA-NMDA ratio of VTA-pDA:NAc projecting neurons (Mann-Whitney U-test=7, p=0.1602, Grouped n=5, Isolated n=6 from two mice each group). (J) Example traces of Isolated AMPA current recorded at +40, 0, and –60 mV. (K) RI of VTA-pDA:NAc projecting neurons (Unpaired samples t-test, t(10)=0.3720, p=0.7176, Grouped n=5, Isolated n=7 from two mice each group). (L). Experimental paradigm: Oxt-hM4Di mice were isolated between P28 and P35 or kept always grouped and CNO was dissolved in drinking water. Then mice were regrouped, injected with CTB at P45–P50, and kept group-housed until P60 when were subjected at whole-cell patch-clamp recording. (M) Example traces of isolated AMPA current recorded at +40, 0, and –60 mV. (N) RI of VTA-pDA:mPFC projecting neurons (Two-way ANOVA followed by Tukey’s multiple comparisons test, CNO treatment main effect F(1, 23)=11.19, p=0.0028, House condition main effect F(1, 23)=5.459, p=0.0285, CNO treatment × Hous condition F(1, 23)=11.22, p=0.028, Grouped n=8, Grouped CNO n=7, Regrouped n=7, Regrouped CNO n=5 from two mice each group). Data are represented as mean ± SEM.
-
Figure 5—source data 1
Figure 5 - raw data and statistical output.
- https://cdn.elifesciences.org/articles/73421/elife-73421-fig5-data1-v2.xlsx
Figure 5—figure supplement 1
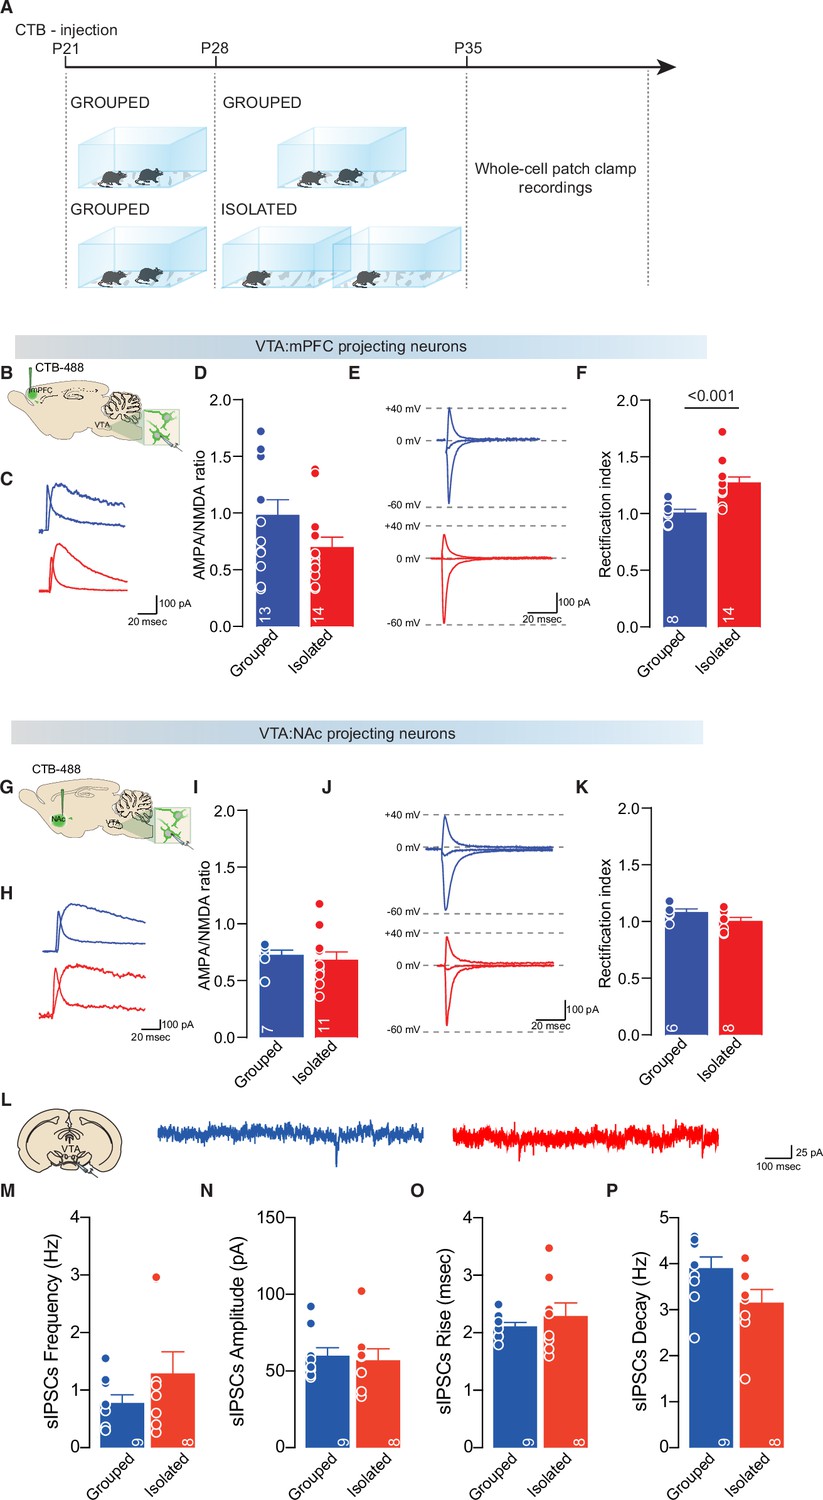
Adolescence acute social isolation induces synaptic scaling in VTA pDA-mPFC projecting neruons.
(A, B, G) Experimental paradigm. WT mice were injected with 488-CTB in the mPFC (B) or NAc (G) at P21 and isolated between P28 and P35. Then mice were subjected at whole-cell patch-clamp recording. (C) Example traces of isolated AMPA and NMDA currents recorded at +40 mV. (D) AMPA-NMDA ratio of VTA-pDA:mPFC projecting neurons (Mann-Whitney U-test=56, p=0.0945, Grouped n=13, Isolated n=14 from three mice each group). (E) Example traces of Isolated AMPA current recorded at +40, 0, and –60 mV. (F) Rectification index (RI) of VTA-pDA:mPFC projecting neurons (Unpaired samples t-test, t(20)=3.964, p<0.001, Grouped n=8, Isolated n=14 from three mice each group). (H) Example traces of isolated AMPA and NMDA currents recorded at +40 mV. (I) AMPA-NMDA ratio of VTA-pDA:NAc projecting neurons (Mann-Whitney U-test=29, p=0.4252, Grouped n=7, Isolated n=11 from three mice each group). (J) Example traces of Isolated AMPA current recorded at +40, 0, and –60 mV. (K) RI of VTA-pDA:NAc projecting neurons (Unpaired samples t-test, t(12)=0.1811, p=0.0953, Grouped n=6, Isolated n=8 from three mice each group). (L) Example traces of sIPSCs recorded from VTA-pDA neurons after adolescence social isolation. (M) sIPSCs frequency (Mann-Whitney U-test=29, p=0.5414, Grouped n=9, Isolated n=8 from two mice each group). (M) sIPSCs amplitude (Mann-Whitney U-test=33, p=0.8148, Grouped n=9, Isolated n=8 from two mice each group). (M) sIPSCs rise (Mann-Whitney U-test=34, p=0.8884, Grouped n=9, Isolated n=8 from two mice each group). (M) sIPSCs decay (Unpaired samples t-test, t(15)=1.994, p=0.0647, Grouped n=9, Isolated n=8 from two mice each group). Data are represented as mean ± SEM. sIPSC, spontaneous inhibitory postsynaptic current.
-
Figure 5—figure supplement 1—source data 1
Figure 5—figure supplement 1 - raw data and statistical output.
- https://cdn.elifesciences.org/articles/73421/elife-73421-fig5-figsupp1-data1-v2.xlsx
Figure 5—figure supplement 2
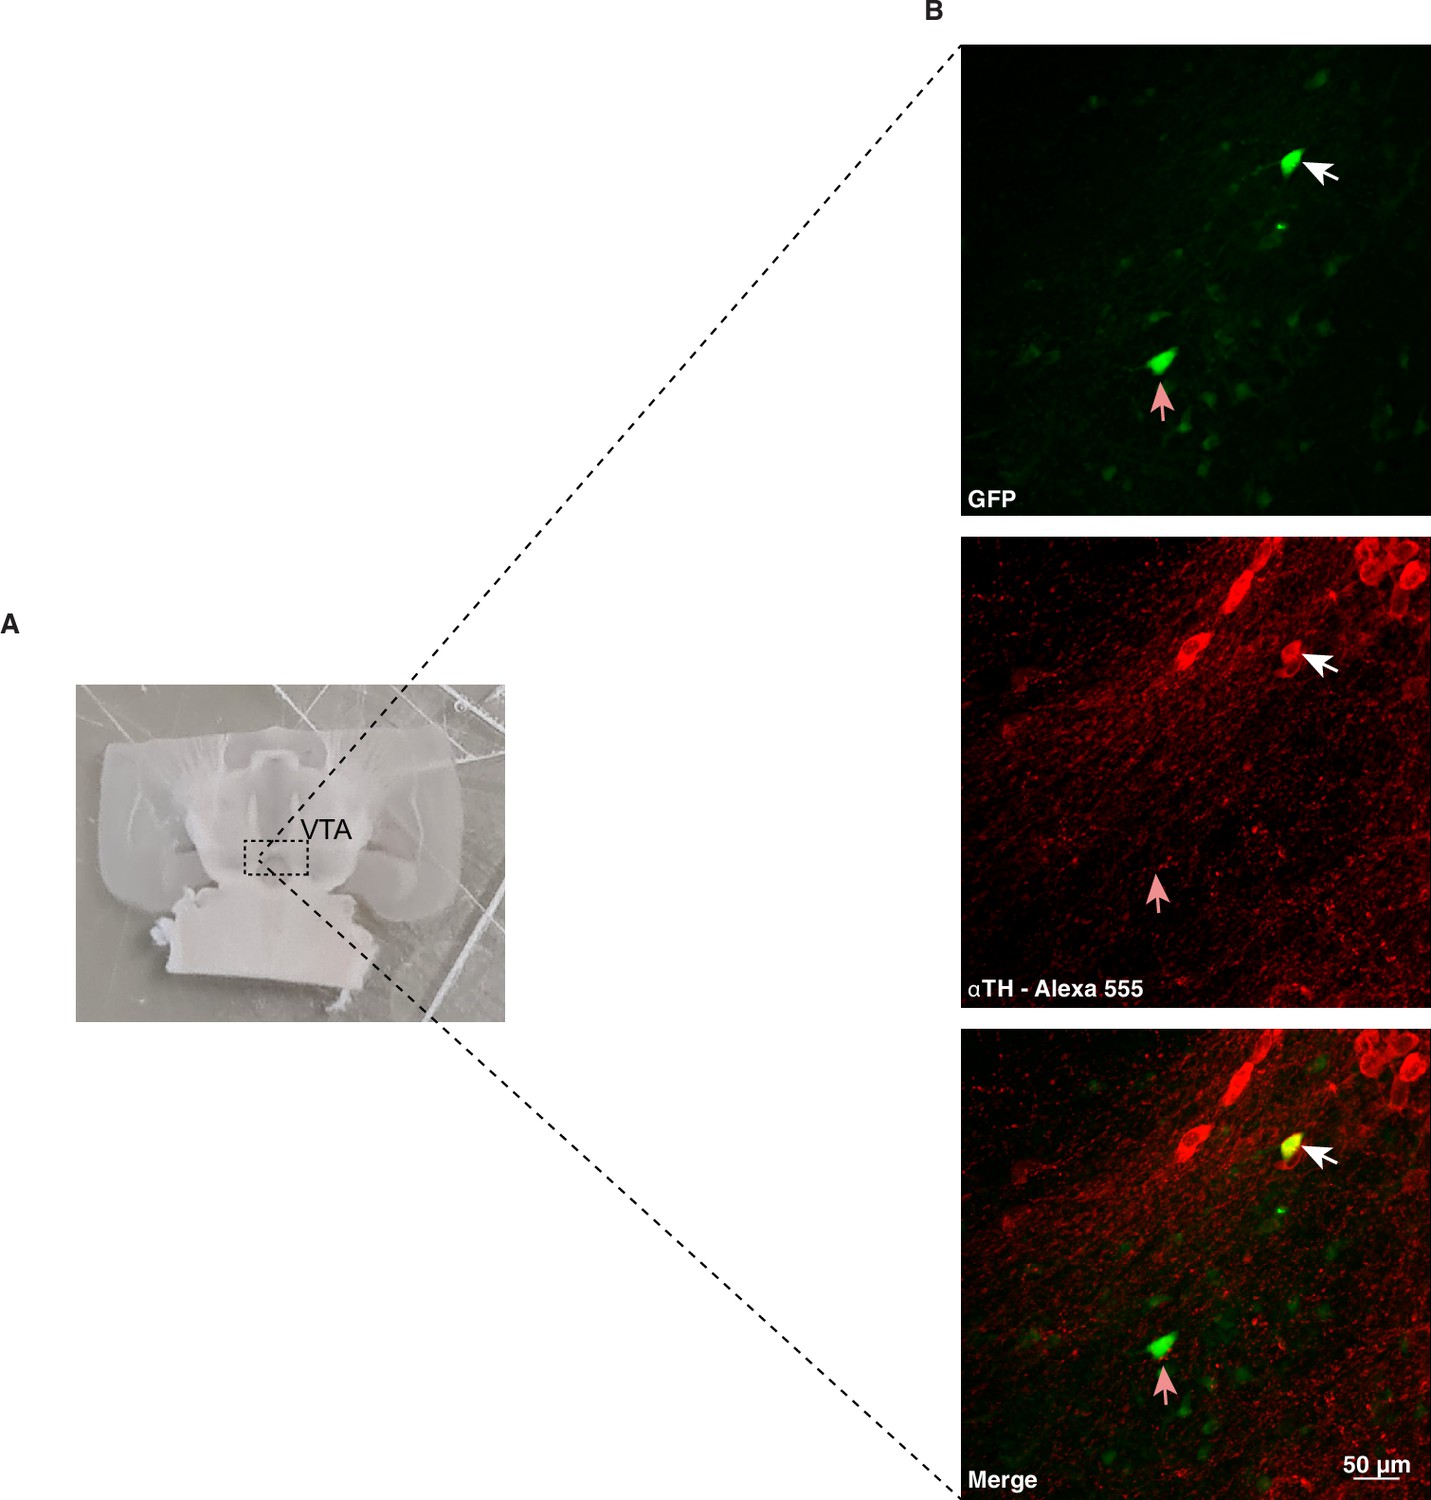
Immunohistochemical validation of VTA-DA neurons.
(A) Example of VTA horizontal slice. (B) Confocal images of post hoc immunohistochemical validation of VTA neurons filled with GFP (Alexa Fluor 488) and stained with TH-antibody. The white arrow indicates a neuron with capacitance of 32pF which is positive for TH staining (DA neuron). The pink arrow indicates a neuron with capacitance of 22pF which is negative for TH staining (non-DA neuron).
Figure 6
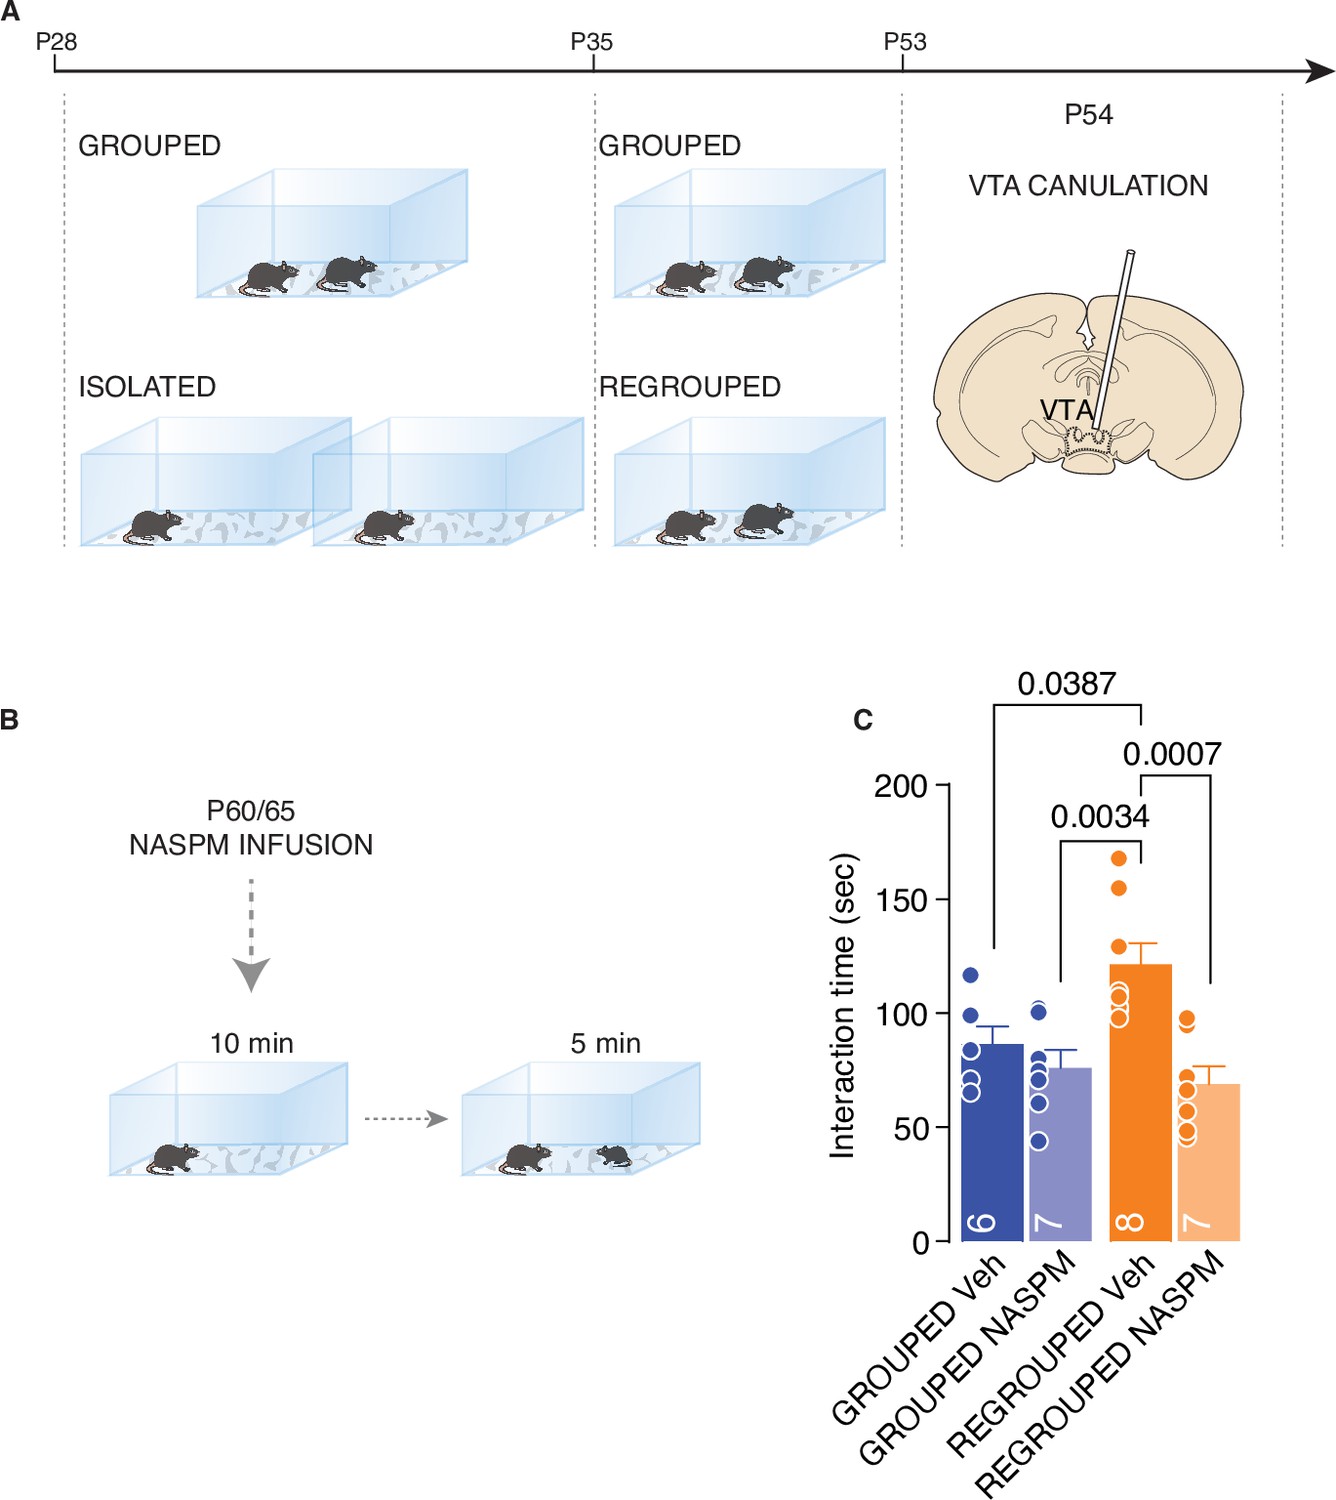
CP-AMPARs are responsible of increased social interaction during adulthood.
(A) Experimental paradigm: WT mice were isolated between P28 and P35. Then mice were regrouped until P53 and canulated over the VTA. (B) Mice underwent to direct free interaction task after infusion of CP-AMPARs antagonist NASPM. (C) Social interaction time (Two-way ANOVA followed by Tukey’s multiple comparisons test, NASPM treatment main effect F (1, 24)=13.78, p=0.0011, House condition main effect F(1, 24)=2.626, p=0.1182, NASPM × House condition F(1, 24)=6.099, p=0.021, Grouped Veh n=6, Grouped NASPM n=7, Regrouped Veh n=8, Regropued NASPM n=7). Data are represented as mean ± SEM.
-
Figure 6—source data 1
Figure 6 - raw data and statistical output.
- https://cdn.elifesciences.org/articles/73421/elife-73421-fig6-data1-v2.xlsx
Figure 7
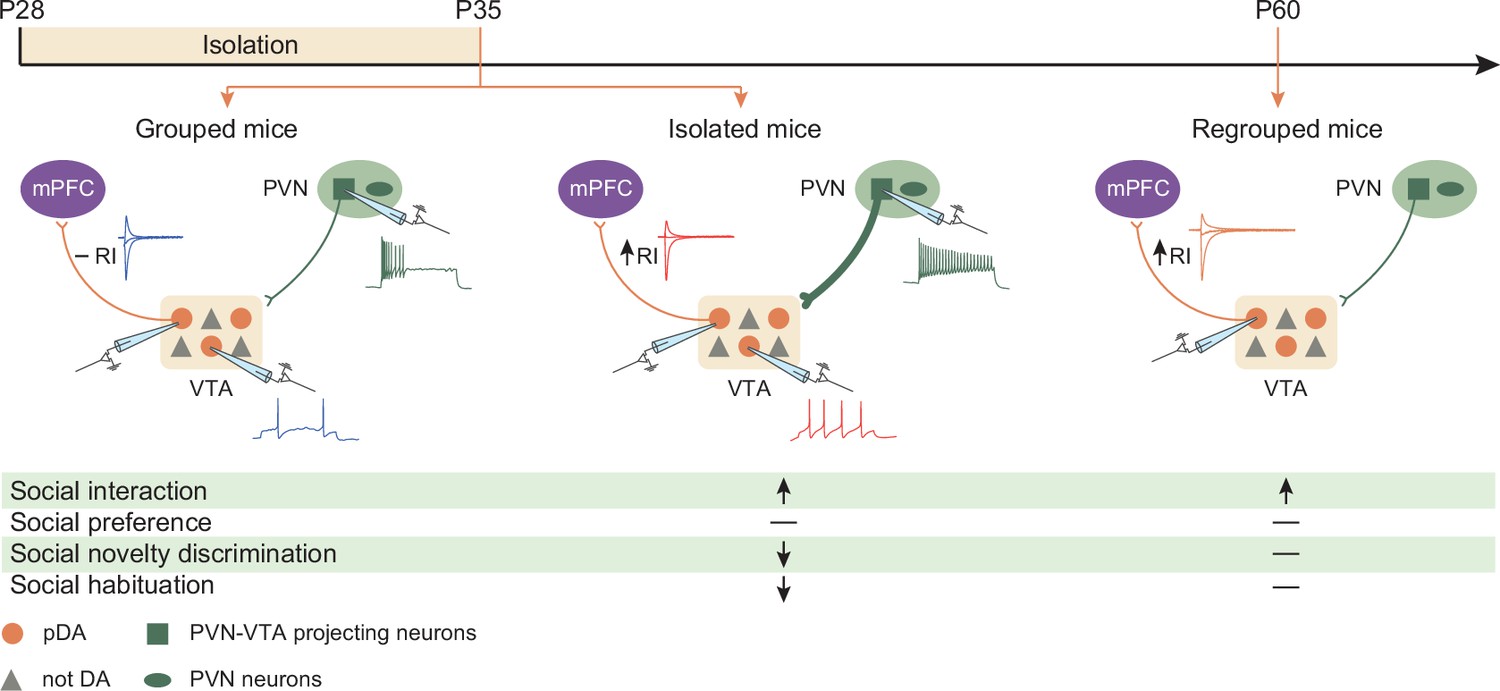
Graphical summary.
One week of social isolation during adolescence in mice increased social interaction at the expense of social habituation and social novelty preference. Behavioral changes were accompanied by the acute hyperexcitability of PVN-VTA projecting neurons, VTA putative dopamine (pDA) neuron, and long-lasting expression of GluA2-lacking AMPARs at excitatory inputs onto pDA neurons that project to the prefrontal cortex (PFC).
Tables
Key resources table
| Reagent type (species) or resource | Designation | Source or reference | Identifiers | Additional information |
|---|---|---|---|---|
| Chemical compound, drug | Choline chloride | Sigma-Aldrich | C7527 | |
| Chemical compound, drug | D-(+)-Glucose | Sigma-Aldrich | G8270 | |
| Chemical compound, drug | D(+)-Saccharose | Roth | 4621.1 | |
| Chemical compound, drug | NaHCO3 | Sigma-Aldrich | S5761 | |
| Chemical compound, drug | MgCl2 | Sigma-Aldrich | 63068 | |
| Chemical compound, drug | Ascorbic acid | Roth | 6288.1 | |
| Chemical compound, drug | Sodium pyruvate | Roth | 8793.1 | |
| Chemical compound, drug | KCl | Sigma-Aldrich | 60130 | |
| Chemical compound, drug | NaH2PO4 | Sigma-Aldrich | S0751 | |
| Chemical compound, drug | CaCl2 | Sigma-Aldrich | 21097 | |
| Chemical compound, drug | NaCl | Sigma-Aldrich | 31434 | |
| Chemical compound, drug | K-Gluconate | Sigma-Aldrich | G4500 | |
| Chemical compound, drug | EGTA | Sigma-Aldrich | E4378 | |
| Chemical compound, drug | HEPES | Sigma-Aldrich | H3375 | |
| Chemical compound, drug | Na2ATP | Sigma-Aldrich | A2383 | |
| Chemical compound, drug | Na3GTP | Sigma-Aldrich | G8877 | |
| Chemical compound, drug | Creatine-phosphate | Sigma-Aldrich | P7936 | |
| Chemical compound, drug | CsCl | Sigma-Aldrich | 20966 | |
| Chemical compound, drug | Sodium creatine phosphate | Sigma-Aldrich | 27920 | |
| Chemical compound, drug | Spermine | Sigma-Aldrich | S4264 | |
| Chemical compound, drug | Lidocaine N-ethyl bromide (QX-314) | Sigma-Aldrich | L5783 | |
| Chemical compound, drug | NaOH | Sigma-Aldrich | S5881 | |
| Chemical compound, drug | Clozapine N-oxide | Enzo Life | BML-NS-105-0025 | 5 mg/200 ml |
| Chemical compound, drug | Saccharin | Sigma-Aldrich | 240931 | |
| Chemical compound, drug | NASPM | Tocris | 2766 | |
| Chemical compound, drug | NGS | Sigma-Aldrich | AB7481 | |
| Chemical compound, drug | Triton X-100 | Sigma-Aldrich | X100 | |
| Chemical compound, drug | Kynurenic acid | Sigma-Aldrich | K3375 | |
| Chemical compound, drug | Picrotoxin | Tocris | 1128 | |
| Chemical compound, drug | D-APV | Tocris | 106 | |
| Antibody | Oxytocin antibody (guinea pig polyclonal) | Synaptic Systems | #408004 | (1:500) |
| Antibody | cFOS antibody (rabbit monoclonal) | Synaptic Systems | #226008 | (1:5000) |
| Antibody | Neurophysin 2/NP-AVP antibody (mouse monoclonal) | Merck Millipore | #MABN856 | (1:250) |
| Antibody | HA-tag (6E2) antibody (mouse monoclonal) | Cell Signaling Technology | #2367 | (1:200) |
| Antibody | Oxytocin antibody (rabbit polyclonal) | Merck Millipore | #AB911 | (1:500) |
| Antibody | Tyrosine Hydroxylase antibody (mouse monoclonal) | Merck Millipore | #MAB318 | (1:500) |
| Antibody | Goat anti-mouse Alexa Fluor 555 (polyclonal) | Thermo Fisher Scientific | A21422 | (1:500) |
| Antibody | Goat anti-rabbit Alexa Fluor 488 (polyclonal) | Thermo Fisher Scientific | A11008 | (1:500) |
| Antibody | Goat anti-mouse Alexa Fluor 594 (polyclonal) | Thermo Fisher Scientific | A11005 | (1:500) |
| Antibody | Goat anti-mouse Alexa Fluor 647 (polyclonal) | Thermo Fisher Scientific | A21235 | (1:500) |
| Antibody | Goat anti-guinea pig Alexa Fluor 555 (polyclonal) | Thermo Fisher Scientific | A21435 | (1:500) |
| Other | Mounting medium with DAPI | Abcam | ab104139 | Mounting media used for immunofluorescence |
| Other | Alexa Fluor-488 hydrazydes | Thermo Fisher Scientific | #A10436 | 10 mM—GFP tracer used for DA neurons validation (Figure 5—figure supplement 2) |
| Other | Cholera Toxin Subunit B, Alexa Fluor 488 Conjugate | Thermo Fisher Scientific | #C34775 | Retrograde tracer used in Figures 3 and 5 and Figure 5—figure supplement 1 |
Additional files
Download links
A two-part list of links to download the article, or parts of the article, in various formats.
Downloads (link to download the article as PDF)
Open citations (links to open the citations from this article in various online reference manager services)
Cite this article (links to download the citations from this article in formats compatible with various reference manager tools)
Oxytocin neurons mediate the effect of social isolation via the VTA circuits
eLife 11:e73421.
https://doi.org/10.7554/eLife.73421


