Protein-lipid interaction at low pH induces oligomerization of the MakA cytotoxin from Vibrio cholerae
- Department of Molecular Biology, Umeå University, Sweden
- Umeå Centre for Microbial Research (UCMR), Umeå University, Sweden
- The Laboratory for Molecular Infection Medicine Sweden (MIMS), Umeå University, Sweden
- Science for Life Laboratory (SciLifeLab), Department of Molecular Biology, Umeå University, Sweden
- Department of Clinical Microbiology, Umeå University, Sweden
- Wallenberg Centre for Molecular Medicine, Umeå University, Sweden
- Department of Chemistry, Umeå University, Sweden
Figures
Figure 1 with 1 supplement
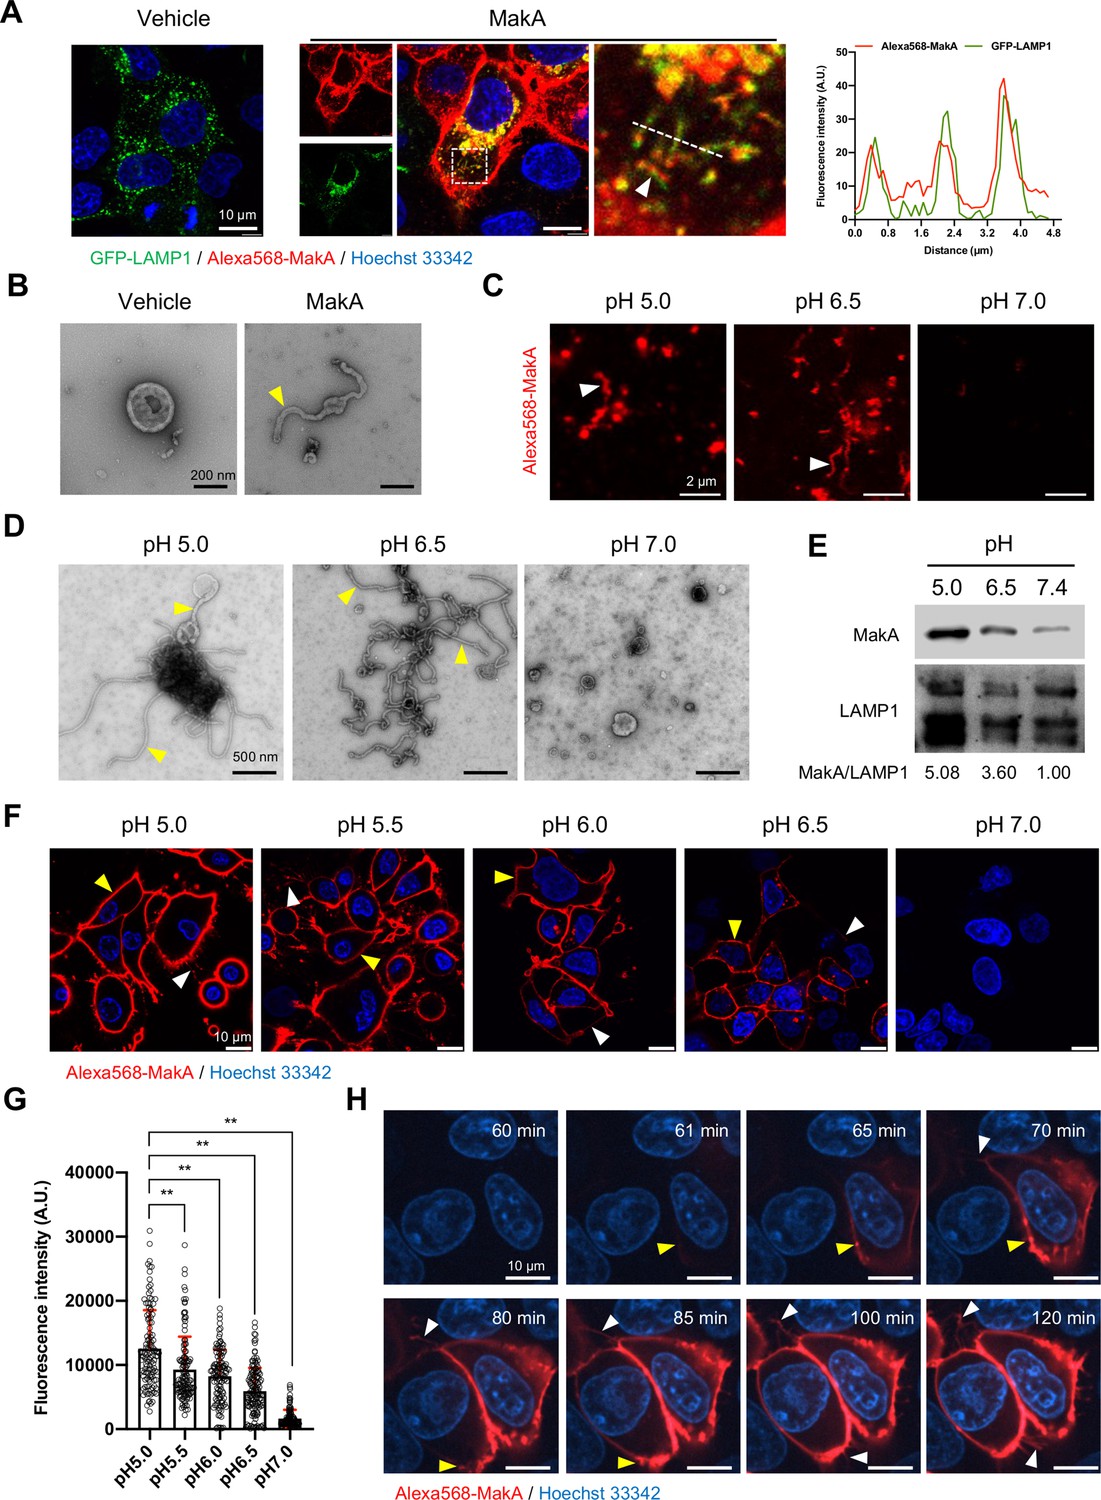
pH-dependent tubulation of lysosomes and binding to epithelial cells by MakA.
(A) Caco-2 cells transfected with GFP-LAMP1 were treated with vehicle or Alexa568-MakA (250 nM, 18 hr). Nuclei were counterstained with Hoechst 33342. The line graph to the right indicates the accumulation of Alexa568-MakA in GFP-LAMP1-positive tubular lysosomes. Pearson correlation coefficient was used to calculate Alexa568-MakA (red) co-localization with GFP-LAMP1 (green) along with the tubular structures. Scale bars, 10 μm. (B) Representative electron micrographs of lysosomes purified from vehicle and MakA- (250 nM, 24 hr) treated HCT8 cells. Scale bars, 200 nm. The yellow arrowhead indicates a tubular structure found with lysosomes from MakA-treated cells. (C) The pH-dependent binding of Alexa568-MakA to purified lysosomes isolated from HCT8 cells: White arrowheads point to the tubular structures observed with MakA-treated purified lysosomes. Images shown for specimens from different pH conditions were acquired using the same settings of the microscope. Scale bars, 2 µm. (D) Representative electron micrographs of purified lysosomes treated with MakA (1 µM) under different pH conditions. Yellow arrowheads indicate tubular structures that appear at low pH. Scale bars, 500 nm. (E) Western blot analysis of samples from lysosome pull-down assay treated with MakA (250 nM, 60 min) under different pH conditions. Lysosome-bound MakA was detected with anti-MakA antiserum. Immunodetection of LAMP1 was used as a reference and the MakA/LAMP1 ratio was determined for the quantification of relative MakA amounts. (F) HCT8 cells were exposed to Alexa568-MakA (500 nM, 4 hr) under different pH conditions and visualized live under confocal microscopy. Nuclei were counterstained with Hoechst 33342 (blue). Yellow arrowheads indicate cell membrane association, while white arrowheads indicate MakA-positive tubular structures. The different images were acquired using the same microscope settings. Scale bars, 10 μm. (G) The histogram indicates quantification of cell-bound Alexa568-MakA (n = 100 cells) as shown in (F). Data from two independent experiments are presented as mean ± s.e.m.; one-way analysis of variance (ANOVA) with Dunnett’s multiple comparisons test. **p ≤ 0.01. (H) Still images of HCT8 cells exposed to Alexa568-MakA (500 nM) at pH 5.0. Yellow arrowheads indicate the initial binding site of MakA and white arrowheads indicate the appearance of MakA-positive tubular structures in a time-dependent manner. Nuclei were counterstained with Hoechst 33342. Scale bars, 10 μm.
-
Figure 1—source data 1
Data used to calculate Pearson correlation coefficient.
- https://cdn.elifesciences.org/articles/73439/elife-73439-fig1-data1-v1.xlsx
-
Figure 1—source data 2
Original Western blots for Figure 1E.
- https://cdn.elifesciences.org/articles/73439/elife-73439-fig1-data2-v1.pdf
-
Figure 1—source data 3
Quantification of cell-bound Alexa568-MakA.
- https://cdn.elifesciences.org/articles/73439/elife-73439-fig1-data3-v1.xlsx
Figure 1—figure supplement 1
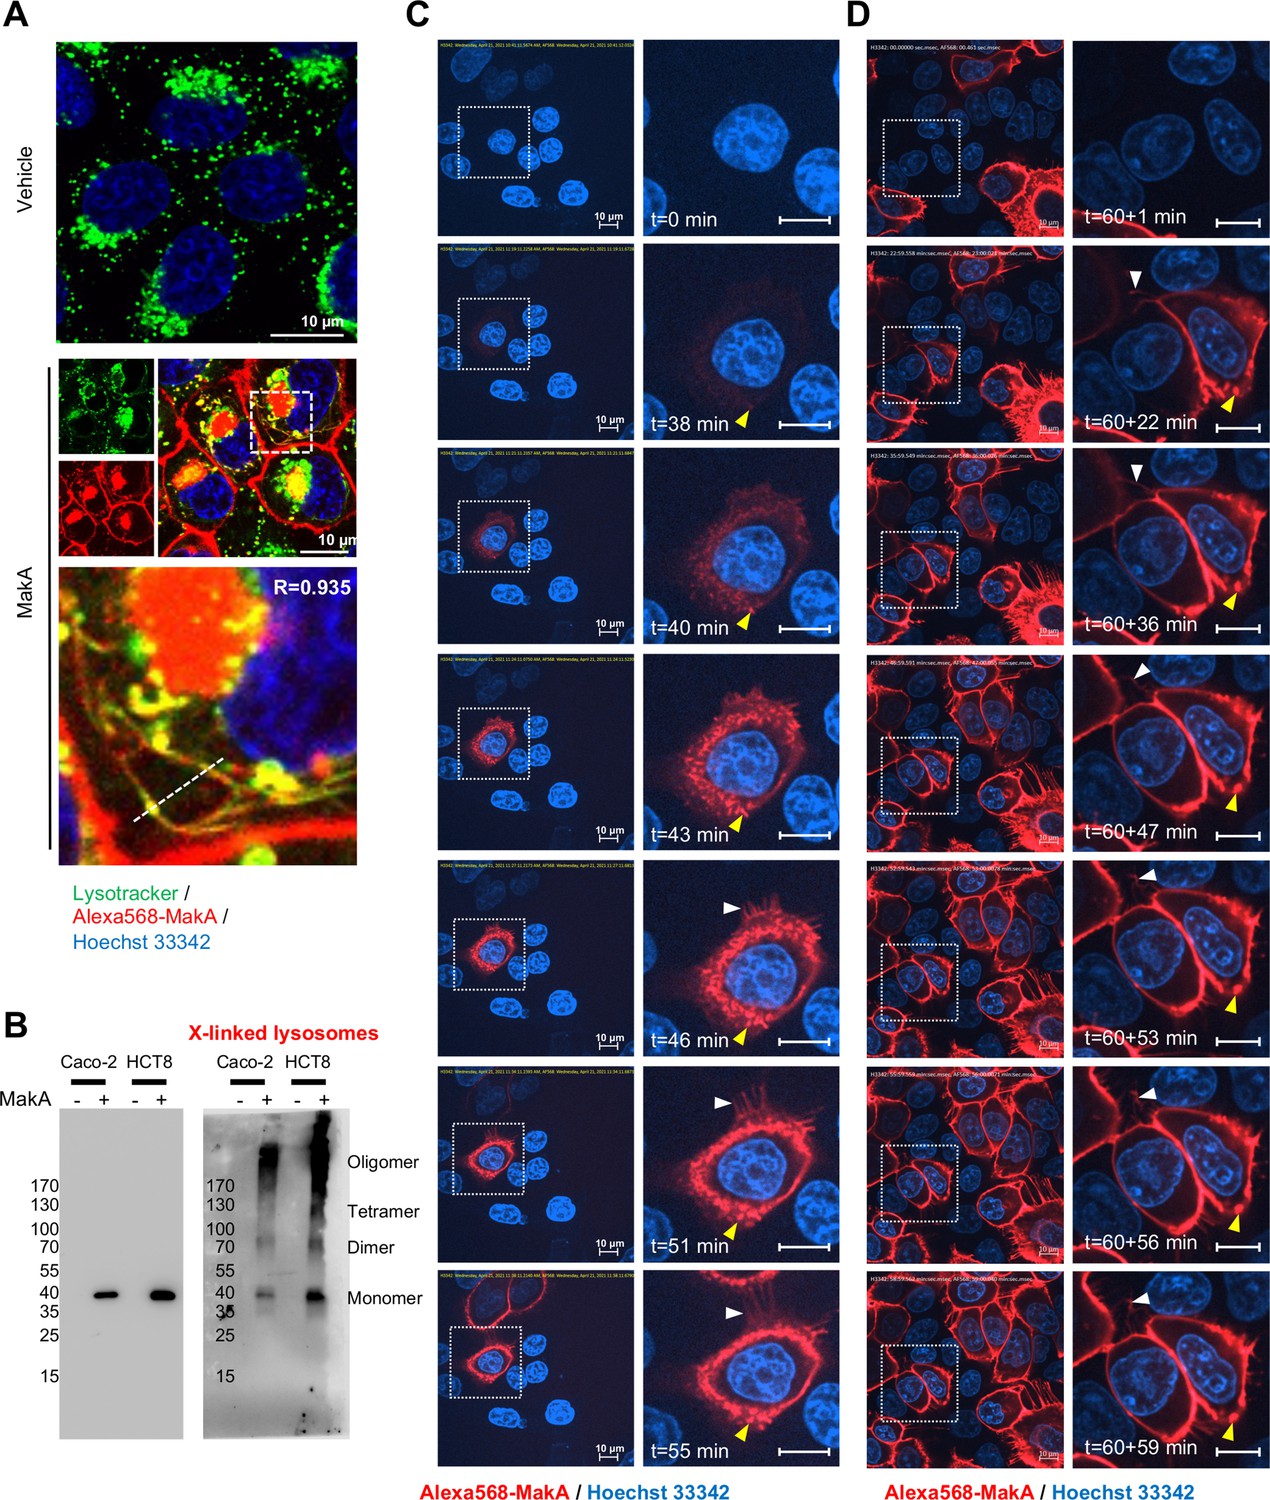
MakA binding to the epithelial cell membrane in filipodia rich structures.
(A) Caco-2 cells treated with vehicle or Alexa568-MakA (250 nM, 18 hr) were subsequently counterstained with Lysotracker (green, 500 nM, 30 min). Nuclei were counterstained with Hoechst 33342. Pearson correlation coefficient was used for the calculation of Alexa568-MakA (red) co-localization with lysotracker (green) along the dotted line. Scale bars, 10 μm. (B) Western blot analysis of purified lysosomes isolated from Caco-2 or HCT8 cells treated with vehicle or MakA (250 nM, 18 hr). (C–D) Still images of HCT8 cells exposed to Alexa568-MakA (500 nM) at pH 5.0. Yellow arrowheads indicate the accumulation of MakA in filipodia-rich structures and white arrowheads indicate the appearance of MakA-positive tubular structures. Nuclei were counterstained with Hoechst 33342. Scale bars, 10 μm. Images in (C) were acquired for a time limit of 55 min immediately after Alexa568-MakA administration, while images in (D) were acquired for 59 extra minutes, 60 min (total time = 119 min) after Alexa568-MakA administration.
-
Figure 1—figure supplement 1—source data 1
Original Western blots for MakA.
- https://cdn.elifesciences.org/articles/73439/elife-73439-fig1-figsupp1-data1-v1.pdf
Figure 2 with 1 supplement
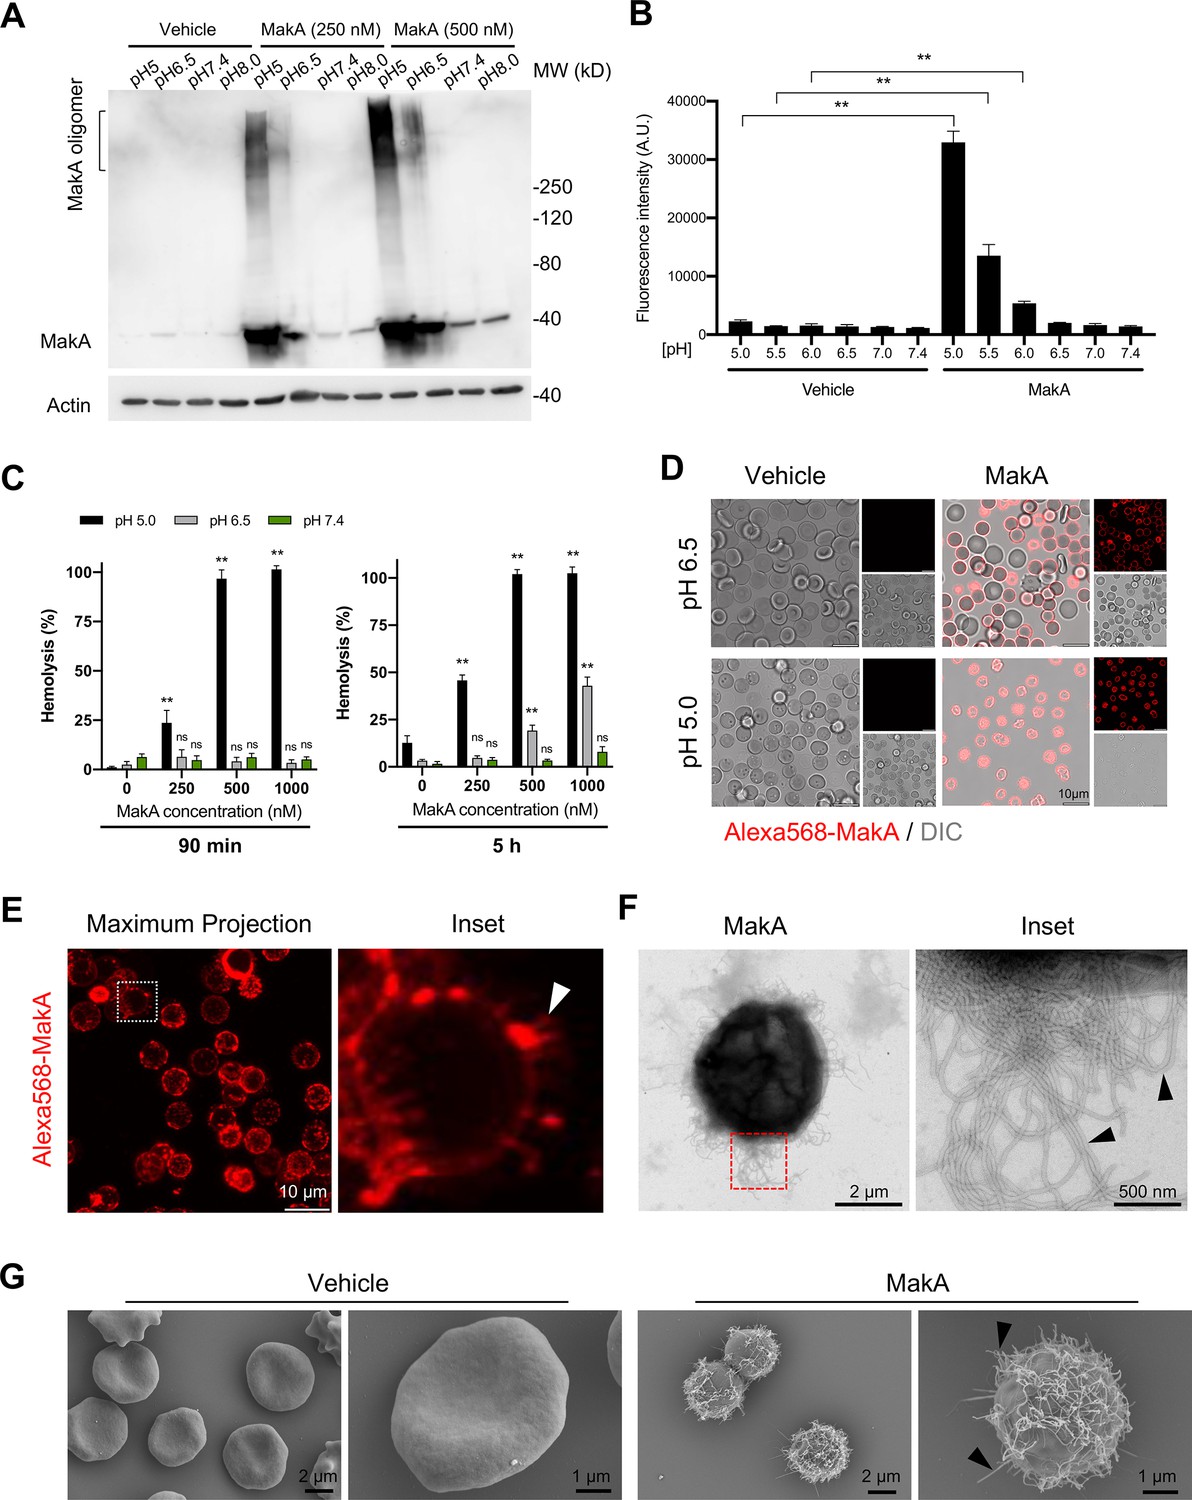
pH-dependent MakA binding to target cell membranes and induction of tubulation on erythrocytes.
(A) Western blot analysis of HCT8 cells treated with increasing concentrations of MakA under different pH conditions for 4 hr. Data are representative of two independent experiments. Cell-bound MakA was detected with MakA-specific antibodies, and actin was used as a loading control. (B) HCT8 cells were treated with MakA (500 nM, 4 hr) under different pH conditions, and cell toxicity was monitored by assaying the uptake of propidium iodide. Fluorescence values for propidium iodide were recorded by flow cytometry. Data are representative of three independent experiments; bar graphs show the mean ± s.d. Significance was determined from biological replicates using a non-parametric t-test. **p ≤ 0.01. (C) Human erythrocytes suspended in a citrate buffer of different pHs were exposed to increasing concentrations of MakA for 90 min (left panel) and 5 hr (right panel). MakA-induced hemolysis of erythrocytes was normalized against erythrocytes treated with Triton X-100 (0.1%), and the data was expressed as a percentage (%). Data are representative of six readouts from two independent experiments; bar graphs show mean ± s.d. Significance was determined from biological replicates using a non-parametric t-test. **p ≤ 0.01, *p ≤ 0.05, or ns = not significant. (D) Human erythrocytes (0.25%) in phosphate-buffered saline (PBS) were allowed to adhere to the glass surface for 10 hr, followed by buffer exchange to citrate buffer (pH 5.0 or pH 6.5). The erythrocytes were treated with Alexa568-MakA (500 nM, 3 hr), and cell-bound MakA was detected by confocal microscopy. Scale bars, 10 µm. (E) The image shows a maximum z-stack projection of the human erythrocytes treated with Alexa568-MakA (pH 6.5 in citrate buffer). The white arrowhead in the right panel indicates the accumulation of Alexa568-MakA in tubular structures at the surface of erythrocytes. Scale bars, 10 µm. (F) Transmission electron microscopy (TEM) images of erythrocytes treated with vehicle or MakA (500 nM) for 90 min and stained with 1.5% uranyl acetate solution. Black arrowheads in the enlarged part of the image to the right indicate the presence of tubular structures on the surface of the liposome. (G) Scanning electron microscopy (SEM) images of erythrocytes treated with MakA (500 nM, 90 min) in citrate buffer (pH 6.5). Representative examples of imaged erythrocytes indicate that the formation of tubular structures occurred throughout the surface of MakA-treated erythrocytes. Scale bars, 2 µm.
-
Figure 2—source data 1
Original Western blots for MakA and actin.
- https://cdn.elifesciences.org/articles/73439/elife-73439-fig2-data1-v1.pdf
-
Figure 2—source data 2
Quantification of propidium iodide-positive cells.
- https://cdn.elifesciences.org/articles/73439/elife-73439-fig2-data2-v1.xlsx
-
Figure 2—source data 3
Quantification of hemolytic assay.
- https://cdn.elifesciences.org/articles/73439/elife-73439-fig2-data3-v1.xlsx
Figure 2—figure supplement 1
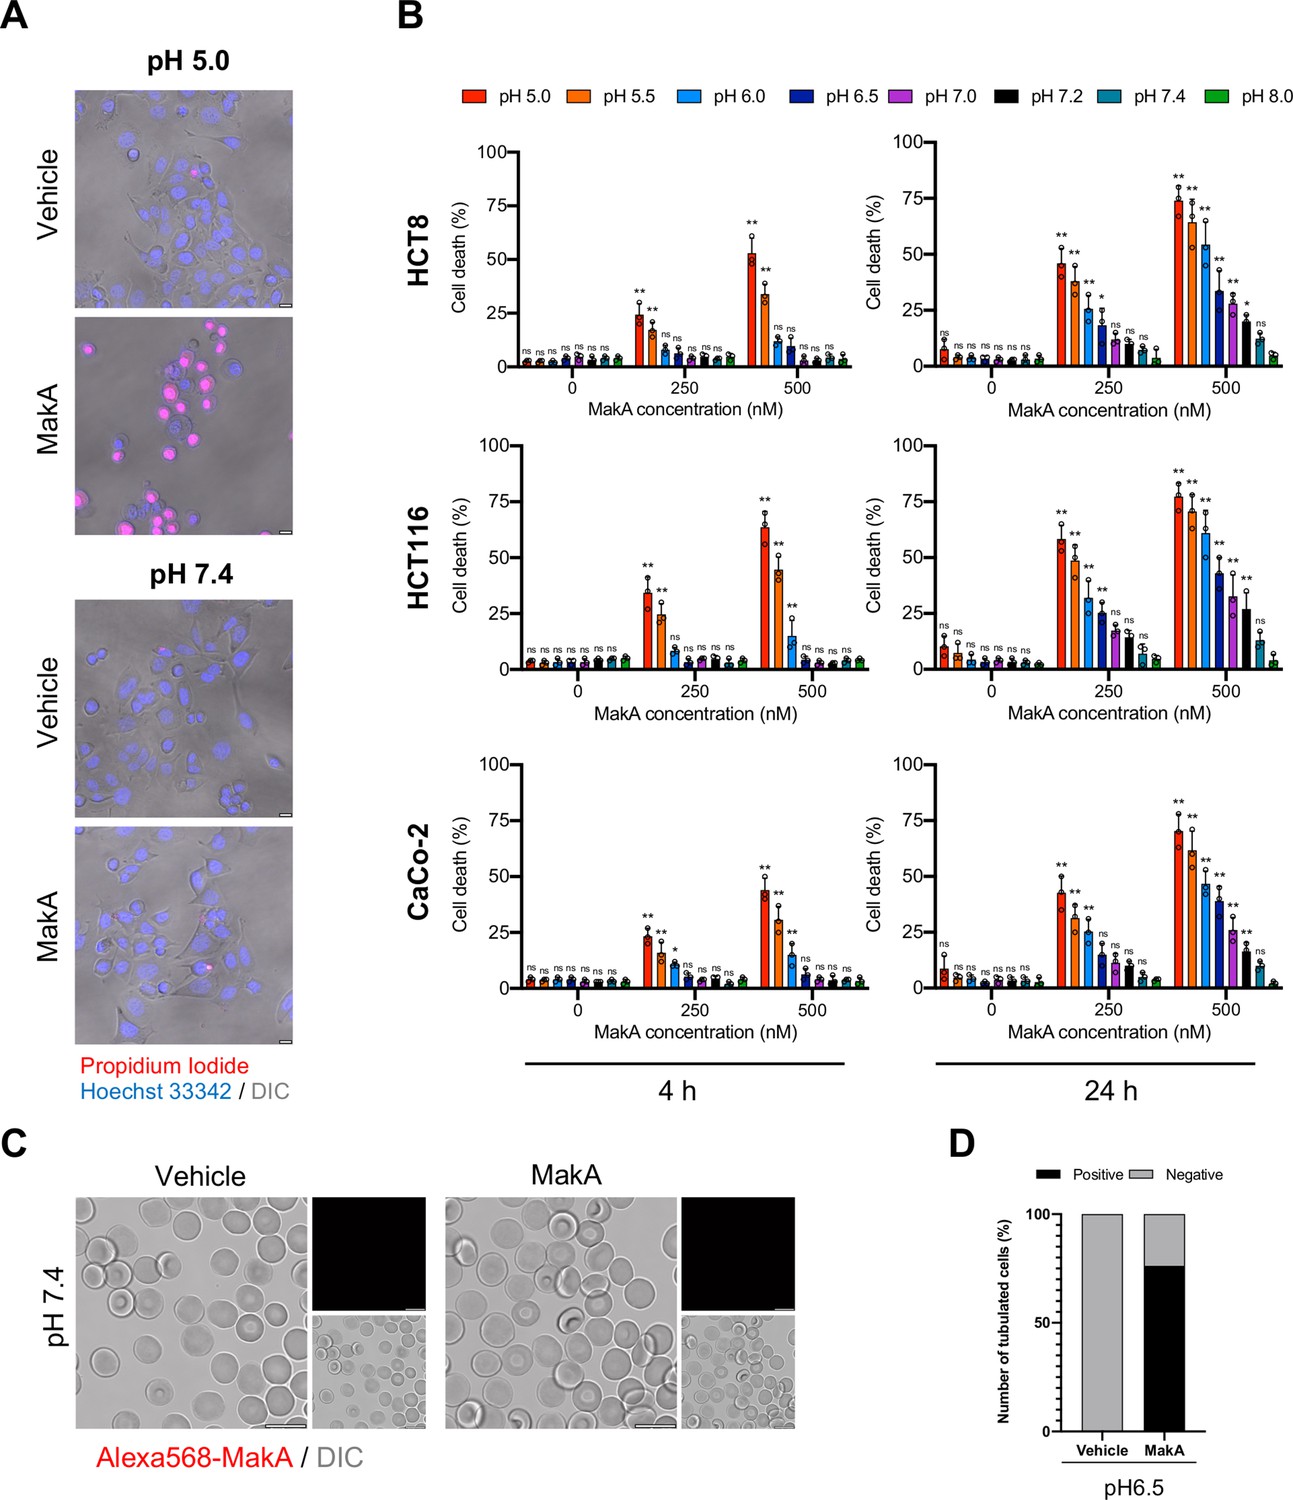
pH-dependent cytotoxicity of MakA in target cells.
(A) MakA caused pH-dependent permeability of HCT8 cells as determined by cellular uptake of propidium iodide. The uptake of propidium iodide (red) was assessed by confocal microscopy. Scale bars, 10 µm. (B) MakA-induced death of Caco-2, HCT116, and HCT8 cells under different pH conditions. Epithelial cell viability was assessed using the trypan blue exclusion method. Data are representative of three independent experiments; bar graphs show the mean ± s.d. Significance was determined from biological replicates using a two-way analysis of variance (ANOVA) with Tukey’s multiple comparisons test. *p ≤ 0.05, **p ≤ 0.01, ns = not significant. (C) Human erythrocytes (0.25%) in phosphate-buffered saline (PBS) were allowed to adhere on the glass surface for 10 hr, followed by buffer exchange to citrate buffer (pH 7.4). The erythrocytes were treated with Alexa568-MakA (500 nM, 3 hr), and cell-bound MakA was detected by confocal microscopy. Scale bars, 10 µm. (D) Graph indicates quantification of MakA-induced tubulation of human erythrocytes. Data was quantified from scanning electron micrographs shown in Figure 2G.
-
Figure 2—figure supplement 1—source data 1
Quantification of trypan blue-positive cells.
- https://cdn.elifesciences.org/articles/73439/elife-73439-fig2-figsupp1-data1-v1.xlsx
-
Figure 2—figure supplement 1—source data 2
Quantification of MakA-induced tubulation of erythrocytes.
- https://cdn.elifesciences.org/articles/73439/elife-73439-fig2-figsupp1-data2-v1.xlsx
Figure 3 with 1 supplement
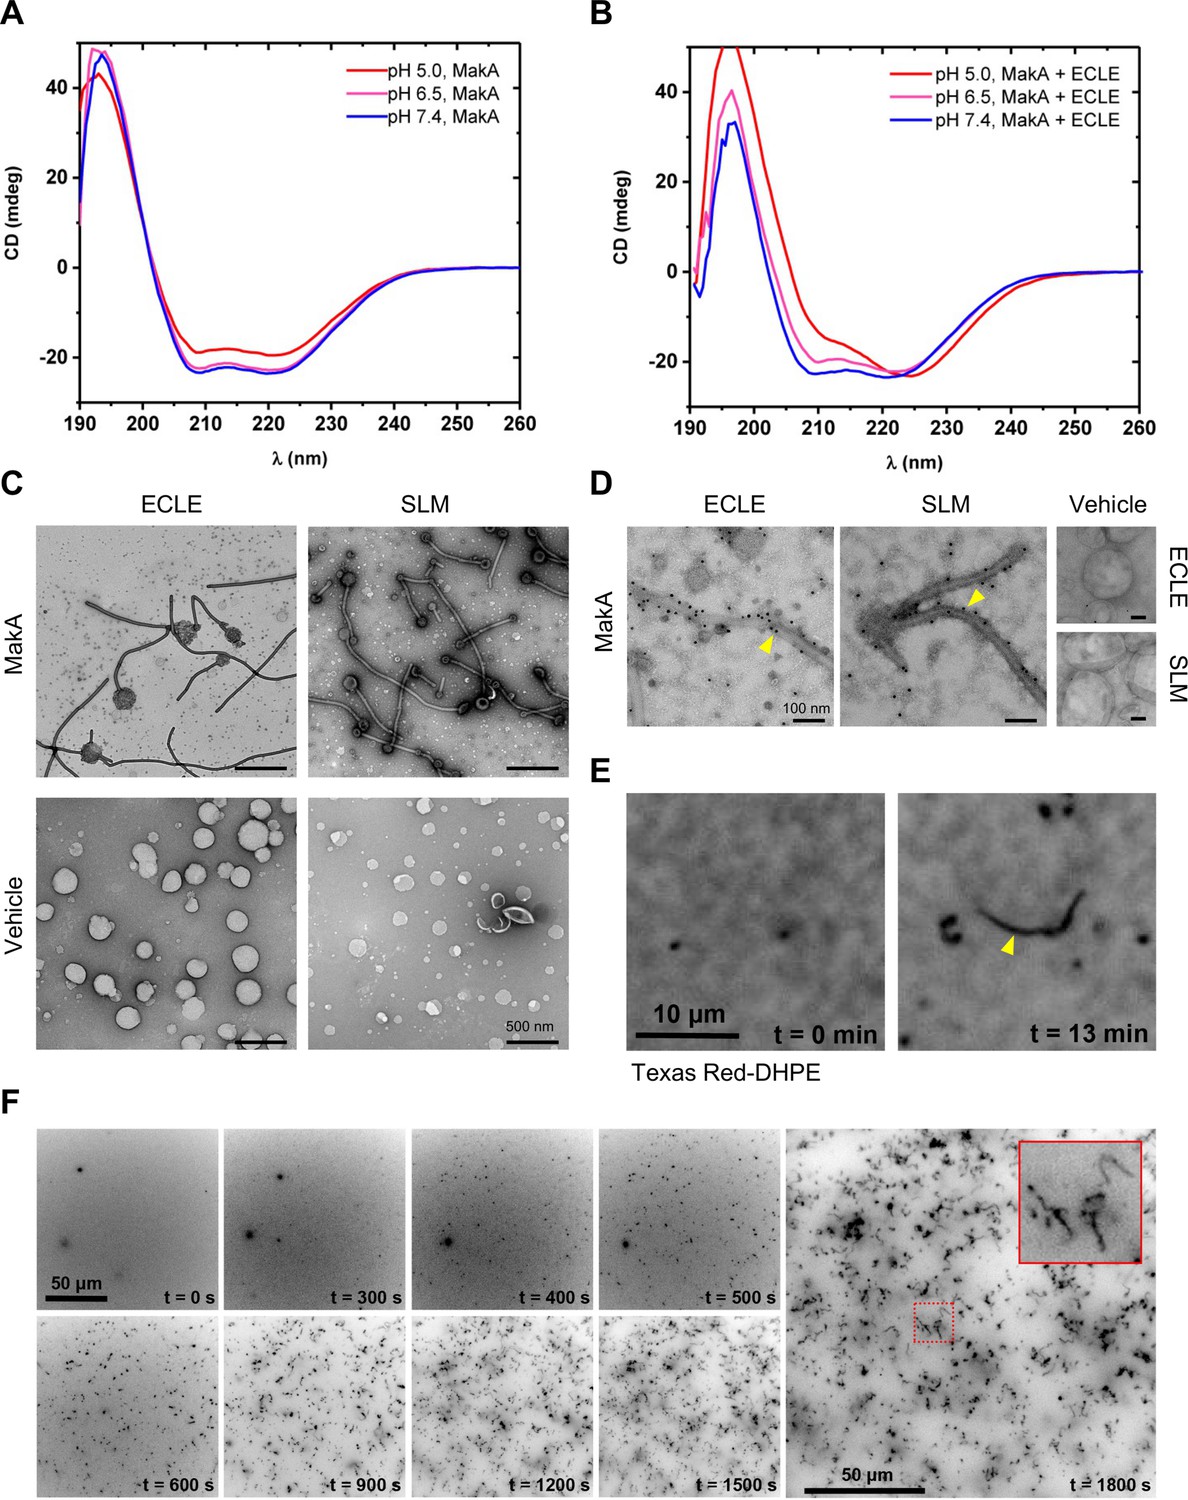
pH-dependent formation of protein-lipid tubular structures from MakA interaction with liposomes.
(A–B) Far-UV circular dichroism (CD) spectra of native MakA of MakA bound to epithelial cell lipid extract (ECLE) liposomes under different pH conditions. CD spectra were recorded in 5 mM citrate buffer using 3 μM MakA protein. The absorption intensity measured from the control solution, containing buffer only, was subtracted to account for background absorption. (C) ECLE or synthetic lipid mixture (SLM) liposomes were treated at pH 6.5 with vehicle (Tris 20 mM) or MakA (3 µM) for 90 min and stained with a 1.5% uranyl acetate solution. Images were captured with transmission electron microscopy (TEM). White arrowheads indicate tubular structures and blue arrowheads indicate MakA oligomeric structures present in the background of liposomes. Scale bars, 200 nm. (D) The ECLE or SLM liposomes were treated with vehicle (Tris 20 mM) or MakA (3 µM) for 90 min and stained with a 1.5% uranyl acetate solution. MakA was detected with anti-MakA antibodies, followed by immunogold labeling and imaging by TEM. Scale bars, 200 nm. (E) Selected inverted grayscale images from time-lapse epifluorescence microscopy (Video 1) obtained after incubating supported lipid bilayers (SLBs) (prepared from SLM + TxRed liposomes) with MakA (3 μM) at pH 6.5. The fluctuating tubules (yellow arrowhead) are visible due to their TxRed-DHPE lipid content. Scale bar, 10 μm. (F) Selected inverted grayscale images from time-lapse epifluorescence microscopy (Video 2) obtained after incubating SLBs (prepared from SLM liposomes) with Alexa568-MakA (3 μM) at pH 6.5. Panels illustrate key steps during the transformation of SLBs into fluctuating tubules. The inset indicates appearance of an Alexa568-MakA-positive tubular structure. Scale bar, 50 μm.
-
Figure 3—source data 1
Far-UV circular dichroism (CD) spectra values.
- https://cdn.elifesciences.org/articles/73439/elife-73439-fig3-data1-v1.xlsx
Figure 3—figure supplement 1
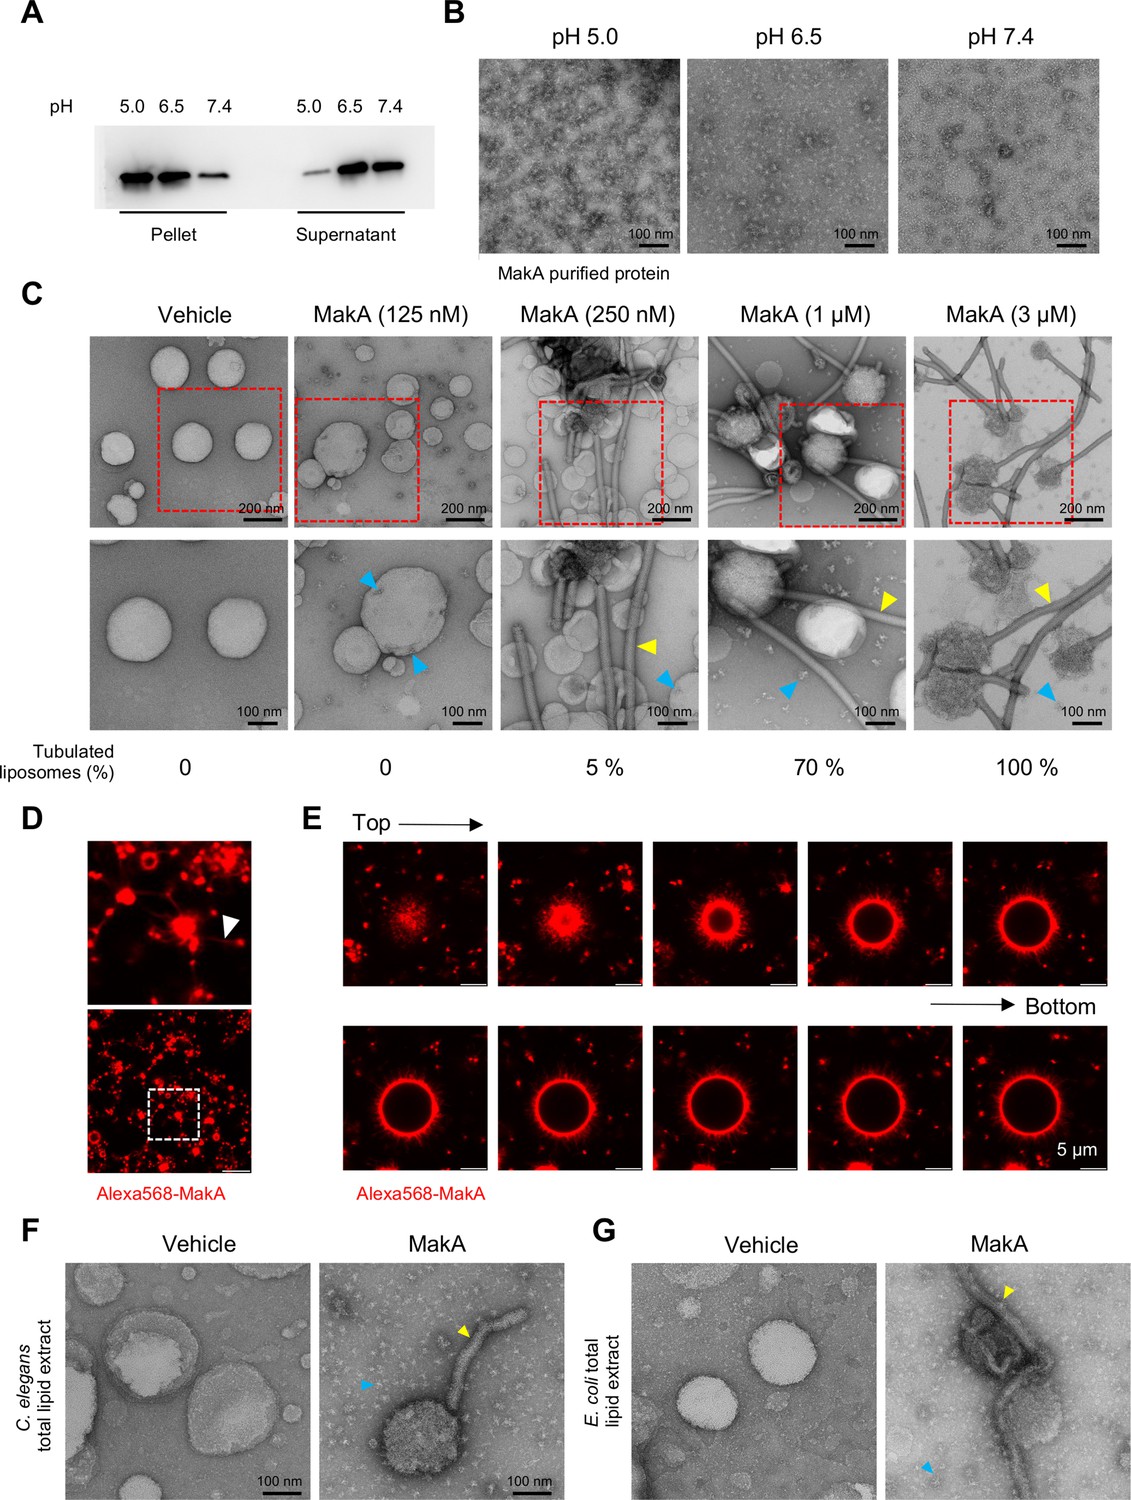
MakA binding to epithelial cell lipid extract (ECLE) liposomes and induction of tubulation in a pH-dependent manner.
(A) Western blot analysis of ECLE liposome-bound MakA detected with anti-MakA antiserum. MakA protein (128 nM) was incubated under different pH conditions with liposomes prepared from epithelial cell lipid extract. S = supernatant and P = pellet. (B) Electron microscopy (EM) micrographs of MakA protein (10 µM) that was incubated at 37°C for 1 hr in 120 mM citrate buffer, adjusted to pH 5.0, pH 6.5, and pH 7.4, respectively. The protein samples were spotted on grids and stained with 1.5% uranyl acetate solution. Images were captured with transmission electron microscopy (TEM). MakA appeared as oligomers of varying sizes under the different pH conditions. Scale bars, 100 nm. (C) ECLE liposomes were treated with increasing concentration of MakA for 90 min and stained with a 1.5% uranyl acetate solution. Images were captured with TEM. Yellow arrowheads indicate tubular structures, blue arrowheads indicate the formation of MakA oligomeric structures present nearby or on liposomes. Scale bars, 200 and 100 nm. A quantification (%) of liposomes with tubular structures is shown below the micrographs. (D–E) ECLE liposomes were treated with Alexa568-MakA (1 µM, 90 min, pH 6.5). Liposome-bound MakA across the tubular structure (arrowhead, white) was detected by confocal microscopy. Scale bars, 5 µm. Selected images from the z-stack projection of liposome-bound Alexa568-MakA are shown (top = topmost section, bottom = section close to the coverslip). The fraction of large vesicles was less than 1% in the reaction mixture. (F–G) Liposomes prepared from Caenorhabditis elegans or Escherichia coli total lipid extracts were treated with MakA (3 µM, 90 min) at pH 6.5. Yellow arrowheads indicate MakA-induced tubular structures and blue arrowheads indicate MakA oligomers. Scale bars, 200 and 100 nm.
-
Figure 3—figure supplement 1—source data 1
Original Western blots for MakA.
- https://cdn.elifesciences.org/articles/73439/elife-73439-fig3-figsupp1-data1-v1.pdf
Figure 4 with 4 supplements
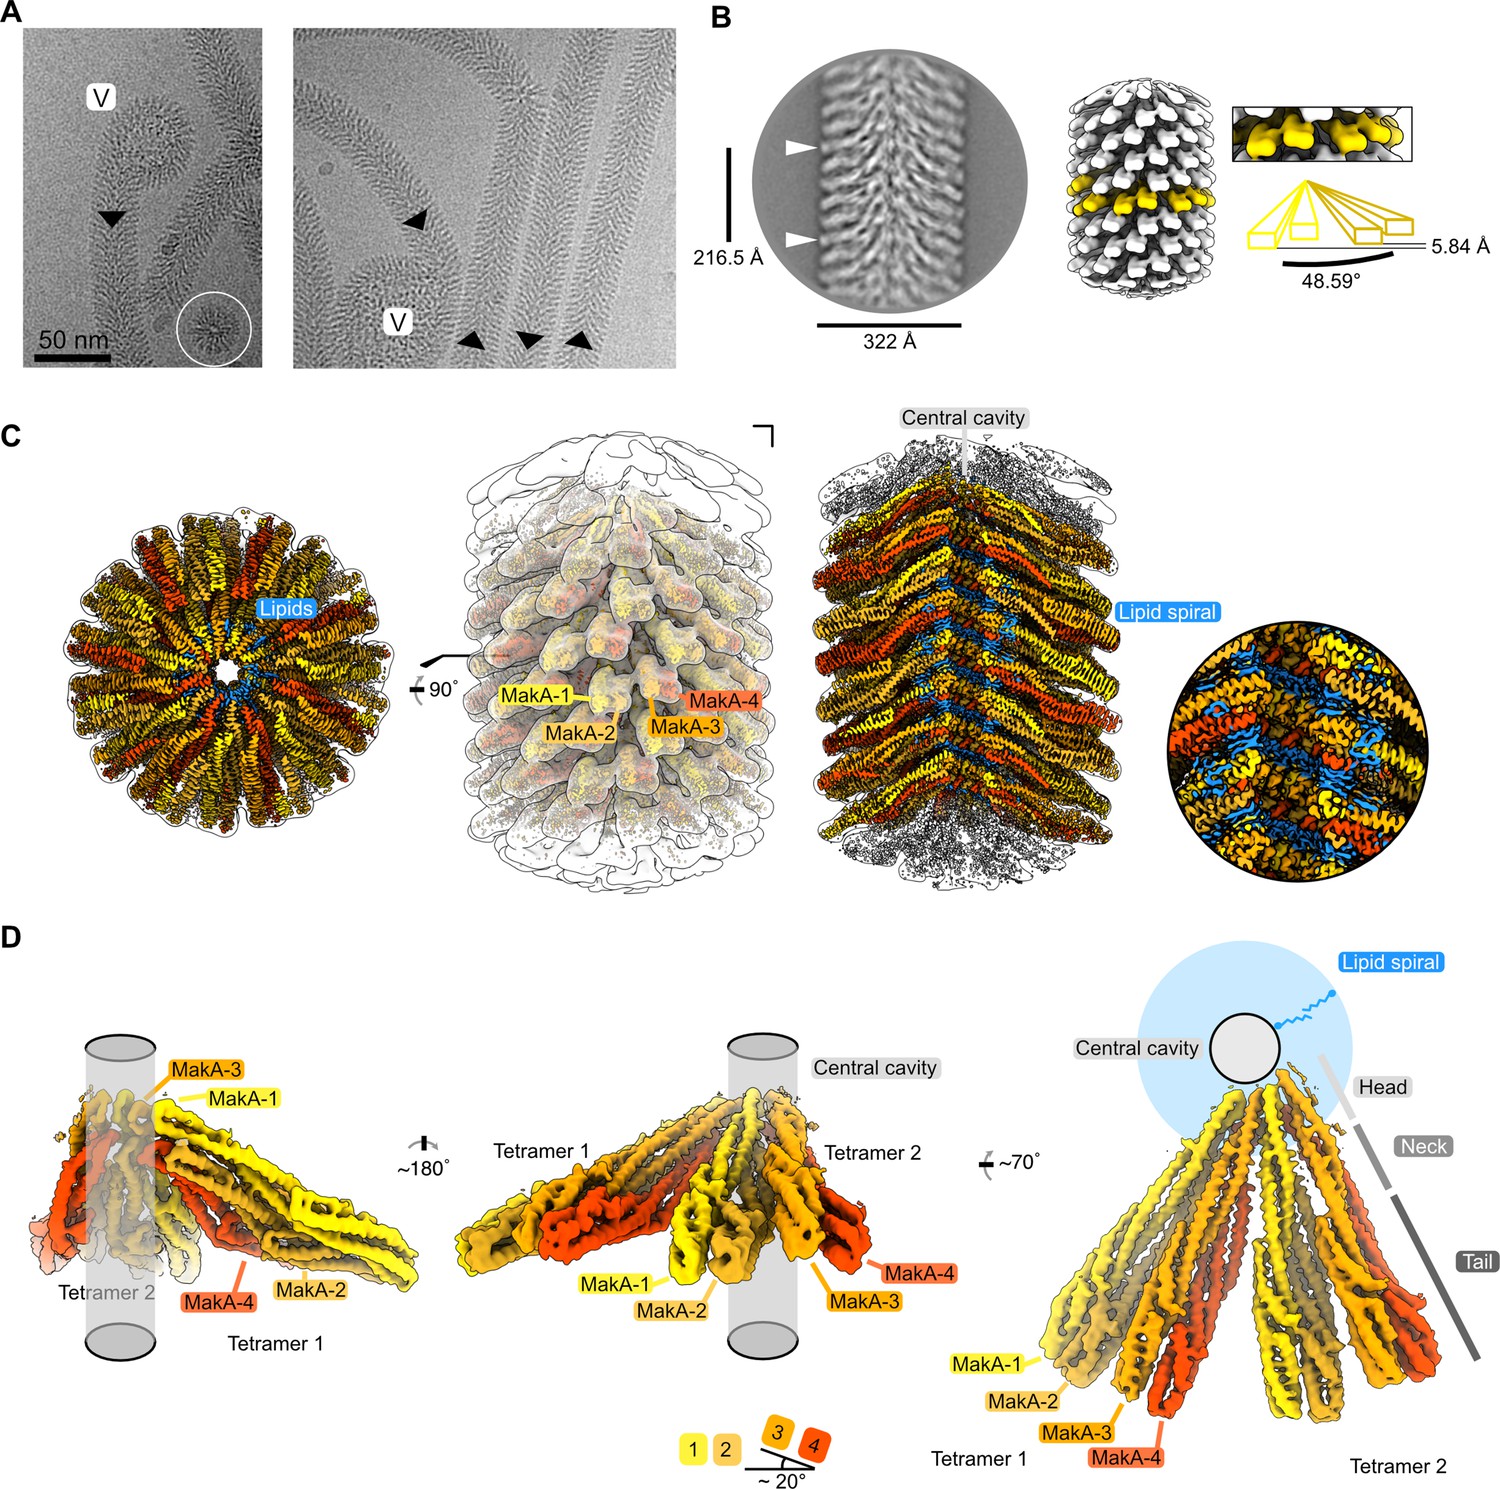
Cryo-electron microscopy (cryo-EM) structure of the membrane-bound MakA filament.
(A) Representative cryo-EM micrograph sections showing MakA filaments emerging from or ending in a membranous vesicle (V; vesicle). The black arrows indicate the directionality of the filaments. A top view of the filamentous tube is visible in the first micrograph within the white circle. (B) A 2D class average with filament diameter indicated below and the repeat distance labeled on the side. An example of a visually repeating element is indicated with white arrows. The right side depicts a low-pass filtered cryo-EM volume with eight repeating subunits colored in gold next to a zoom-in of two blades. A schematic representation of the two repeating units is visualized underneath the zoom-in with a helical twist (48.59°), and a rise (5.84 Å) indicated. (C) Overall cryo-EM volume (EMD-13185) and slab views of the MakA filament superimposed onto a semi-transparent, white, 20 Å, low-pass filtered map. The four MakA subunits, belonging to one tetramer, are colored in shades of gold and orange-red and labeled. The different densities between the protein blades belonging to a lipid bilayer are colored in blue. (D) Rotationally related views of the signal of subtracted and focused-refined cryo-EM volume of two tetramers (EMD-13185-additional map 1) are shown with a schematic representation of the central cavity (transparent gray) and the lipid spiral (blue). Common structural elements of the alpha-cytolysin family protein-fold are indicated in gray (head, neck, and tail). The 20° rotation of the tail domain between two dimers within the asymmetric unit is shown schematically below the central panel.
Figure 4—figure supplement 1
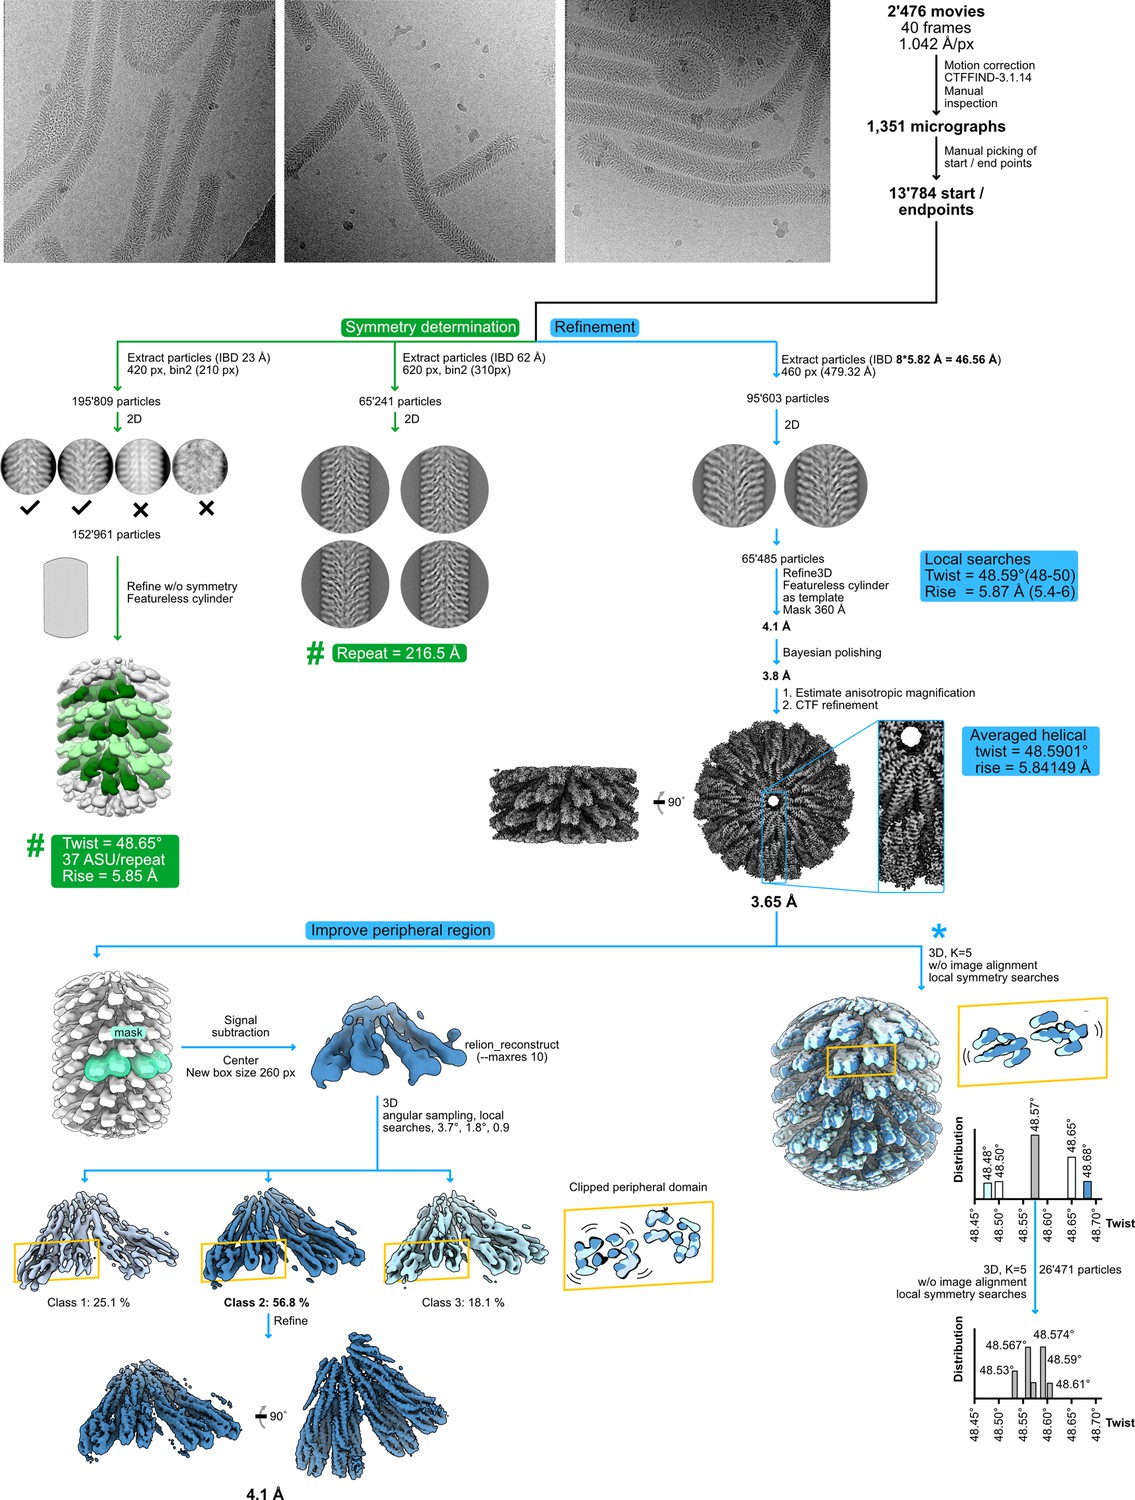
Cryo-electron microscopy (cryo-EM) processing scheme.
Three representative micrographs are shown next to a schematic sorting and data processing tree. The green branch of the tree indicates steps performed to obtain the symmetry parameters of the filament, while the blue branch outlines high-resolution refinement. Within the green branch, the (#) refers to (Figure 4—figure supplement 2), which details how the listed symmetry parameters were obtained. The branch depicted with a (*) describes two consecutive 3D classification experiments, performed without image alignment but with local searches of helical symmetry, to analyze the presence of continuous motion or concrete states in the filament.
Figure 4—figure supplement 2
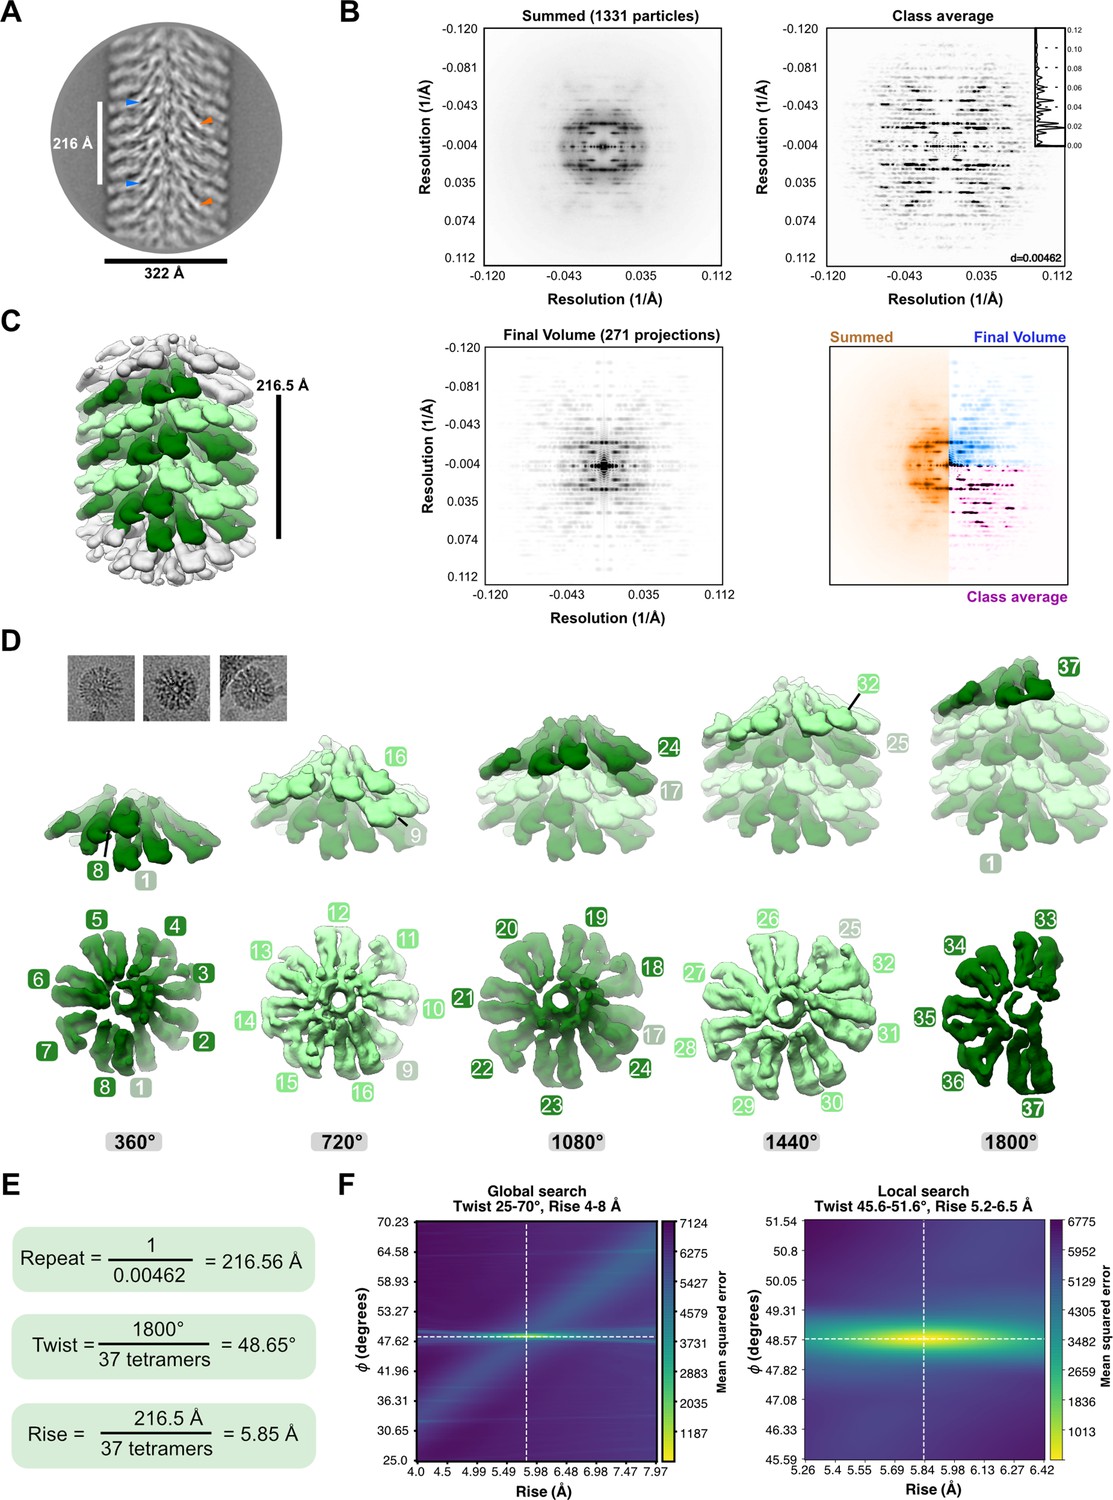
Helical symmetry determination of the MakA-filament.
(A) A representative 2D class average, obtained from segments extracted with a large box size of 646 Å using RELION-3.1 (Zivanov et al., 2018), is shown with a repeat distance of 216.5 Å indicated and examples of visually repetitive elements highlighted (indicated with blue or orange arrows). (B) Summed (top left), averaged (top right), or final model (bottom left) power spectra (PS). A collapsed PS is shown as an inlet in the PS of the class average (black curve). PS were calculated using the 1331 particles (summed), the class average shown in (A) (class average) or summed based on 271 projections of the final volume (EMD-13185). PS were obtained using SPRING-0.86 (Desfosses et al., 2014), BSOFT (Heymann and Belnap, 2007), and averaged using RELION-3.1. (C) A volume, obtained by refining well-defined class averages showing high-resolution features without symmetry in RELION-3.1, is shown 20 Å low-pass filtered with one repeat colored in shades of green. (D) Three filament top views, cut out from micrographs, are shown above a dissection of the volume depicted in (C). The five turns, constituting one repeat, are demonstrated individually, starting with the first (left) and ending with the last turn (right). The lower row visualizes a top view of each turn with individual repetitive segments numbered. The top row shows the corresponding turns in a side view in solid colors, superimposed with a transparent filament. (E) The resulting calculated symmetry parameters are shown. (F) Global and local searches for helical symmetry in cryoSPARC (Punjani et al., 2017) confirm the calculated helical parameters.
Figure 4—figure supplement 3
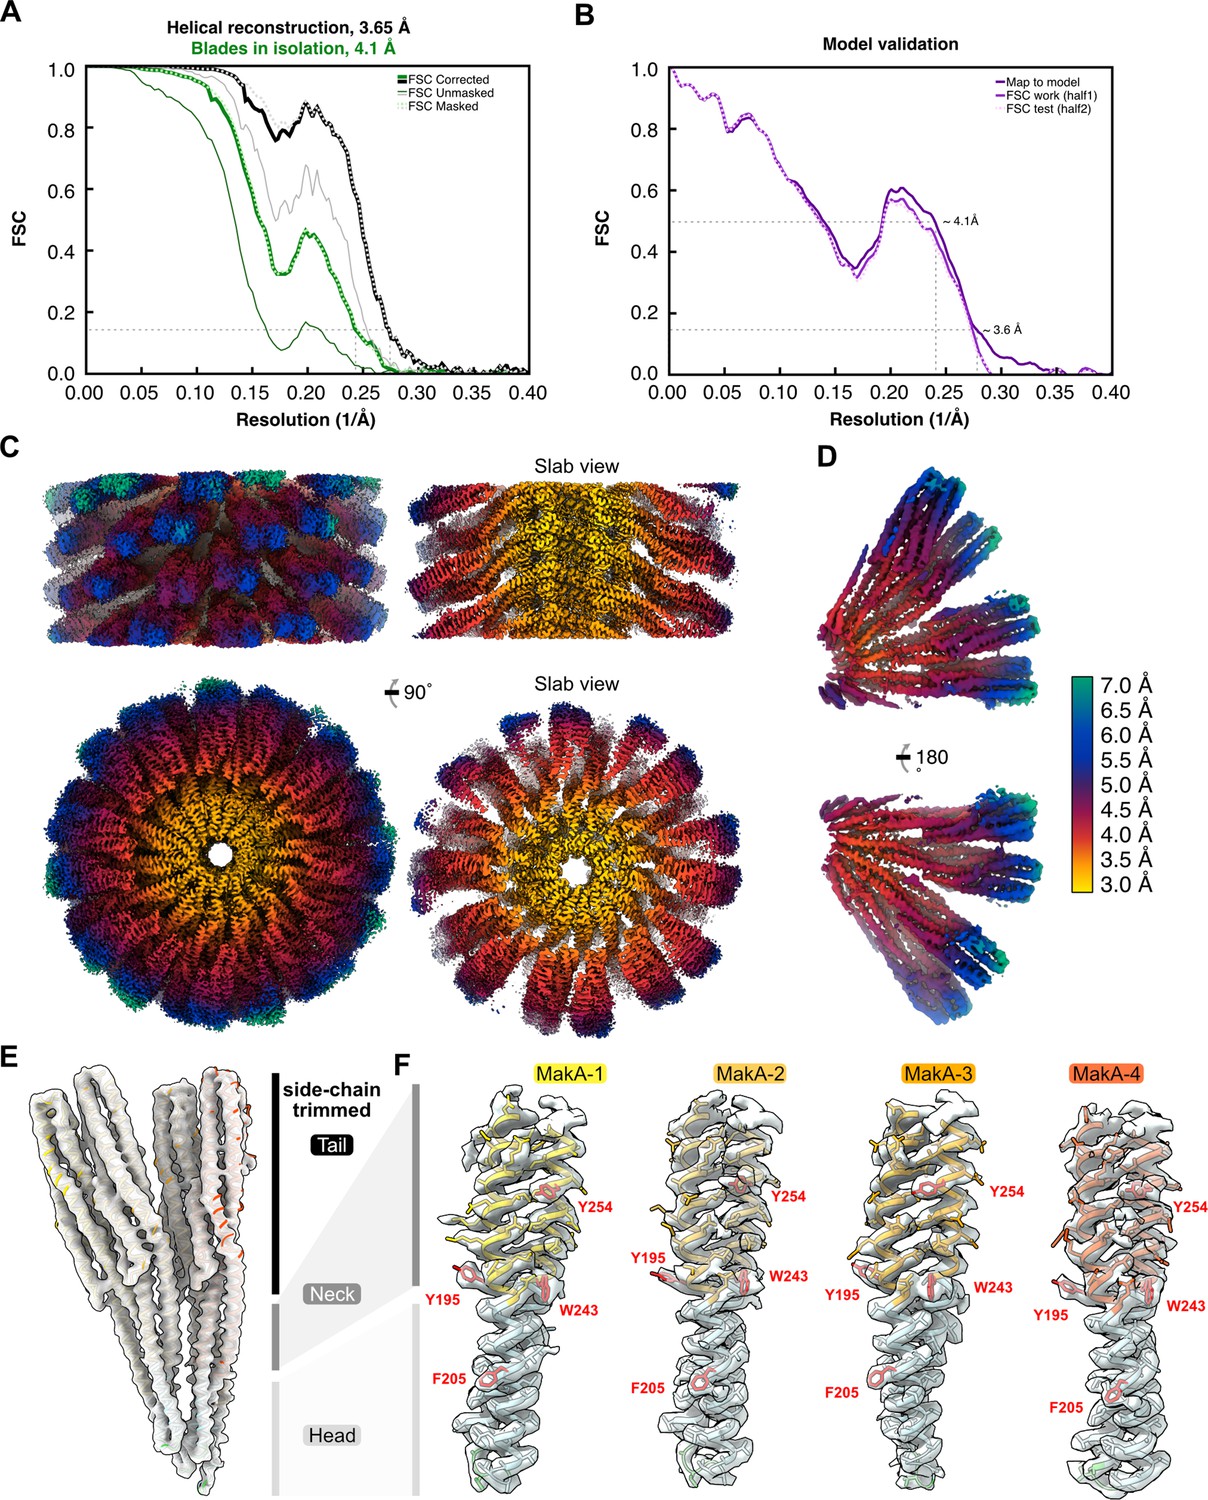
Global and local resolution estimation, model validation, and density fit.
(A) The Fourier shell correlation (FSC) curves, obtained from RELION-3.1 (Zivanov et al., 2018), are shown for the helical reconstruction (EMD-13185) and the two tetramers refined in isolation (EMD-13185-additional map 1). An FSC value of 0.143 is indicated with a thin dashed line. (B) Cross-validation of the final refined model and map (dark-purple line) and a modified ‘scrambled’ model (random displacement of all atoms by 0.5 Å), refined against 50% of the data, compared against half map 1 (solid purple line) or the independent half map 2 (dashed light-purple line). Thin dashed lines indicate FSC values of 0.5 and 0.143. (C) Two 90° related views of the helical reconstruction are shown from the side and the top, next to two slab views. (D) Two 180° related views of the two tetramers refined in isolation are visualized. The cryo-electron microscopy (cryo-EM) densities in (C–D) are colored according to local resolution, which was estimated using RELION-3.1 and visualized in UCSF ChimeraX (Goddard et al., 2018). (E–F) The overall model to density fit between the final refined model (PDB-7P3R) and (E) the 4.1 Å cryo-EM map (EMD-13185-additional map 1) or (F) sections of the peripheral head and neck domains of the 3.7 Å map (EMD-13185). The individual copies of MakA are colored in shades of red and orange, with the transmembrane domains highlighted in blue. Selected bulky residues are indicated and labeled with the amino acid code and residue number in red.
Figure 4—figure supplement 4
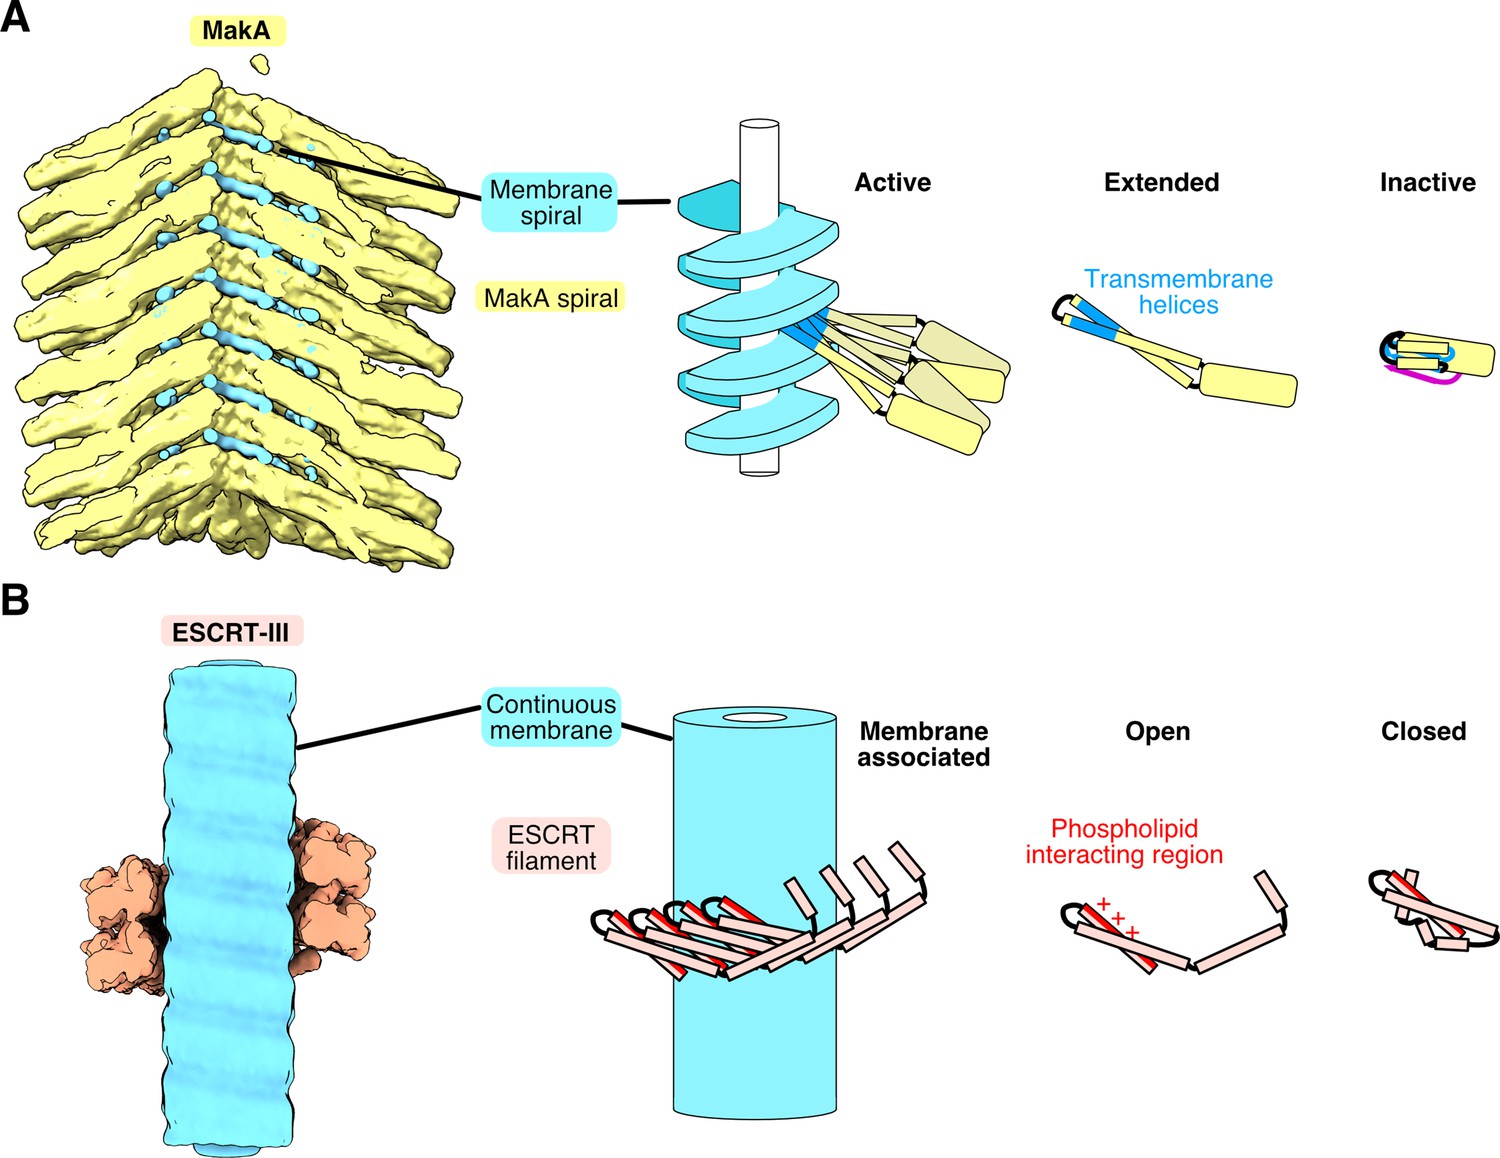
Comparison of the MakA and ESCRT-III subunit structure, conformation, and membrane interaction.
(A–B) A subset of the MakA (A yellow) and the ESCRT-III (B red) filament model is shown, superimposed with segmented membrane/lipid density on the left. The models (MakA: PDB-7P3R, ESCRT-III: PDB-6TZ4 [Nguyen et al., 2020]) and the membrane/lipid densities (MakA: EMDB-13185, ESCRT-III: EMDB-20588) are shown as surface representation, low-pass filtered to 10 Å. The middle and right side depict schematic representations of the lipid spiral, or the membrane, and oligomeric form and the open/active and inactive/closed conformation of MakA (yellow) and ESCRT-III subunit CHMP1B (red).
Figure 5
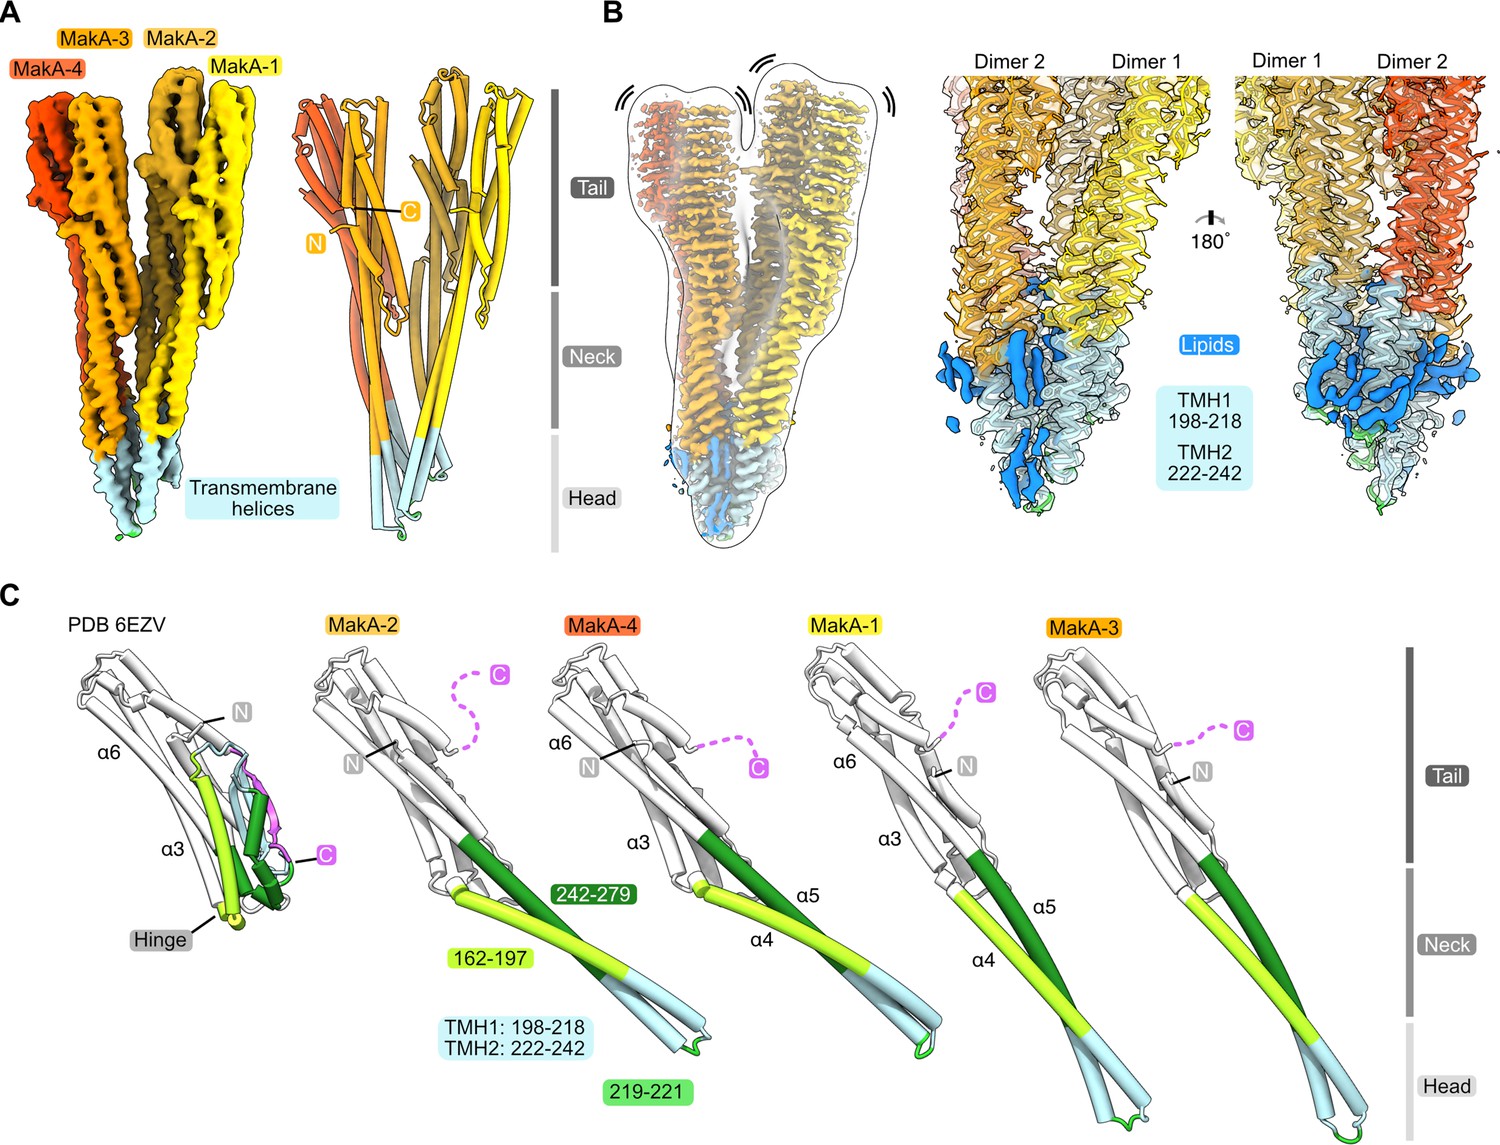
Conformational plasticity of MakA in the membrane-bound filamentous state.
(A) The cryo-electron microscopy (cryo-EM) density of a MakA tetramer (EMD-13185-additional map 1) is shown next to a structural model. The individual protein domains (head, neck, and tail) and the visible N- and C-termini are indicated. (B) The cryo-EM density of a MakA tetramer, obtained by helical reconstruction (EMD-13185), is shown in isolation, colored and oriented as the structural model in (A). The cryo-EM volume is superimposed with a white, transparent, 20 Å, low-pass filtered volume. Additional density areas in the transmembrane helix (TMH) region, presumably belonging to lipids, are colored in blue. (C) The crystal structure of monomeric MakA (PDB-6EVZ, Dongre et al., 2018) with a retracted neck and head domain is shown next to the four individual subunits of the membrane-bound state of MakA in a cartoon representation (PDB-7P3R). All structural models were superimposed based on the tail region (in white) and displayed in the same orientation next to each other with increasing length, depicting flexing of the neck and head domain as well as the TMH.
Videos
Video 1
Movie assembled from time-lapse fluorescence microscopy images (frame rate, 0.1 fps) obtained for TexaRed-labeled supported lipid bilayer (SLB) prepared from synthetic lipid mixture (SLM) + TxRed liposomes and treated with unlabeled MakA (3 µM) at pH 6.5.
Images for generating the movie were acquired every 5 s for the duration of 20 min.
Video 2
Movie assembled from time-lapse fluorescence microscopy images (frame rate, 0.1 fps) obtained for supported lipid bilayer (SLB) prepared from synthetic lipid mixture (SLM) liposomes and treated with Alexa568-MakA (3 µM) at pH 6.5.
Images for generating the movie were acquired every 10 s for the duration of 30 min.
Tables
Key resources table
| Reagent type (species) or resource | Designation | Source or reference | Identifiers | Additional information |
|---|---|---|---|---|
| Cell line (Homo sapiens) | Large intestine; Colon | ATCC | HCT 8 (RRID:CVCL_2478) | Cell line maintained in RPMI-1640 |
| Cell line (Homo sapiens) | Large intestine; Colon | ATCC | Caco-2 (RRID:CVCL_0025) | Cell line maintained in RPMI-1640 |
| Cell line (Homo sapiens) | Large intestine; Colon | ATCC | HCT 116 (RRID:CVCL_0291) | Cell line maintained in RPMI-1640 |
| Antibody | Anti-MakA(Rabbit polyclonal) | GeneCust | PO# AB190007 | WB (1:20,000) |
| Antibody | Anti-LAMP1(Rabbit polyclonal) | Cell Signaling | Cat# 9091SRRID:AB_2687579 | WB (1:1000) |
| Antibody | Anti-β-actin(Mouse monoclonal) | Sigma-Aldrich | Cat# A2228RRID:AB_476697 | WB (1:5000) |
| Antibody | Goat anti-Rabbit IgG HRP conjugated (polyclonal) | Agrisera | Cat# AS09602RRID:AB_1966902 | WB (1:5000) |
| Antibody | Rabbit anti-Mouse IgG HRP conjugated(polyclonal) | Dako | Cat# P0260RRID:AB_2636929 | WB (1:5000) |
| Commercial assay or kit | Clarity Western ECL reagent | Bio-Rad | Cat# 170–5061 | Western blot reagent |
| Commercial assay or kit | Isolation of lysosomes from HCT8 or Caco-2 cells | Abcam | Cat# ab234047 | |
| Commercial assay or kit | SuperSignal West femto maximum sensitivity substrate | Thermo Scientific | Cat# 34096 | Western blot reagent |
| Transfected construct (human) | CellLight Lysosomes-GFP | Invitrogen | Cat# C10507 | GFP-LAMP1transfection reagent for lysosome labeling |
| Software, algorithm | GraphPad Prism | GraphPad Prism | RRID:SCR_002798 | |
| Software, algorithm | Fiji | Fiji | RRID:SCR_002285 | |
| Other | Alexa Fluor 568 | Thermo Fisher Scientific | Cat# A10238 | Alexa568-MakA labeling |
| Other | Propidium Iodide | BD Pharmingen | Cat# 66211E | For flow cytometry (0.5 µg/mL) |
| Other | Hoechst 33342 | Thermo Scientific | Cat# 62249 | (1–2 µM) |
Table 1
Cryo-electron microscopy (cryo-EM) data collection, refinement, and model statistics.
| MakA helical reconstruction EMD-13185; PDB-7P3R | MakA, tetramers in isolation EMD-13185- additional map 1 | |
|---|---|---|
| Data collection and processing | ||
| Voltage (kV) | 300 | 300 |
| Pixel size (Å) | 1.042 | 1.042 |
| Electron exposure (e-/ÅBeecher and Wong, 1997) | 43 | 43 |
| Defocus range (µm) | 0.7–2.5 | 0.7–2.5 |
| Frames | 40 | 40 |
| Symmetry imposed | C1 | |
| Helical twist (°) | 48.59 | – |
| Helical rise (Å) | 5.84 | – |
| Initial particle images | 95’603 | 95’603 |
| Final particle images | 65’485 | 37’876 |
| Resolution (Å) | 3.7 | 4.1 |
| FSC threshold | 0.143 | 0.143 |
| Map sharpening B-factor (ÅBeecher and Wong, 1997) | –99.9 | –117 |
| Refinement | ||
| Initial model used | 6EZV | 6EZV |
| Model composition | ||
| Non-hydrogen atoms | 7’738 | |
| Protein residues | 1’338 | |
| R.m.s deviations | ||
| Bond length (Å) | 0.0069 | |
| Angles (°) | 1.17 | |
| Validation | ||
| MolProbity score | 1.08 | |
| Clashscore | 1.88 | |
| Poor rotamers (%) | 0.28 | |
| Ramachandran | ||
| Favored (%) | 97.29 | |
| Allowed (%) | 2.71 | |
| Outliers (%) | 0.00 |
Additional files
Download links
A two-part list of links to download the article, or parts of the article, in various formats.
Downloads (link to download the article as PDF)
Open citations (links to open the citations from this article in various online reference manager services)
Cite this article (links to download the citations from this article in formats compatible with various reference manager tools)
Protein-lipid interaction at low pH induces oligomerization of the MakA cytotoxin from Vibrio cholerae
eLife 11:e73439.
https://doi.org/10.7554/eLife.73439


