A transcriptome atlas of the mouse iris at single-cell resolution defines cell types and the genomic response to pupil dilation
- Department of Molecular Biology and Genetics, Johns Hopkins University School of Medicine, United States
- Howard Hughes Medical Institute, Johns Hopkins University School of Medicine, United States
- Department of Neuroscience, Johns Hopkins University School of Medicine, United States
- Department of Ophthalmology, Johns Hopkins University School of Medicine, United States
Figures
Figure 1 with 2 supplements
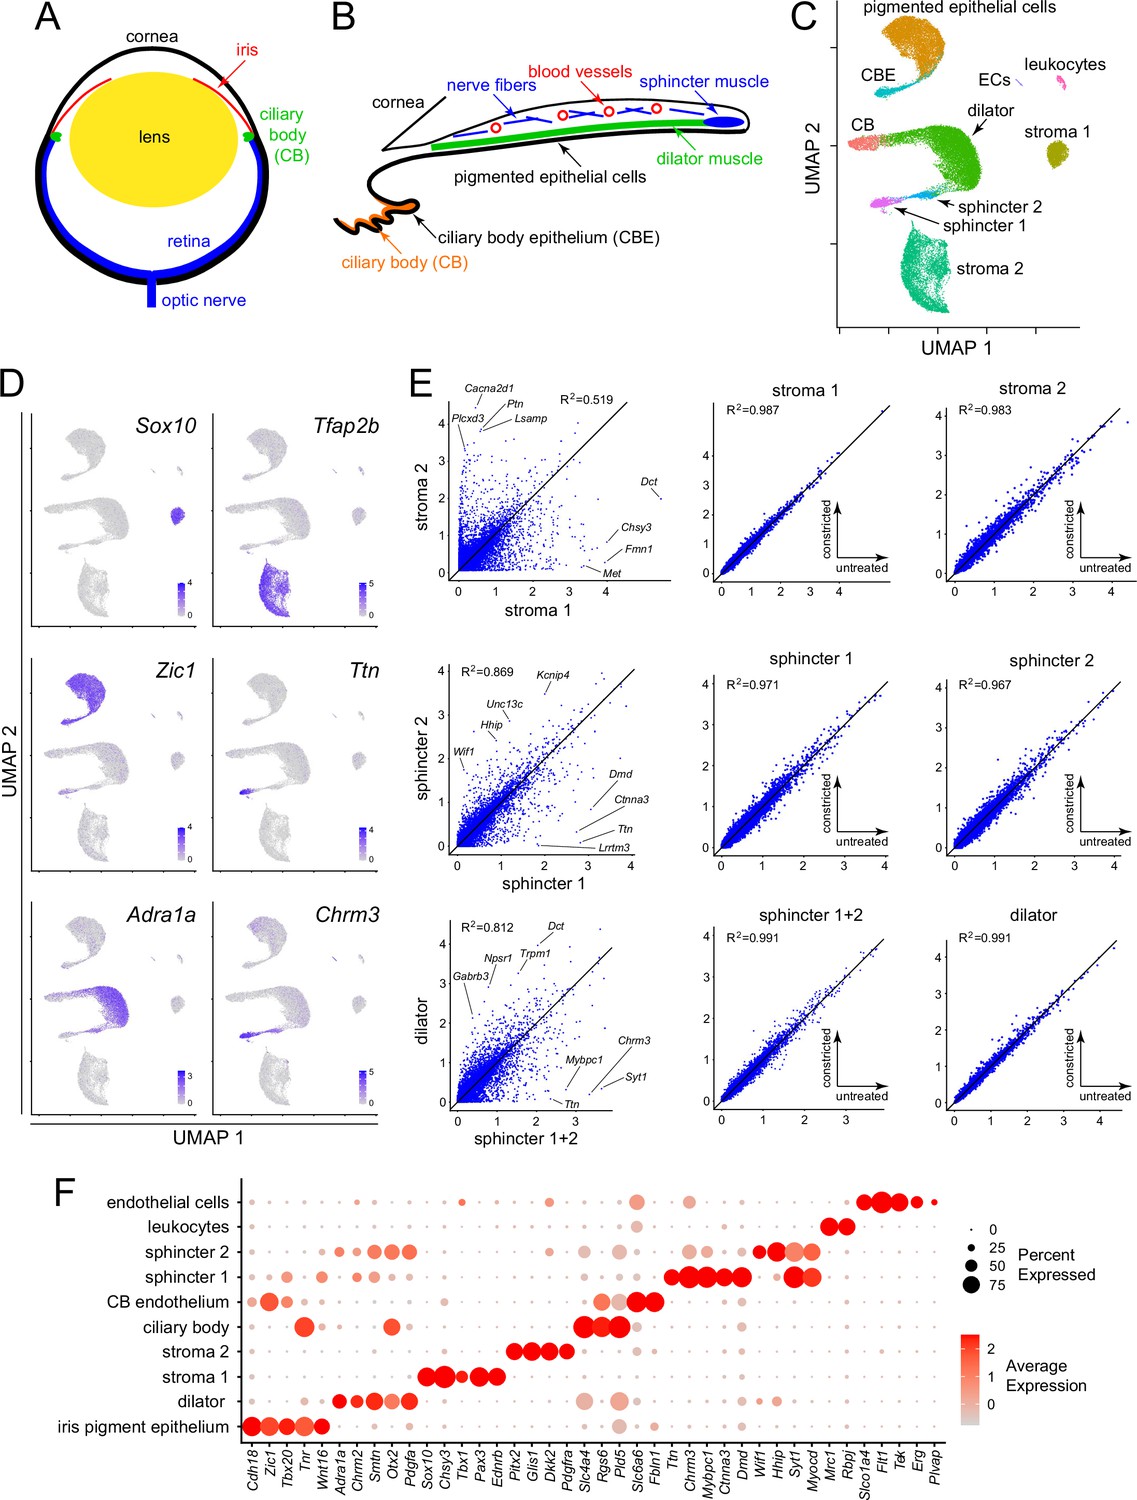
Single nucleus RNAseq (snRNAseq) defines the major cell types in the mouse iris.
(A) Schematic cross section of a mouse eye. (B) Schematic cross section of the mouse iris and ciliary body showing the locations of the major structures. (C) Uniform Manifold Approximation and Projection (UMAP) representation of snRNAseq from untreated, constricted, and dilated mouse irises, with major cell types indicated. CB, ciliary body; CBE, ciliary body epithelium; ECs, endothelial cells. (D) UMAP plots, as in (C), with examples of read counts (in blue) for individual transcripts that define distinct iris cell types. Color intensities represent the scaled average expression level per cell. (E) Scatter plots of snRNAseq read counts (log10 average normalized expression) and R2 values for pairwise comparisons of all transcripts between the indicated cell types. For each of the three rows, the left plot is the comparison of interest, obtained from untreated irises, and the right two plots show comparisons to assess technical variation between different snRNAseq datasets (untreated vs. constricted irises). (F) Dot plot showing transcript abundances across iris cell types for a subset of transcripts that define distinct cell types. In this and all other dot plots, the percentage of cells expressing the indicated transcript is represented by the size of the circle, and the average expression level per cell (the scaled average SCTransform normalized expression calculated with Seurat) is represented by the intensity of the circle.
Figure 1—figure supplement 1
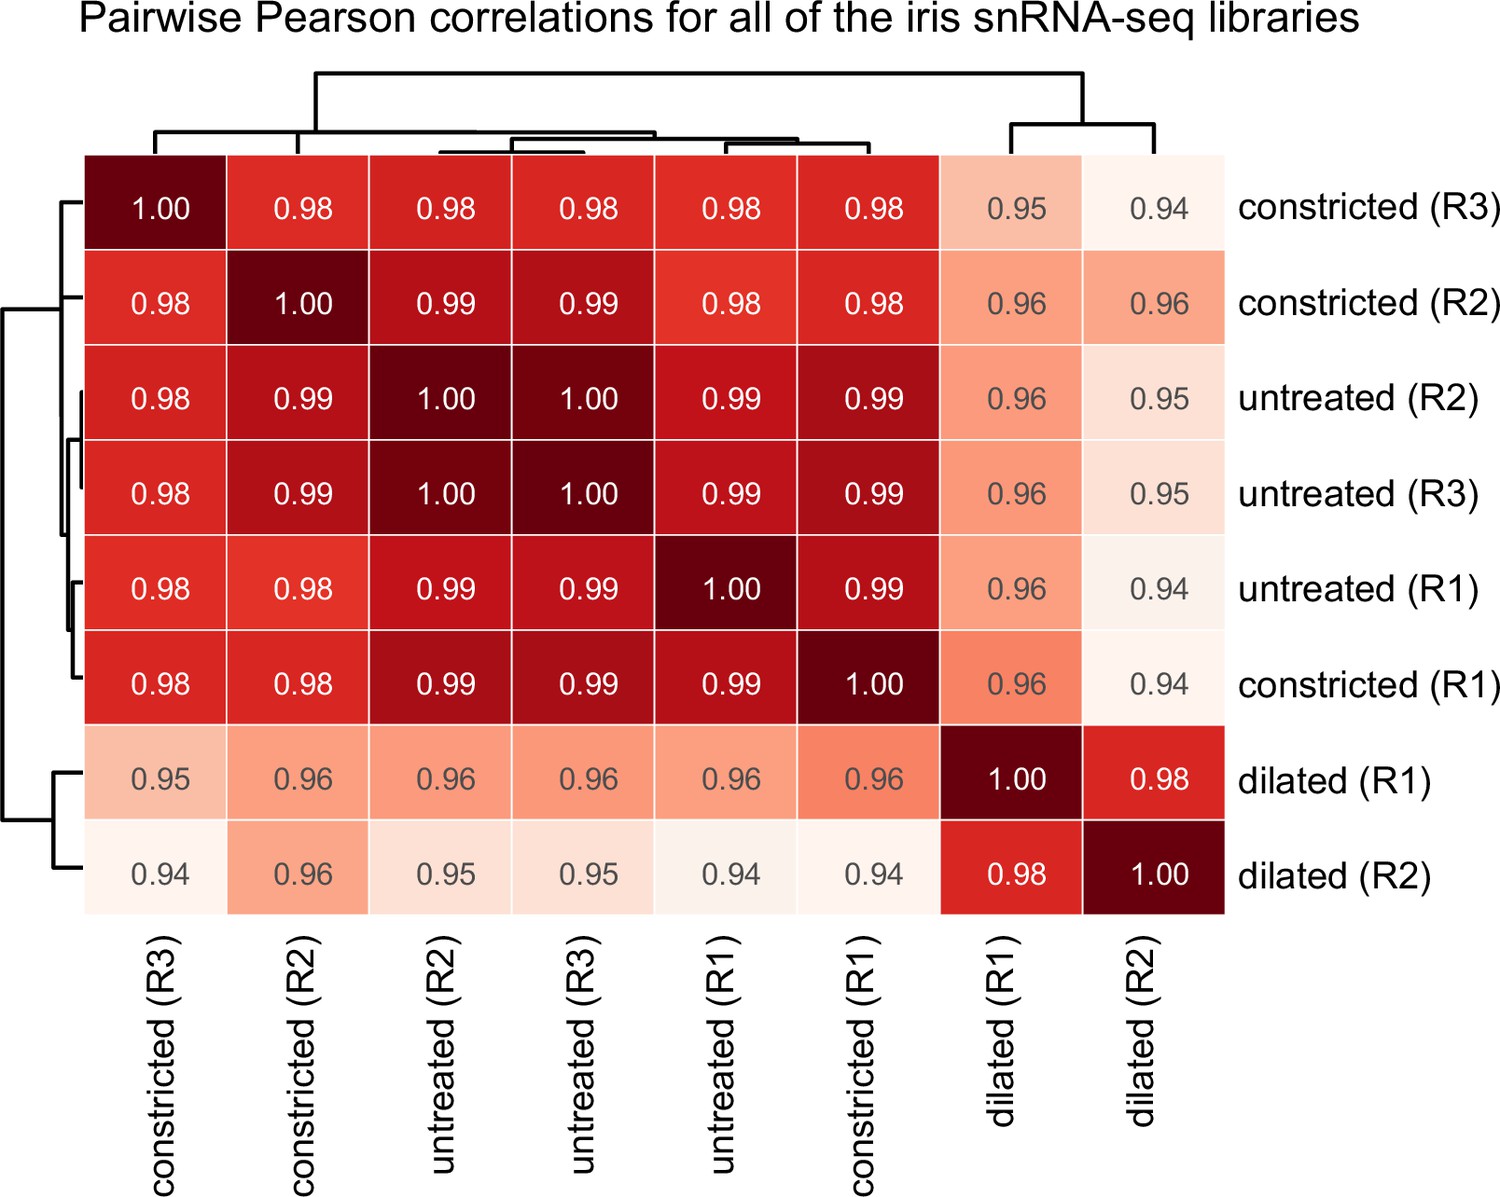
Pairwise Pearson correlations for all of the iris single nucleus (sn)RNAseq libraries.
Correlations are for RNAseq read counts for all transcripts. Constricted and untreated libraries are nearly indistinguishable (R2 = 0.98–0.99).
Figure 1—figure supplement 2
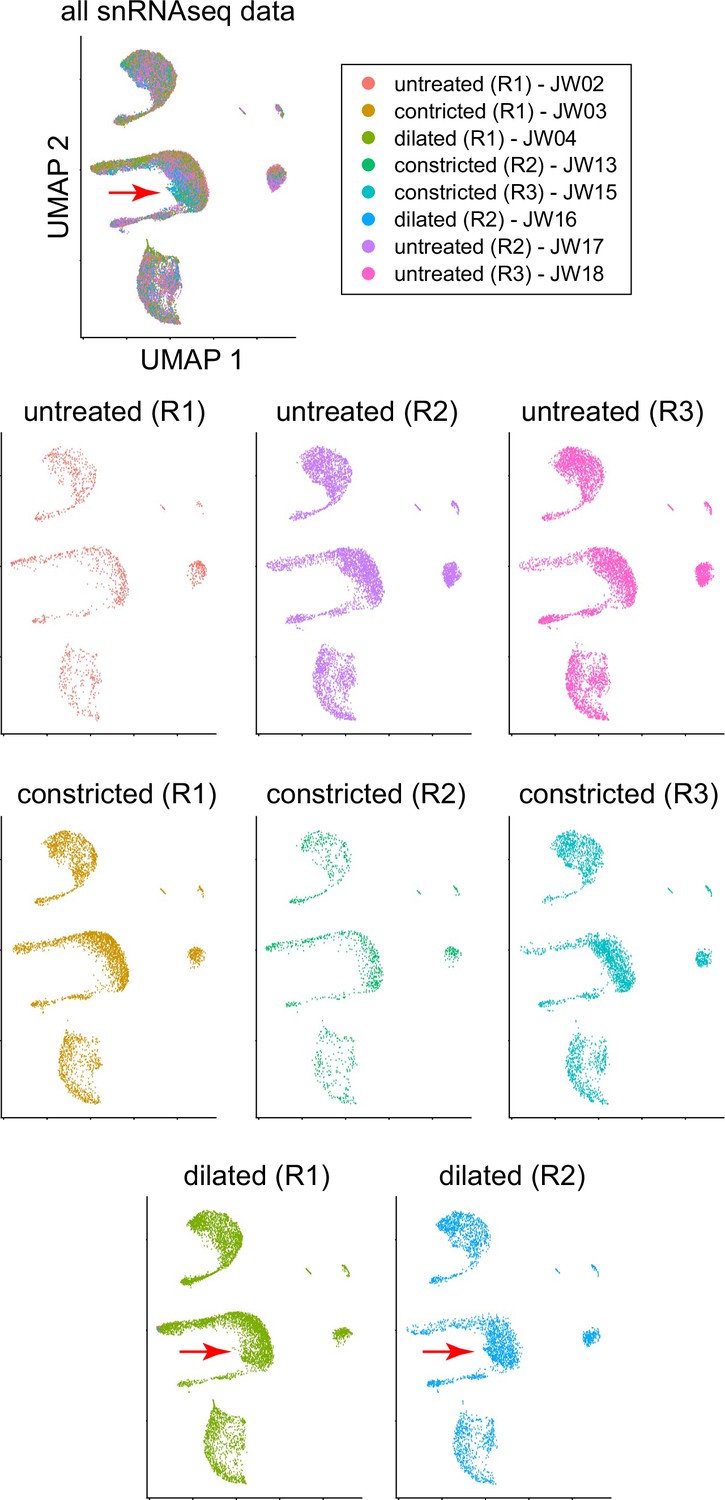
Uniform Manifold Approximation and Projection (UMAP) plots for all of the iris single nucleus (sn)RNAseq libraries.
The red arrows indicate the small shift in the location of the dilator muscle cell cluster upon pupil dilation.
Figure 2 with 1 supplement
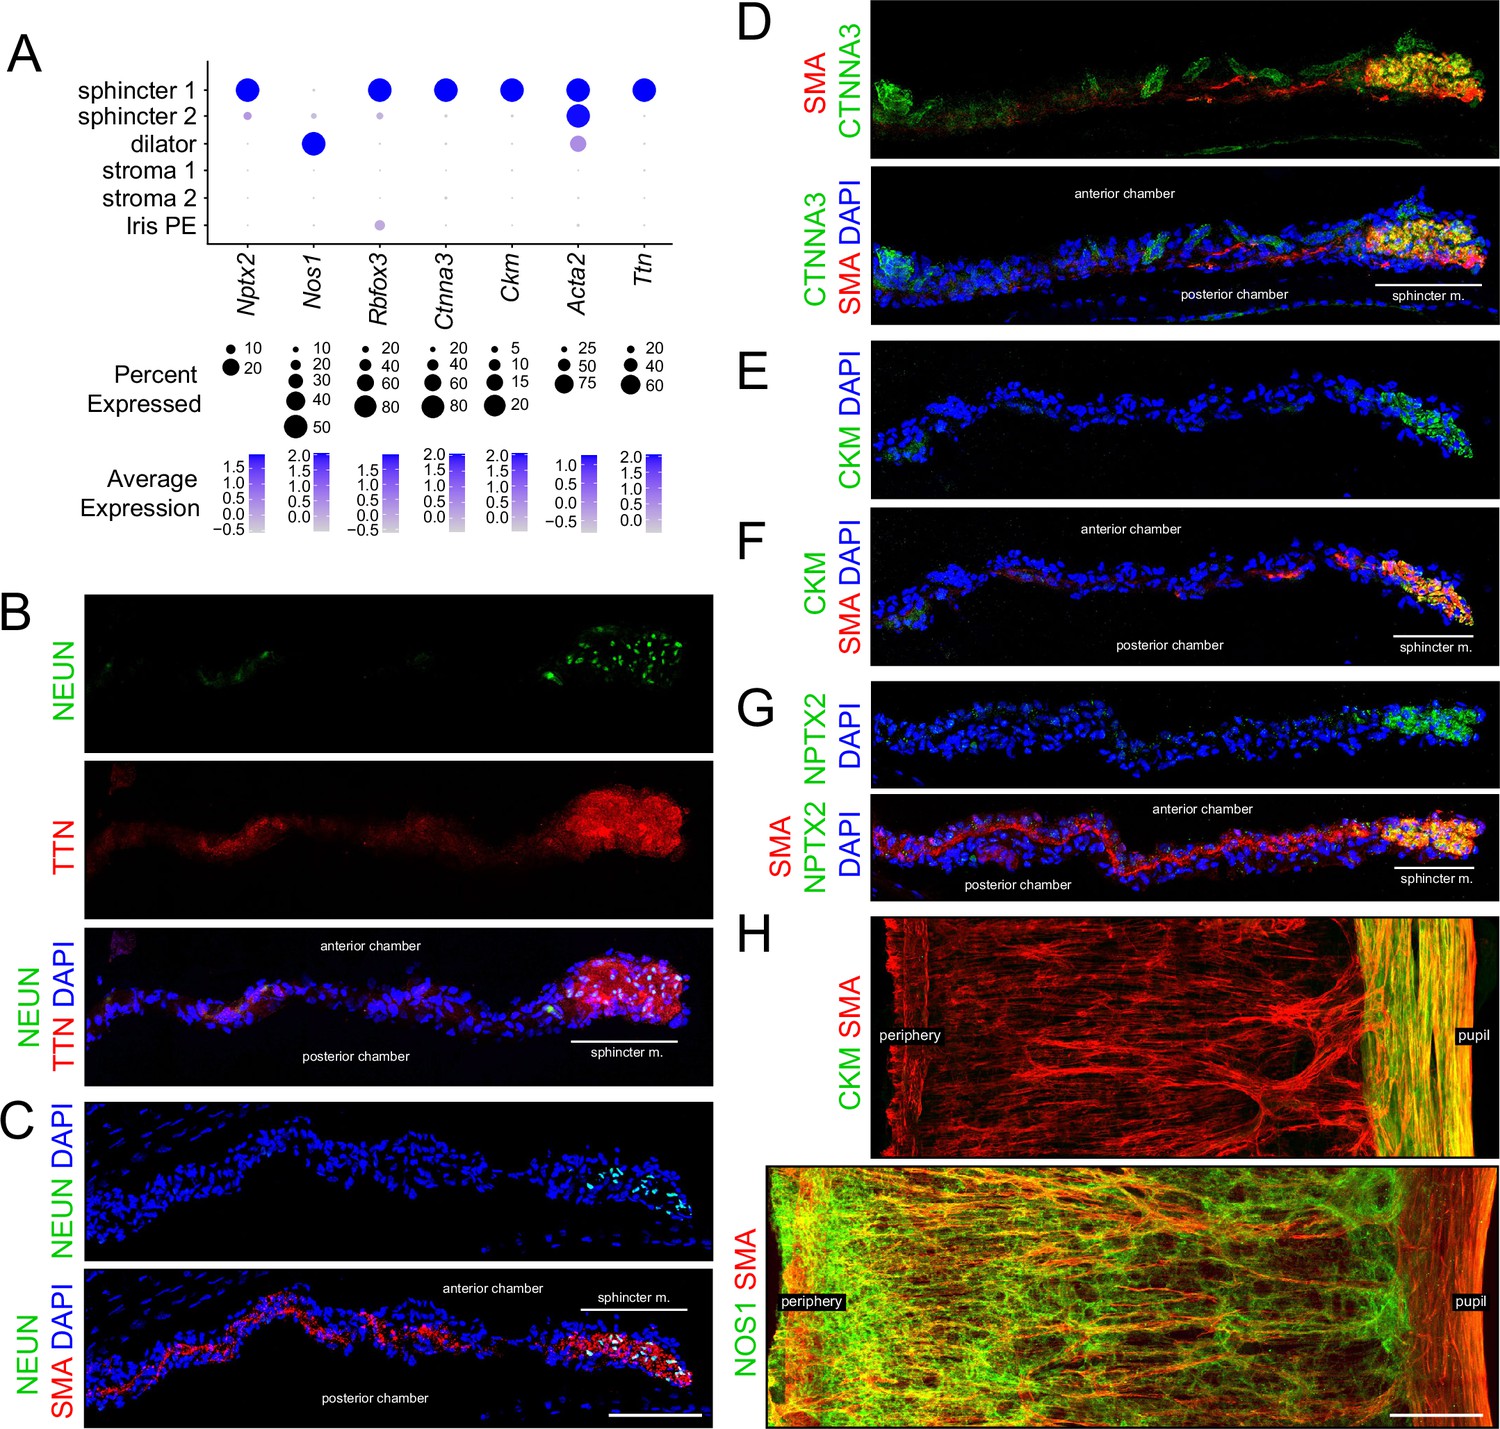
Immunostaining for markers that distinguish sphincter and dilator muscles.
(A) Dot plot (as described in Figure 1F) showing transcript abundances across a subset of iris cell types for transcripts coding for the markers shown in (B–H). Rbfox3 codes for NEUN. Scales are individualized for each transcript to accommodate the large differences in their abundances. (B–G) Cross sections of untreated iris immunostained as indicated. In this and all other figures showing iris cross sections, the cornea is above and the lens is below the region shown. The pupil is to the right and the region encompassing the sphincter muscle is indicated. (H) Flat mounts of untreated iris immunostained as indicated. The sphincter muscle occupies the right-most 15–20% of the iris. For each immunostaining analysis in this and subsequent figures, iris cross sections were stained from at least five mice and iris whole mounts were stained from at least two mice. All images are at the same magnification. Scale bars in (C) and (H), 100 µm.
Figure 2—figure supplement 1
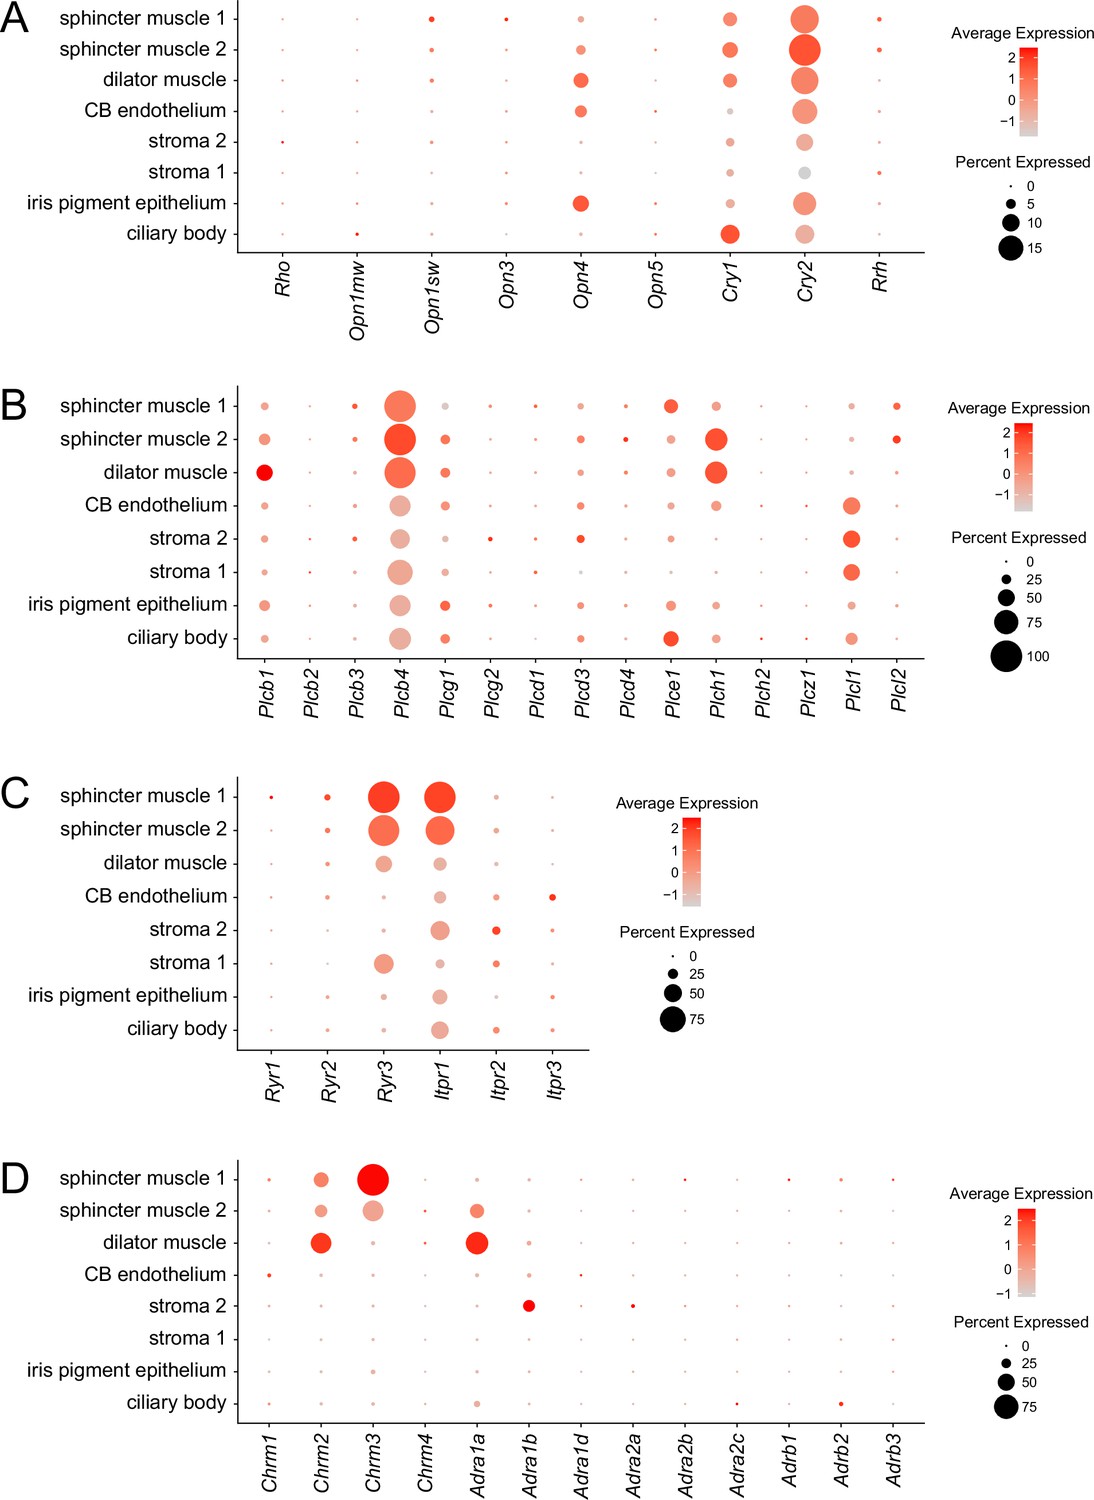
Abundances of transcripts coding for signal transduction components in each of the principal iris cell types.
Dot plots are as described in Figure 1F. (A) Light receptors. (B) Phospholipase C family members. (C) Channels for calcium release from intracellular stores. (D) Cholinergic and adrenergic receptors.
Figure 3
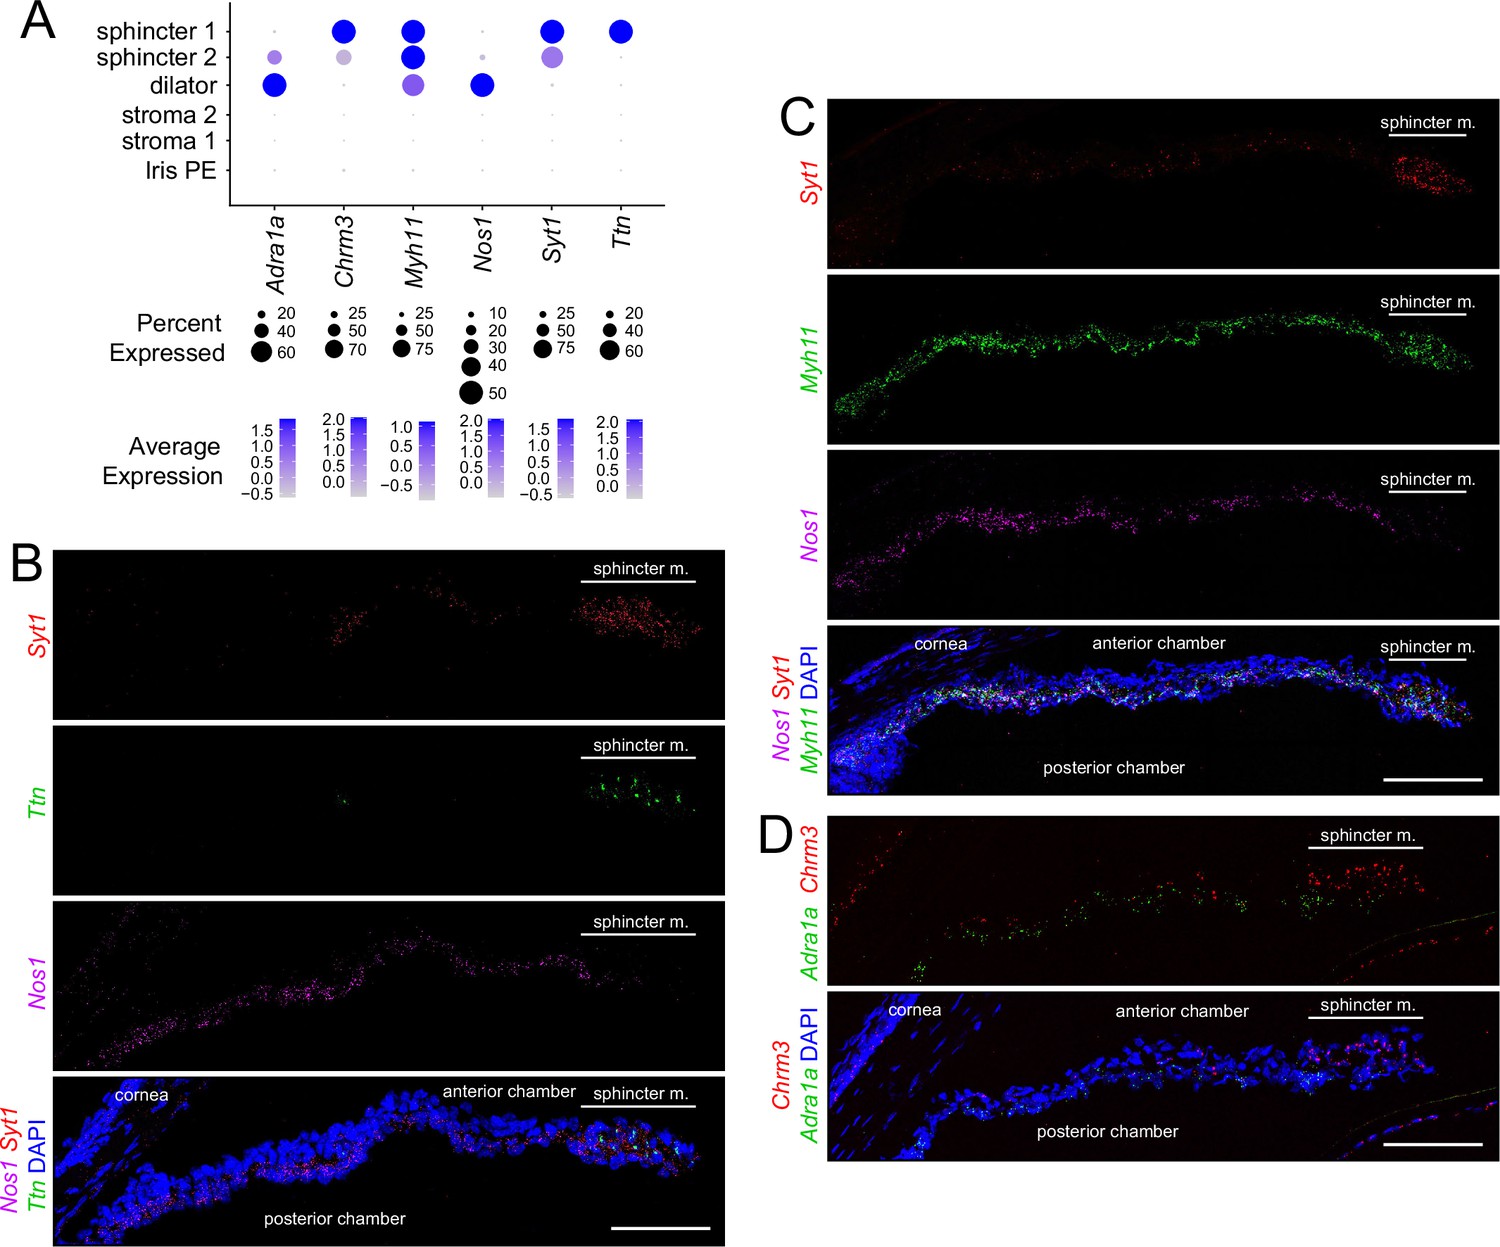
In situ hybridization for markers that distinguish sphincter and dilator muscles.
(A) Dot plot (as described in Figure 2A) showing transcript abundances across a subset of iris cell types for transcripts coding for markers shown in (B–D). (B–D) Cross sections of untreated iris hybridized with the indicated probes. All images are at the same magnification. For each in situ hybridization analysis in this and subsequent figures, iris cross sections were hybridized from at least three mice. Scale bars, 100 µm.
Figure 4

Immunostaining for iris epithelial markers.
(A) Dot plot (as described in Figure 2A) showing transcript abundances across a subset of iris cell types for the markers shown in (B–D). (B) Flat mounts of untreated iris immunostained as indicated. (C,D) Cross sections of untreated iris immunostained as indicated. OTX refers to an antibody that binds to both OTX1 and OTX2. Scale bars, 100 µm.
Figure 5 with 1 supplement

Immunostaining for stromal cell markers.
(A) Dot plot (as described in Figure 2A) showing transcript abundances across a subset of iris cell types for the markers shown in (B and C). (B) Flat mounts of untreated iris immunostained as indicated. (C) Cross sections of untreated iris immunostained as indicated. All images are at the same magnification. Scale bars, 100 µm.
Figure 5—figure supplement 1
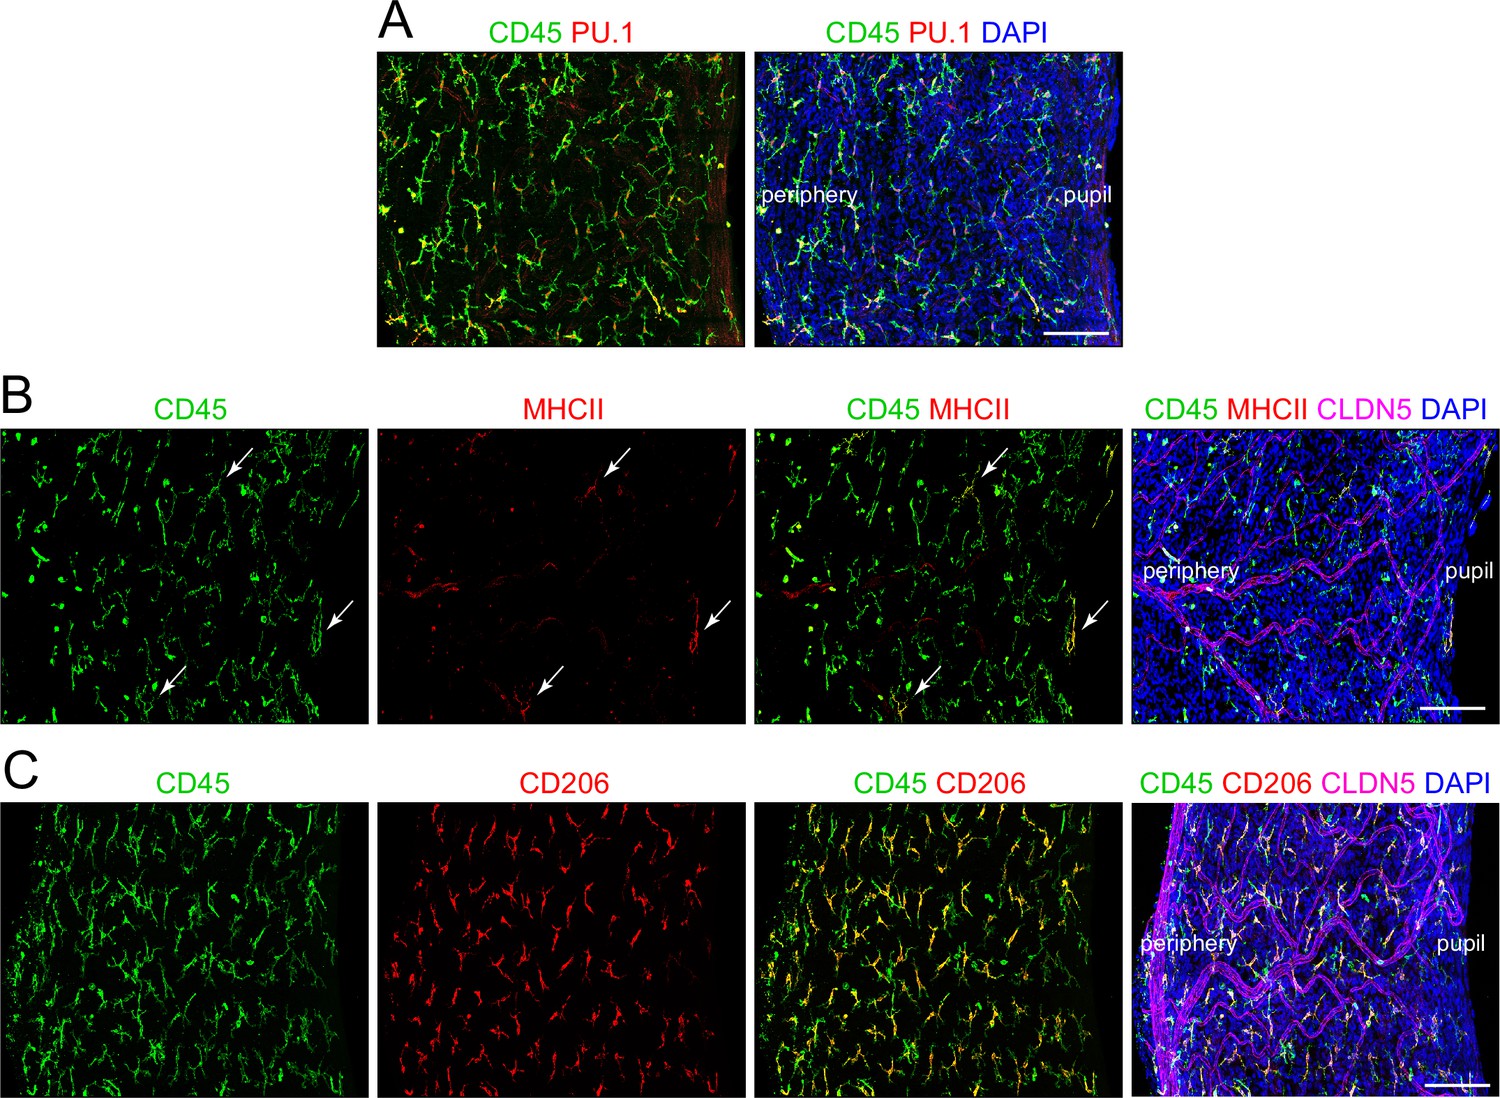
Immune cells in the iris.
Flat mount of the untreated iris immunostained for: (A) CD45 and PU.1, (B) CD45, MHC class II, and CLDN5, and (C) CD45, CD206, and CLDN5. In (B), three cells that are positive for both CD45 and MHC class II are indicated by white arrows. The markers and their specificities are as follows: CD45 (leukocytes), CD206 (M2 macrophages), CLDN5 (blood vessels), MHC class II antigens (I-A/I-E) (dendritic cells), PU.1 (macrophages, neutrophils, and myeloid dendritic cells). Scale bar, 100 µm.
Figure 6 with 2 supplements

Morphological and transcriptomic changes between dilated and constricted/untreated iris.
(A) Images of isolated eyes from mice with dilated pupils, constricted pupils, or no treatment. Red arrowheads mark the edge of the pupil. (B) Flat mounts of dilated and untreated irises showing the pattern of nerve fibers (left) and blood vessels (right). All images are at the same magnification and are oriented with the pupil to the right. Scale bars, 100 µm. (C) Scatter plots of single nucleus (sn)RNAseq read counts (log10 average normalized expression) and R2 values for pairwise comparisons of all transcripts for dilated vs. untreated (left) and constricted vs. untreated (right) irises for each of the major iris and ciliary body cell types. (D) Summary plot showing the difference in R2 values between the dilated vs. untreated scatter plot and the constricted vs. untreated scatter plot for each cell type.
Figure 6—figure supplement 1

Dot plot summary of transcriptome changes in dilated, constricted, and untreated irises.
Dot plots (as described in Figure 1F) for all of the major iris cell types showing a subset of the transcripts with the greatest abundance changes and an adjusted p-value less than 0.05, as determined from the volcano plots in Figure 6—figure supplement 2. The plots show the near identity between untreated and constricted conditions.
Figure 6—figure supplement 2
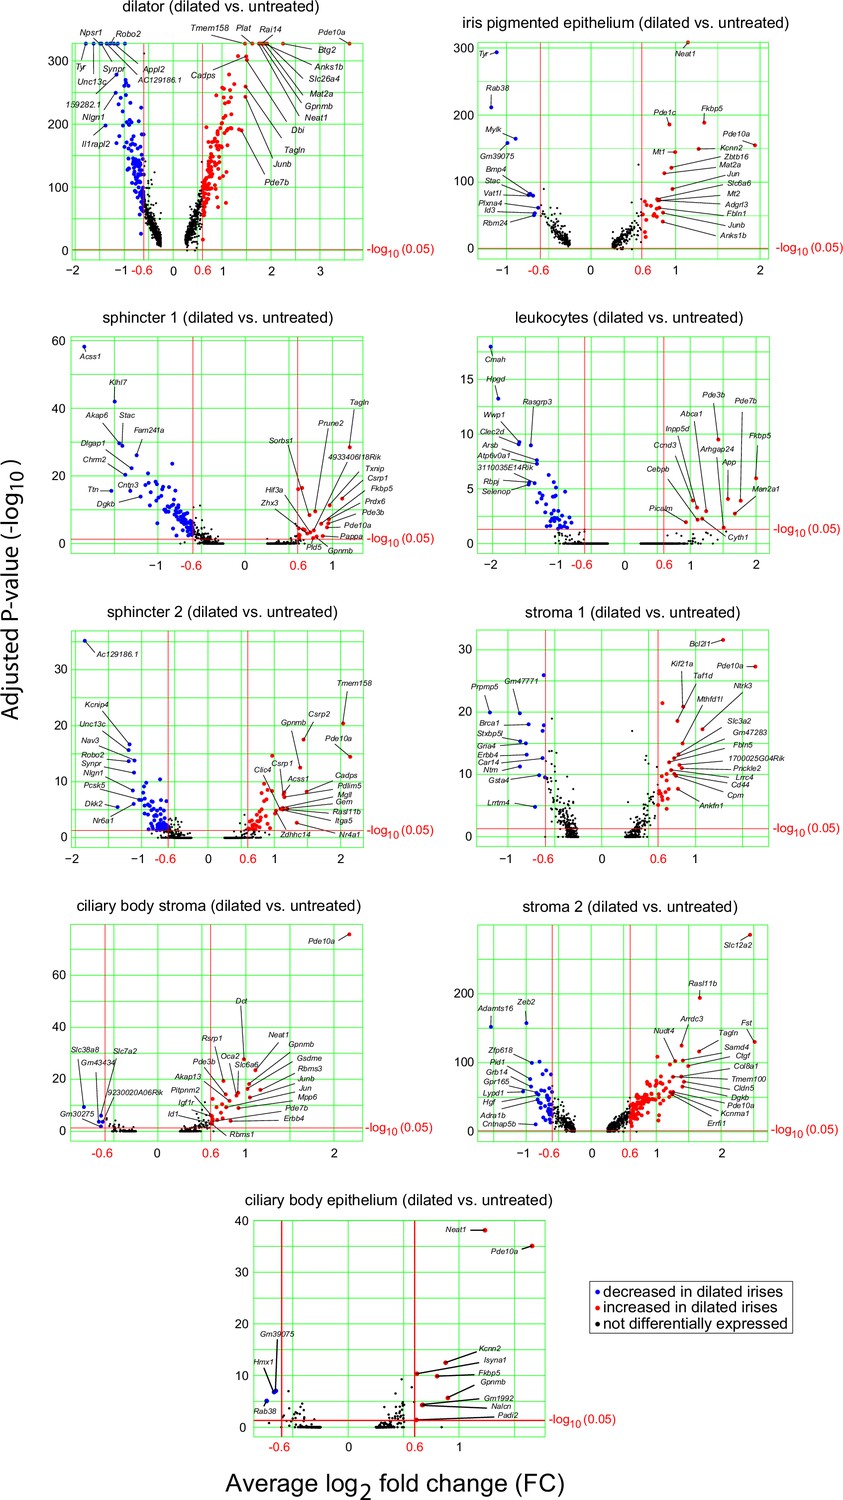
Volcano plots of single nuclues (sn)RNAseq read counts for dilated vs. untreated irises.
Increasing values on the horizontal axis represent higher expression in the dilated samples. Labeled points indicate the transcripts that were included in the dot plots in Figure 6—figure supplement 1. The threshold criteria for inclusion are log2-fold change greater than 0.6 or smaller than –0.6 and an adjusted p-value less than 0.05.
Figure 7 with 1 supplement
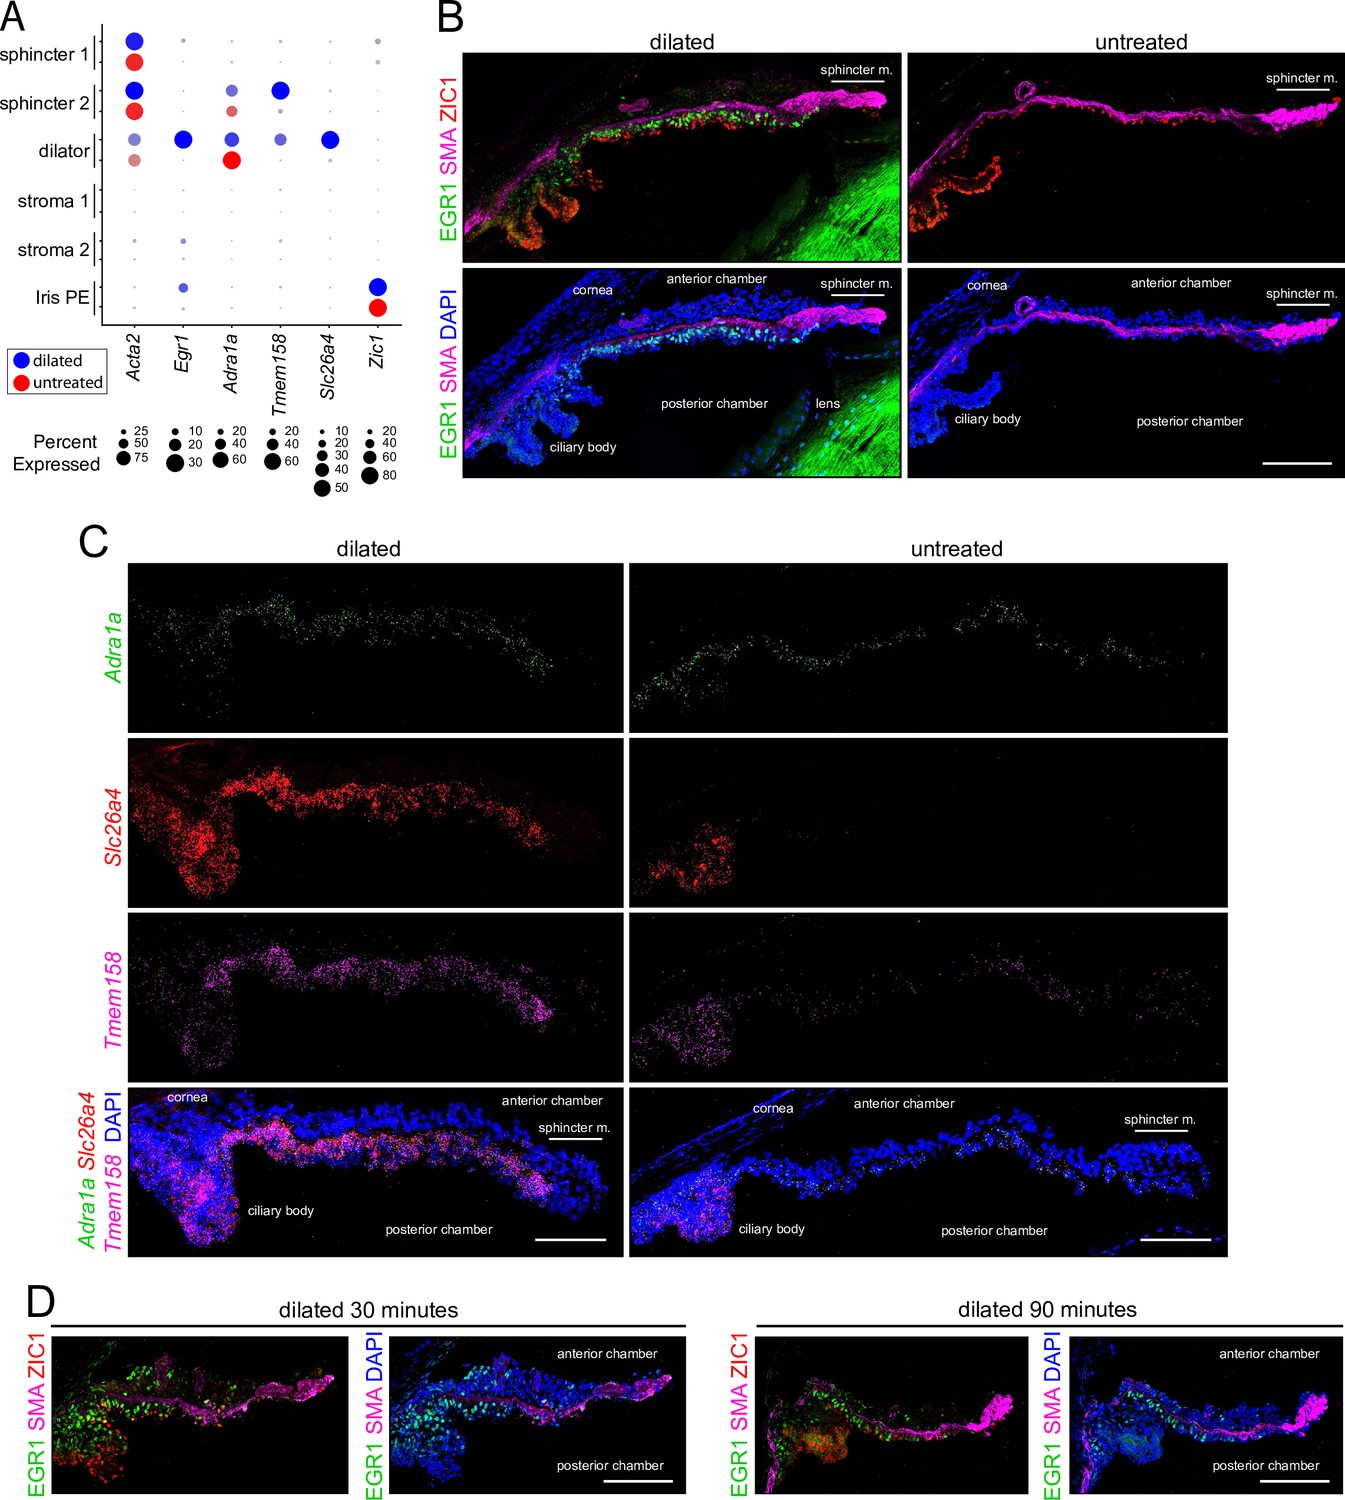
Immunostaining and in situ hybridization for markers that distinguish dilated vs.untreated irises.
(A) Dot plot (as described in Figure 2A) showing transcript abundances across a subset of iris cell types for the markers shown in (B and C). For each cell type, the symbols for the dilated iris (blue) are above the symbols for the untreated iris (red). (B) Cross sections of dilated (left) and untreated (right) irises immunostained as indicated. (C) Cross sections of dilated (left) and untreated (right) irises hybridized with the indicated probes. (D) Immunostaining of irises harvested 30 min (left) and 90 min (right) after the onset of dilation. All images are at the same magnification. Scale bars, 100 µm.
Figure 7—figure supplement 1
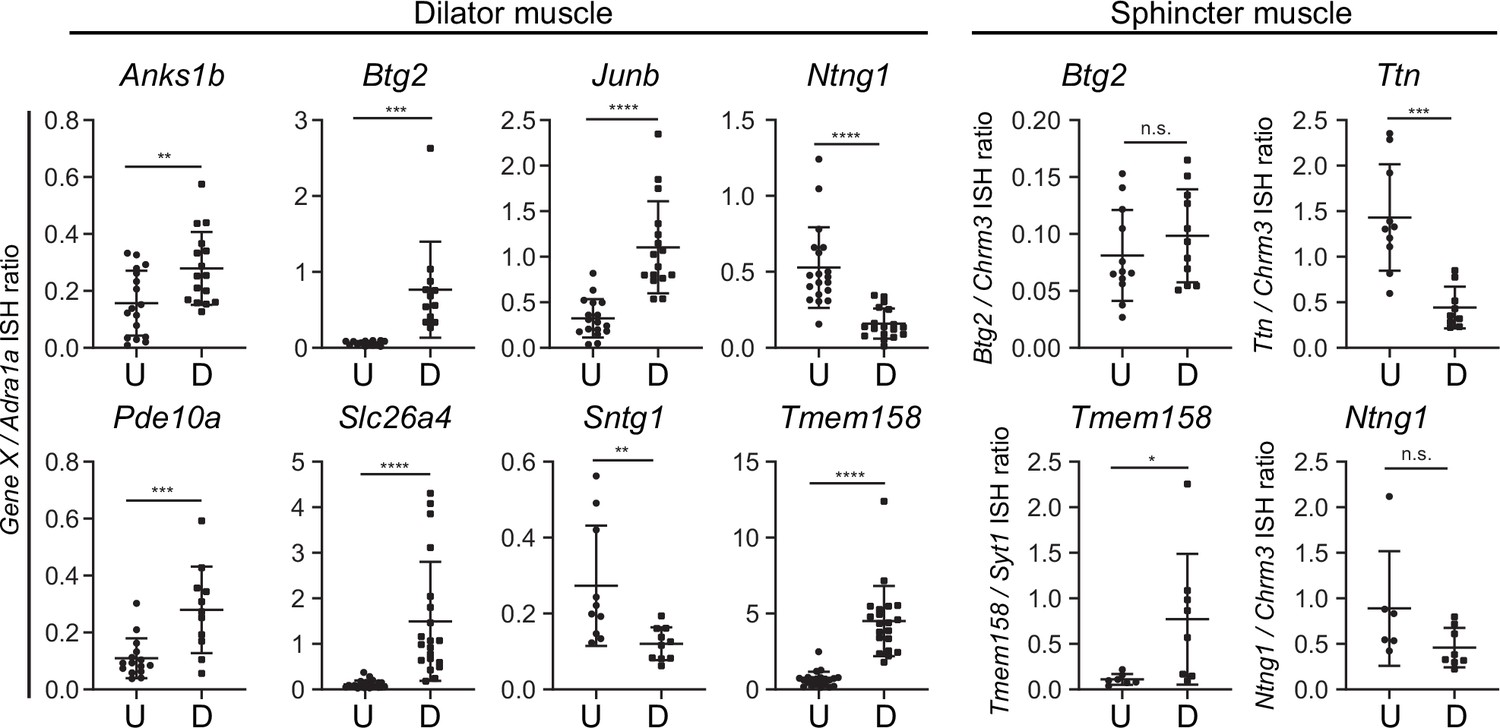
Quantification of in situ hybridization (ISH) signals in untreated vs. dilated irises.
For each image area quantified, the ratio of the ISH signal strength for the indicated gene to the ISH signal strength for Adrala was calculated. The regions of the iris that were quantified encompass either the dilator muscle (eight panels at left) or the sphincter muscle (four panels at right). Each data point is derived from a single image and represents approximately one-quarter of the iris cross-sectional area from pupil to periphery. For each condition and probe, three to four mice were analyzed. U, untreated. D, dilated. Bars, mean ± SD.
Figure 8 with 1 supplement
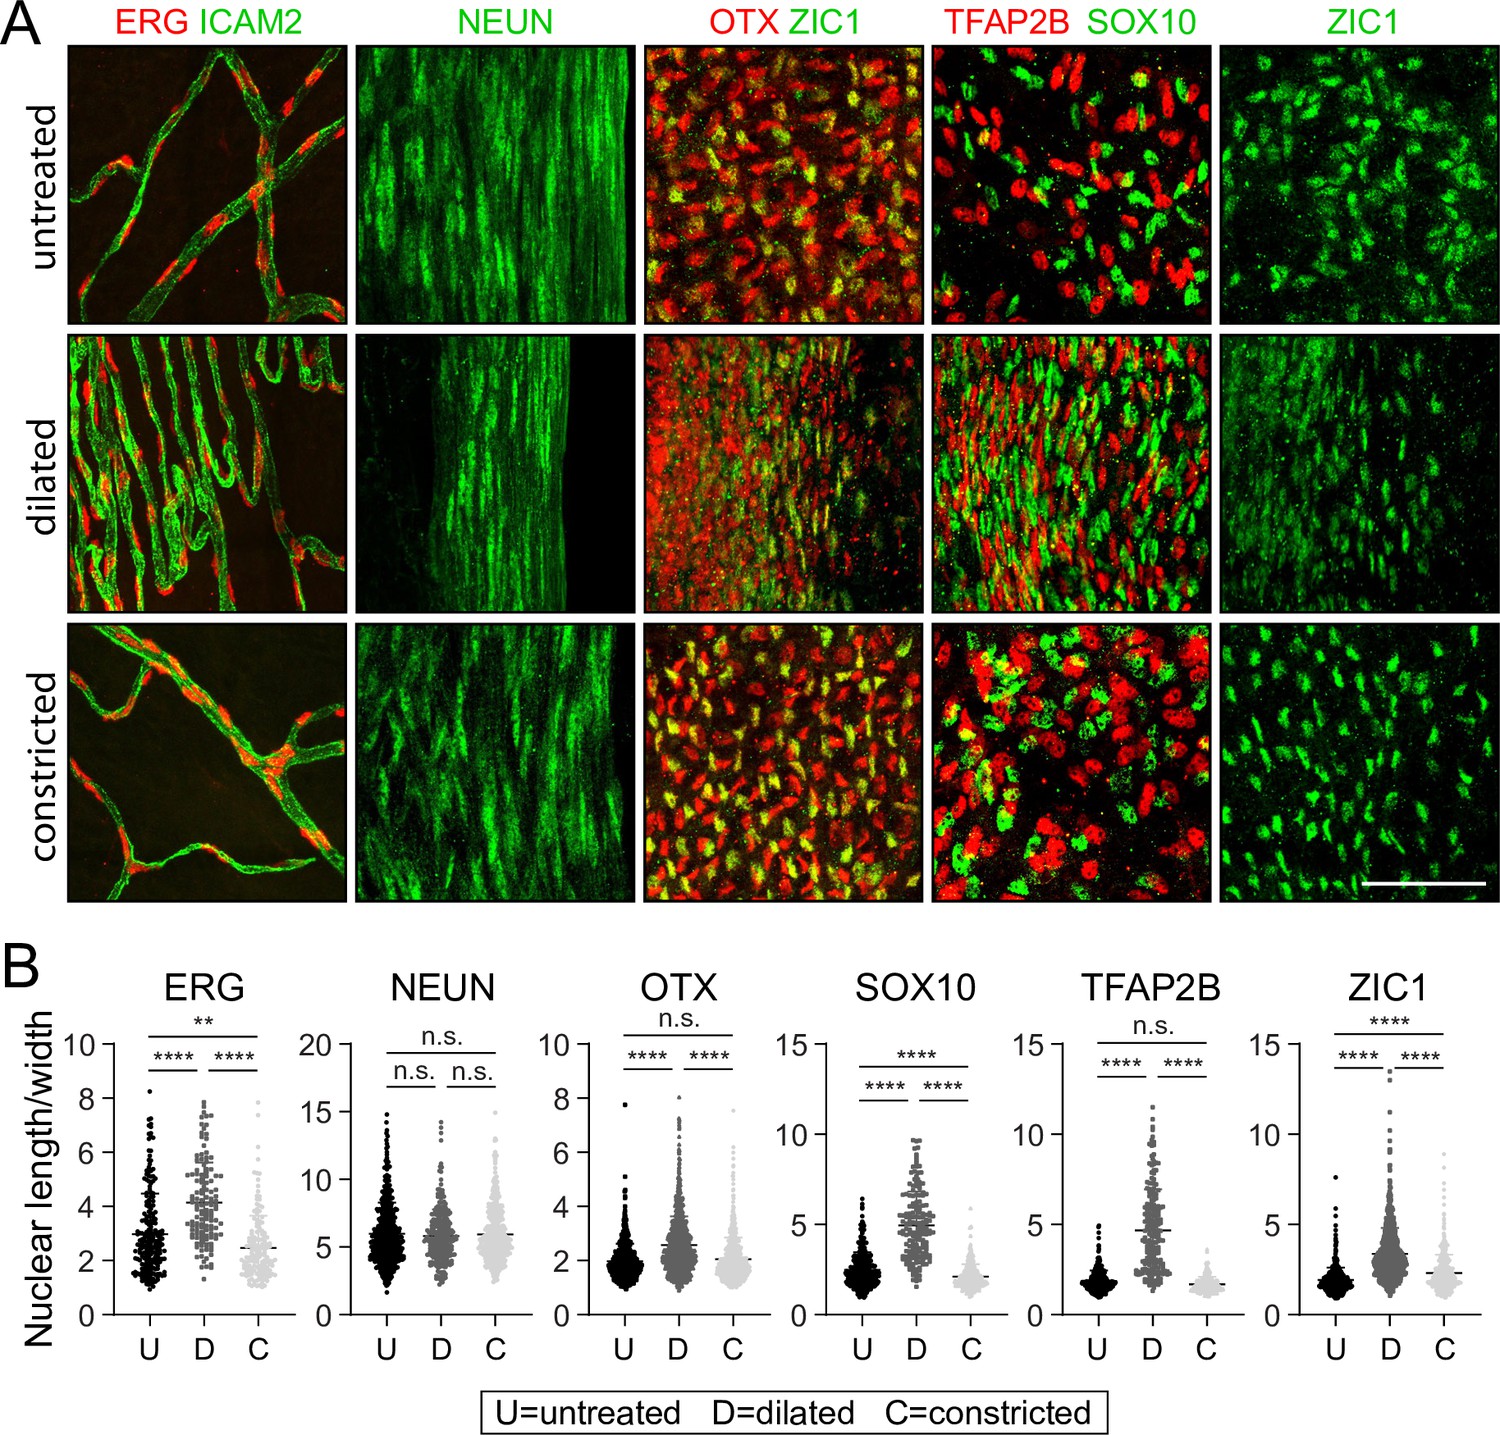
Changes in nuclear morphology in response to dilation or constriction for defined iris cell types.
(A) Flat mounts of untreated, dilated, or constricted irises, immunostained for the indicated nuclear markers. All images are at the same magnification. Scale bar, 50 µm. (B) Quantification of the length/width ratio for individual nuclei viewed in iris flat mounts. Cell types are defined by the indicated marker. For the OTX category, only OTX+ and ZIC1- cells from the OTX plus ZIC double-labeled images were scored. Each data point is an individual nucleus. The data for each condition in each plot are derived from three mice. **p < 0.01; ****p < 0.0001; n.s., not significant. Bars, mean ± SD.
Figure 8—figure supplement 1

Quantification of the length/width ratio for individual nuclei viewed in iris flat mounts.
The data are the same as in Figure 8, except that each plot in this figure shows the data for an individual mouse. The distribution of nuclear length/width ratios for individual mice are consistent within each of the three conditions (constructed, dilated, and untreated) and are also consistent with the aggregate data presented in Figure 8. Bars, mean ± SD.
Figure 9 with 1 supplement
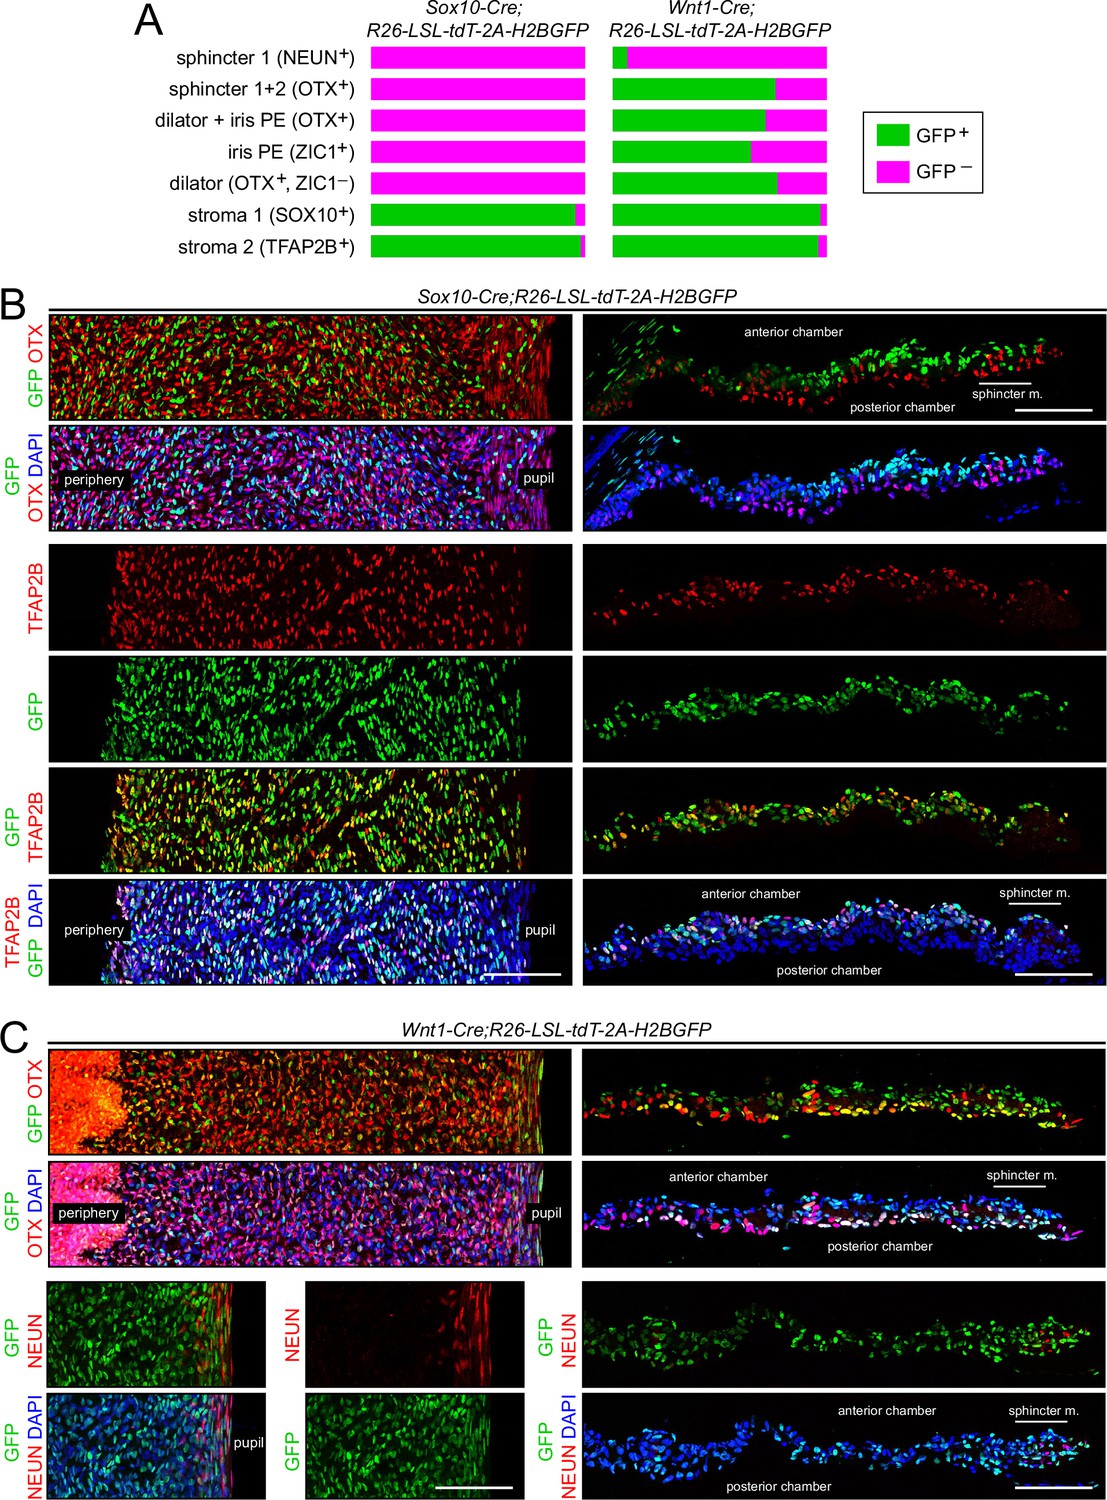
Lineage tracing of adult iris cell types with Sox10-Cre and Wnt1-Cre.
(A) Bar graphs showing the fraction of cells that express nuclear-localized H2B-GFP, indicating excision of the LoxP-stop-LoxP cassette from the Cre reporter R26-LSL-tdT-2A-H2BGFP. Iris cell types were identified by immunostaining for the nuclear-localized markers listed. The intensities of GFP and the cell type markers vary among nuclei. A nucleus was considered to exhibit co-localization if both signals were present, regardless of intensity. For sphincter muscle, the number of cells scored for each Cre driver ranged from 120 to 140. For each of the other cell types, the number of cells scored for each Cre driver ranged from 960 to 2300. (B) Iris flat mounts (left) and cross sections (right) from Sox10-Cre;R26-LSL-tdT-2A-H2BGFP mice showing mutually exclusive localization of GFP and OTX1 +2 (‘OTX’) (upper panels) and partial co-localization of GFP and TFAP2B (lower panels). (C) Iris flat mounts (left) and cross sections (right) from Wnt1-Cre;R26-LSL-tdT-2A-H2BGFP mice showing partial co-localization of GFP and TFAP2B (upper panels) and minimal co-localization of GFP and NeuN (lower panels). All images are at the same magnification. Scale bars, 100 µm.
Figure 9—figure supplement 1
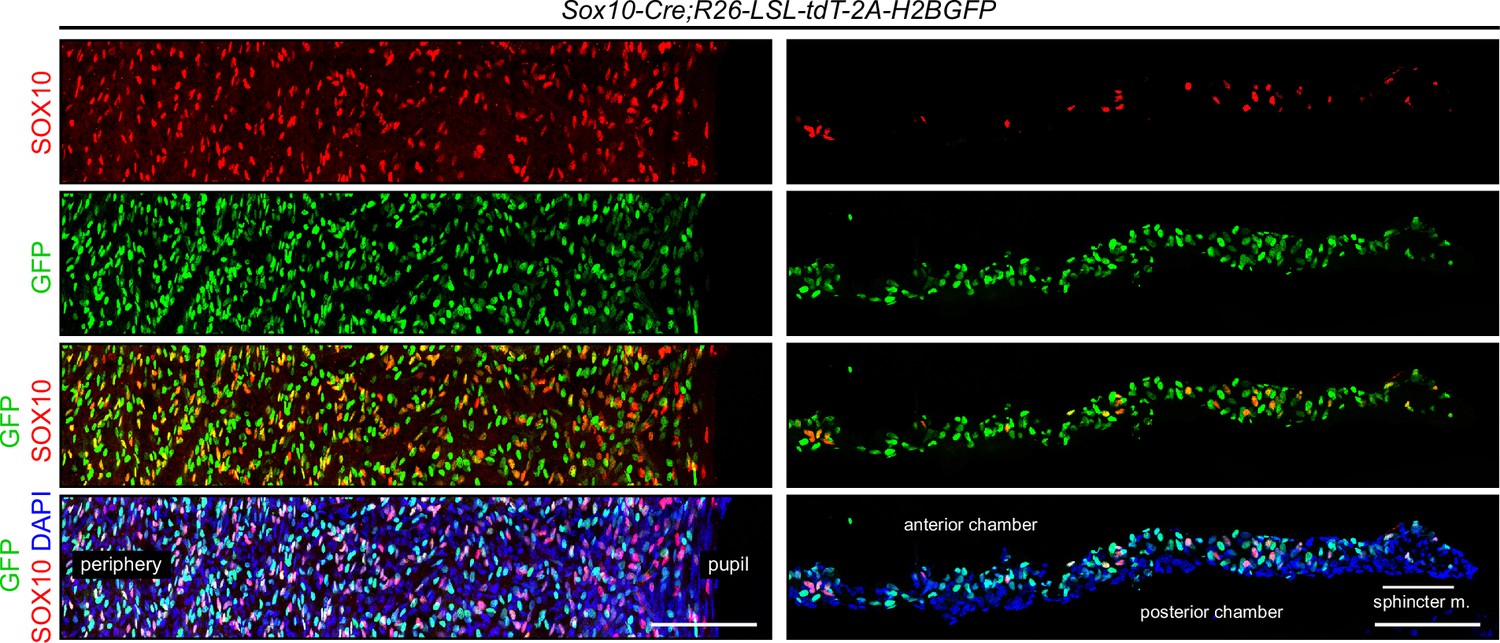
Lineage tracing of stroma 1 cells with Sox10-Cre;R26-LSL-tdT-2A-H2BGFP.
Iris flat mounts (left) and cross sections (right) showing that stroma 1 cells, visualized by immunostaining for SOX10, exhibit partial co-localization with H2B-GFP, as described in the legend of Figure 9. All images are at the same magnification. Scale bars, 100 µm.
Additional files
-
Supplementary file 1
Single nucleus (sn)RNAseq library statistics.
- https://cdn.elifesciences.org/articles/73477/elife-73477-supp1-v1.docx
-
Supplementary file 2
The top 20 enriched transcripts for each iris and ciliary body cell type.
FC, fold change (Excel File).
- https://cdn.elifesciences.org/articles/73477/elife-73477-supp2-v1.xlsx
-
Supplementary file 3
Transcripts showing the greatest fold change with dilation for each iris and ciliary body cell type.
For each cell type, the table includes the 25 transcripts that showed the greatest fold increase and the 25 transcripts that showed the greatest fold decrease. FC, fold change (Excel File).
- https://cdn.elifesciences.org/articles/73477/elife-73477-supp3-v1.xlsx
-
Transparent reporting form
- https://cdn.elifesciences.org/articles/73477/elife-73477-transrepform1-v1.pdf
Download links
A two-part list of links to download the article, or parts of the article, in various formats.
Downloads (link to download the article as PDF)
Open citations (links to open the citations from this article in various online reference manager services)
Cite this article (links to download the citations from this article in formats compatible with various reference manager tools)
A transcriptome atlas of the mouse iris at single-cell resolution defines cell types and the genomic response to pupil dilation
eLife 10:e73477.
https://doi.org/10.7554/eLife.73477


