Comprehensive characterization of the antibody responses to SARS-CoV-2 Spike protein finds additional vaccine-induced epitopes beyond those for mild infection
- Division of Human Biology, Fred Hutchinson Cancer Research Center, United States
- Division of Public Health Sciences, Fred Hutchinson Cancer Research Center, United States
- Department of Medicine, University of Washington, United States
- Computational Biology Program, Fred Hutchinson Cancer Research Center, United States
Figures
Figure 1
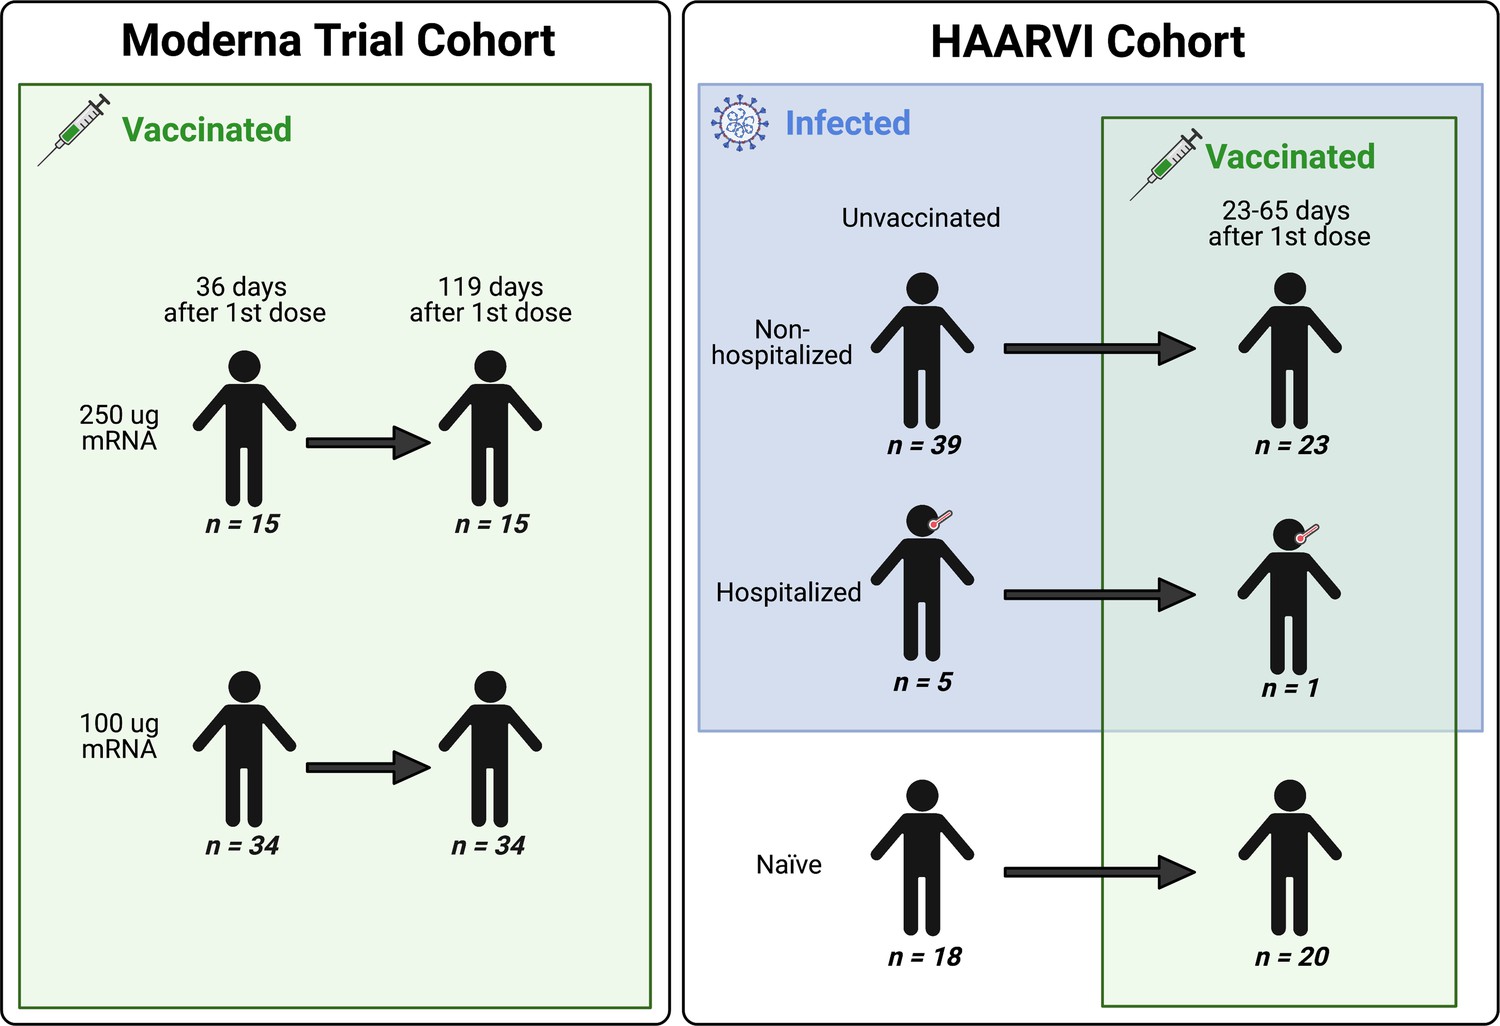
A schematic of sample cohorts.
Characteristics of individual participants sampled as part of the Moderna Trial Cohort (left) or the Hospitalized or Ambulatory Adults with Respiratory Viral Infections (HAARVI) Cohort (right). Sample sizes of unique individuals in each group are designated below each figure.
Figure 2 with 1 supplement
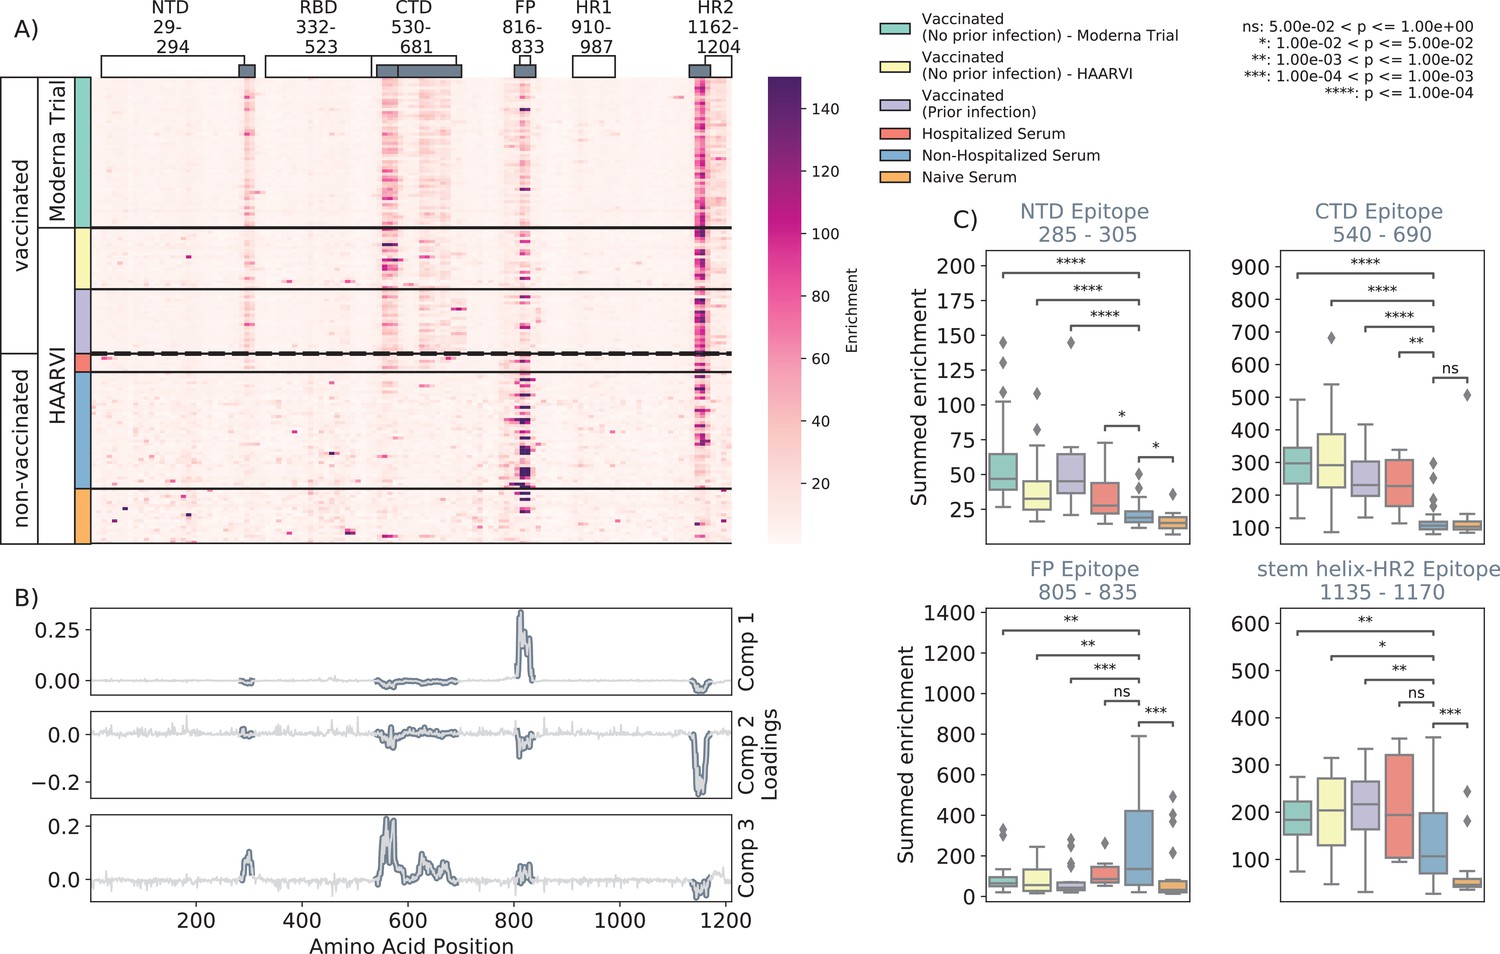
Enrichment of wild-type peptides by serum antibodies.
(A) Heatmap with a sample in each row and groups of samples colored on the left. Columns represent peptide locations, with each square on the heatmap indicating the summed enrichment value within a 10-peptide interval. Darker purple indicates higher enrichment values, and values above 150 were capped. Transparent boxes above the heatmap annotate the Spike protein domains, while the smaller gray boxes indicate epitope binding regions defined in this analysis (B) The loading vectors from the principal component analysis with the four epitope sites highlighted; enrichments in each of these regions are summed together for subsequent analysis. (C) Boxplots describing the distribution of summed wild-type enrichment values for each sample within each of the four epitope sites, each named according to its associated protein domain. Color indicates the sample group. The bars between boxplots give statistical significance (p-value) tests using a Mann–Whitney–Wilcoxon test. All sample group comparisons with the nonhospitalized infected group were performed, and only significant values are shown.
Figure 2—figure supplement 1
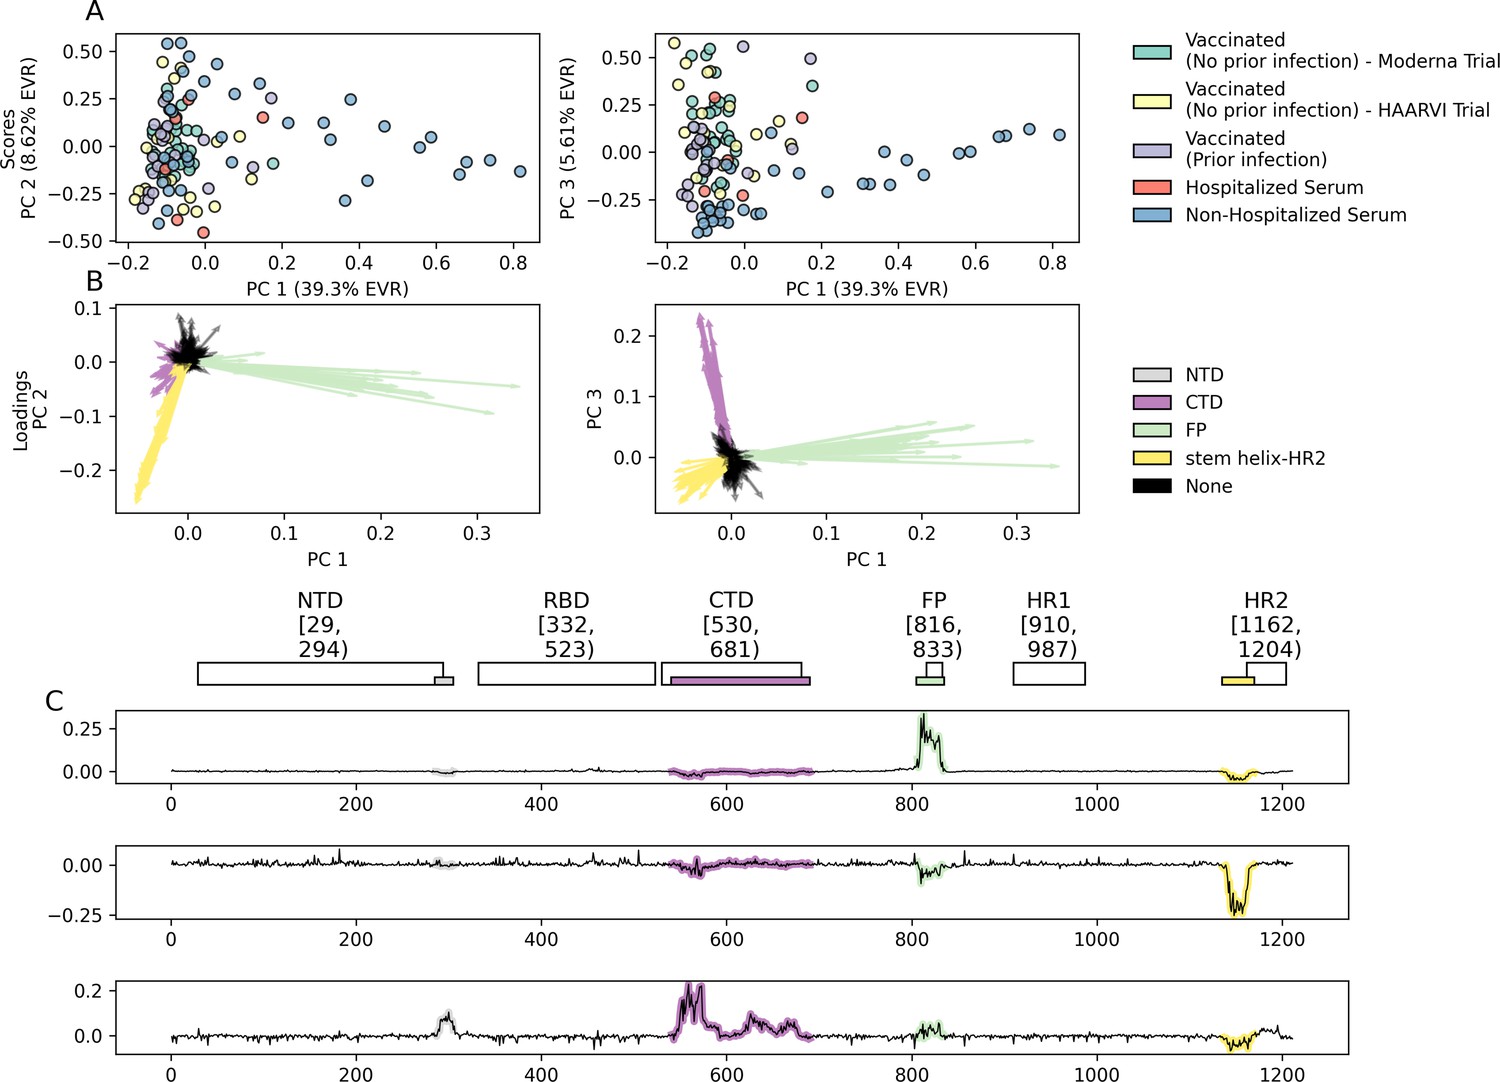
Principal component analysis on wild-type enrichment features of all samples.
(A) Scatterplot depicting the unit scaled sample ‘scores’ represented by the columns to visualize sample relationship in principal component space. Colors represent the group that each sample belongs to. (B) Vector plots showing the component loadings, scaled by the square root of the respective eigenvalues in the eigendecomposition. Colors represent the genomic location of each component loading score. (C) Line plots showing the first three principal axes/directions in feature space, plotted as a function of the wild-type peptide feature location on Spike.
Figure 3 with 1 supplement
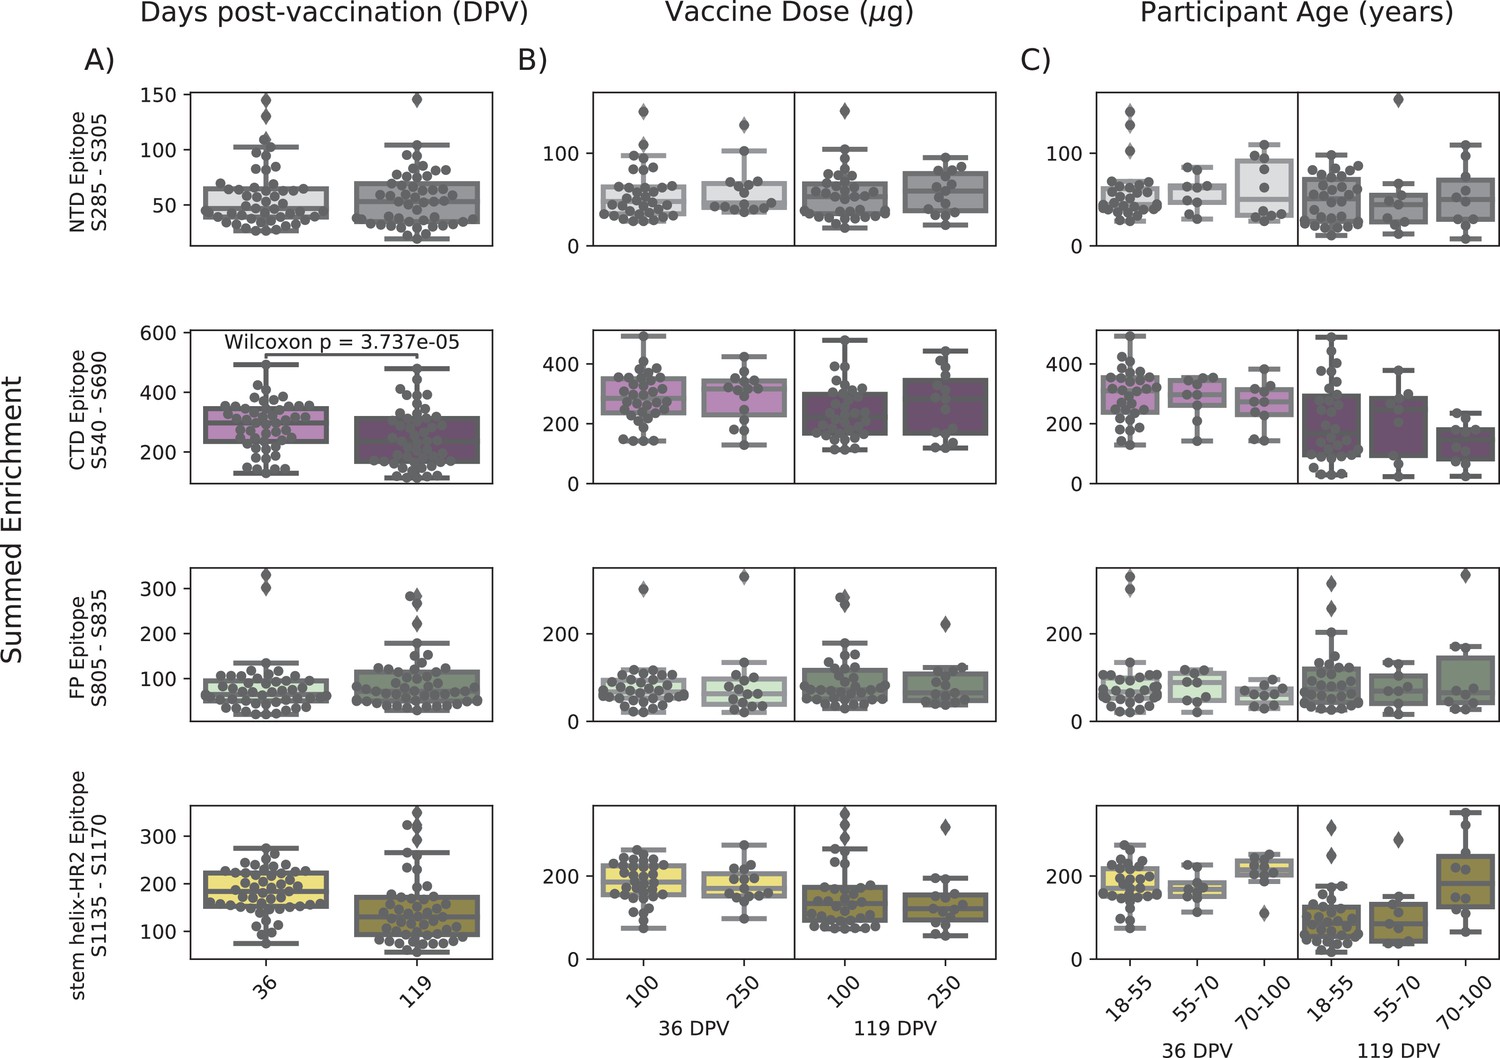
Comparison of epitope binding for NIH Moderna Trial subgroups.
Boxplots of summed wild-type enrichment within epitope binding regions for samples grouped by (A) timepoint post vaccination, (B) vaccine dose, or (C) participant age. Samples were taken either at 36 (n = 64) or 119 (n = 64) days post vaccination. (B) and (C) are additionally separated by timepoint post vaccination. Results of a Wilcoxon rank-sum test between the groups appear only where p<0.05 after Bonferroni multiple testing correction (36 group comparisons). Figures containing all p-values for both replicate batches are available at https://github.com/matsengrp/phage-dms-vacc-analysis (swh:1:rev:d4c770ad49ed2f8ab31e499265dd02273cff6f86, Matsen, 2022).
Figure 3—figure supplement 1
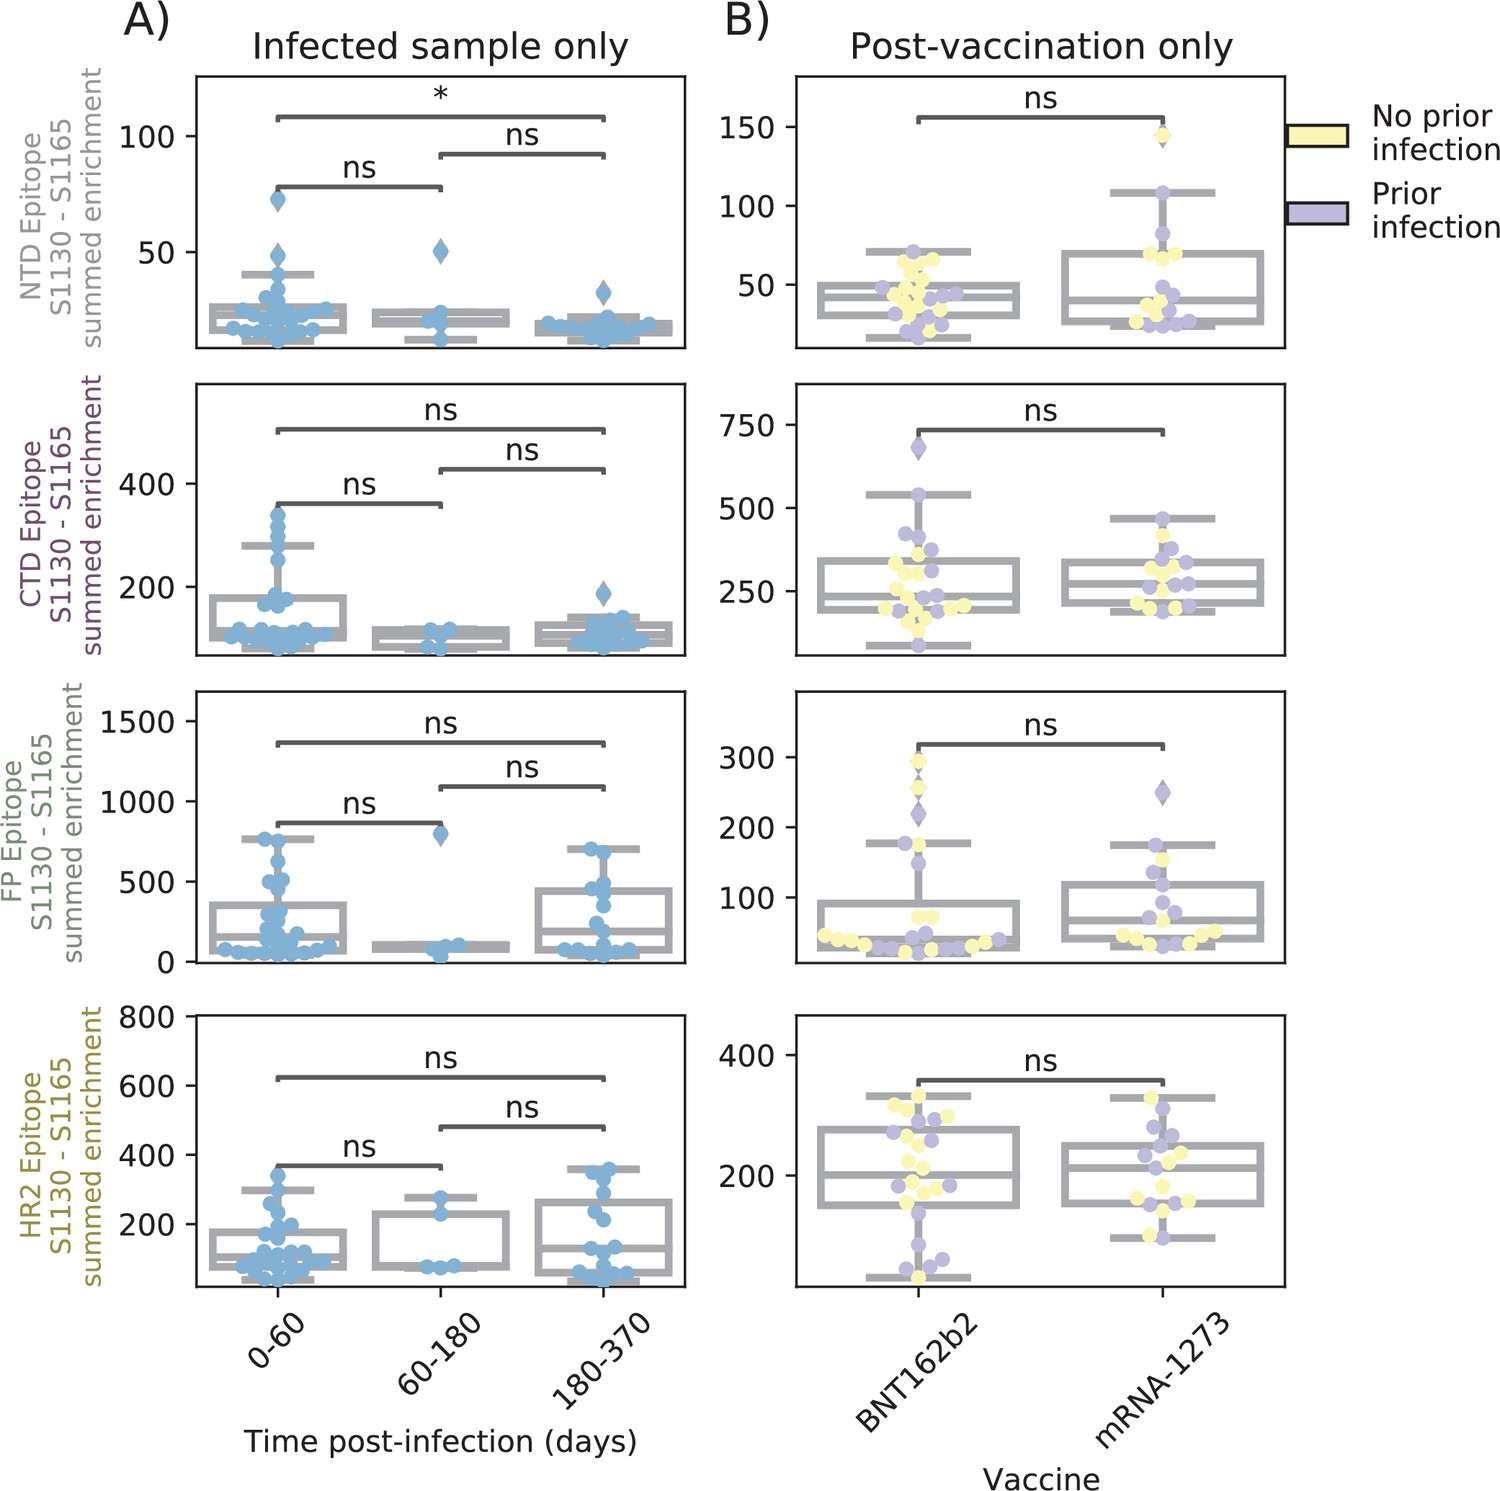
Comparison of epitope binding for Hospitalized or Ambulatory Adults with Respiratory Viral Infections (HAARVI) subgroups.
Boxplots of summed wild-type enrichment within epitope binding regions for samples grouped by (A) timepoint post symptom onset or (B) vaccine type (Pfizer/BioNTech BNT162b2 or Moderna mRNA-1273). Results of a Mann–Whitney test between the groups are shown. p-Values were adjusted for multiple testing using Bonferroni correction. *p<0.05, ns, not significant.
Figure 4 with 1 supplement
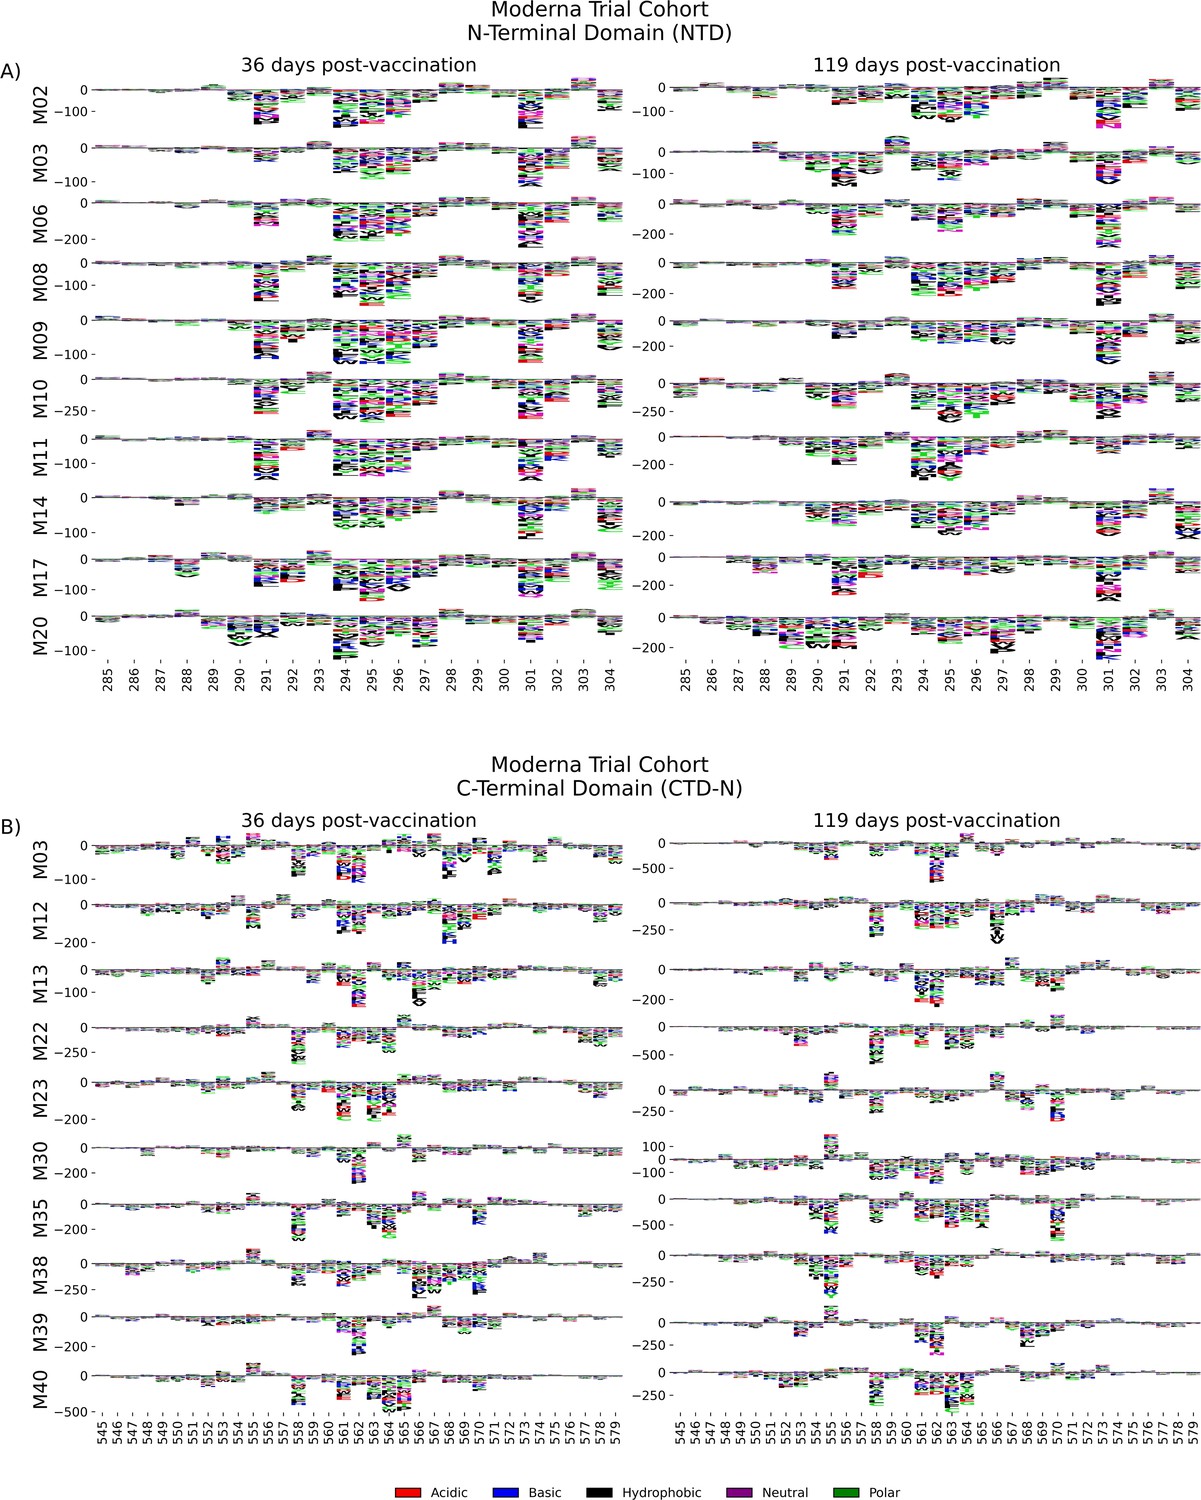
NTD and CTD-N epitope escape profiles.
(A, B) Logo plots depicting the effect of mutations on epitope binding in either the NTD (A) or CTD-N (B) epitope for paired samples from the Moderna Trial Cohort. The height of the letters corresponds to the magnitude of the effect of that mutation on epitope binding, that is, its scaled differential selection value. Letters below zero indicate mutations that cause poorer antibody binding as compared to wild-type peptide, and letters above zero indicate mutations that bind better than the wild-type peptide. Letter colors denote the chemical property of the amino acids. Logo plots on the left and right are paired samples from the same individual, with the participant ID noted on the left.
Figure 4—figure supplement 1
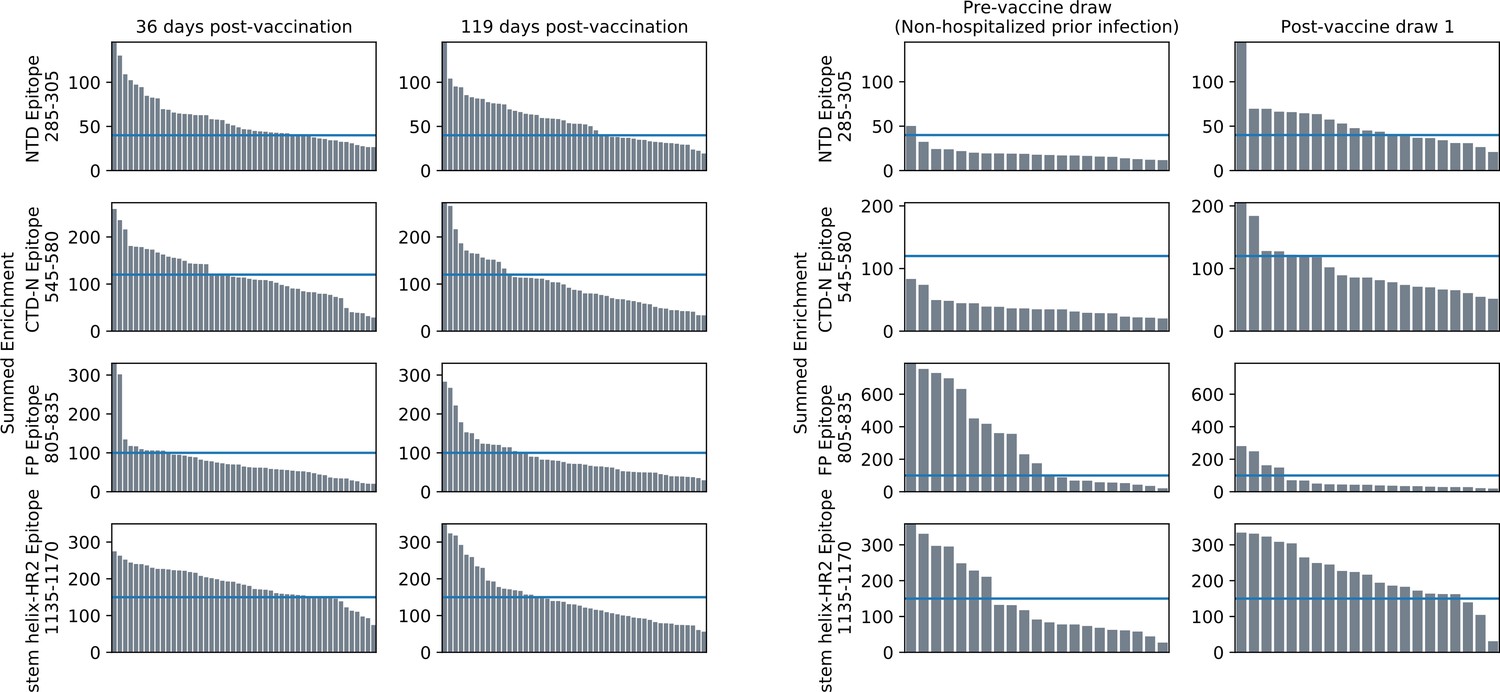
Thresholding of total epitope binding within major epitope regions.
Histogram showing the summed enrichment values within each epitope region for every sample in the Moderna Trial Cohort (left two panels) or Hospitalized or Ambulatory Adults with Respiratory Viral Infections (HAARVI) Cohort (right two panels). Blue line delineates the threshold chosen for each epitope region. Samples above the line were included in the escape profile analyses.
Figure 5
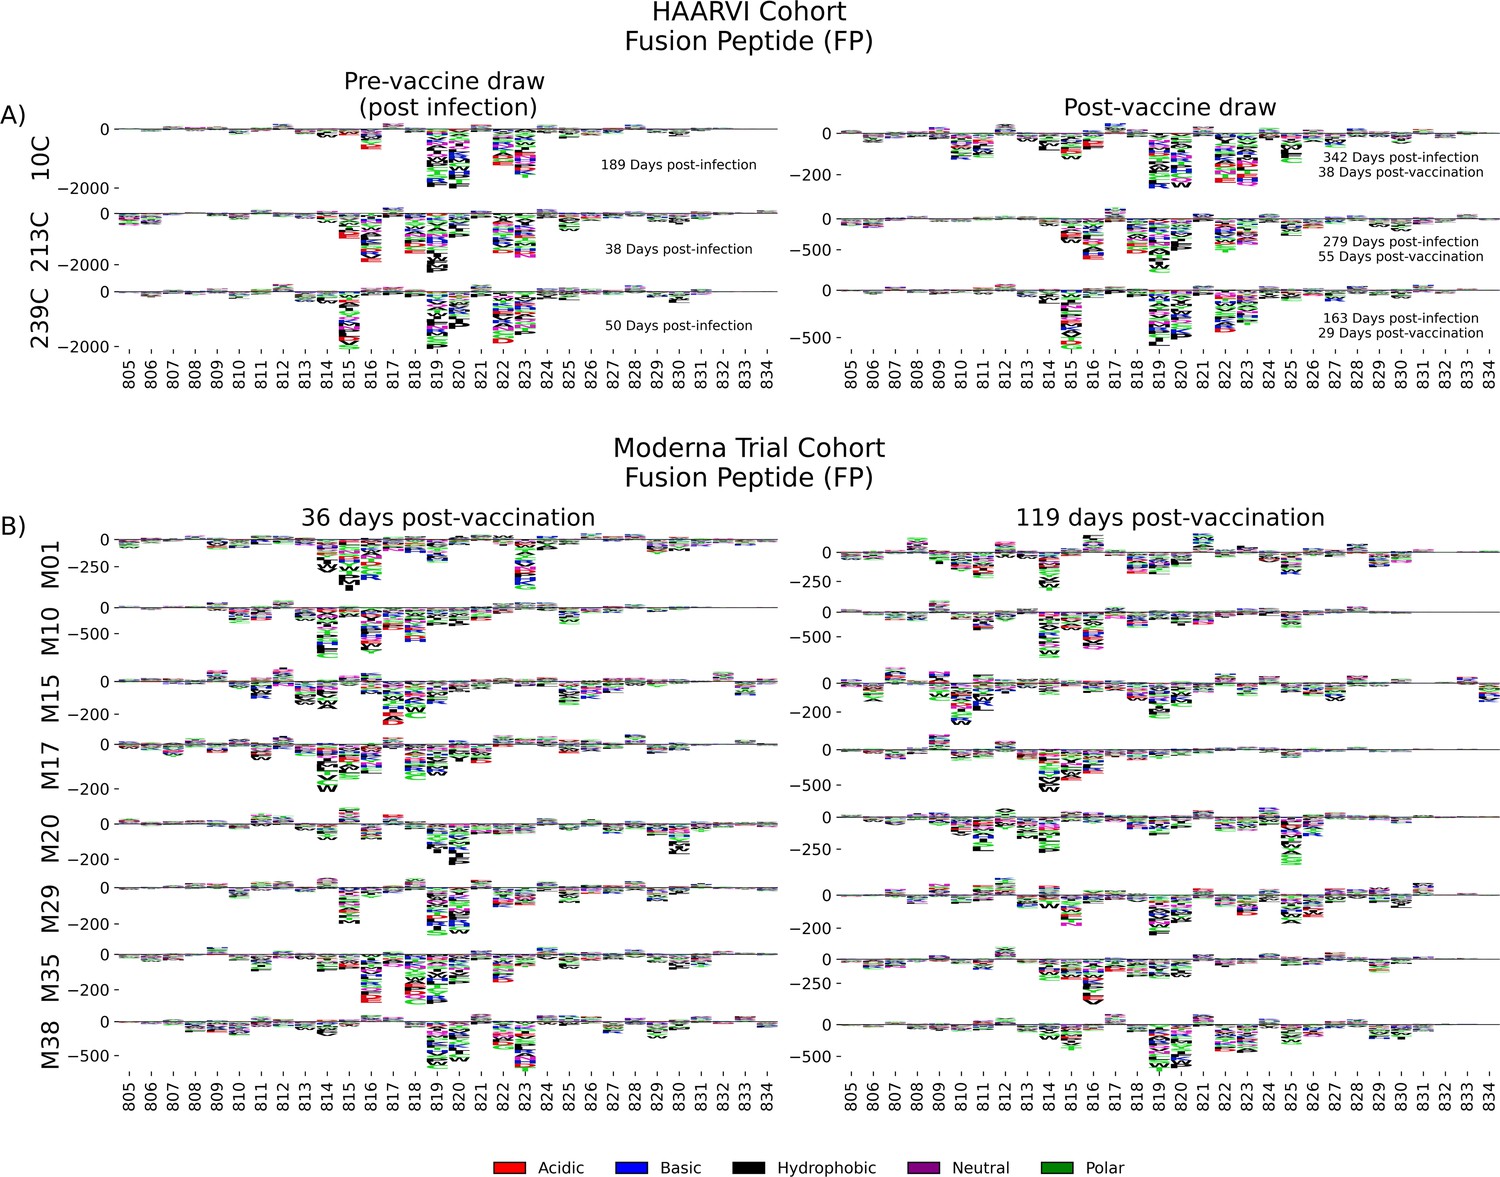
Fusion peptide (FP) epitope escape profiles.
(A, B) Logo plots depicting the effect of mutations on epitope binding within the FP epitope region for paired samples from the (A) Hospitalized or Ambulatory Adults with Respiratory Viral Infections (HAARVI) Cohort or (B) Moderna Trial Cohort. Details are as described in Figure 4.
Figure 6

SH-H epitope escape profiles.
(A, B) Logo plots depicting the effect of mutations on epitope binding within the SH-H epitope region for paired samples from the (A) Hospitalized or Ambulatory Adults with Respiratory Viral Infections (HAARVI) Cohort or (B) Moderna Trial Cohort. Details are as described in Figure 4.
Tables
Key resources table
| Reagent type (species) or resource | Designation | Source or reference | Identifiers | Additional information |
|---|---|---|---|---|
| Other | Protein A Dynabeads | Invitrogen | 10001D | |
| Other | Protein G Dynabeads | Invitrogen | 10003D | |
| Commercial assay or kit | Q5 High-Fidelity 2X Master Mix | NEB | M0492L | |
| Commercial assay or kit | AMPure XP beads | Beckman Coulter | A63881 | |
| Commercial assay or kit | Quant-iT PicoGreen dsDNA Assay Kit | Invitrogen | P11496 | |
| Commercial assay or kit | KAPA Library Quantification Kit | Roche | KK4824 |
Additional files
-
Transparent reporting form
- https://cdn.elifesciences.org/articles/73490/elife-73490-transrepform1-v2.docx
-
Supplementary file 1
Cohort information.
- https://cdn.elifesciences.org/articles/73490/elife-73490-supp1-v2.xlsx
Download links
A two-part list of links to download the article, or parts of the article, in various formats.
Downloads (link to download the article as PDF)
Open citations (links to open the citations from this article in various online reference manager services)
Cite this article (links to download the citations from this article in formats compatible with various reference manager tools)
Comprehensive characterization of the antibody responses to SARS-CoV-2 Spike protein finds additional vaccine-induced epitopes beyond those for mild infection
eLife 11:e73490.
https://doi.org/10.7554/eLife.73490


