Impact of long- and short-range fibre depletion on the cognitive deficits of fronto-temporal dementia
- Translational Neuroimaging Laboratory, The McGill University Research Centre for Studies in Aging, Canada
- Douglas Hospital Research Centre, McGill University, Canada
- Department of Psychiatry and Neurology, University of Pittsburgh, United States
- Developmental Imaging, Murdoch Children's Research Institute, Australia
- Montreal Neurological Institute, McGill University, Canada
- Department of Neurology and Neurosurgery, McGill University, Canada
- Department of Psychiatry, McGill University, Canada
Figures
Figure 1
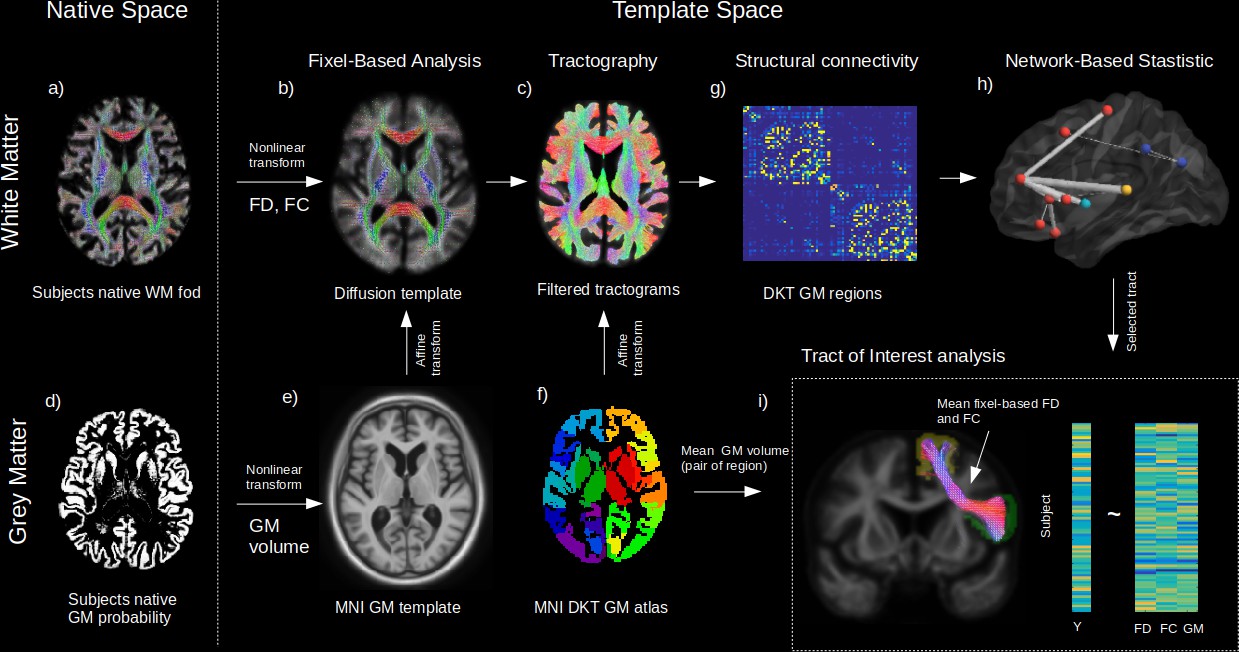
Method workflow.
The main steps of the methods are shown from the native space (left) to template space (right). For the white matter (WM) (upper panels), native diffusion-weighted MRIs were first preprocessed to obtain individual normalized WM FODs (a). WM FODs were non-linearly registered to a study-specific WM FOD template (b), to obtain the fibre density (FD), and fibre cross-section metrics (FC), later used in whole brain fixel-based analysis. The template space WM FODs were then used to generate individual probabilistic tractograms (c). For the grey matter (GM) (lower panels), native space GM probability maps were warped to a study specific GM template in MNI space to obtain individual template space GM volume (e). An affine transform was estimated between MNI template and the diffusion template space which was subsequently applied to the Desikan-Killiany (DKT) GM atlas to bring the DKT atlas in diffusion space (f). Individual structural connectivity matrices were then obtained by counting the amount of fibres connecting each pair of GM regions within the DKT atlas (g). Significant difference in connectivity for a given dependant variable (Y) was then tested using the network-based statistic enhanced (h). Significant predictors (connections) were selected to access the relative importance of GM volume and WM (FD and FC) within each connection in predicting Y (h), where mean FD and FC were obtained in fixels belonging to the connection streamlines and GM was the average of both GM regions volume for each subject.
Figure 2
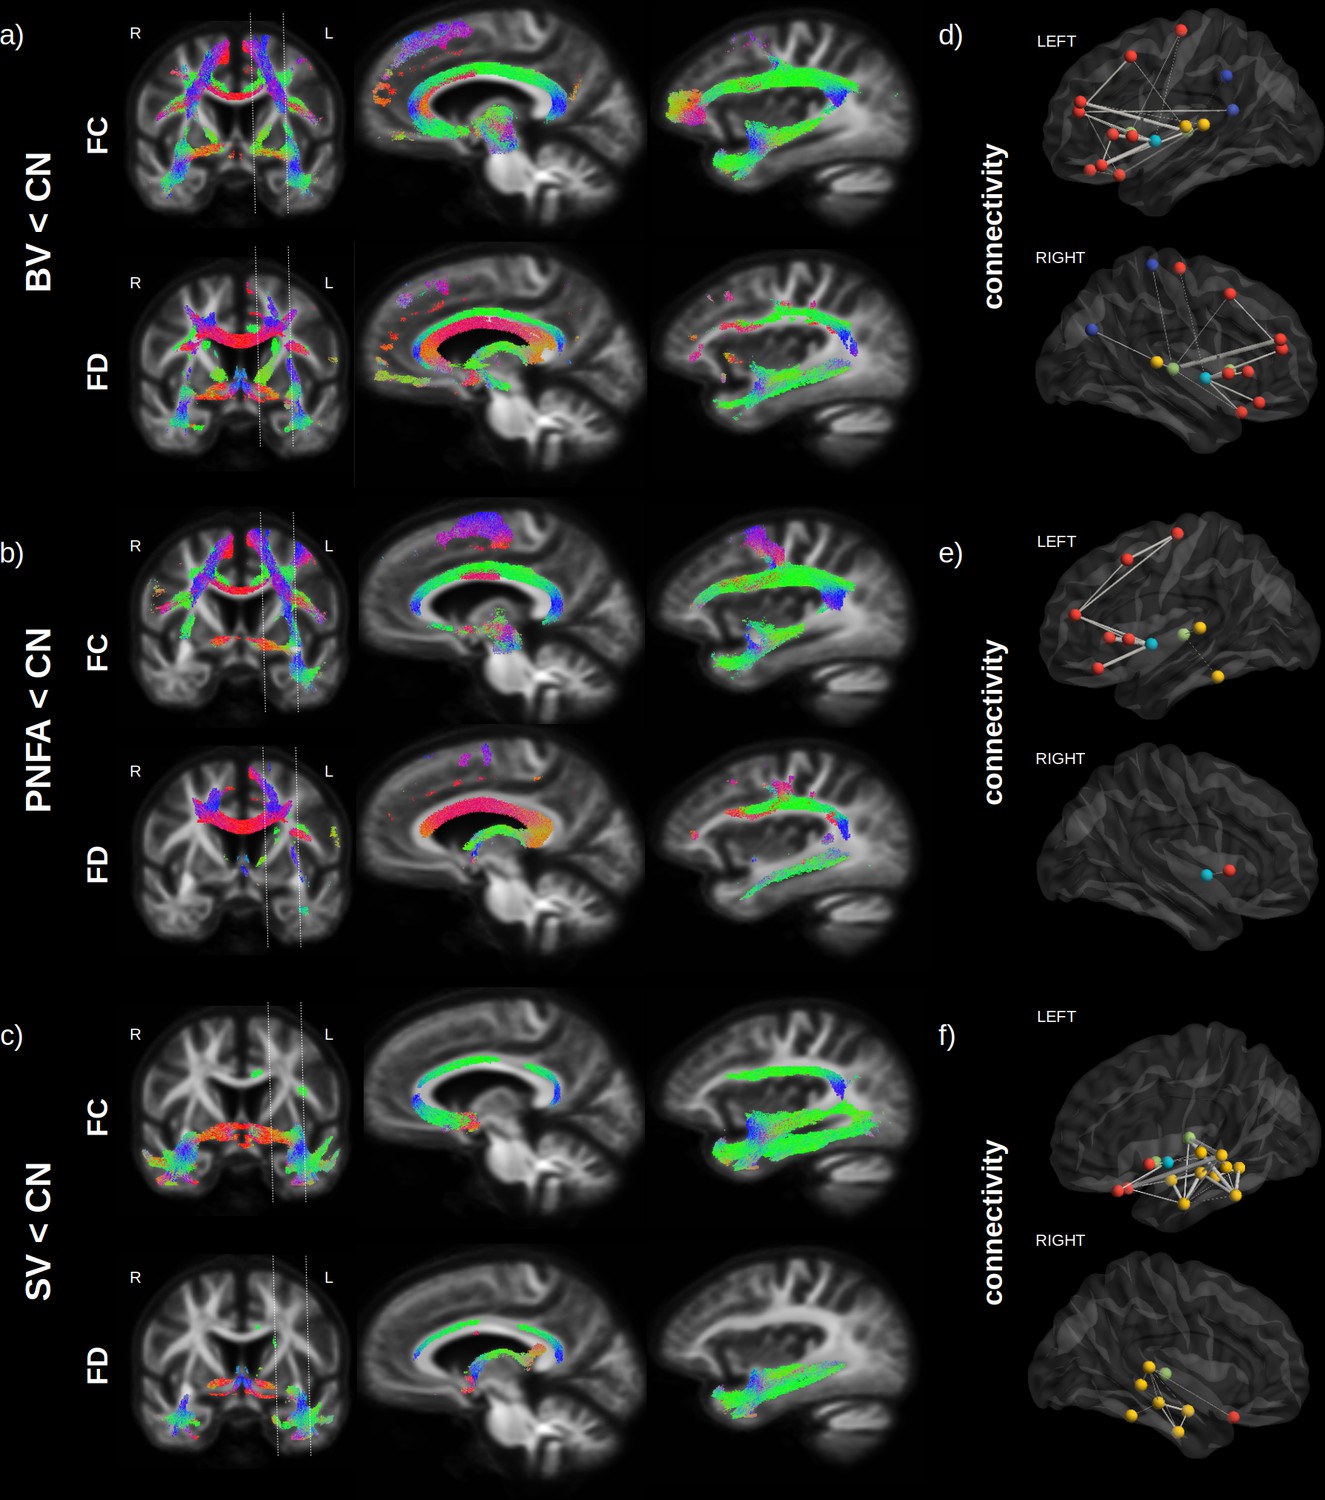
Fibre loss in fronto-temporal dementia (FTD) variants.
Streamlines (colour coded by direction) associated to significantly reduced fibre cross-section (FC) and fibre density (FD) (FWE-corrected p-value) are shown for behavioural variants (BV) vs. normal elderly control (CN) (a), progressive non-fluent aphasia (PNFA) vs. CN (b) and semantic variant (SV) vs. CN (c). Associated structural connectivity reduction (FWE-corrected p-value < 0.001) is shown in panels (d–f) for the ipsilateral left (upper panel) and right (lower panel) hemisphere, where frontal regions are shown in red, the insula in light blue, the temporal lobe in yellow, subcortical regions in green, and parietal regions in dark blue. The line thickness corresponds to the statistical strength of the effect. Red = left-right, green = front back, blue = top down.
Figure 3
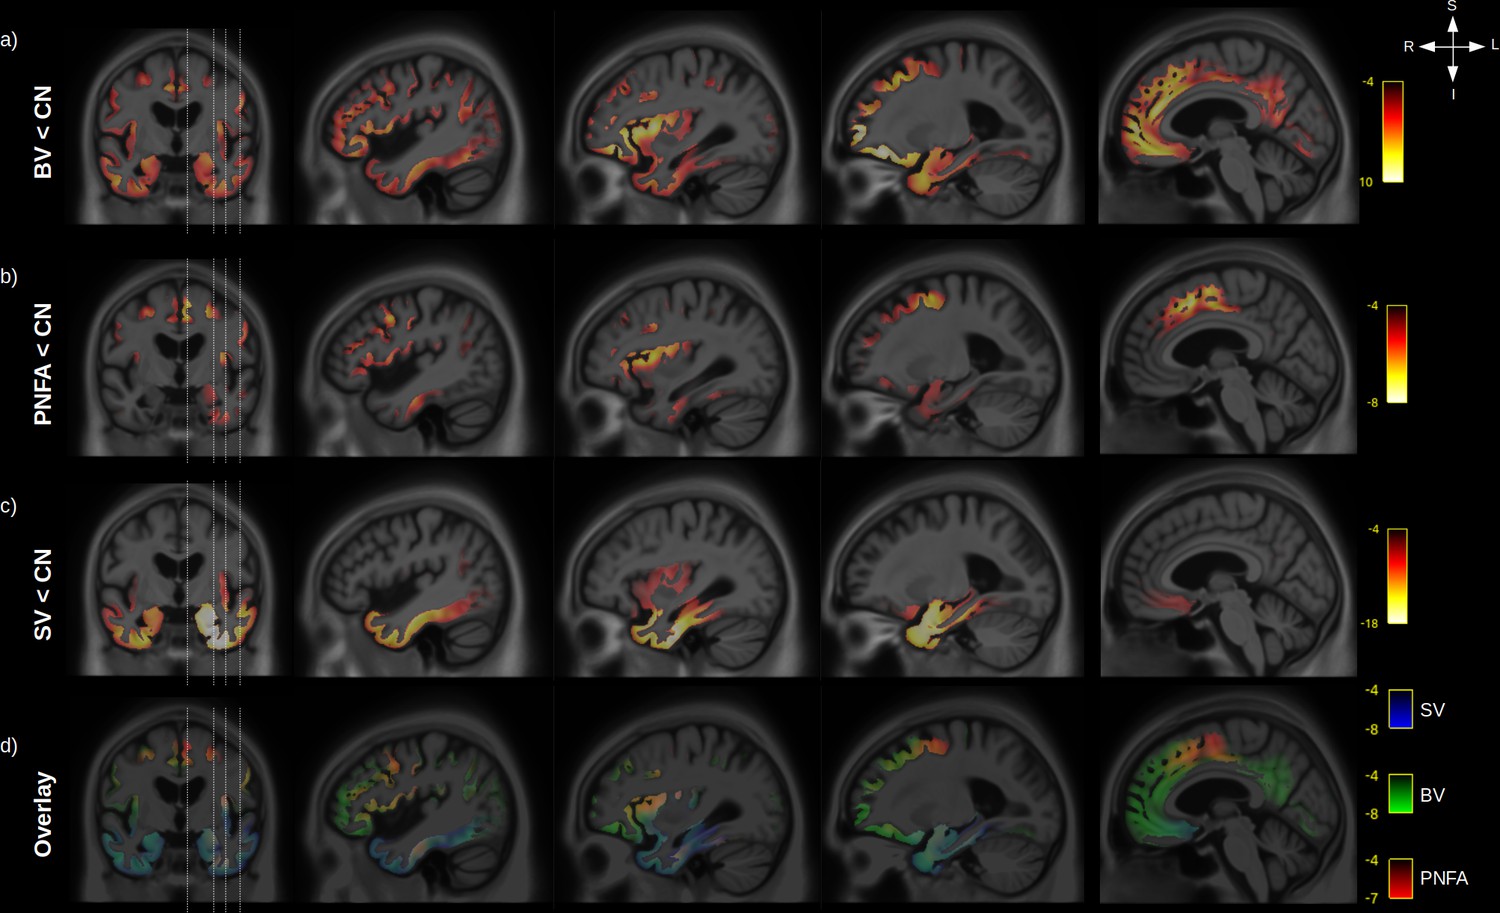
Grey-matter (GM) atrophy in fronto-temporal dementia (FTD) variants.
Significant (RFT p-value < 0.05) GM volume decrease is shown for behavioural variants (BV) vs. normal elderly control (CN) (a), progressive non-fluent aphasia (PNFA) vs. CN (b) and semantic variant (SV) vs. CN (c). Legend are showing the magnitude of the voxelwise T values. An overlay of the statistical maps (d) is shown for BV (green), SV (blue), and PNFA (red), with associated T values colour bars.
Figure 4
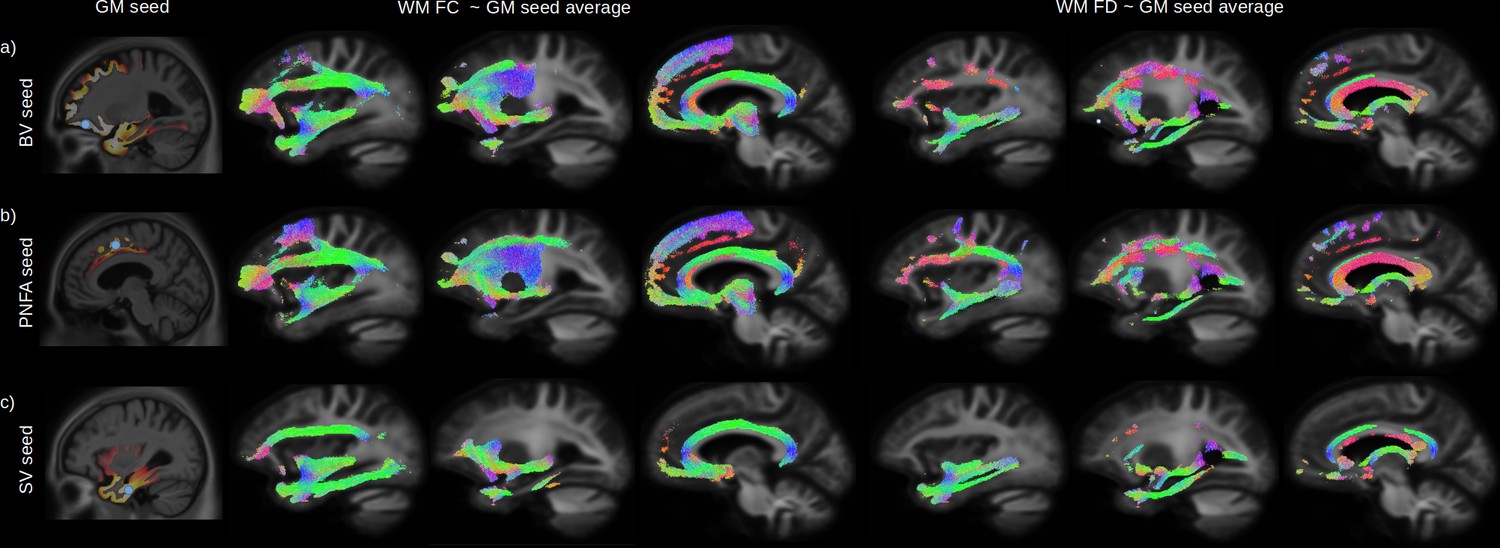
Relationship between grey-matter (GM) atrophy and white-matter (WM) microstructural impairment.
The peak of the maximum GM atrophy for each variant (behavioural variant [BV], progressive non-fluent aphasia [PNFA], and semantic variant [SV]) was used as a seed (a-c left panels, blue dot) to investigate the relationship between GM and whole brain WM fibre cross section (FC) and fibre density (FD) across all participants. Streamlines associated with significant relationships (FWE-corrected p-value < 0.05) between the average GM volume of each seeds are shown for FC (middle panels) and FD (right panels). Streamlines are colour coded by direction.
Figure 5
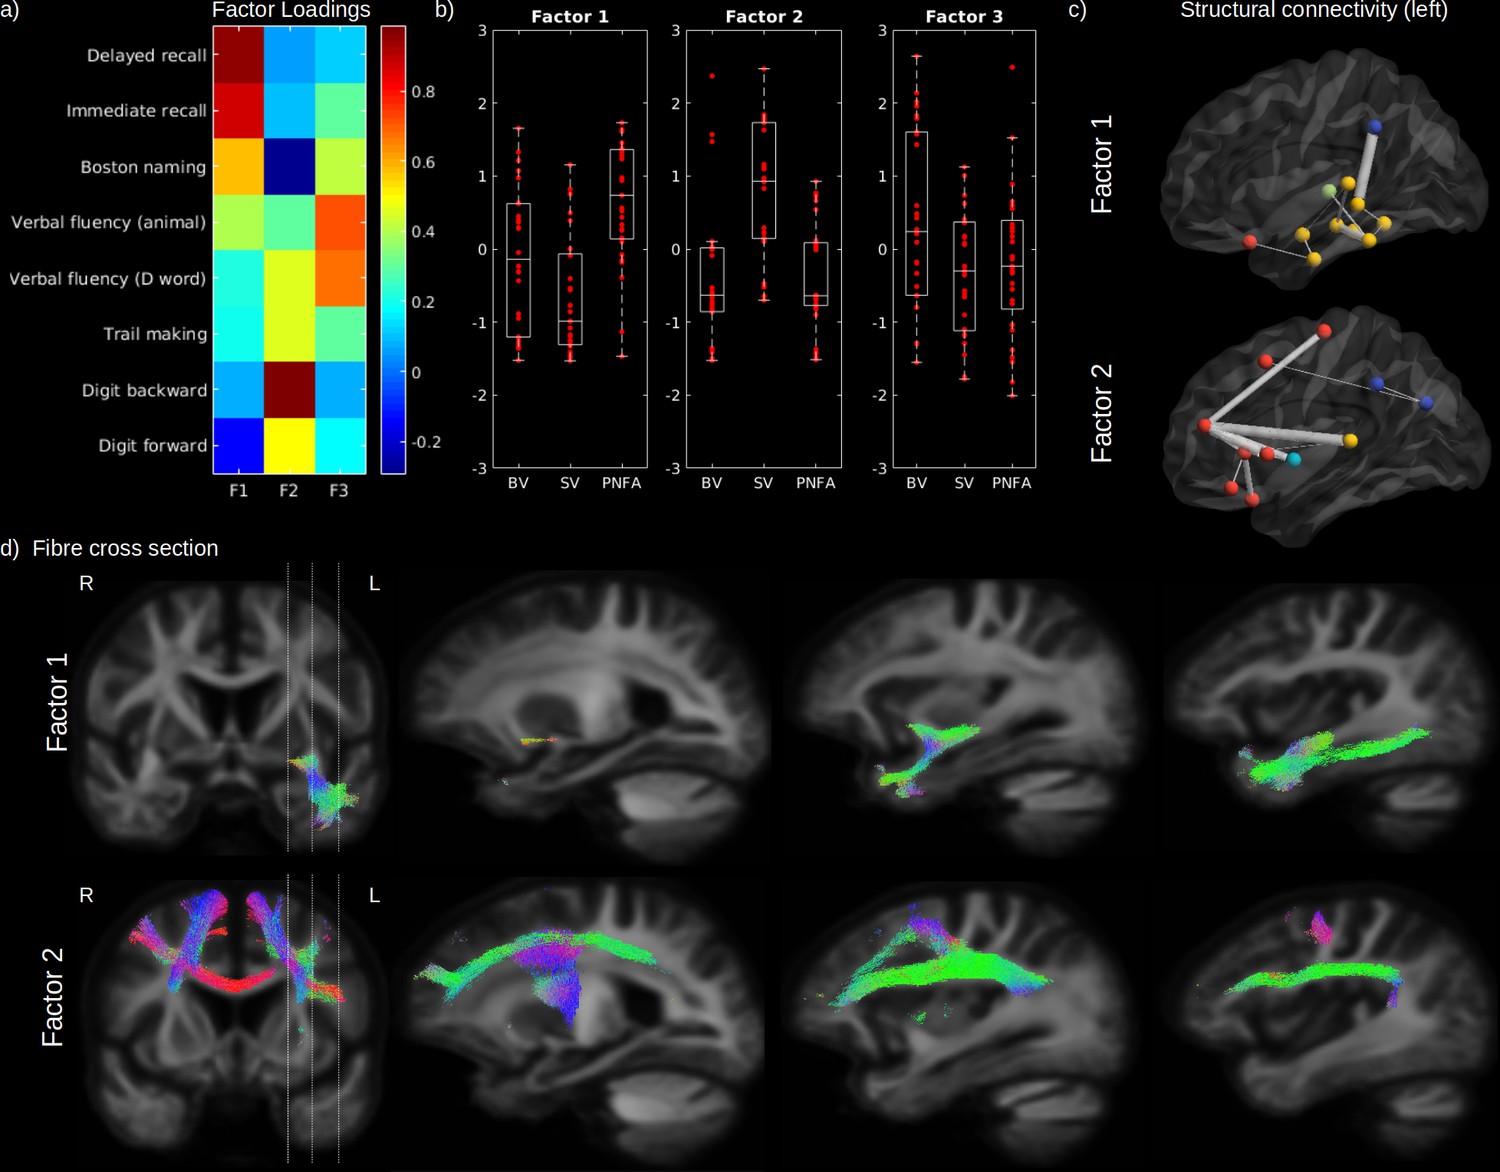
Cognitive domains and white-matter (WM) microstructure.
The factor loadings for the common factor analysis of selected cognitive tests are shown in (a). Associated factors scores are shown in (b) for behavioural variant (BV), semantic variant (SV), and progressive non-fluent aphasia (PNFA), for Factor 1 (semantic processing; left panel), Factor 2 (executive processing; middle panel), and Factor 3 (verbal fluency; right panel). Significantly reduced structural connectivity (across all patients; FWE-corrected p-value < 0.01) is shown in (c) for the Factor 1 (upper panel) and Factor 2 (lower panel), for the ipsilateral left (upper panel) hemisphere connectivity, where frontal regions are shown in red, the insula in light blue, the temporal lobe in yellow, subcortical regions in green and parietal regions in dark blue. The line thickness corresponds to the statistical strength of the effect. Significant relationship (FWE-corrected p-value < 0.05) between the cognitive factors and fibre cross-section (FC) is shown in (d) with associated streamlines (colour coded by direction) for Factor 1 (upper panel) and Factor 2 (lower panel).
Figure 6
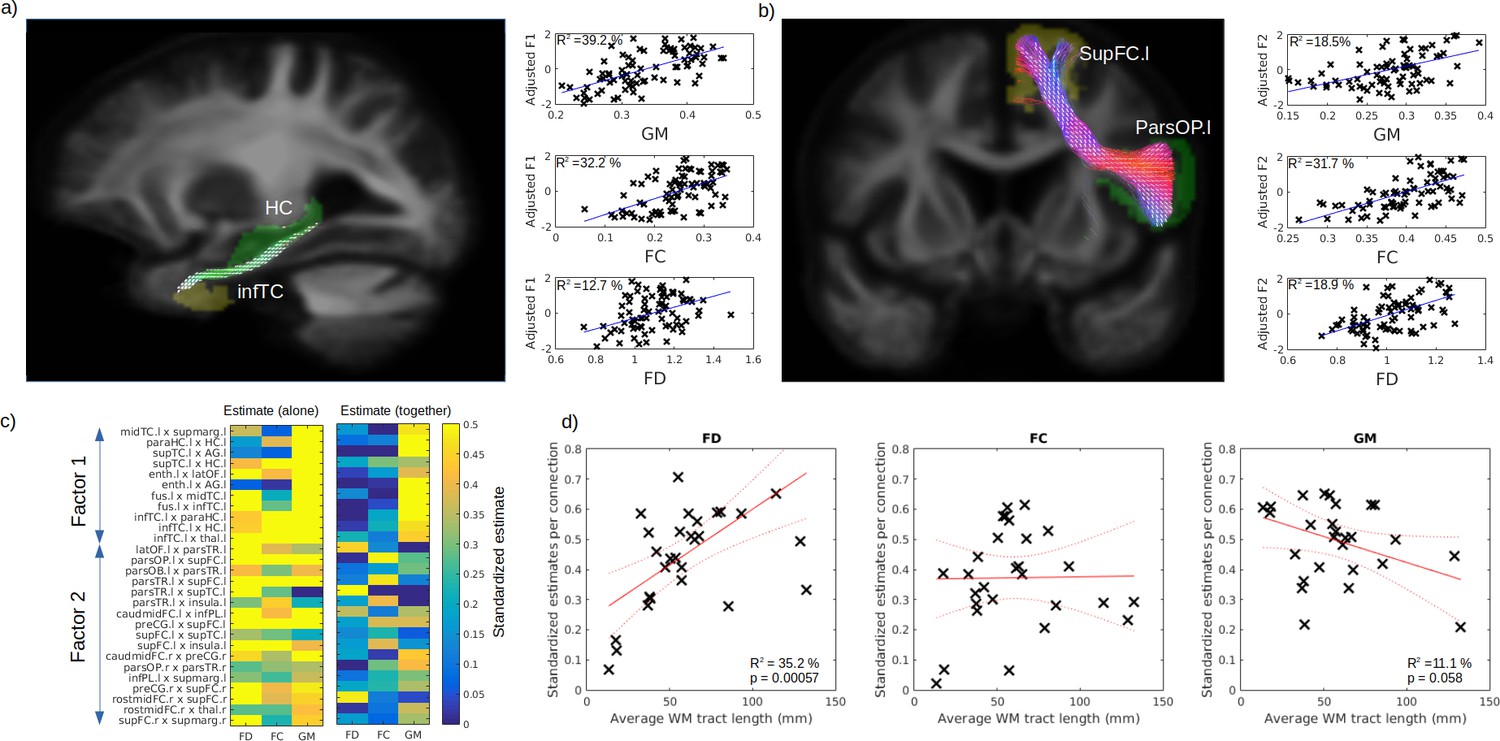
Respective contribution of grey matter (GM) and white matter (WM) to predict cognitive impairment.
Example tract of interest, selected from the significant relationship between structural connectivity and cognitive factor, are shown in (a–b), for Factors 1 and 2, respectively. The pair of connecting cortical regions (green and yellow) and the fixel binary mask extracted from the streamlines connecting the pair of GM regions (white) are used to calculate the connection-specific relationship across subjects between the cognitive factors and the average regional GM volume (upper panel) and the average fibre cross-section (FC) and fibre density (FD) in the fixel binary mask (middle and lower panels, respectively). The standardized estimate of the relationship between the cognitive factors 1 and 2 is shown in (c) for all selected connections, where the left panel shows the values when FD, FC, and GM were used as single predictors and the right panels show the partial estimates when FD, FC, and GM were all included together in the model. The relationship between each connection estimate and their associated average fibre length is shown in (d) for FD (left panel), FC (middle panel), and GM (right panel).
Tables
Table 1
Demographics.
| CN (N = 68) | BV (N = 28) | SV (N = 26) | PFNA (N = 30) | |
|---|---|---|---|---|
| Age (year) | 61.8 (8.2) | 60.6 (6.4) | 62.6 (6.0) | 68.3 (7.4) |
| Sex (female) | 60.3 % | 21.4 % | 42.3 % | 63.3 % |
| CDR language | – | 0.84 (0.53) | 1.04 (0.47) | 1.38 (0.66) |
| CDR behaviour | – | 1.48 (0.72) | 0.98 (0.48) | 0.41 (0.46) |
| CDR sum of boxes | – | 5.96 (2.78) | 3.54 (2.02) | 1.59 (1.55) |
| MMSE | 29.2 (0.8) | 24.3 (3.7) | 25.8 (3.6) | 25.3 (4.9) |
Additional files
Download links
A two-part list of links to download the article, or parts of the article, in various formats.
Downloads (link to download the article as PDF)
Open citations (links to open the citations from this article in various online reference manager services)
Cite this article (links to download the citations from this article in formats compatible with various reference manager tools)
Impact of long- and short-range fibre depletion on the cognitive deficits of fronto-temporal dementia
eLife 11:e73510.
https://doi.org/10.7554/eLife.73510


