Green fluorescent protein-like pigments optimise the internal light environment in symbiotic reef-building corals
- Coral Reef Laboratory, School of Ocean and Earth Science, University of Southampton, United Kingdom
- Marine Biology Section, Department of Biology, University of Copenhagen, Denmark
- Department of Biological Sciences, National University of Singapore, Singapore
- Laboratory for Biological Geochemistry, School of Architecture, Civil and Environmental Engineering, Ecole Polytechnique Fédérale de Lausanne (EPFL), Switzerland
- Climate Change Cluster, University of Technology Sydney, Australia
- Department of NanoEngineering, UC San Diego, United States
- Marine Biological Research Division, Scripps Institution of Oceanography, UC San Diego, United States
- Bioinspired Photonics Group, Department of Chemistry, University of Cambridge, United Kingdom
Figures
Figure 1
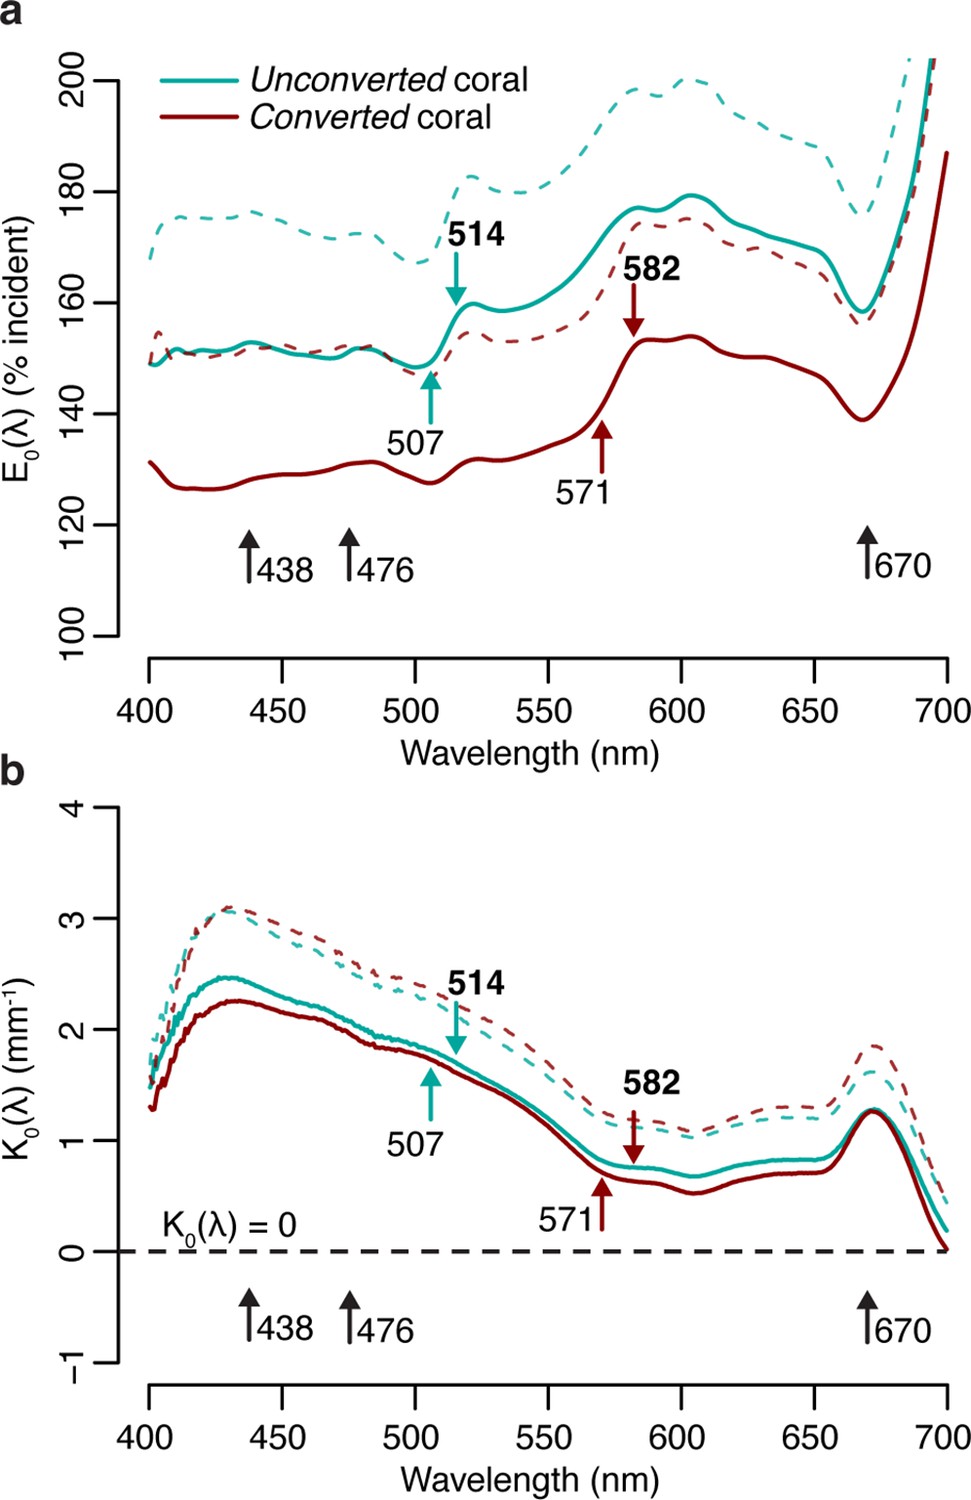
Spectral scalar irradiance under broad spectrum light in M. cavernosa before and after near-UV-induced photoconversion of the contained pcRFP.
(a) E0(λ) at coenosarc surface, with excitation and emission peaks of unconverted and converted photoconvertible red fluorescent protein (pcRFP) highlighted (colourful arrows), as well as absorption peaks of Symbiodiniaceae photosynthetic pigments (black arrows). Mean (solid lines)+ SD (dashed lines); n=3 measurements on two fragments. (b) Spectral attenuation coefficient of E0(λ) from coenosarc surface to skeleton (average thickness = 560 μm). Mean (solid lines)+ SD (dashed line), n=3.
Figure 2 with 2 supplements
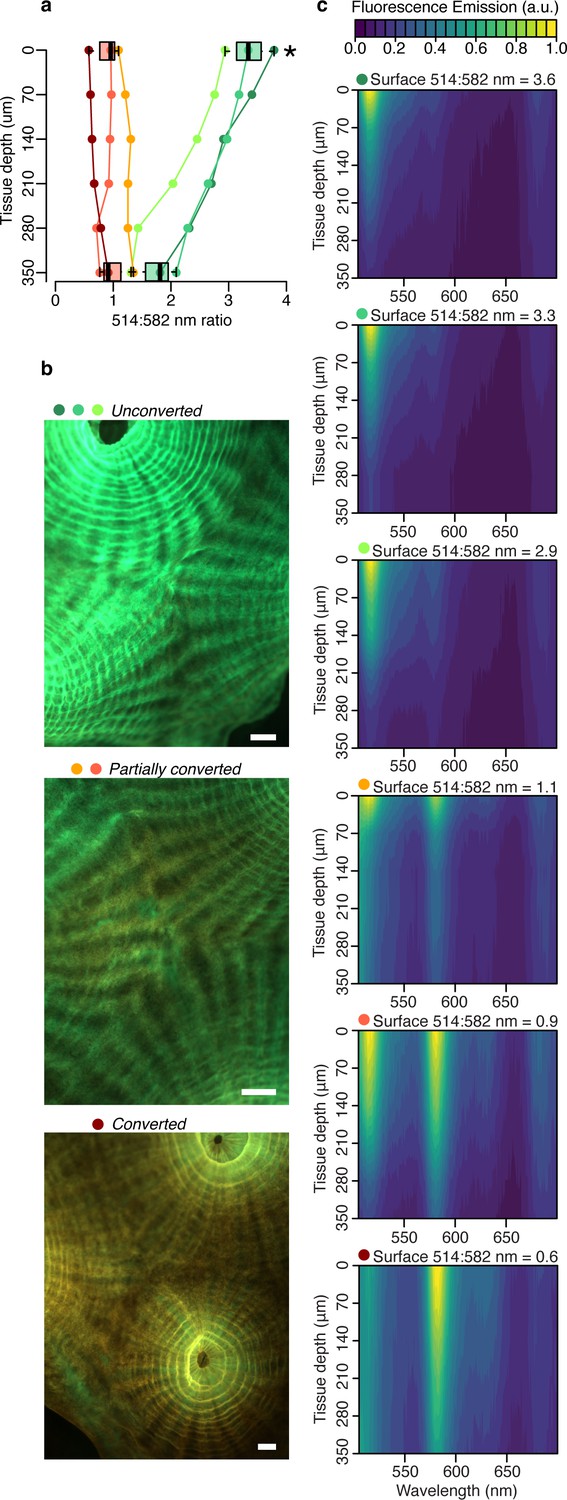
Fluorescence distribution in the tissue of M. cavernosa undergoing photoconversion.
Scalar irradiance measurements collected under blue excitation 455–505 nm (Figure 2—figure supplement 1c). (a) 514:582 nm emission ratio, indicating the degree of photoconversion for each coral (unconverted >1, partially converted ~1, and converted <1). Boxplots show data for the surface and deepest data point, grouped as unconverted vs partially converted or converted (n=3 areas). Star represents adjusted p<0.05 in two-way ANOVA followed by Tukey post-hoc comparison. (b) Fluorescence micrographs of representative photoconversion stages. (c) Normalised fluorescence emission profiles (arbitrary units: a.u.). Scale = 1 mm.
Figure 2—figure supplement 1
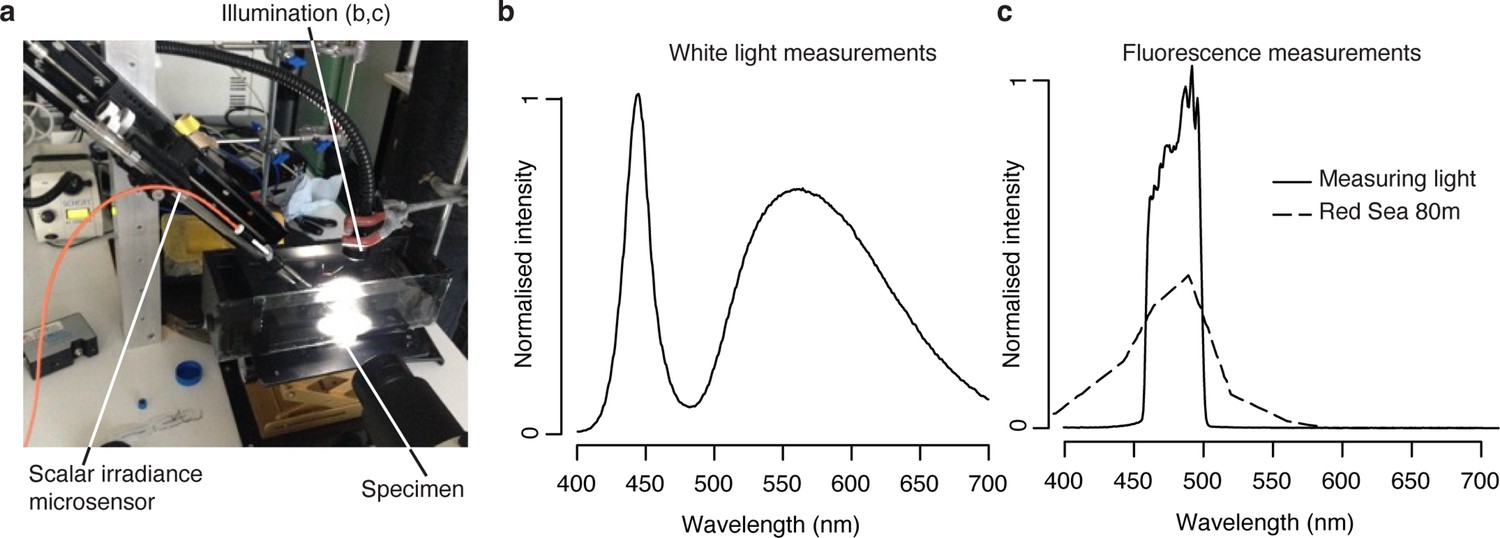
The scalar irradiance measurement set up (a) and spectra (b) of the two light sources used for measurement ((b) KL-1600 LED; (c) xenon arc lamp + green fluorescent protein (GFP) Plus filter). In (c), dashed lines represent field measurements from 80 m depth in the Red Sea (Eyal et al., 2015), normalised to integrated irradiance.
Figure 2—figure supplement 2
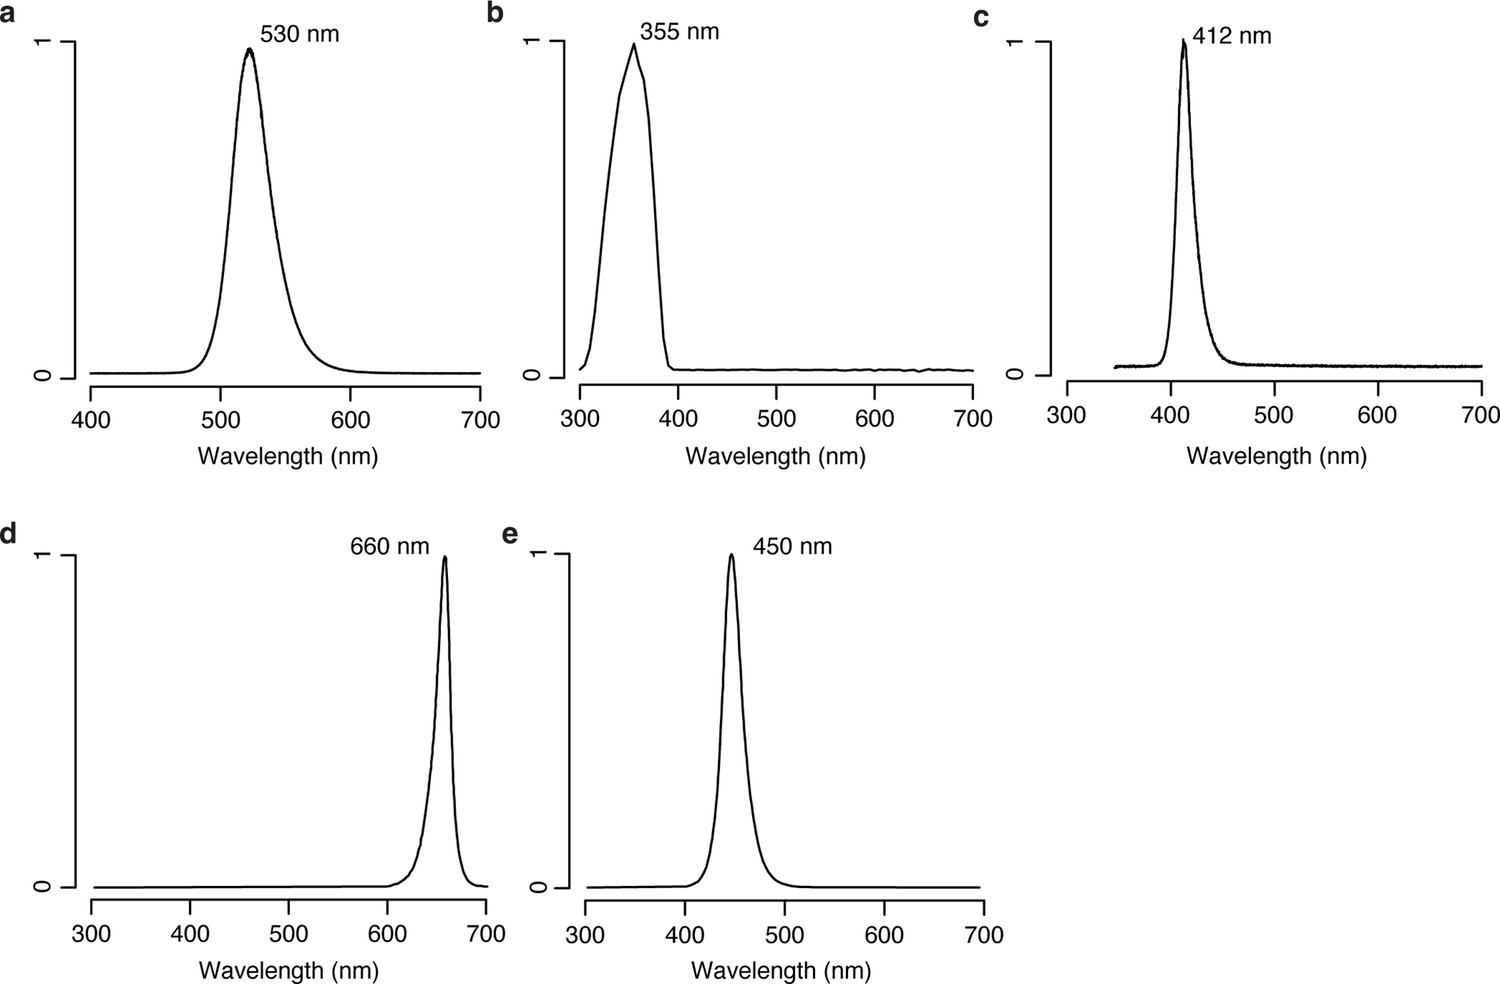
Spectra of light sources used for photoconversion (a–c) and bleaching (d and e) experiments (a, Lumiled Luxeon Rebel Green; b, xenon arc lamp +UV bandpass; c, Aquaray near UV; d, Lumiled Luxeon Rebel Deep Red; e, Lumiled Luxeon Rebel Royal Blue).
Figure 3 with 1 supplement

Photon scalar irradiance of fluorescence in the tissue of M. cavernosa at representative photoconversion stages.
(a) Tissue surface emission spectra of unconverted, partially converted, and converted specimens (ex = 455–505 nm). (b) Integrated green (505–560 nm) and red (560–650 nm) fluorescence emission along a tissue depth profile, measured under blue excitation (455–505 nm, Figure 2—figure supplement 1c).
Figure 3—figure supplement 1
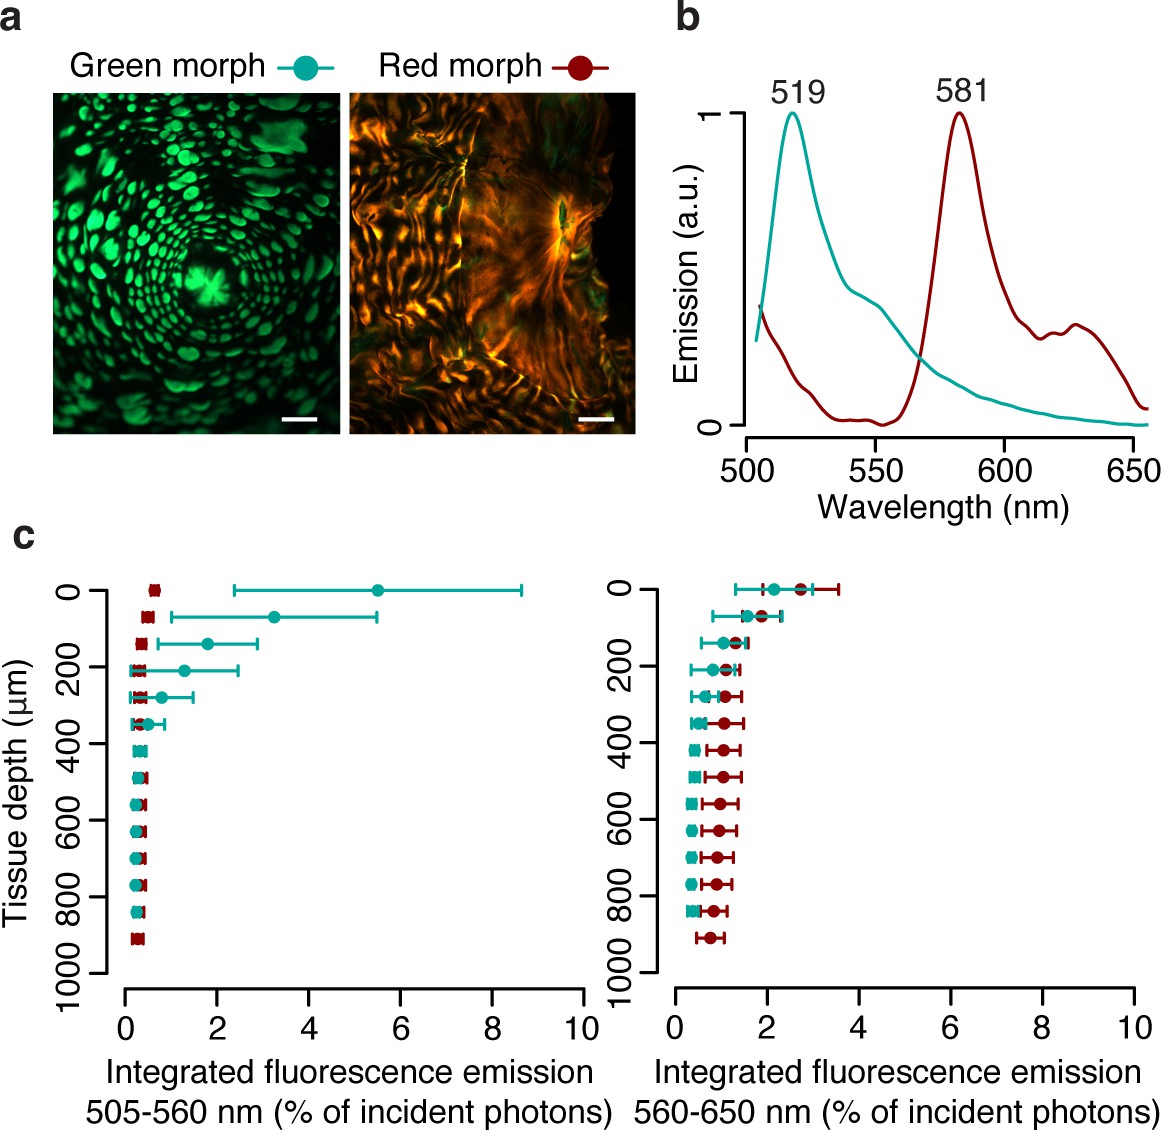
Photon scalar irradiance in the tissue of green and red morphs of Echinophyllia.
(a) Fluorescence micrographs (a) and surface fluorescence emission (b) of green and red morphs. Scale = 1 mm. (c) Integrated green (505–560 nm) and red (560–650 nm) fluorescence emission along a tissue depth profile, measured under blue excitation (455–505 nm, Figure 1). Spheres show means ± SD, n=3.
Figure 4 with 1 supplement
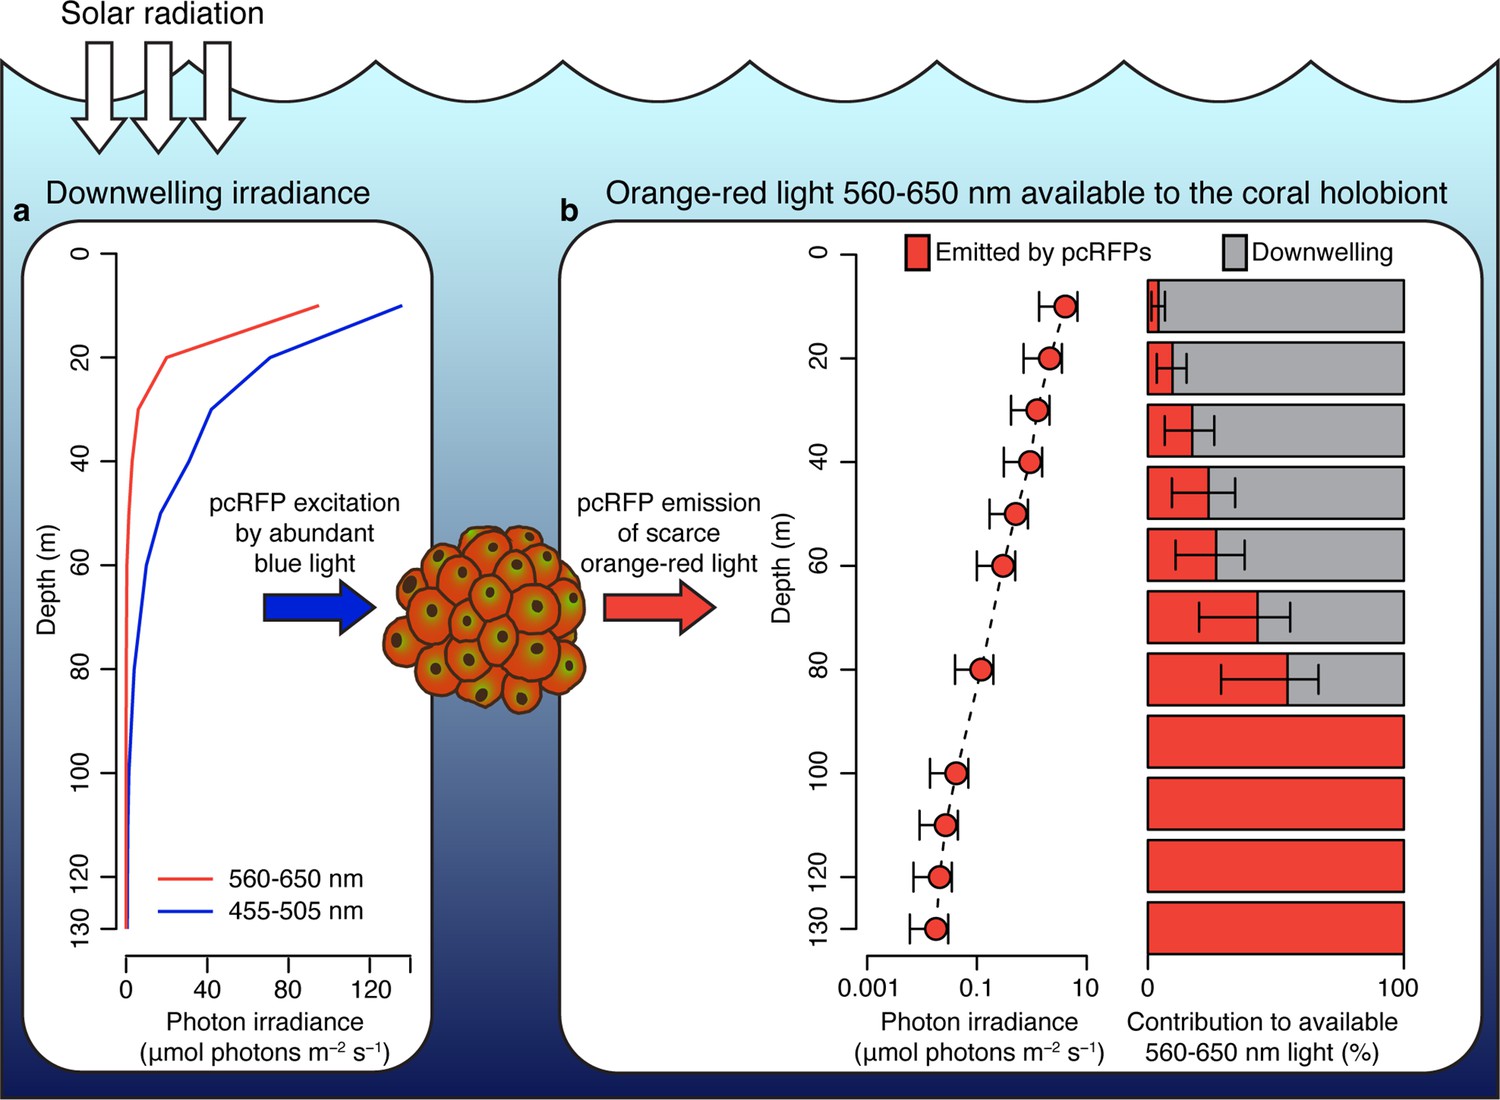
Spectral photon irradiance and wavelength conversion in corals with photo-convertible host pigments along a depth gradient.
(a) Integrated photon irradiance in the 455–505 nm and 560–650 nm range measured on a mesophotic reef in Eilat, Red Sea (Eyal et al., 2015). (b) Measured 560–650 nm light generated by photoconvertible red fluorescent protein (pcRFP) emission and estimated relative contribution to the total amount of 560–650 nm light available to the coral holobiont. Error bars represent range between measurement at the coral skeleton (1%) and measurement at the coral surface (5%).
Figure 4—figure supplement 1
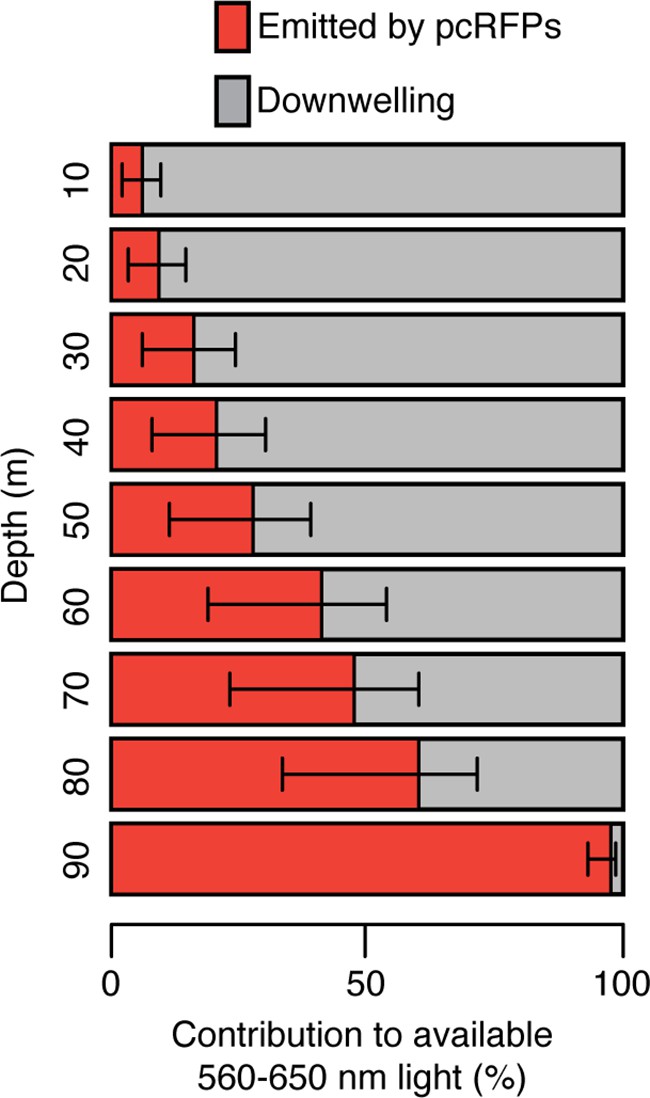
Relative contribution of fluorescence emission by photoconvertible red fluorescent protein (pcRFPs) and downwelling irradiance to the total 560–650 nm light available to pcRFP-containing corals along a depth gradient in the Bahamas (modelled irradiance data from Lesser et al., 2009).
Error bars represent range between measurement at the coral skeleton (1%) and measurement at the coral surface (5%).
Figure 5
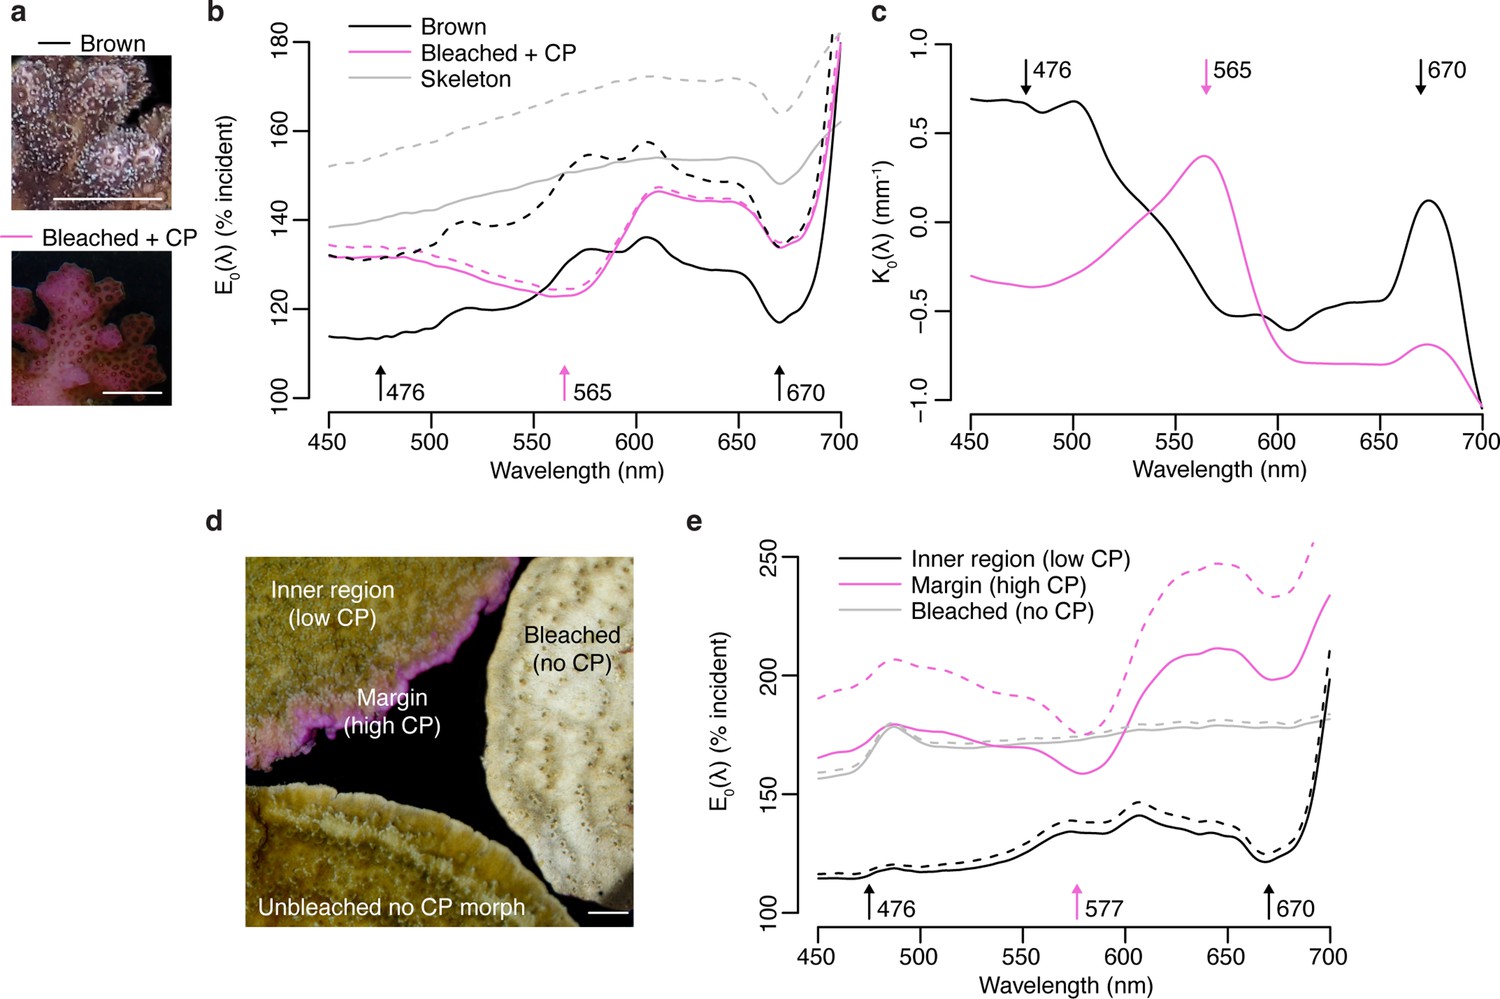
Effects of photoprotective chromoproteins (CP) on coral light environment.
(a) Representative photographs of unbleached brown and bleached pink P. damicornis. (b) Spectral scalar irradiance (E0(λ)) measurements at the coenosarc surface of unbleached brown P. damicornis, bleached P. damicornis with high CP content, and P. damicornis skeleton. (c) Spectral attenuation coefficient K0(λ) of scalar irradiance for unbleached brown and bleached pink P. damicornis, calculated from surface to skeleton (tissue thickness = ~300 μm). (d) Compilation of representative photographs of the unbleached high CP morph, unbleached no CP morph, and bleached no CP morph of M. foliosa. (e) Surface E0(λ) measurements of unbleached inner region (low CP), unbleached margin (high CP), and bleached no CP morph of M. foliosa. In (a) and (d), scale bar = 5 mm. In (b) and (e), mean (solid lines)+ SD (dashed lines), n=3 measurements. Arrows indicate peak absorption wavelength in nm for symbiont photosynthetic pigments (black) and CPs (pink).
Appendix 1—figure 1
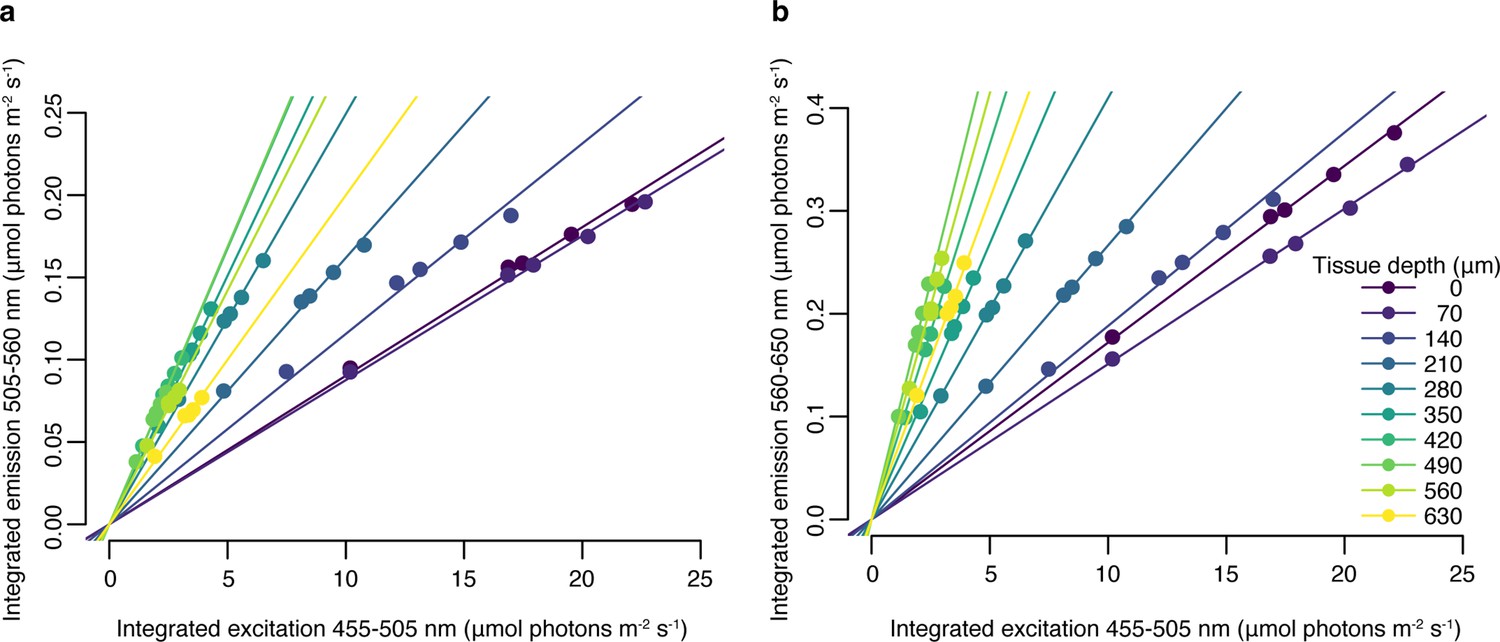
Relationship between blue (455–505 nm) excitation light photon irradiance measured in hospite and emitted green (505–560 nm), (a) or red (560–650 nm), (b) fluorescence at 10 tissue depths, obtained with a set of neutral density filters.
Trendlines represent fitted linear regression (adjusted p<0.05, Appendix 1—table 3).
Tables
Appendix 1—table 1
Results of t-test with Bonferroni adjustment for Figure 1a.
| Wavelength | t value | d.f. | p | Adjusted p |
|---|---|---|---|---|
| 438 | 1.572583 | 3.165662 | 0.209155 | 1 |
| 476 | 1.49222 | 3.538786 | 0.218869 | 1 |
| 507 | 1.638856 | 3.678655 | 0.182766 | 1 |
| 514 | 1.754119 | 3.500689 | 0.164409 | 0.986453 |
| 571 | 1.946208 | 3.84537 | 0.126343 | 0.758061 |
| 670 | 1.553197 | 3.589537 | 0.203304 | 1 |
Appendix 1—table 2
Results of two-way ANOVA followed by Tukey test post-hoc comparison for Figure 2a.
| Factor | d.f. | Sum Sq | Mean Sq | F | p |
|---|---|---|---|---|---|
| Photoconversion | 1 | 7.709 | 7.709 | 61.47 | <0.001 |
| Tissue depth | 1 | 1.646 | 1.646 | 13.13 | 0.007 |
| Photoconv:depth | 1 | 2.301 | 2.301 | 18.35 | 0.003 |
| Residuals | 8 | 1.003 | 0.125 | ||
| Diff | Lower | Upper | Adjusted p | ||
| Photoconversion | |||||
| Unconv vs Conv | 1.603 | 1.132 | 2.075 | <0.001 | |
| Tissue depth | |||||
| Surface vs Deep | 0.741 | 0.269 | 1.212 | 0.007 | |
| Photoconv:depth | |||||
| Unconv.Deep vs Conv.Deep | 0.727 | –0.199 | 1.653 | 0.132 | |
| Conv.Surface vs Conv.Deep | –0.135 | –1.061 | 0.791 | 0.964 | |
| Unconv.Surface vs Conv.Deep | 2.344 | 1.418 | 3.270 | <0.001 | |
| Conv.Surface vs Unconv.Deep | –0.862 | –1.788 | 0.064 | 0.068 | |
| Unconv.Surface vs Unconv.Deep | 1.617 | 0.691 | 2.543 | 0.002 | |
| Unconv.Surf vs Conv.Surf | 2.478 | 1.553 | 3.405 | <0.001 |
Appendix 1—table 3
Results of linear regression with Bonferroni adjustment for multiple testing for Appendix 1—figure 1.
| Green (505–560 nm) fluorescence emission | ||||||
|---|---|---|---|---|---|---|
| Depth | Slope | SE | t value | R2 adjusted | p | Adjusted p |
| 0 | 0.00902626 | 9.03E-05 | 99.9875929 | 0.99950008 | 6.00E-08 | 6.00E-07 |
| 70 | 0.0087601 | 7.62E-05 | 114.967832 | 0.99962183 | 3.43E-08 | 3.43E-07 |
| 140 | 0.01156811 | 0.00021343 | 54.2017461 | 0.99830038 | 6.94E-07 | 6.94E-06 |
| 210 | 0.01619148 | 0.00017715 | 91.4024378 | 0.9994018 | 8.59E-08 | 8.59E-07 |
| 280 | 0.02494033 | 0.00019703 | 126.581943 | 0.99968803 | 2.34E-08 | 2.34E-07 |
| 350 | 0.03021069 | 0.00018083 | 167.069327 | 0.99982089 | 7.70E-09 | 7.70E-08 |
| 420 | 0.03351092 | 0.0003004 | 111.554686 | 0.99959834 | 3.87E-08 | 3.87E-07 |
| 490 | 0.033718 | 0.00022538 | 149.603347 | 0.99977664 | 1.20E-08 | 1.20E-07 |
| 560 | 0.02842214 | 0.00042339 | 67.1300277 | 0.99889146 | 2.95E-07 | 2.95E-06 |
| 630 | 0.01999956 | 0.00028305 | 70.6577889 | 0.9989993 | 2.40E-07 | 2.40E-06 |
| Red (560–650 nm) fluorescence emission | ||||||
| Depth | Slope | SE | t value | R2 adjusted | p | Adjusted p |
| 0 | 0.01719483 | 8.20E-05 | 209.593244 | 0.99988619 | 3.11E-09 | 3.11E-08 |
| 70 | 0.01510699 | 6.92E-05 | 218.286085 | 0.99989507 | 2.64E-09 | 2.64E-08 |
| 140 | 0.01881416 | 0.00019939 | 94.3604722 | 0.9994387 | 7.56E-08 | 7.56E-07 |
| 210 | 0.0266481 | 8.29E-05 | 321.256566 | 0.99995155 | 5.63E-10 | 5.63E-09 |
| 280 | 0.04096949 | 0.00025024 | 163.718467 | 0.99981349 | 8.35E-09 | 8.35E-08 |
| 350 | 0.05367283 | 0.00046253 | 116.040816 | 0.99962879 | 3.31E-08 | 3.31E-07 |
| 420 | 0.07300642 | 0.00047553 | 153.525421 | 0.9997879 | 1.08E-08 | 1.08E-07 |
| 490 | 0.09251997 | 0.00093074 | 99.4042684 | 0.99949419 | 6.14E-08 | 6.14E-07 |
| 560 | 0.08291338 | 0.00118633 | 69.8904363 | 0.99897723 | 2.51E-07 | 2.51E-06 |
| 630 | 0.06235948 | 0.00053652 | 116.22921 | 0.99962999 | 3.29E-08 | 3.29E-07 |
Appendix 1—table 4
List of acclimation conditions, experimental treatments, and measurements performed on each species and morph used in the study.
| Species and morph | Acclimation | Experimental treatment | Measurements |
|---|---|---|---|
| M. cavernosa | 40 days green light | None | E0 profiles (white illumination) |
| Exposure to xenon arc lamp +UV filter for 6 hr localised to a 3 mm spot | E0 profiles inside and outside treated area (white and blue illumination) | ||
| Exposure to near-UV LED over the entire sample for 10 hr | E0 profiles before and after treatment (white and blue illumination) | ||
| Echinophyllia sp. green morph | >6 months broad spectrum metal halide and 100 μmol photons m–2 s–1 | None | E0 profiles (blue illumination) |
| Echinophyllia sp. red morph | >6 months broad spectrum metal halide and 100 μmol photons m–2 s–1 | None | E0 profiles (blue illumination) |
| P. damicornis pink morph | >6 months broad spectrum metal halide and 100 μmol photons m–2 s–1 | Exposure to 400 μmol photons m–2 s–1 red light for 7 days followed by exposure to 100 μmol photons m–2 s–1 blue light for 20 days | E0 profile and surface E0 after treatment (white illumination) |
| P. damicornis brown morph | >6 months broad spectrum metal halide and 100 μmol photons m–2 s–1 | None | E0 profile and surface E0 after treatment (white illumination) |
| M. foliosa purple edge morph | >6 months broad spectrum metal halide and 200 μmol photons m–2 s–1 | None | Surface E0 (white illumination) |
| M. foliosa brown morph | >6 months broad spectrum metal halide and 200 μmol photons m–2 s–1 | 65 days high nitrate/low phosphate | Surface E0 after treatment (white illumination) |
Additional files
Download links
A two-part list of links to download the article, or parts of the article, in various formats.
Downloads (link to download the article as PDF)
Open citations (links to open the citations from this article in various online reference manager services)
Cite this article (links to download the citations from this article in formats compatible with various reference manager tools)
Green fluorescent protein-like pigments optimise the internal light environment in symbiotic reef-building corals
eLife 11:e73521.
https://doi.org/10.7554/eLife.73521


