Inositol polyphosphate multikinase physically binds to the SWI/SNF complex and modulates BRG1 occupancy in mouse embryonic stem cells
- Department of Biological Sciences, Korea Advanced Institute of Science and Technology (KAIST), Republic of Korea
- Department of Chemistry, Seoul National University, Republic of Korea
- UNIST Central Research Facilities (UCRF), Ulsan National Institute of Science and Technology (UNIST), Republic of Korea
- KAIST Stem Cell Center, KAIST, Republic of Korea
- KAIST Institute for the BioCentury, KAIST, Republic of Korea
Figures
Figure 1 with 1 supplement

Identification of SMARCB1 as an IPMK-interacting protein via unbiased screening assays.
(A) IPMK and SMARCB1 interaction test in yeast strain AH109 containing two reporter genes (ADE2 and HIS3). Yeast cells were co-transformed with either the GAL4-BD fusion plasmid pGBKT7 or pGBKT7-IPMK, and the GAL4-AD fusion plasmid pACT2-SMARCB1. The yeast cells were spread on a selection medium lacking leucine and tryptophan (SD-LW) to select co-transformants of bait and prey vectors. Specific interactions between bait and prey proteins were monitored via cell growth on selection medium lacking leucine, tryptophan, and adenine (SD-LWA), or a selection medium lacking leucine, tryptophan, and histidine (SD-LWH). 3-Amino-1,2,4-triazole (3-AT) was used to suppress leaky HIS3 expression in transformants to obtain an accurate phenotype. Polypyrimidine tract binding protein (PTB) gene fused with the GAL4 DNA binding domain (BD-PTB) and PTB gene fused with the GAL4 activation domain (AD-PTB) were used as positive controls of bait and prey vectors, respectively. The negative control is cells transformed with the parental bait vector (pGBKT7) and prey vector (pACT2). (B) Schematic diagram displaying the identification strategy of IPMK-proximal/interacting proteins, which are biotinylated by APEX-tagged IPMK. (C) Bar graphs showing the relative abundance of biotinylated proteins related to the SWI/SNF complex and two negative controls (left). Target proteins were arranged according to their significance (left, significant; right, not significant). The volcano plot shows the relative abundance and significance (P-value) of biotinylated proteins related to the SWI/SNF complex and two negative controls (right). A dotted line within the volcano plot indicates p = 0.05. The relative abundance (abundance ratio) was derived by comparing the fold enrichment of target proteins in IPMK-APEX2-expressing vs. APEX2-expressing HEK293 cells. P-values were calculated using the Student’s t-test, and error bars denote the standard error of the mean obtained from three biological replicates.
-
Figure 1—source data 1
Full and unedited images corresponding to panel A.
- https://cdn.elifesciences.org/articles/73523/elife-73523-fig1-data1-v1.pdf
-
Figure 1—source data 2
Primary data for graphs in panel C.
- https://cdn.elifesciences.org/articles/73523/elife-73523-fig1-data2-v1.xlsx
Figure 1—figure supplement 1
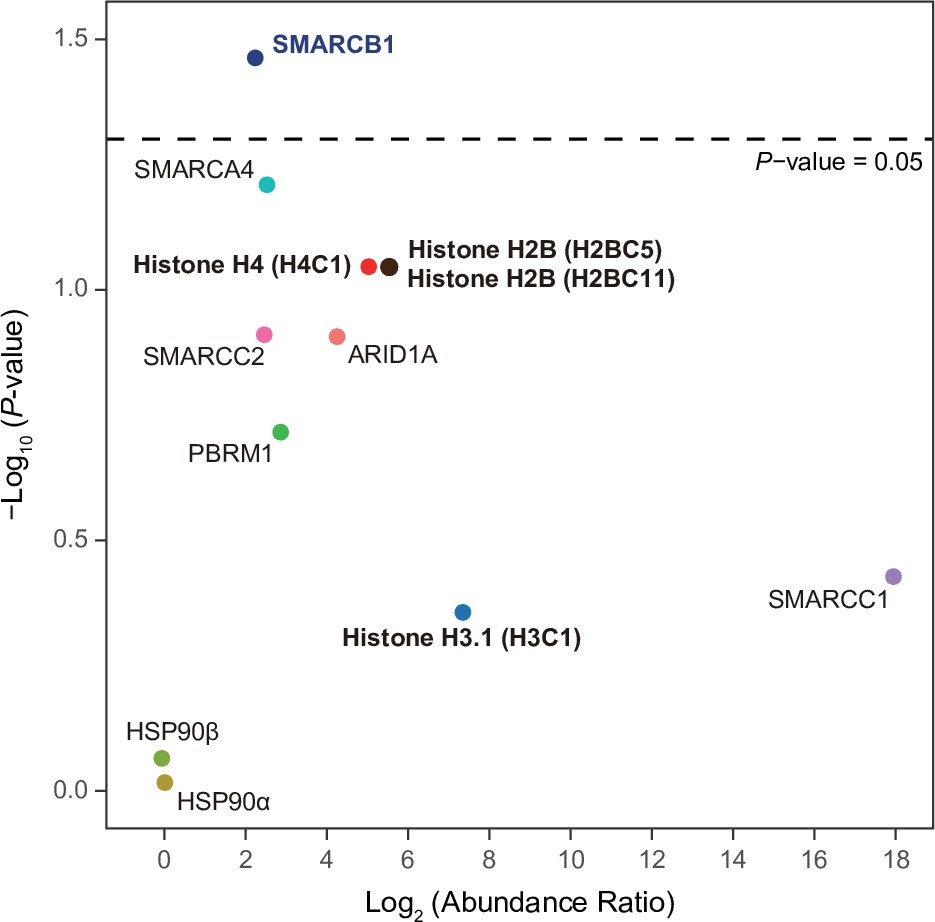
Various subunits of the SWI/SNF complex and histones are IPMK-proximal/interacting proteins.
A volcano plot showing the relative abundance and significance (P-value) of biotinylated proteins related to the SWI/SNF complex, histones, and two negative controls (right). A dotted line within the volcano plot indicates p = 0.05. The relative abundance (abundance ratio) was derived by comparing the fold enrichment of target proteins in IPMK-APEX2-expressing to APEX2-expressing HEK293 cells. P-values were calculated using Student’s t-test.
Figure 2 with 1 supplement
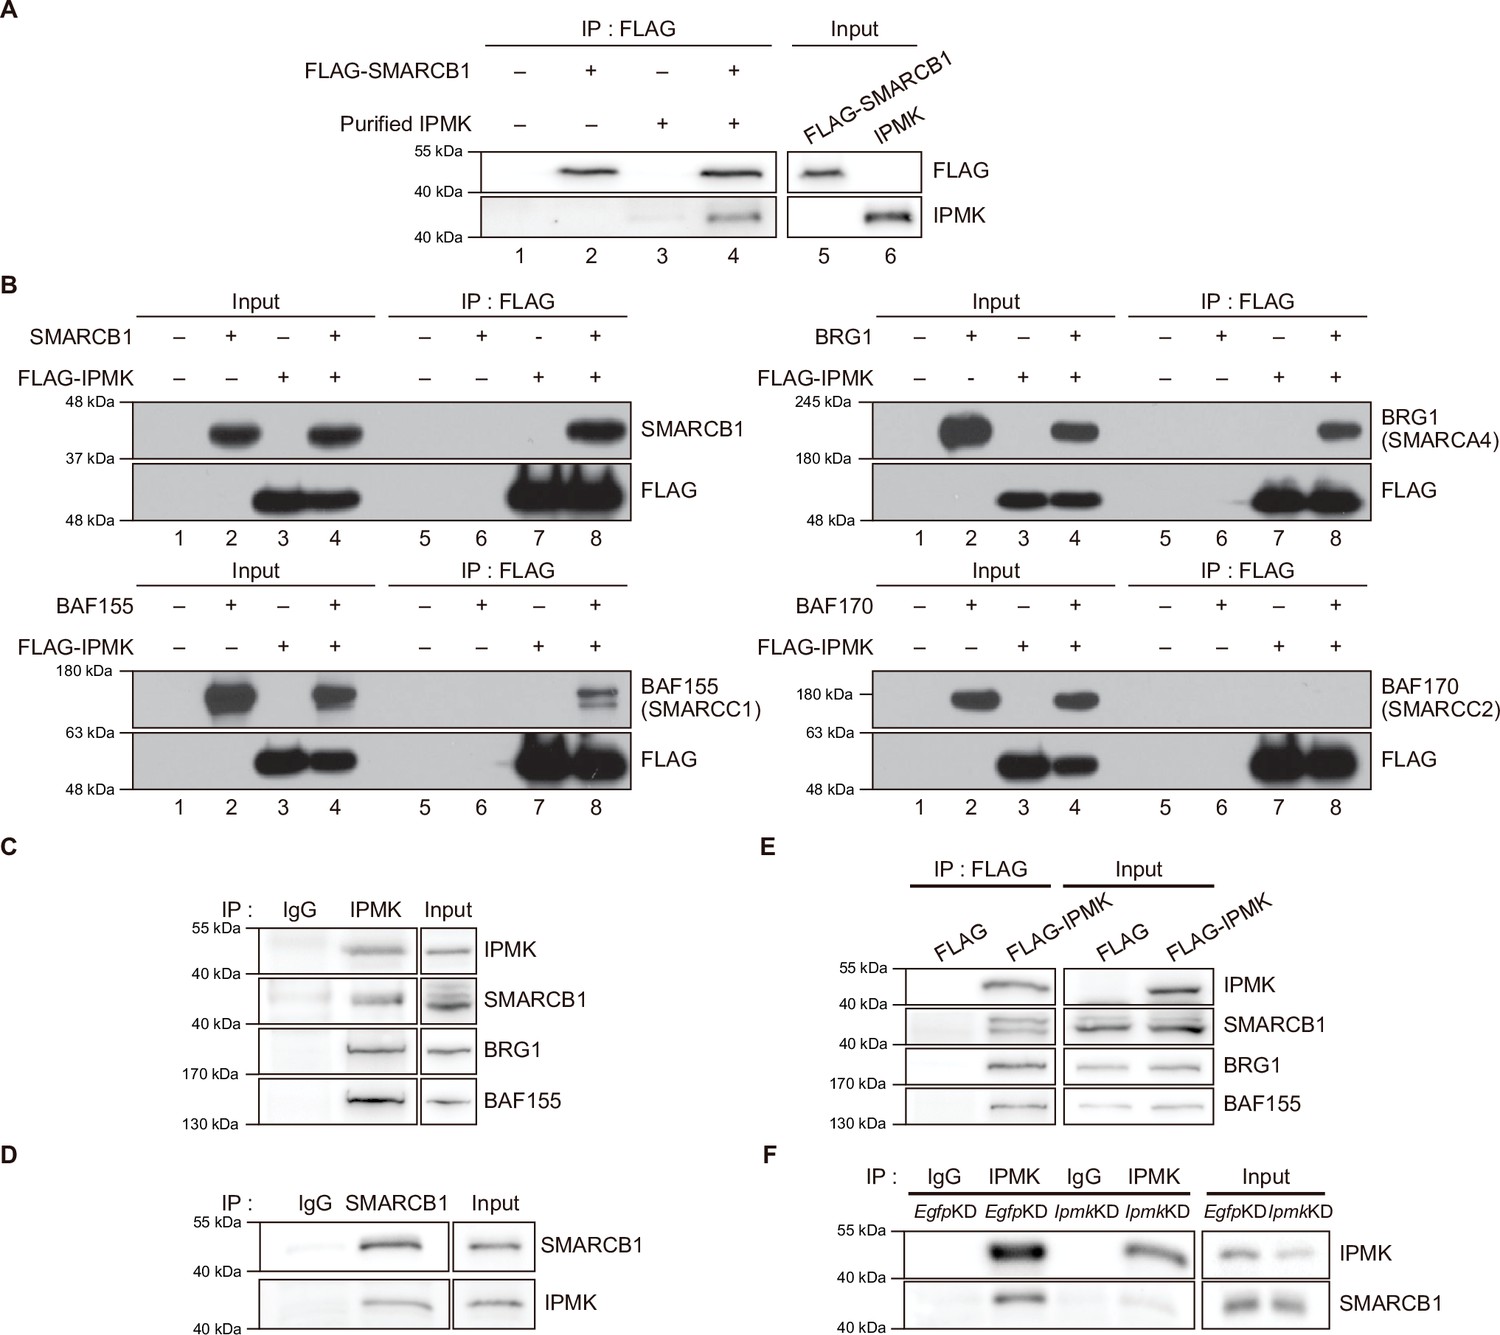
IPMK binds to SMARCB1 and other components of the SWI/SNF complex.
(A) Purified IPMK and in vitro translated FLAG-SMARCB1 were co-incubated, immunoprecipitated with an anti-FLAG antibody, and then subjected to immunoblotting. (B) Sf9 insect cells were co-infected with baculoviruses expressing FLAG-IPMK and individual subunits of the SWI/SNF complex (SMARCB1, BRG1, BAF155, and BAF170), followed by FLAG M2 agarose immunoprecipitation and immunoblotting. (C) IPMK and IgG were immunoprecipitated from E14Tg2a cells and subjected to immunoblotting. (D) SMARCB1 and IgG were immunoprecipitated from E14Tg2a cells and subjected to immunoblotting. (E) E14Tg2a cells were transfected with FLAG-IPMK or FLAG (a control vector), followed by FLAG immunoprecipitation and immunoblotting. (F) E14Tg2a cells were transfected with siRNA against Egfp (EgfpKD) and Ipmk (IpmkKD), immunoprecipitated with IPMK and IgG, and then subjected to immunoblotting.
-
Figure 2—source data 1
Full and unedited blots corresponding to panel A.
- https://cdn.elifesciences.org/articles/73523/elife-73523-fig2-data1-v1.zip
-
Figure 2—source data 2
Full and unedited blots corresponding to panel B.
- https://cdn.elifesciences.org/articles/73523/elife-73523-fig2-data2-v1.zip
-
Figure 2—source data 3
Full and unedited blots corresponding to panel C.
- https://cdn.elifesciences.org/articles/73523/elife-73523-fig2-data3-v1.zip
-
Figure 2—source data 4
Full and unedited blots corresponding to panel D.
- https://cdn.elifesciences.org/articles/73523/elife-73523-fig2-data4-v1.zip
-
Figure 2—source data 5
Full and unedited blots corresponding to panel E.
- https://cdn.elifesciences.org/articles/73523/elife-73523-fig2-data5-v1.zip
-
Figure 2—source data 6
Full and unedited blots corresponding to panel F.
- https://cdn.elifesciences.org/articles/73523/elife-73523-fig2-data6-v1.zip
Figure 2—figure supplement 1
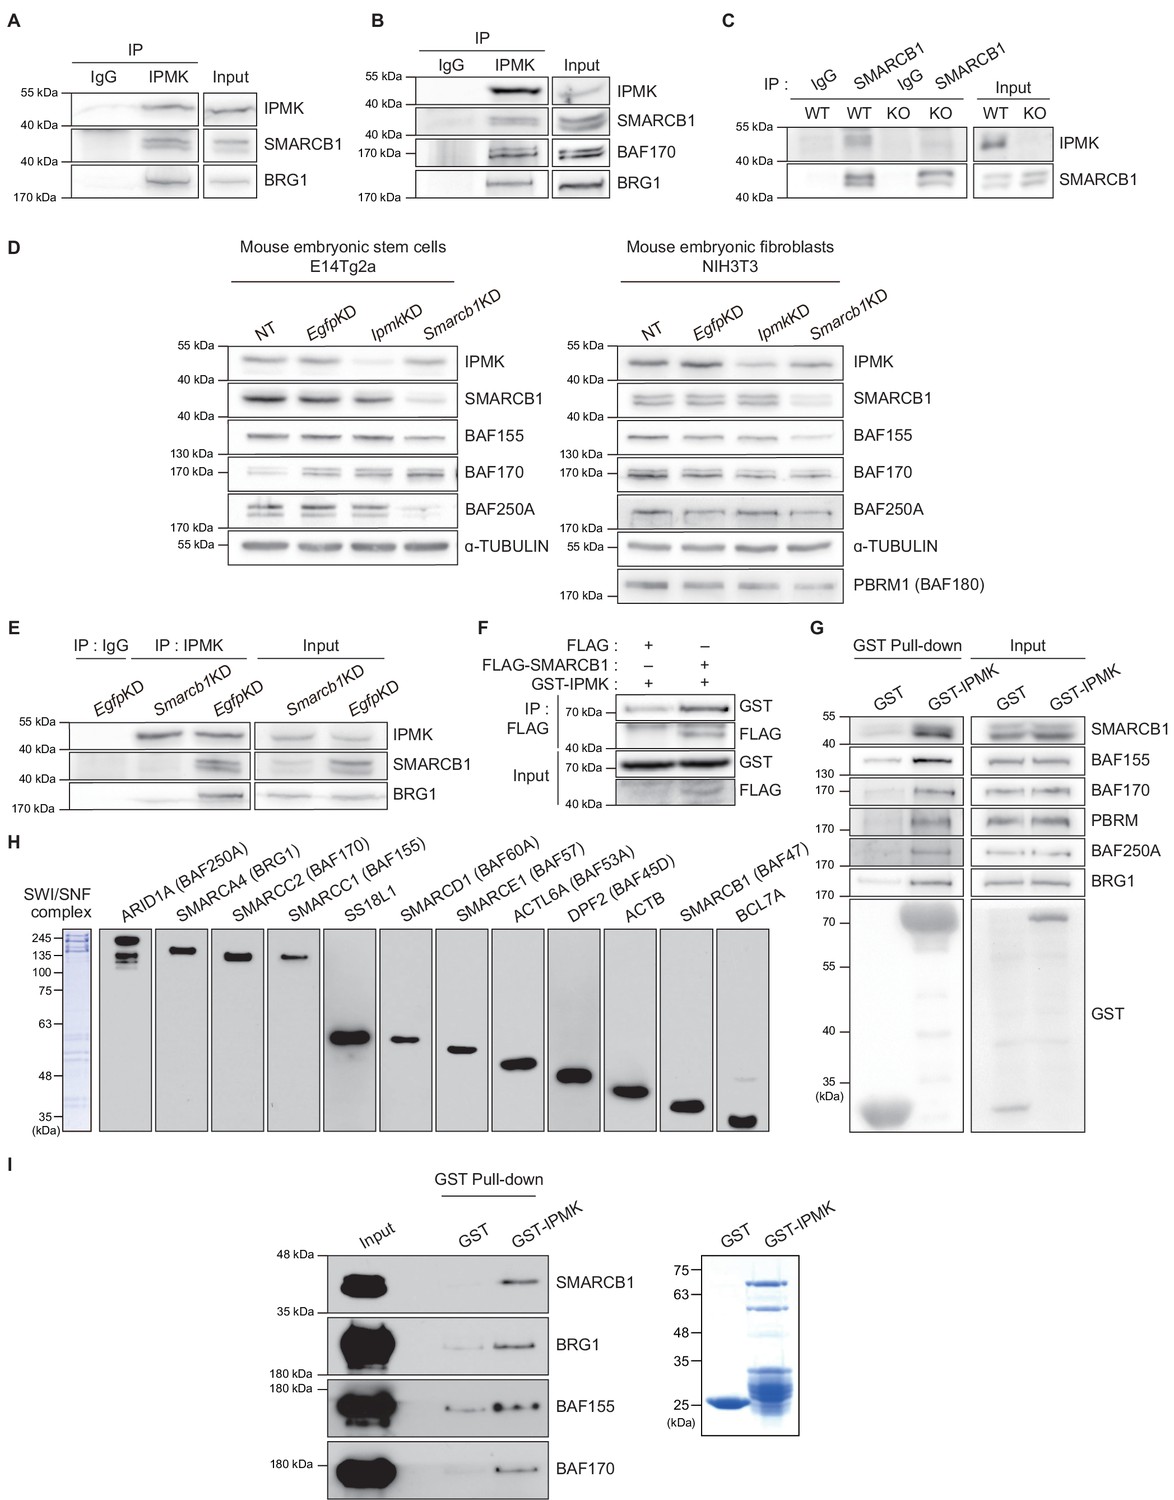
IPMK physically binds to SMARCB1 and other subunits of the SWI/SNF complex.
(A) IPMK and IgG were immunoprecipitated from NIH3T3 cells and then subjected to immunoblotting. (B) IPMK and IgG were immunoprecipitated from NIH3T3 cells in the presence of DSP, an established crosslinker, and then subjected to immunoblotting. (C) SMARCB1 and IgG were immunoprecipitated from wild-type (WT) and IPMK-depleted (KO) MEF cells and then subjected to immunoblotting. (D) E14Tg2a cells and NIH3T3 cells were non-transfected (NT) or transfected with siRNA against Egfp (EgfpKD), Ipmk (IpmkKD), and Smarcb1 (Smarcb1KD), and then subjected to immunoblotting. (E) E14Tg2a cells were transfected with siRNA against Egfp (EgfpKD) and Smarcb1 (Smarcb1KD), immunoprecipitated with IPMK and IgG, and then subjected to immunoblotting. (F) HEK293T cells were co-transfected with GST-IPMK and FLAG-SMARCB1 or FLAG (a control vector), followed by FLAG immunoprecipitation and immunoblotting. (G) HEK293T cells were transfected with GST-IPMK or GST (a control vector), followed by GST pull-down and immunoblotting. (H) Coomassie blue staining (left) and immunoblots of SWI/SNF complex purified from the FLAG-DPF2 HEK293T cell line. (I) SWI/SNF complex purified from FLAG-DPF2 HEK293T cells was co-incubated with purified GST-IPMK or GST, followed by GST pull-down and immunoblotting (left). Coomassie blue staining of purified GST and GST-IPMK proteins (right).
-
Figure 2—figure supplement 1—source data 1
Full and unedited blots corresponding to panel A.
- https://cdn.elifesciences.org/articles/73523/elife-73523-fig2-figsupp1-data1-v1.zip
-
Figure 2—figure supplement 1—source data 2
Full and unedited blots corresponding to panel B.
- https://cdn.elifesciences.org/articles/73523/elife-73523-fig2-figsupp1-data2-v1.zip
-
Figure 2—figure supplement 1—source data 3
Full and unedited blots corresponding to panel C.
- https://cdn.elifesciences.org/articles/73523/elife-73523-fig2-figsupp1-data3-v1.zip
-
Figure 2—figure supplement 1—source data 4
Full and unedited blots corresponding to panel D.
- https://cdn.elifesciences.org/articles/73523/elife-73523-fig2-figsupp1-data4-v1.zip
-
Figure 2—figure supplement 1—source data 5
Full and unedited blots corresponding to panel E.
- https://cdn.elifesciences.org/articles/73523/elife-73523-fig2-figsupp1-data5-v1.zip
-
Figure 2—figure supplement 1—source data 6
Full and unedited blots corresponding to panel F.
- https://cdn.elifesciences.org/articles/73523/elife-73523-fig2-figsupp1-data6-v1.zip
-
Figure 2—figure supplement 1—source data 7
Full and unedited blots corresponding to panel G.
- https://cdn.elifesciences.org/articles/73523/elife-73523-fig2-figsupp1-data7-v1.zip
-
Figure 2—figure supplement 1—source data 8
Full and unedited blots and gels corresponding to panel H.
- https://cdn.elifesciences.org/articles/73523/elife-73523-fig2-figsupp1-data8-v1.zip
-
Figure 2—figure supplement 1—source data 9
Full and unedited blots and gels corresponding to panel I.
- https://cdn.elifesciences.org/articles/73523/elife-73523-fig2-figsupp1-data9-v1.zip
Figure 3 with 1 supplement
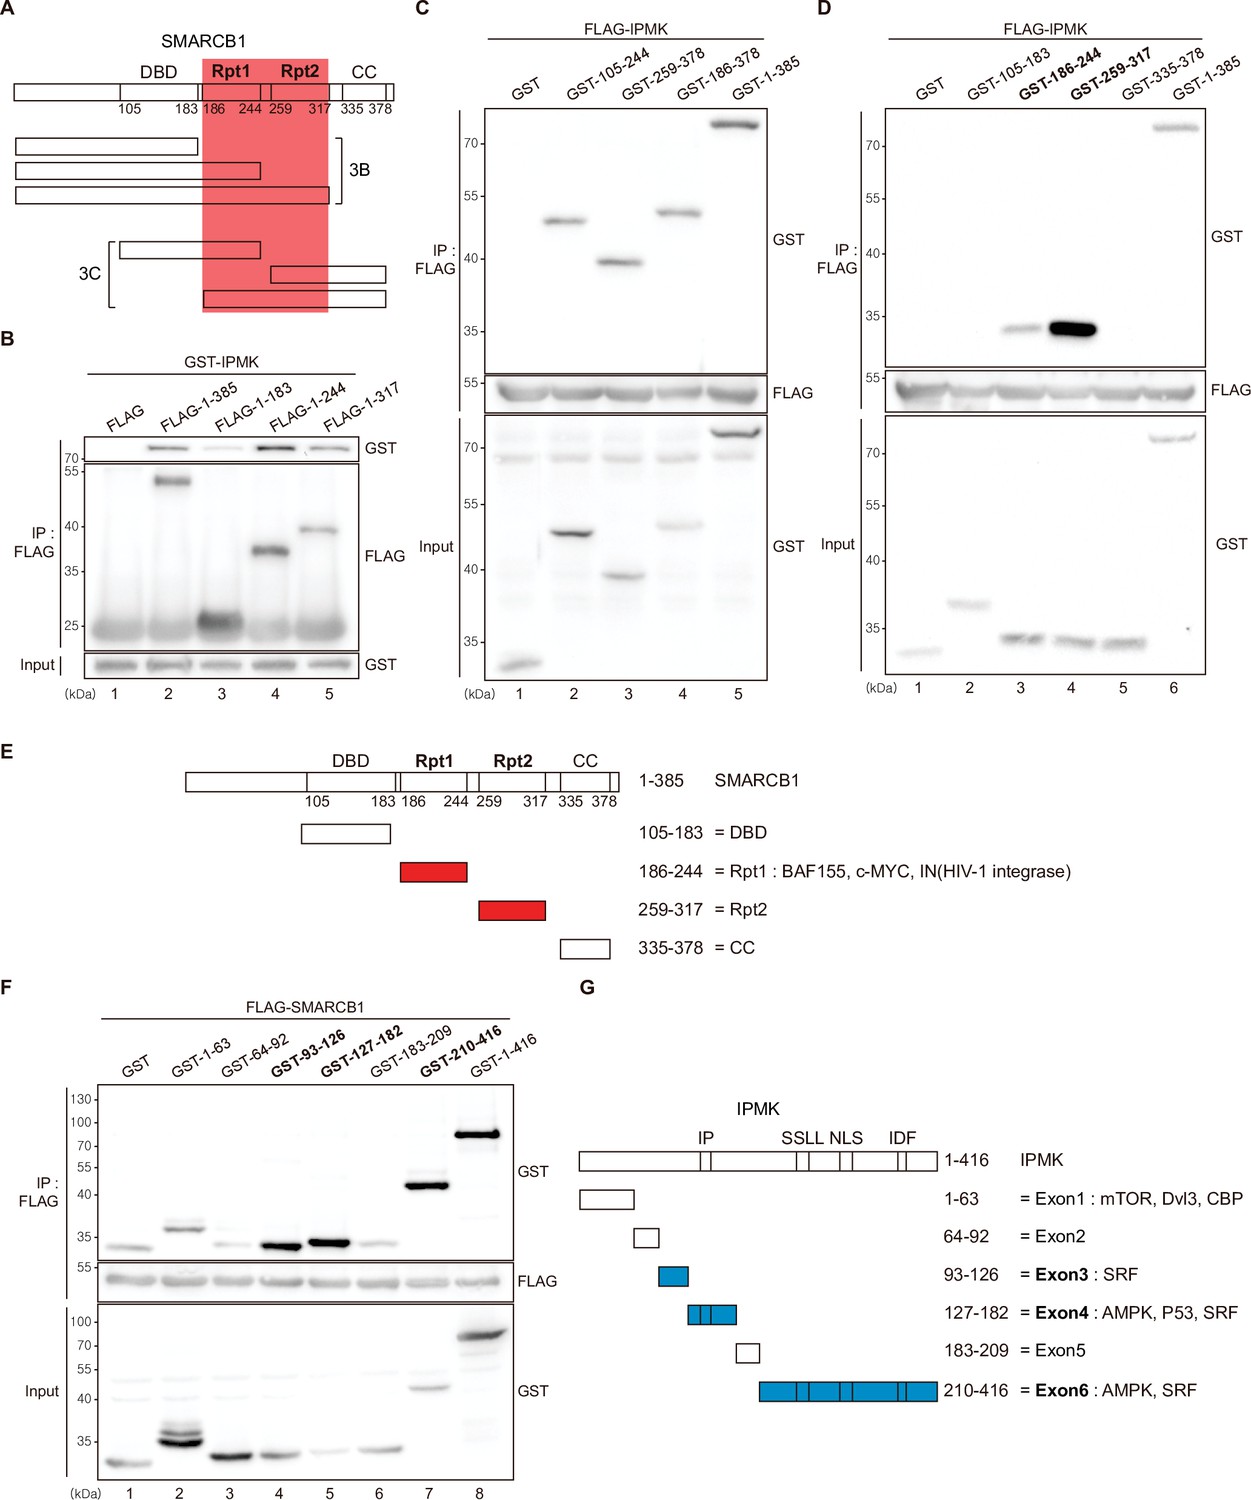
Identification of the distinct domains required for IPMK-SMARCB1 interactions.
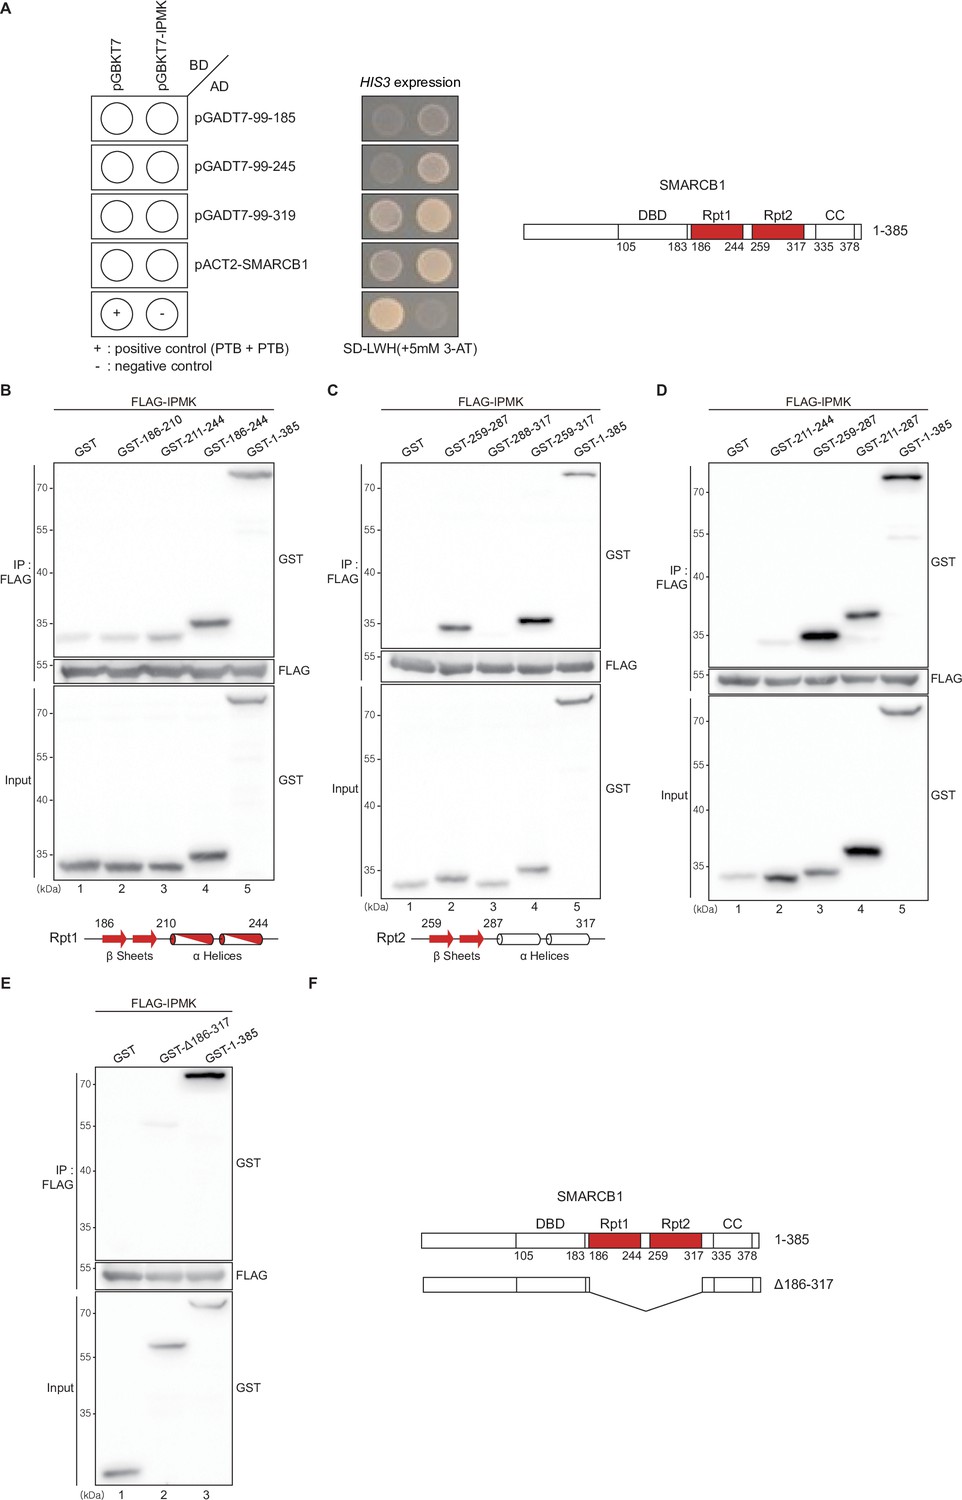
(A) Schematic diagram showing the human SMARCB1 fragments used for the binding studies (B and C). The IPMK-binding sites (Rpt1 and Rpt2) are highlighted in red. (B) HEK293T cells were co-transfected with GST-IPMK and FLAG (a control vector) or FLAG-SMARCB1 fragments, followed by immunoprecipitation with an anti-FLAG antibody, and then subjected to immunoblotting. (C and D) HEK293T cells were co-transfected with FLAG-IPMK and GST (a control vector) or GST-SMARCB1 fragments, followed by immunoprecipitation with an anti-FLAG antibody, and then subjected to immunoblotting. The specific IPMK-binding SMARCB1 fragments are in bold. (E) Schematic diagram showing the domains of human SMARCB1. SMARCB1 fragments used for the binding studies in (D) are indicated below with the numbers of amino acid sequences. The specific IPMK-binding SMARCB1 fragments (Rpt1 and Rpt2) are highlighted in red. (F) HEK293T cells were co-transfected with FLAG-SMARCB1 and GST (a control vector) or GST-IPMK fragments, followed by immunoprecipitation with an anti-FLAG antibody, and then subjected to immunoblotting. (G) Schematic diagram showing the domains of human IPMK. IPMK fragments used for the binding studies in (F) are indicated below with the numbers of amino acid sequences. Key domains for inositol binding (IP), kinase activity (SSLL and IDF), and the nuclear localization signal (NLS) are depicted. The specific SMARCB1-binding IPMK fragments (exons 3, 4, and 6) are highlighted in blue.
-
Figure 3—source data 1
Full and unedited blots corresponding to panel B.
- https://cdn.elifesciences.org/articles/73523/elife-73523-fig3-data1-v1.zip
-
Figure 3—source data 2
Full and unedited blots corresponding to panel C.
- https://cdn.elifesciences.org/articles/73523/elife-73523-fig3-data2-v1.zip
-
Figure 3—source data 3
Full and unedited blots corresponding to panel D.
- https://cdn.elifesciences.org/articles/73523/elife-73523-fig3-data3-v1.zip
-
Figure 3—source data 4
Full and unedited blots corresponding to panel F.
- https://cdn.elifesciences.org/articles/73523/elife-73523-fig3-data4-v1.zip
Figure 3—figure supplement 1
Domain maps of the interaction between IPMK and SMARCB1.
(A) IPMK and SMARCB1 domain interaction test in yeast strain AH109 containing the HIS3 reporter gene. Yeast cells were co-transformed with either the GAL4-BD fusion plasmid pGBKT7 or pGBKT7-IPMK and the GAL4-AD fusion plasmid pGADT7 with SMARCB1 deletion constructs or pACT2-SMARCB1. IPMK interacts with 99–245 or 99–319 SMARCB1 deletion constructs, and IPMK does not interact with 99–185 SMARCB1 constructs. The yeast cells were spread on the selection medium lacking leucine and tryptophan (SD-LW) to select co-transformants of bait and prey vectors. Specific interactions between bait and prey proteins were monitored by cell growth on a selection medium lacking leucine, tryptophan, and histidine (SD-LWH). 3-AT (3-amino-1,2,4-triazole) was used to suppress leaky HIS3 expression in transformants to obtain an accurate phenotype. A schematic diagram of the SMARCB1 domain map with the number of amino acid sequences is presented on the right. The IPMK-binding sites (Rpt1 and Rpt2) are highlighted in red. (B, C, and D) HEK293T cells were co-transfected with FLAG-IPMK and GST (a control vector) or GST-SMARCB1 Rpt1 fragments (B and D) and GST-SMARCB1 Rpt2 fragments (C and D), followed by immunoprecipitation with FLAG antibody and subjected to immunoblotting. The specific IPMK-binding Rpt1 (B) and Rpt2 (C) domains are highlighted in red. Arrows and cylinders indicate β sheets and α helices, respectively. (E) HEK293T cells were co-transfected with FLAG-IPMK and GST (a control vector), GST-SMARCB1, or GST-SMARCB1 without Rpt1 and Rpt2 (GST-Δ186–371), followed by immunoprecipitation with FLAG antibody, and then subjected to immunoblotting. (F) Schematic diagram of human SMARCB1 and SMARCB1 without Rpt1 and Rpt2 (Δ186–371). The IPMK-binding sites (Rpt1 and Rpt2) are highlighted in red with the number of amino acid sequences.
-
Figure 3—figure supplement 1—source data 1
Full and unedited images corresponding to panel A.
- https://cdn.elifesciences.org/articles/73523/elife-73523-fig3-figsupp1-data1-v1.zip
-
Figure 3—figure supplement 1—source data 2
Full and unedited blots corresponding to panel B.
- https://cdn.elifesciences.org/articles/73523/elife-73523-fig3-figsupp1-data2-v1.zip
-
Figure 3—figure supplement 1—source data 3
Full and unedited blots corresponding to panel C.
- https://cdn.elifesciences.org/articles/73523/elife-73523-fig3-figsupp1-data3-v1.zip
-
Figure 3—figure supplement 1—source data 4
Full and unedited blots corresponding to panel D.
- https://cdn.elifesciences.org/articles/73523/elife-73523-fig3-figsupp1-data4-v1.zip
-
Figure 3—figure supplement 1—source data 5
Full and unedited blots corresponding to panel E.
- https://cdn.elifesciences.org/articles/73523/elife-73523-fig3-figsupp1-data5-v1.zip
Figure 4 with 2 supplements
IPMK-BRG1 co-localize at promoters-TSSs/enhancers, and IPMK regulates the genomic localization of BRG1.
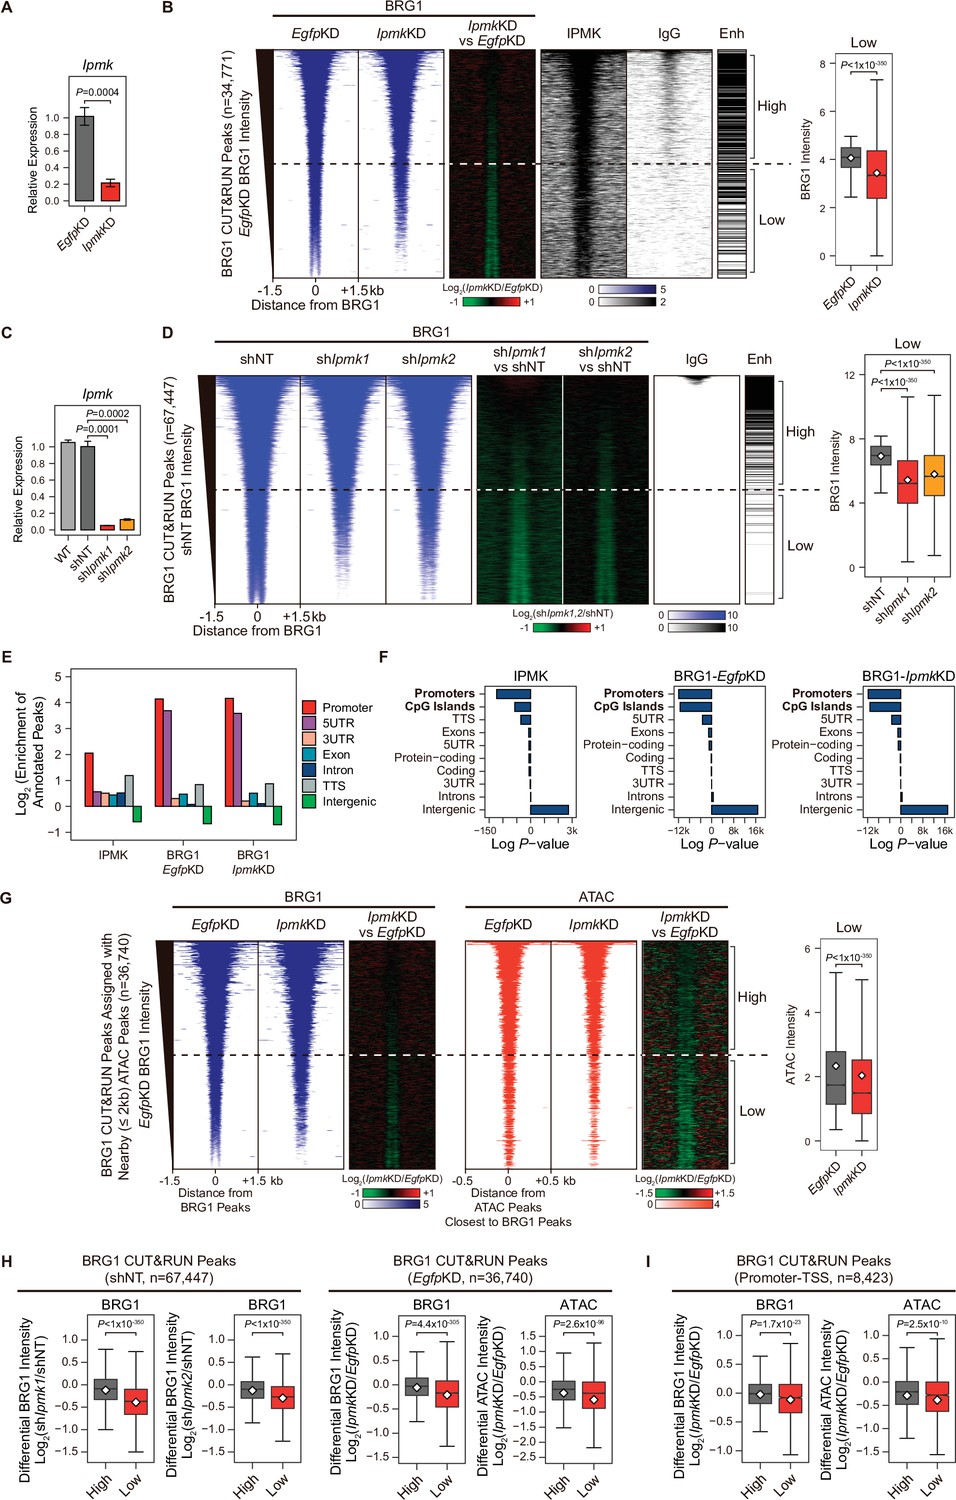
(A) RT-qPCR analysis of Ipmk expression after siRNA treatment. Error bars denote the standard error of the mean obtained from four biological replicates. The expression levels were normalized to the expression of β-actin. P-values were calculated using the Student’s t-test. (B) Heatmaps representing CUT&RUN results for BRG1 (EgfpKD, IpmkKD, and their comparison), IPMK, and IgG, and enhancer (Enh) distribution at BRG1 CUT&RUN peaks (EgfpKD cells) as indicated at the top (left). All heatmaps were aligned at 34,771 BRG1 CUT&RUN peaks (rows) and sorted in descending order by the BRG1 intensity of EgfpKD cells. High and Low groups were divided equally (n = 17,385 and 17,386, respectively) according to the BRG1 intensity of EgfpKD cells. Box plots show the BRG1 intensity at Low BRG1 CUT&RUN peaks (right). (C) RT-qPCR analysis of Ipmk expression in wild-type mESCs (WT) and after shRNA-mediated Ipmk silencing. Error bars denote the standard error of the mean obtained from four biological replicates. The expression levels were normalized to the expression of β-actin. P-values were calculated using the Student’s t-test. (D) Heatmaps representing CUT&RUN results for BRG1 (shNT, shIpmk1, shIpmk2, and their comparison) and IgG, and enhancer (Enh) distribution at BRG1 CUT&RUN peaks (shNT cells) as indicated at the top (left). All heatmaps were aligned at 67,447 BRG1 CUT&RUN peaks (rows) and sorted in descending order by the BRG1 intensity of shNT cells. High and Low groups were divided equally (n = 33,723 and 33,724, respectively) according to the BRG1 intensity of shNT cells. Box plots show the BRG1 intensity at the Low BRG1 CUT&RUN peaks (right). (E) Bar graphs showing the Log2 enrichment of CUT&RUN peaks (IPMK and BRG1-EgfpKD, -IpmkKD) annotated with various regions of the mouse genome. (F) Bar graphs showing the significance (Log P-value) of CUT&RUN peaks (IPMK and BRG1-EgfpKD, -IpmkKD) annotated with various regions of the mouse genome. For each CUT&RUN peak, genome annotations (e.g., promoters or CpG islands) are sorted in descending order according to their significance (P-values, decreasing significance from the top toward the bottom). (G) Heatmaps representing BRG1 CUT&RUN (EgfpKD, IpmkKD, and their comparison) at BRG1 CUT&RUN peaks (EgfpKD cells) assigned with nearby (within 2 kb) ATAC-seq peaks (left). BRG1 peaks without nearby ATAC-seq peaks were excluded. To match the arrangement with ATAC-seq peaks (right), a BRG1 peak containing multiple ATAC-seq peaks was included without deduplication. Heatmaps representing ATAC-seq signals (EgfpKD, IpmkKD, and their comparison) at ATAC-seq peaks assigned with the closest BRG1 CUT&RUN peaks that were used for heatmaps on the left (right). All heatmaps were aligned at 36,740 BRG1 CUT&RUN peaks (left) or 36,740 ATAC-seq peaks (right) and sorted in descending order by the BRG1 intensity of EgfpKD cells. High and Low groups were divided equally (n = 18,370 and 18,370, respectively) according to the BRG1 intensity of EgfpKD cells. Box plots show the BRG1 intensity at the Low BRG1 CUT&RUN peaks (right). (H) Box plots showing the differential BRG1 and ATAC intensity upon IPMK depletion at the High (grey) and Low (red) BRG1 CUT&RUN peaks and corresponding (closest) ATAC-seq peaks. High and Low groups were divided according to the BRG1 intensity of shNT (left) or EgfpKD (right) cells. (I) Box plots showing the differential BRG1 (left) and ATAC (right) intensity upon IpmkKD at the High (grey) and Low (red) BRG1 CUT&RUN peaks localized at promoters-TSSs (left) and corresponding (closest) ATAC-seq peaks (right). High and Low groups (n = 5640 and 2783, respectively) were derived from (G). (B, D, G, H and I) P-values were calculated using the Wilcoxon rank sum test.
-
Figure 4—source data 1
Primary data for graph in panel A.
- https://cdn.elifesciences.org/articles/73523/elife-73523-fig4-data1-v1.xlsx
-
Figure 4—source data 2
Primary data for graph in panel C.
- https://cdn.elifesciences.org/articles/73523/elife-73523-fig4-data2-v1.xlsx
Figure 4—figure supplement 1
Chromatin fraction assay and BRG1 at enhancers.
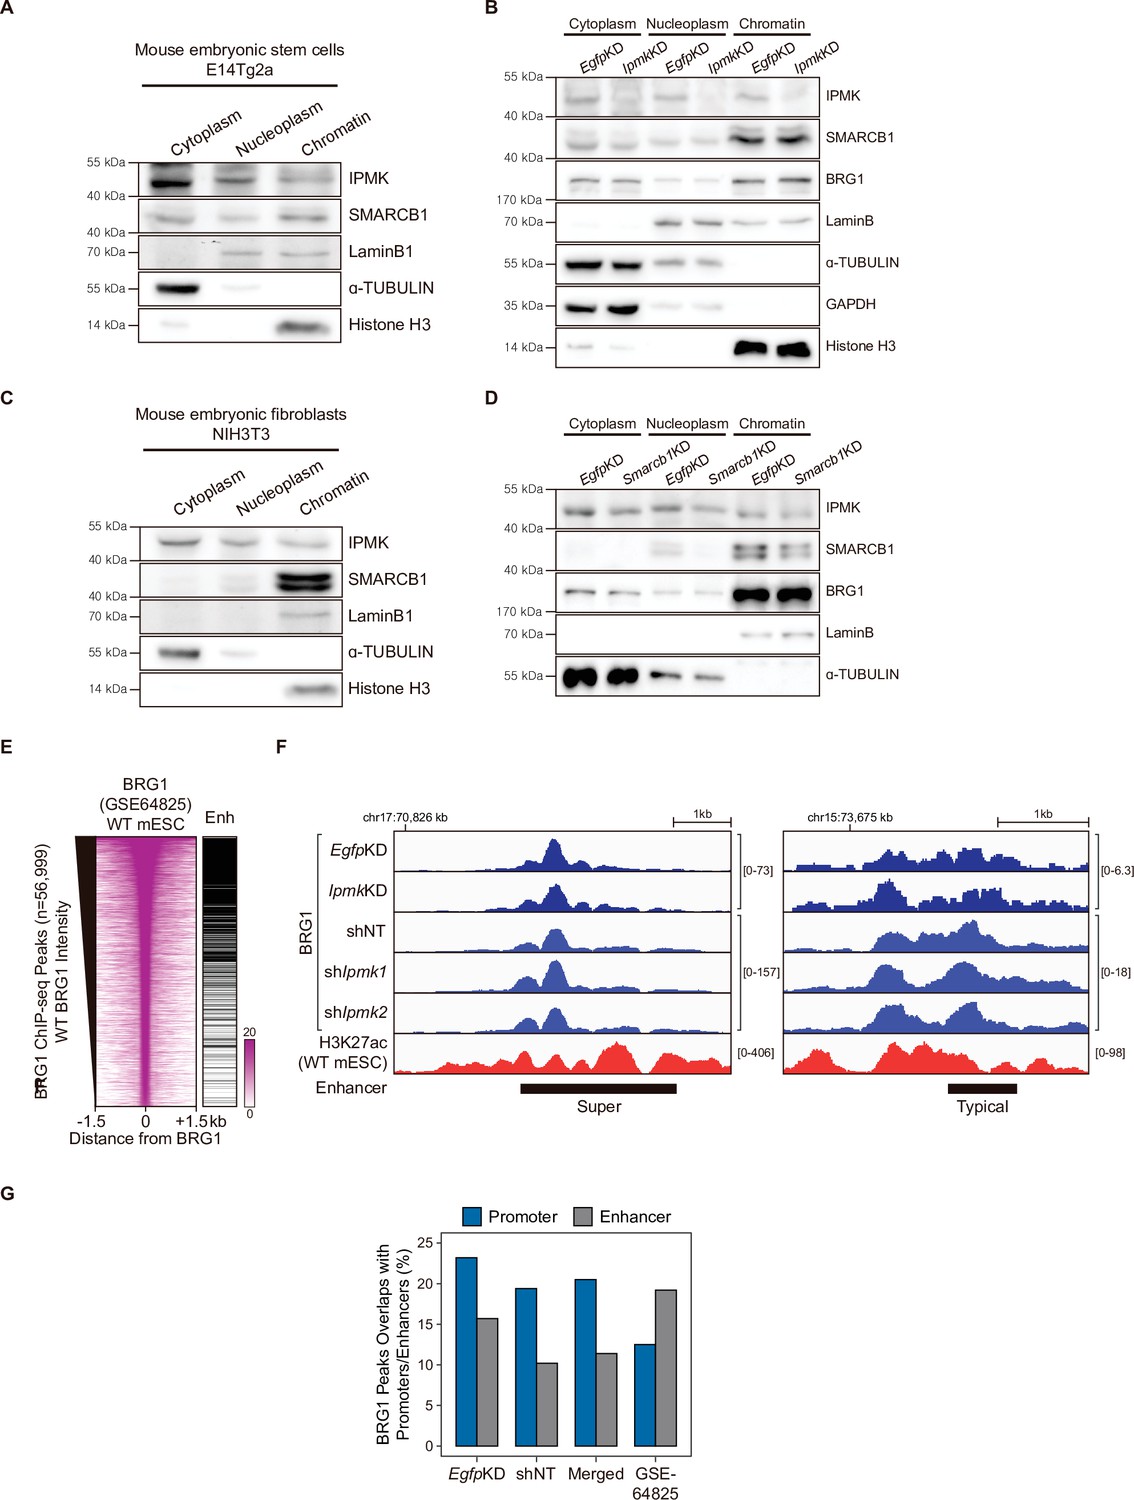
(A) E14Tg2a cells were fractionated into cytoplasm, nucleoplasm, and chromatin fractions. Immunoblotting was performed with IPMK, SMARCB1, and fractionation markers. (B) E14Tg2a cells were transfected with siRNA against Egfp (EgfpKD) and Ipmk (IpmkKD) and then fractionated into cytoplasm, nucleoplasm, and chromatin fractions. Immunoblotting was performed with IPMK, SMARCB1, BRG1, and fractionation markers. (C) NIH3T3 cells were fractionated into cytoplasm, nucleoplasm, and chromatin fractions. Immunoblotting was performed with IPMK, SMARCB1, and fractionation markers. (D) NIH3T3 cells were transfected with siRNA against Egfp (EgfpKD) and Smarcb1 (Smarcb1KD) and then fractionated into cytoplasm, nucleoplasm, and chromatin fractions. Immunoblotting was performed with IPMK, SMARCB1, BRG1, and fractionation markers. (E) Heatmaps representing BRG1 intensity in WT mESCs and enhancer (Enh) distribution at BRG1 ChIP-seq peaks as indicated at the top. All heatmaps were aligned at 56,999 BRG1 ChIP-seq peaks (rows) and sorted in descending order by the BRG1 intensity of WT mESCs. (F) Examples of BRG1 (EgfpKD, IpmkKD, shNT, shIpmk1, and shIpmk2), CUT&RUN, and H3K27ac ChIP-seq (WT mESCs) assays at super (left) and typical (right) enhancers. (G) Bar graphs showing the percentage of BRG1 peaks (CUT&RUN and ChIP-seq) overlapping with promoters and enhancers.
-
Figure 4—figure supplement 1—source data 1
Full and unedited blots corresponding to panel A.
- https://cdn.elifesciences.org/articles/73523/elife-73523-fig4-figsupp1-data1-v1.zip
-
Figure 4—figure supplement 1—source data 2
Full and unedited blots corresponding to panel B.
- https://cdn.elifesciences.org/articles/73523/elife-73523-fig4-figsupp1-data2-v1.zip
-
Figure 4—figure supplement 1—source data 3
Full and unedited blots corresponding to panel C.
- https://cdn.elifesciences.org/articles/73523/elife-73523-fig4-figsupp1-data3-v1.zip
-
Figure 4—figure supplement 1—source data 4
Full and unedited blots corresponding to panel D.
- https://cdn.elifesciences.org/articles/73523/elife-73523-fig4-figsupp1-data4-v1.zip
Figure 4—figure supplement 2
mRNA expression of SWI/SNF complex subunits, replicates of BRG1 CUT&RUN and ATAC-seq, and IPMK rescue experiments.
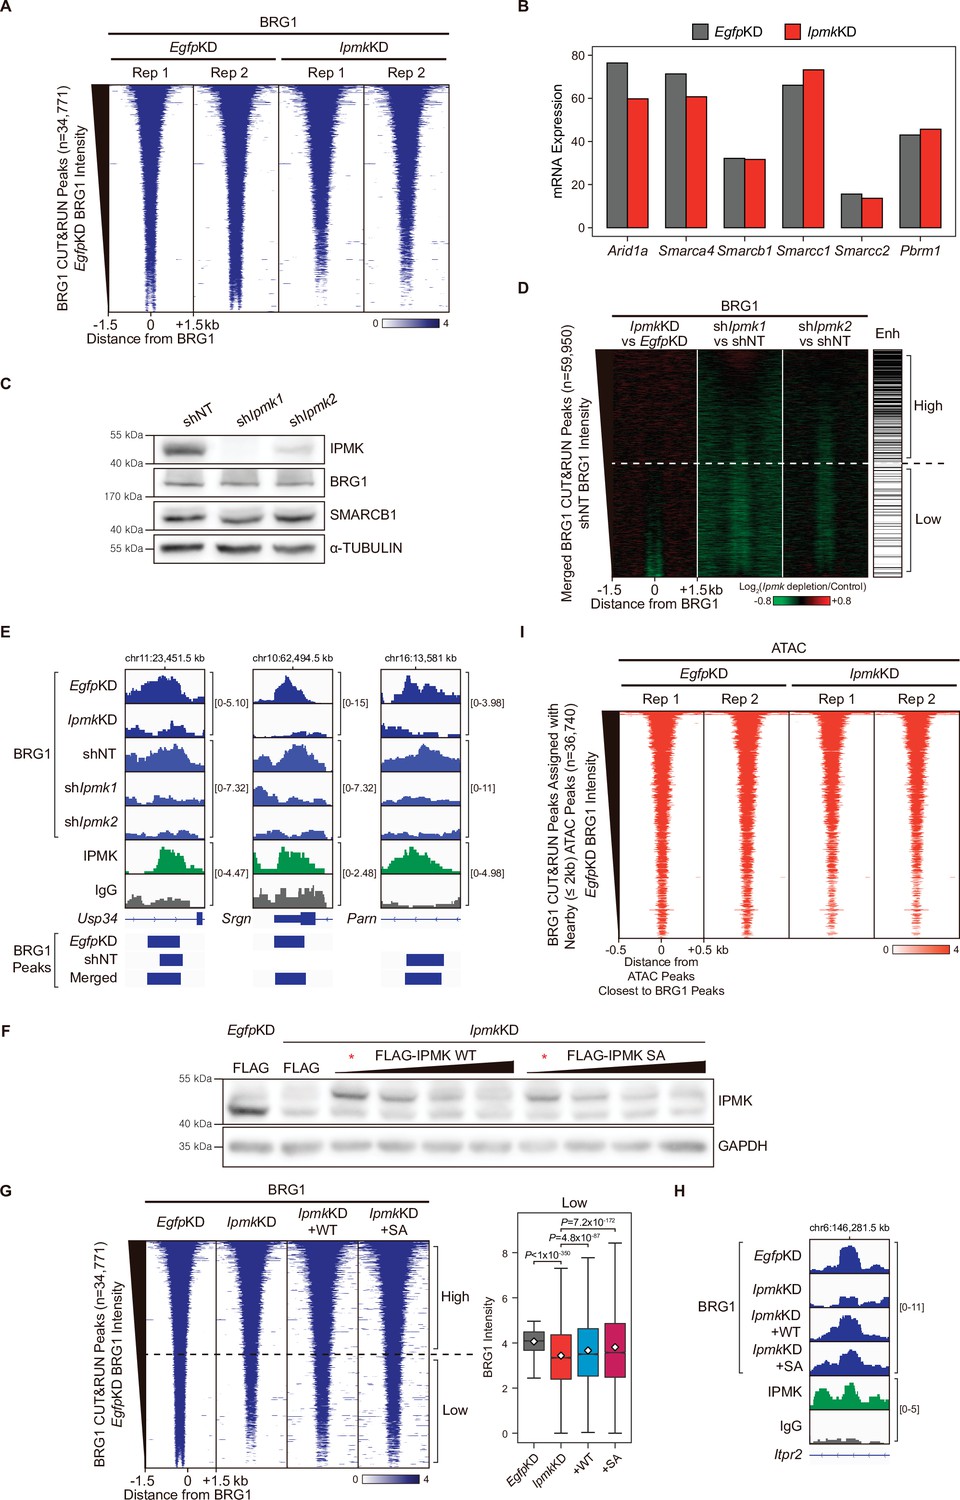
(A) Heatmaps representing CUT&RUN results for BRG1 replicates (EgfpKD and IpmkKD) at BRG1 CUT&RUN peaks (EgfpKD cells) as indicated at the top. All heatmaps were aligned at 34,771 BRG1 CUT&RUN peaks (rows) and sorted in descending order by the BRG1 intensity of EgfpKD cells. (B) mRNA expression of subunits of SWI/SNF complex after siRNA treatment. (C) The mESCs with constitutive Ipmk knockdown were established by shRNA-mediated Ipmk silencing. shNT denotes a non-target control and shIpmk1 and shIpmk2 target two different Ipmk sequences. Immunoblotting was performed with IPMK, BRG1, SMARCB1, and α-TUBULIN. (D) Heatmaps representing the differential BRG1 intensity upon IPMK depletion and enhancer (Enh) distribution at merged BRG1 CUT&RUN peaks (EgfpKD and shNT cells) as indicated at the top. All heatmaps were aligned at 59,950 BRG1 CUT&RUN peaks (rows) and sorted in descending order by the BRG1 intensity of shNT cells. (E) Examples of BRG1 (EgfpKD, IpmkKD, shNT, shIpmk1, and shIpmk2), IPMK, and IgG CUT&RUN assays at various BRG1 peaks (bottom). (F) E14Tg2a cells were transfected with siRNA against Egfp (EgfpKD) and Ipmk (IpmkKD) and then transfected with FLAG-IPMK WT, SA, or FLAG (a control vector). Immunoblotting was performed with anti-IPMK and anti-GAPDH antibodies. Lanes denoted with asterisks (*) are the selected transfection amount for CUT&RUN experiments. (G) Heatmaps representing CUT&RUN results for BRG1 (EgfpKD, IpmkKD, IpmkKD +WT, IpmkKD +SA) at BRG1 CUT&RUN peaks (EgfpKD cells) as indicated at the top (left). All heatmaps were aligned at 34,771 BRG1 CUT&RUN peaks (rows) and sorted in descending order by the BRG1 intensity of EgfpKD cells. High and Low groups were divided equally (n = 17,385 and 17,386, respectively) according to the BRG1 intensity of EgfpKD cells. Box plots showing the BRG1 intensity at Low BRG1 CUT&RUN peaks (right). (H) Examples of BRG1 (EgfpKD, IpmkKD, IpmkKD +WT, IpmkKD +SA), IPMK, and IgG CUT&RUN assays at a BRG1 peak. (I) Heatmaps representing ATAC-seq replicates (EgfpKD and IpmkKD) at ATAC-seq peaks assigned with the closest BRG1 CUT&RUN peaks. All heatmaps were aligned at 36,740 ATAC-seq peaks and sorted in descending order by the BRG1 intensity of EgfpKD cells as described in Figure 4G.
-
Figure 4—figure supplement 2—source data 1
Full and unedited blots corresponding to panel C.
- https://cdn.elifesciences.org/articles/73523/elife-73523-fig4-figsupp2-data1-v1.zip
-
Figure 4—figure supplement 2—source data 2
Full and unedited blots corresponding to panel F.
- https://cdn.elifesciences.org/articles/73523/elife-73523-fig4-figsupp2-data2-v1.zip
Figure 5 with 1 supplement
IPMK affects chromatin accessibility at promoter-TSS by regulating BRG1 localization.
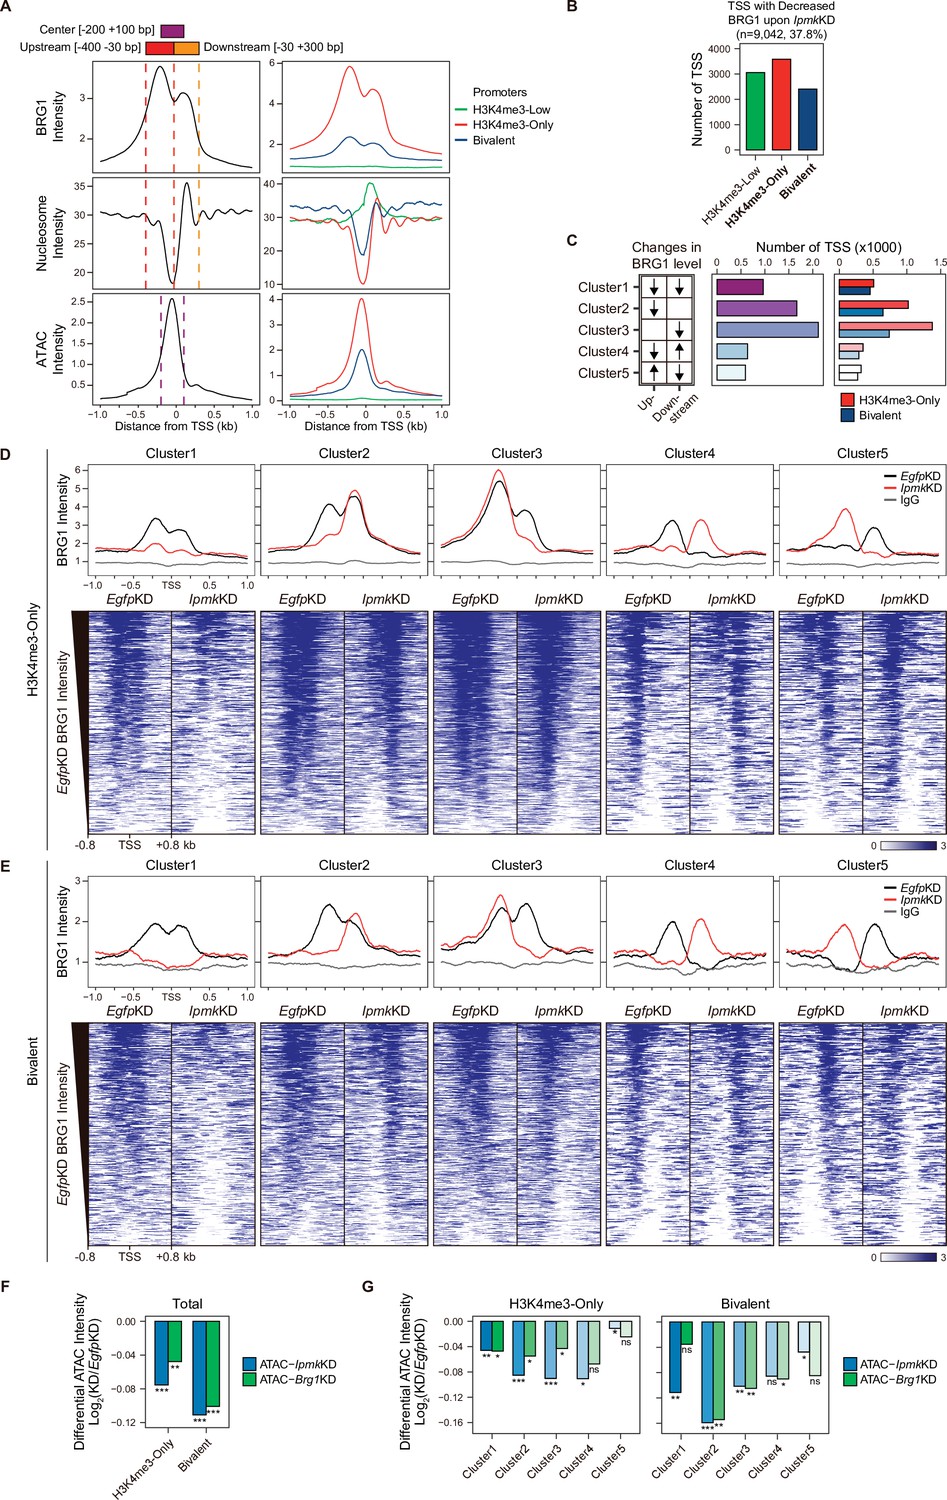
(A) Line plots showing the average enrichment of BRG1, nucleosome (MNase-seq, GSM5253962, and GSM5253963), and ATAC-seq signals (ATAC) at the TSSs of total genes (left) and TSSs of three promoter types (right). Three genomic regions, indicated at the top (see also dotted lines on the left), were defined according to the relative position of enriched ATAC-seq intensity (Center, purple) and enriched BRG1 intensity (Upstream and Downstream, red and orange, respectively). Green, red, and blue lines on the right indicate H3K4me3-Low, H3K4me3-Only, and bivalent promoters, respectively. (B) Bar graphs showing the number of TSSs exhibiting decreased BRG1 intensity upon IpmkKD with different promoter types. (C) A diagram displaying five clusters of TSSs classified by changes in the BRG1 level at Up/Downstream regions defined in (A) upon IpmkKD (left). Downward and upward arrows indicate decreased and increased BRG1 levels upon IpmkKD, respectively. Bar graphs showing the number of five TSS clusters (middle) with different promoter types (right). (D) Line plots showing the average enrichment of BRG1 (EgfpKD and IpmkKD) and IgG at five TSS clusters with H3K4me3-Only promoters (top). Heatmaps representing BRG1 intensity (EgfpKD and IpmkKD) at five TSS clusters as indicated at the top (bottom). (E) Line plots showing the average enrichment of BRG1 (EgfpKD and IpmkKD) and IgG at five TSS clusters with bivalent promoters (top). Heatmaps representing BRG1 intensity (EgfpKD and IpmkKD) at five TSS clusters as indicated at the top (bottom). (D and E) Black, red, and gray lines indicate BRG1 intensity with EgfpKD, IpmkKD, and IgG intensity, respectively. All heatmaps are shown in descending order by the BRG1 intensity of EgfpKD cells. (F) Bar graphs showing the average differential ATAC-seq intensity (Log2 KD/EgfpKD) upon IpmkKD (blue) and Brg1KD (green) at the TSSs of two promoter types. (G) Bar graphs showing the average differential ATAC-seq intensity (Log2 KD/EgfpKD) upon IpmkKD (blue) and Brg1KD (green) at five TSS clusters with H3K4me3-Only (left) and bivalent promoters (right). (F and G) *p < 0.01, **p < 1 × 10⁻⁴, ***p < 1 × 10⁻¹⁰; ns, not significant; Wilcoxon signed rank test.
Figure 5—figure supplement 1
IPMK plays an important role in the maintenance of chromatin accessibility at promoter-TSS by regulating BRG1 localization.
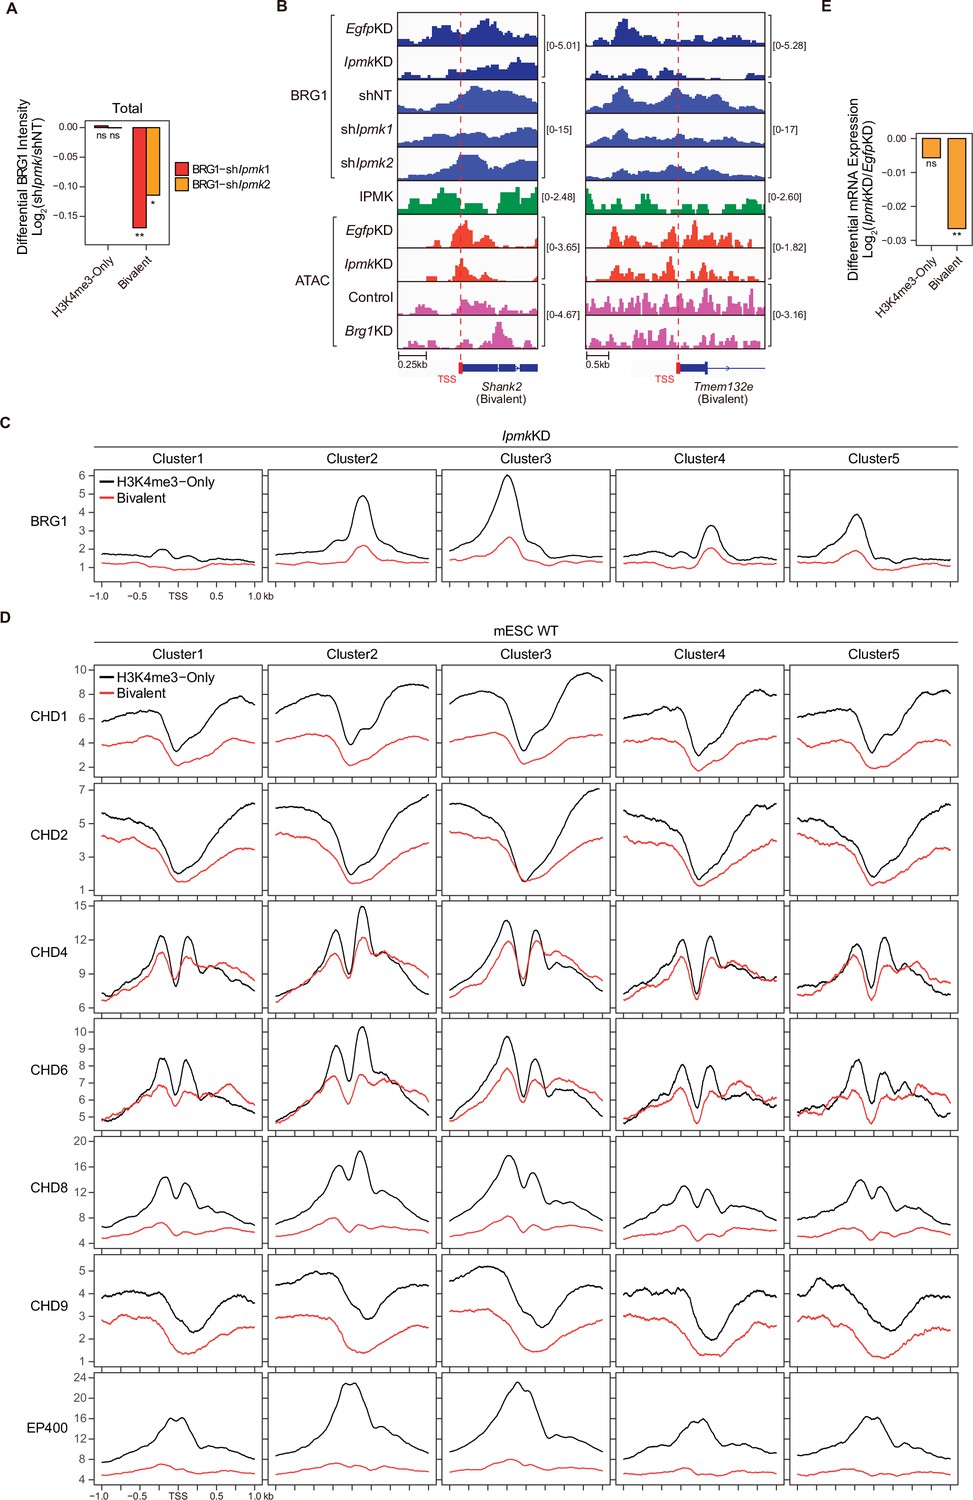
(A) Bar graphs showing the average differential BRG1 intensity (Log2 shIpmk1,2/shNT) upon shRNA-mediated Ipmk silencing at merged TSS clusters (five TSS clusters in Figure 5) with two promoter types. *p < 1 × 10–40, **p < 1 × 10–80; ns, not significant; Wilcoxon signed rank test. (B) Examples of BRG1 (EgfpKD, IpmkKD, shNT, shIpmk1, and shIpmk2) and IPMK, CUT&RUN, and ATAC-seq (EgfpKD, IpmkKD, Control, and Brg1KD) assays at the TSS of Shank2 (left) and Tmem132e (right). TSSs are marked with red boxes (bottom) and dotted lines. (C) Line plots showing the average enrichment of BRG1 (IpmkKD) at five TSS clusters with H3K4me3-Only promoters (black) and bivalent promoters (red). (D) Line plots showing the average enrichment of chromatin remodelers (mESC WT) at five TSS clusters with H3K4me3-Only promoters (black) and bivalent promoters (red). (E) Bar graphs showing the average differential mRNA expression (Log2 IpmkKD/EgfpKD) upon IpmkKD at the TSS (TSS exhibiting decreased BRG1 intensity upon IpmkKD) with two promoter types. *p < 0.01, **p < 1 × 10⁻⁴, ***p < 1 × 10⁻¹⁰; ns, not significant; Wilcoxon signed rank test.
Figure 6 with 1 supplement
Alterations in BRG1/ATAC upon IpmkKD affect gene expression.
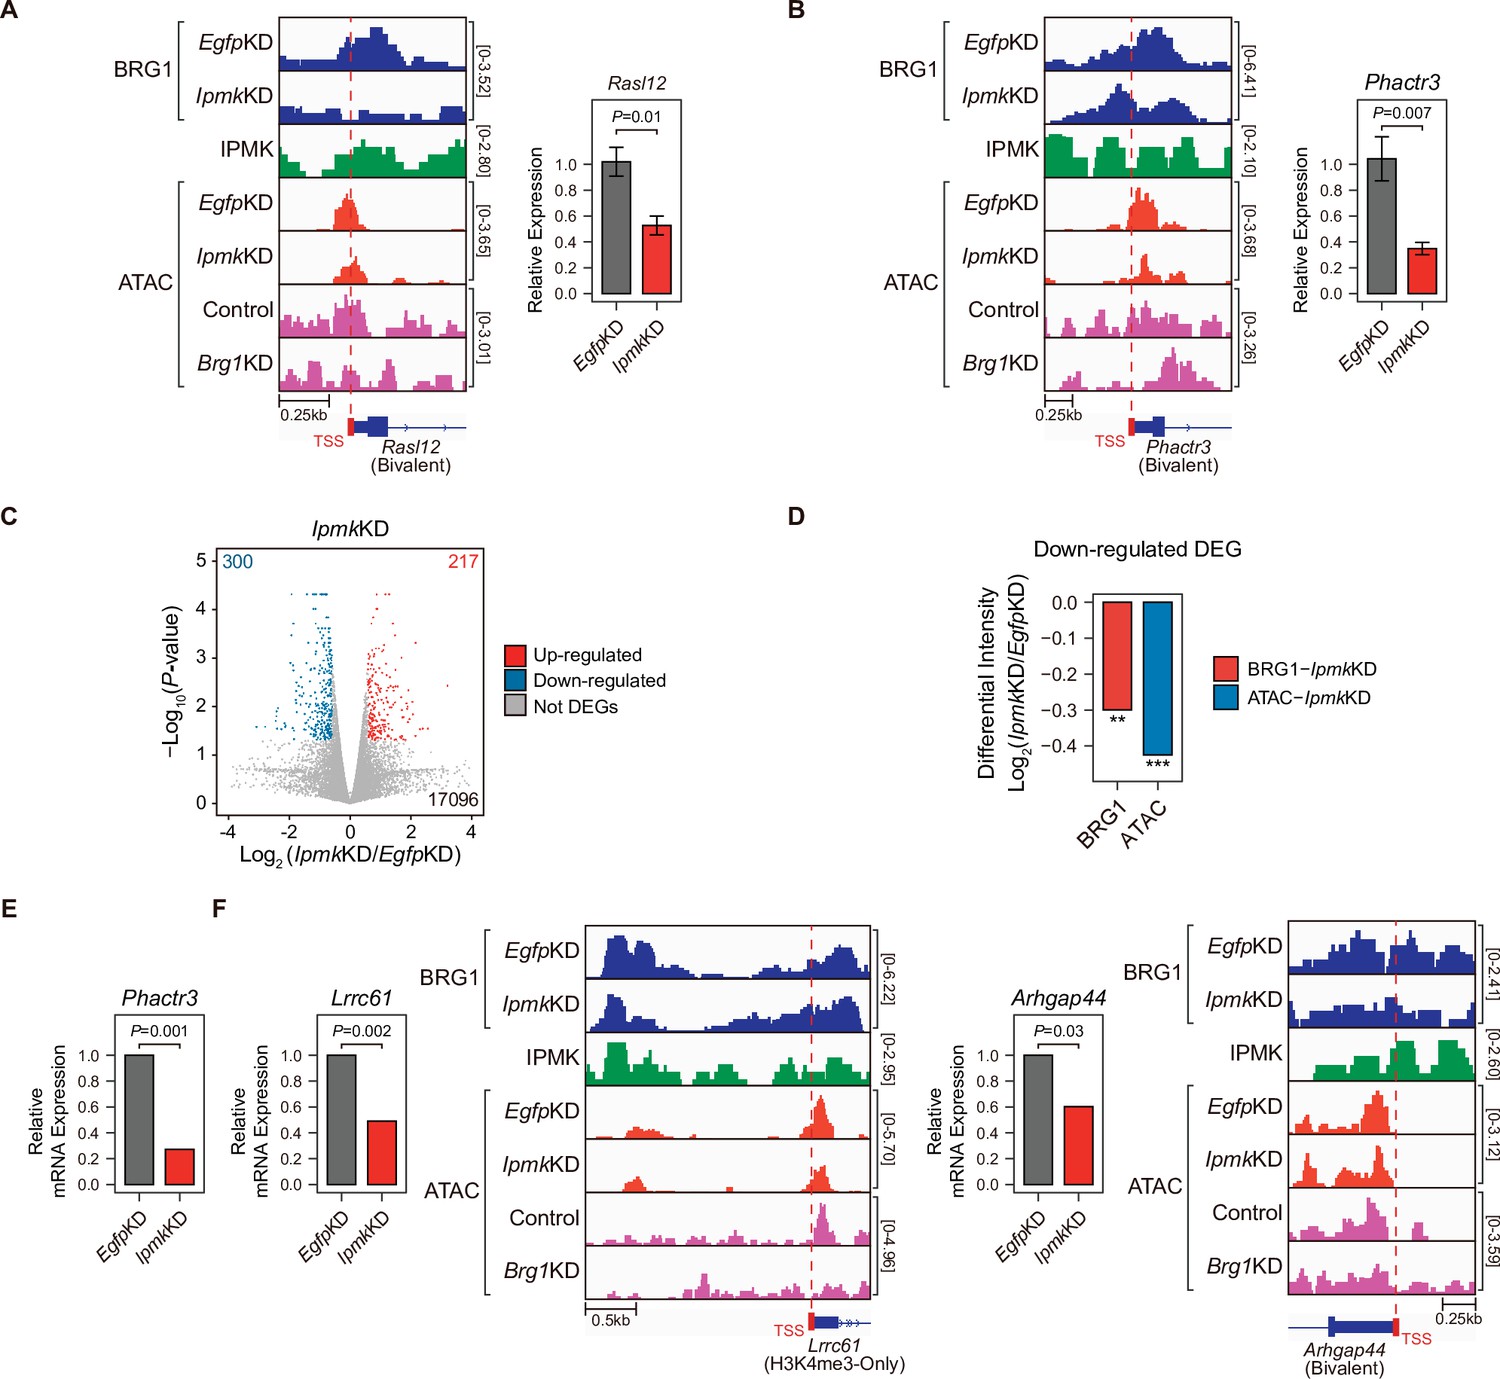
(A and B) Examples of BRG1 (EgfpKD and IpmkKD), IPMK CUT&RUN, and ATAC-seq (EgfpKD, IpmkKD, Control, and Brg1KD) assays at the TSSs of Rasl12 (A) and Phactr3 (B). The TSSs are marked with red boxes (bottom) and dotted lines. The graphs indicate RT-qPCR analysis of Rasl12 (A) and Phactr3 (B) expression after siRNA treatment. Error bars denote the standard error of the mean obtained from four biological replicates. The expression levels were normalized to the expression of β-actin. P-values were calculated using the Student’s t-test. (C) Volcano plots showing the differentially expressed genes (DEGs) upon IpmkKD based on the mRNA-seq data. Red and blue dots indicate significant up- and down-regulation, respectively (p ≤ 0.05 and fold change ≥1.5). (D) Bar graphs showing the average differential BRG1 (red) and ATAC-seq (blue) intensity upon IpmkKD at BRG1 CUT&RUN peaks (for BRG1 intensity) and ATAC-seq peaks (for ATAC intensity) that are closest (within 2 kb for BRG1 peaks and within 500 bp for ATAC-seq peaks) to the TSSs of the down-regulated DEGs. **p < 1 × 10⁻⁵, ***p < 1 × 10⁻¹⁰, Wilcoxon signed rank test. (E) mRNA-seq analysis of Phactr3 expression after siRNA treatment. P-values were calculated using the Student’s t-test. (F) Examples of BRG1 (EgfpKD and IpmkKD), IPMK CUT&RUN, and ATAC-seq (EgfpKD, IpmkKD, Control, and Brg1KD) assays at the TSSs of Lrrc61 (left) and Arhgap44 (right). The BRG1 CUT&RUN peaks (EgfpKD cells) and ATAC-seq peaks are marked at the top with blue and green boxes, respectively. TSSs are marked with red boxes (bottom) and dotted lines. mRNA-seq analysis of Lrrc61 (left) and Arhgap44 (right) expression after siRNA treatment. P-values were calculated using the Student’s t-test.
-
Figure 6—source data 1
Primary data for graph in panel A.
- https://cdn.elifesciences.org/articles/73523/elife-73523-fig6-data1-v1.xlsx
-
Figure 6—source data 2
Primary data for graph in panel B.
- https://cdn.elifesciences.org/articles/73523/elife-73523-fig6-data2-v1.xlsx
-
Figure 6—source data 3
Primary data for graph in panel E.
- https://cdn.elifesciences.org/articles/73523/elife-73523-fig6-data3-v1.xlsx
-
Figure 6—source data 4
Primary data for graphs in panel F.
- https://cdn.elifesciences.org/articles/73523/elife-73523-fig6-data4-v1.xlsx
Figure 6—figure supplement 1
Alterations in BRG1/ATAC upon IpmkKD affect gene expression.
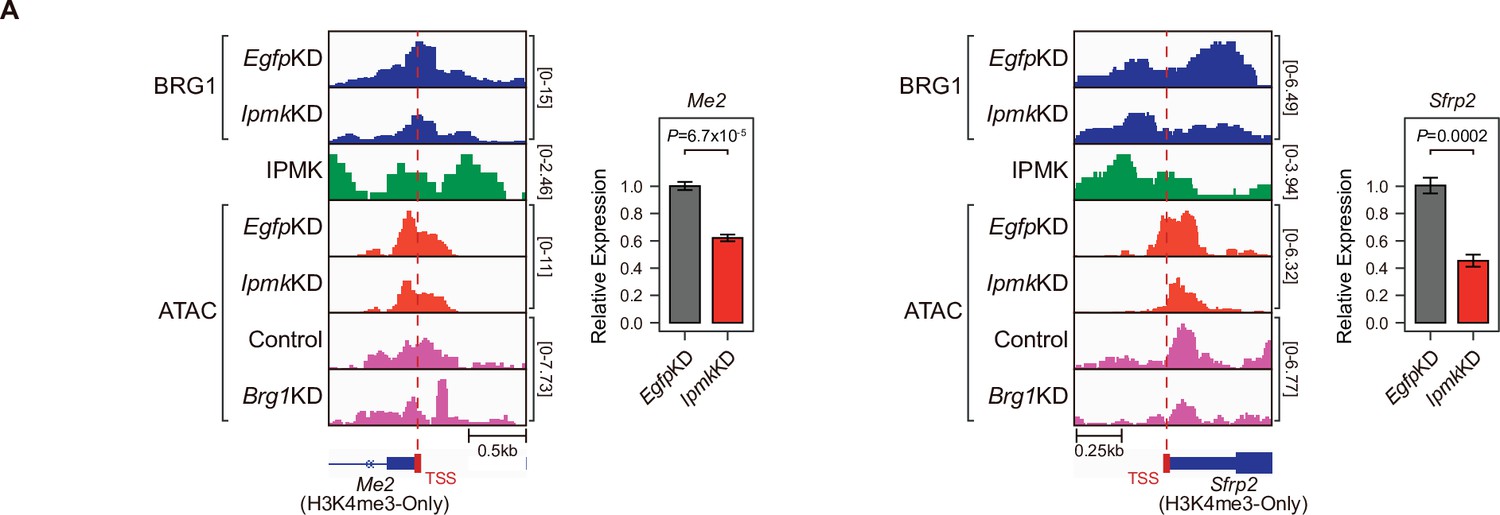
(A) Examples of BRG1 (EgfpKD and IpmkKD), IPMK CUT&RUN, and ATAC-seq (EgfpKD, IpmkKD, Control, and Brg1KD) assays at the TSS of Me2 (left) and Sfrp2 (right). TSSs are marked with red boxes (bottom) and dotted lines. The graphs are RT-qPCR analysis of Me2 (left) and Sfrp2 (right) expression after siRNA treatment. Error bars denote the standard error of the mean obtained from four biological replicates. The expression levels were normalized to the expression of β-actin. P-values were calculated using Student’s t-test.
-
Figure 6—figure supplement 1—source data 1
Primary data for graphs in panel A.
- https://cdn.elifesciences.org/articles/73523/elife-73523-fig6-figsupp1-data1-v1.xlsx
Figure 7 with 1 supplement
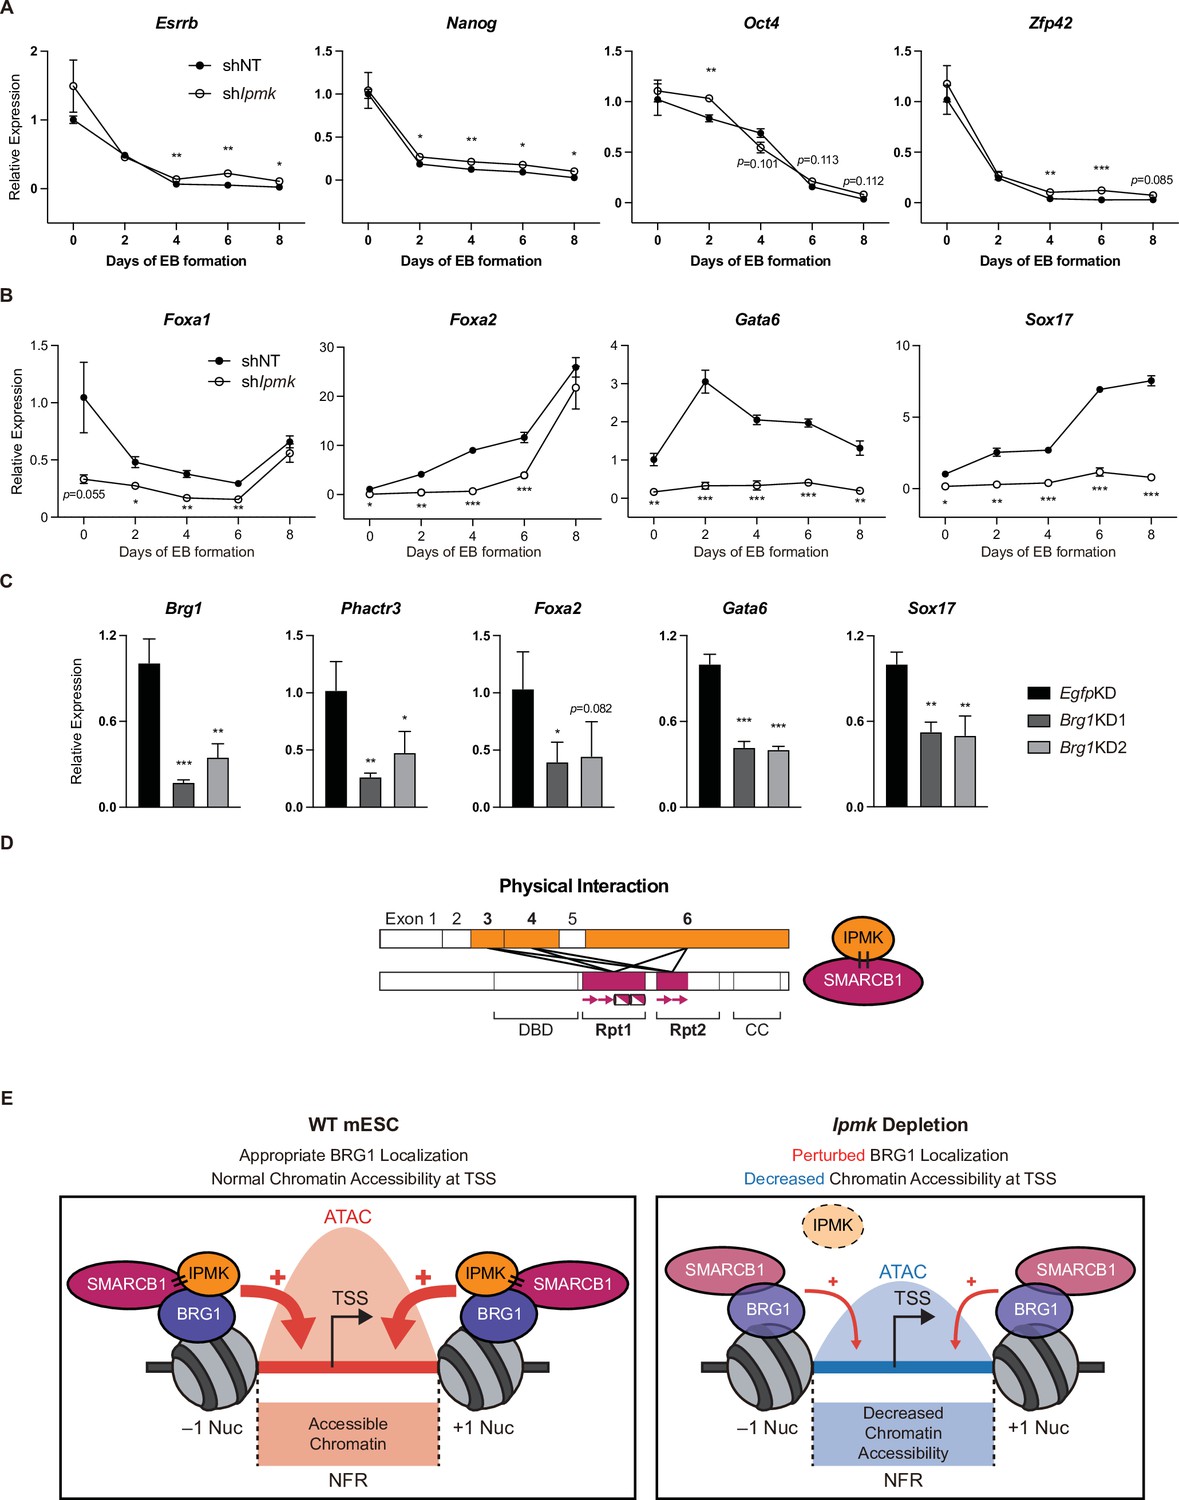
Effect of IPMK on the expression of endodermal marker genes and our proposed model depicting the function of IPMK.
(A and B) RT-qPCR analysis of the expression of pluripotency (A) and endodermal (B) marker genes after shRNA-mediated Ipmk silencing at the indicated time points during embryoid body (EB) formation. Data are representative of at least three independent experiments and error bars denote the standard error of the mean obtained from three biological replicates. The expression levels were normalized to the expression of Arbp. (C) RT-qPCR analysis of Brg1, Phactr3, and endodermal marker gene expression after siRNA treatment (two different siRNAs against Brg1). Error bars denote the standard error of the mean obtained from four biological replicates. The expression levels were normalized to the expression of β-actin. (A–C) *p < 0.05, **p < 0.01, ***p < 0.001, Student’s t-test. (D) A model displaying the physical interactions between IPMK and SMARCB1 (left). For these physical interactions, exons 3, 4, and 6 of IPMK (orange boxes) and the Rpt1 and Rpt2 (particularly N-terminal β sheets) domains of SMARCB1 (red boxes) are required. An additional model showing our speculation of the position of IPMK directly interacting with SMARCB1, BRG1, and BAF155 (right) within the SWI/SNF complex. (E) In wild-type mESCs (left), IPMK regulates appropriate BRG1 localization (probably via physical interaction with various subunits of the SWI/SNF complex) and chromatin accessibility at the nucleosome free region (NFR) of the TSS. Upon Ipmk depletion (right), BRG1 localization is perturbed, resulting in decreased chromatin accessibility at the NFR of TSSs.
-
Figure 7—source data 1
Primary data for graphs in panel A.
- https://cdn.elifesciences.org/articles/73523/elife-73523-fig7-data1-v1.xlsx
-
Figure 7—source data 2
Primary data for graphs in panel B.
- https://cdn.elifesciences.org/articles/73523/elife-73523-fig7-data2-v1.xlsx
-
Figure 7—source data 3
Primary data for graphs in panel C.
- https://cdn.elifesciences.org/articles/73523/elife-73523-fig7-data3-v1.xlsx
Figure 7—figure supplement 1
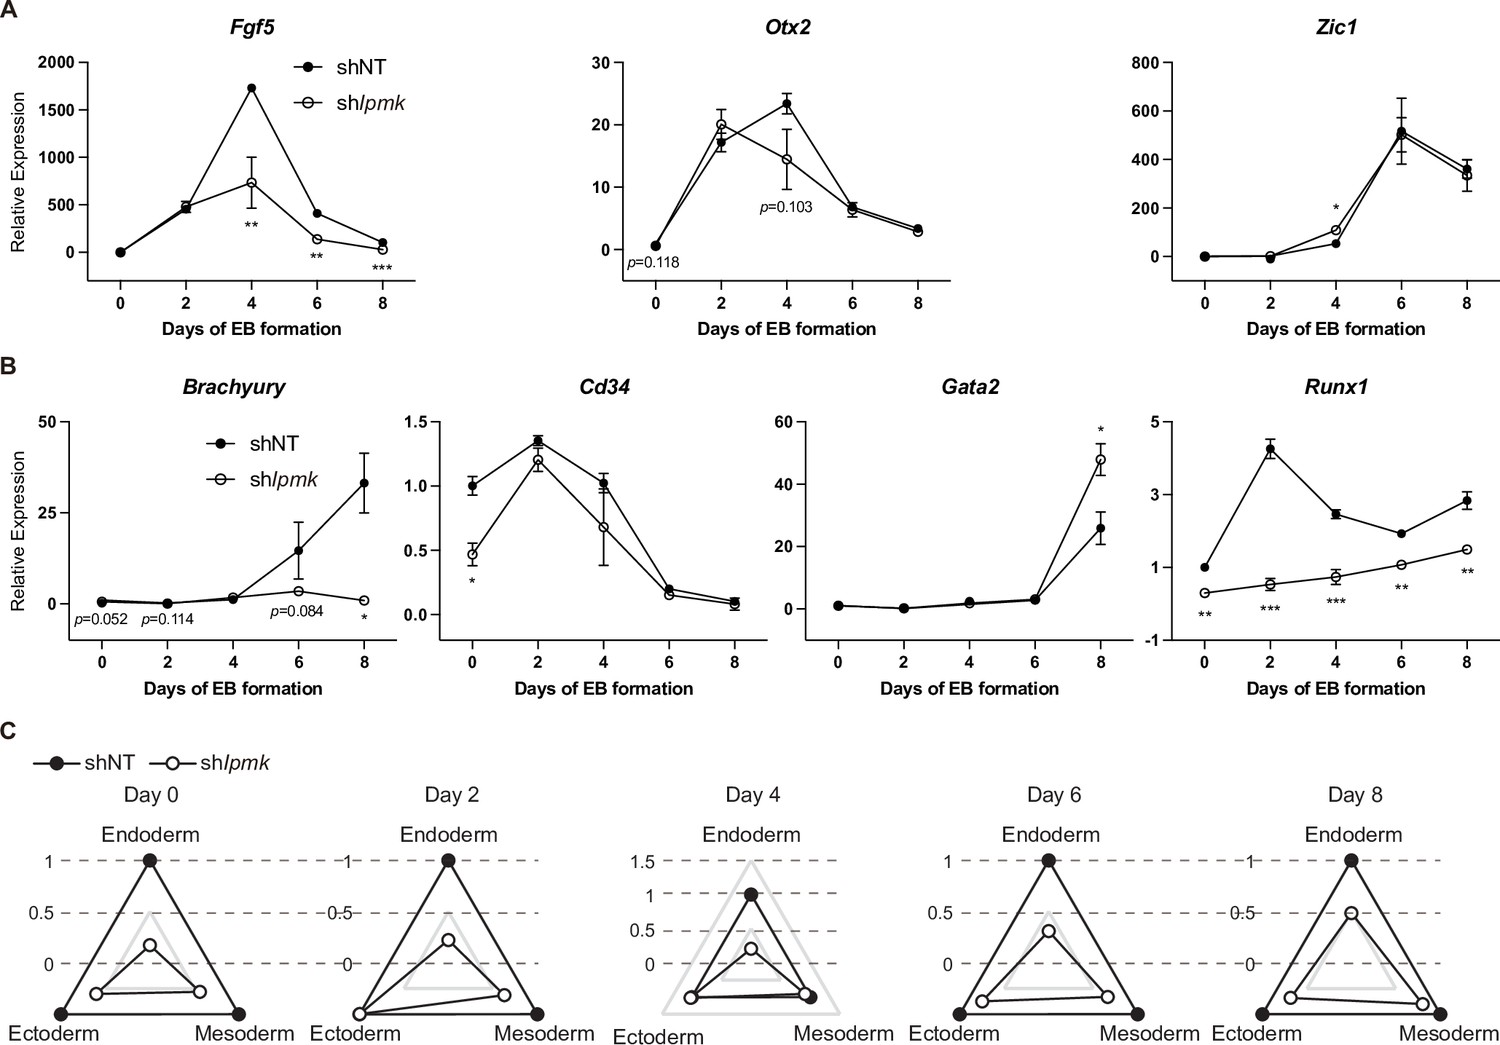
Effect of IPMK and BRG1 on ectodermal and mesodermal marker genes and proposed model depicting the physical interaction of IPMK and nucleosome-bound SWI/SNF complex.
(A and B) RT-qPCR analysis of ectodermal (A) and mesodermal (B) marker expression after shRNA-mediated Ipmk silencing at the indicated time points during EB formation. Data are representative of at least three independent experiments and error bars denote the standard error of the mean obtained from three biological replicates. The expression levels were normalized to the expression of Arbp. *p < 0.05, **p < 0.01, ***p < 0.001, Student’s t-test. (C) Radar graphs showing the relative differentiation patterns of EBs regarding the three germ layers at the indicated time points. The values were calculated as the average relative expression of representative genes listed in Figure 7B and (A, B) and B.
-
Figure 7—figure supplement 1—source data 1
Primary data for graphs in panel A.
- https://cdn.elifesciences.org/articles/73523/elife-73523-fig7-figsupp1-data1-v1.xlsx
-
Figure 7—figure supplement 1—source data 2
Primary data for graphs in panel B.
- https://cdn.elifesciences.org/articles/73523/elife-73523-fig7-figsupp1-data2-v1.xlsx
-
Figure 7—figure supplement 1—source data 3
Primary data for graphs in panel C.
- https://cdn.elifesciences.org/articles/73523/elife-73523-fig7-figsupp1-data3-v1.xlsx
Author response image 1
Tables
Appendix 1—key resources table
| Reagent type (species) or resource | Designation | Source or reference | Identifiers | Additional information |
|---|---|---|---|---|
| Gene (Homo-sapiens) | IPMK | Open Biosystems | NCBI Gene ID 253430 | |
| Gene (Homo-sapiens) | SMARCB1 | Bioneer | NCBI Gene ID 6598 | |
| Strain, strain background (Escherichia coli) | DH5α | Enzynomics | Cat# CP010 | |
| Cell line (Saccharomyces cerevisiae) | AH109 | Clontech | See Materials and methods. Cell line maintained in Panbionet. | |
| Cell line (M. musculus) | E14Tg2a | ATCC | Cat# CRL-1821 | |
| Cell line (M. musculus) | MEF | This paper | See Materials and methods. Cell line maintained in S. Kim lab. | |
| Cell line (M. musculus) | NIH3T3 | ATCC | Cat# CRL-1658 | |
| Cell line (Homo-sapiens) | HEK293T | ATCC | Cat# CRL-3216 | |
| Cell line (Homo-sapiens) | Flp-In T-REx–293 | Invitrogen | Cat# R78007 | |
| Cell line (Spodoptera frgiperda) | Sf9 | Invitrogen | Cat# 11496015 | |
| Transfected construct (M. musculus) | siRNA to Egfp | Bioneer | transfected construct (mouse) | |
| Transfected construct (M. musculus) | siRNA to Ipmk | Bioneer | transfected construct (mouse) | |
| Transfected construct (M. musculus) | siRNA to Smarcb1 | Dharmacon/Thermo Fisher Scientific | Cat# 4390771 | transfected construct (mouse) |
| Transfected construct (M. musculus) | siRNA to Brg1 | Bioneer | transfected construct (mouse) | |
| Antibody | anti-FLAG (Mouse monoclonal) | Sigma Aldrich | Cat# F1804 | WB (1:1000) |
| Antibody | anti-SMARCB1 (Rabbit polyclonal) | Bethyl | Cat# A301-087 | WB (1:1000) IP (3 ug) |
| Antibody | anti-BRG1 (Rabbit monoclonal) | Abcam | Cat# Ab110641 | WB (1:1000) |
| Antibody | anti-BAF155 (Rabbit monoclonal) | Cell Signaling Technology | Cat# 11,956 | WB (1:1000) |
| Antibody | anti-BAF170 (Rabbit monoclonal) | Cell Signaling Technology | Cat# 12,760 | WB (1:1000) |
| Antibody | anti-BAF250A (Rabbit monoclonal) | Cell Signaling Technology | Cat# 12,354 | WB (1:1000) |
| Antibody | anti-PBAF/PBRM (Rabbit polyclonal) | Bethyl | Cat# A301-591A | WB (1:1000) |
| Antibody | anti- α-Tubulin (Mouse monoclonal) | Sigma Aldrich | Cat# T5169 | WB (1:3000) |
| Antibody | anti-IPMK (Rabbit polyclonal) | custom rabbit polyclonal | DOI: 10.1126/sciadv.1602296 | WB (1:1000) IP (3 ug) |
| Antibody | anti-GST (Rabbit polyclonal) | Cell Signaling Technology | Cat# 2,622 | WB (1:1000) |
| Antibody | anti-Histone H3 (mouse monoclonal) | Sigma Aldrich | 05–499 | WB (1:3000) |
| Antibody | anti-GAPDH (mouse monoclonal) | Santa Cruz Biotech | Cat# sc-32233 | WB (1:3000) |
| Antibody | anti-LaminB1 (mouse monoclonal) | Santa Cruz Biotech | Cat# sc-365214 | WB (1:1000) |
| Antibody | anti-DPF2 (rabbit polyclonal) | Abcam | Cat# ab128149 | WB (1:1000) |
| Antibody | anti-SMARCE1 (rabbit monoclonal) | Abcam | Cat# ab137081 | WB (1:1000) |
| Antibody | anti-SS18L1 (rabbit polyclonal) | Abcam | Cat# ab227535 | WB (1:1000) |
| Antibody | anti-ACTL6a (mouse monoclonal) | Santa Cruz Biotech | Cat# sc-137062 | WB (1:1000) |
| Antibody | anti-SMARCD1 (mouse monoclonal) | Santa Cruz Biotech | Cat# sc-135843 | WB (1:1000) |
| Antibody | anti-BCL7A (rabbit polyclonal) | Atlas Antibodies | Cat# HPA019762 | WB (1:1000) |
| Antibody | anti-ACTB (mouse monoclonal) | Origene | Cat# TA811000 | WB (1:1000) |
| Antibody | rabbit IgG isotype control (rabbit isotype control) | Invitrogen | 02–6102 | IP (3 ug) |
| Recombinant DNA reagent | pGBKT7-GAL4-DNA-BD-fused IPMK (plasmid) | This paper | See Materials and methods. IPMK cloned into BD-containing pGBKT7 vector. | |
| Recombinant DNA reagent | human brain cDNA activation domain (AD) library | Clontech | Cat# 630,486 | |
| Recombinant DNA reagent | pLKO.1-hygro (plasmid) | Addgene | Cat# 24,150 | |
| Recombinant DNA reagent | pcDNA5-Mito -V5-APEX2 (plasmid) | This paper | See Materials and methods. Kindly provided by H. Rhee lab. | |
| Recombinant DNA reagent | pcDNA5/FRT/TO vector (plasmid) | Invitrogen | Cat# V652020 | |
| Recombinant DNA reagent | pOG44 Flp recombinase expression vector (plasmid) | Invitrogen | Cat# V600520 | |
| Recombinant DNA reagent | pCMV-GST (plasmid) | This paper | DOI: 10.1126/sciadv.1602296 | See Materials and Methods. |
| Recombinant DNA reagent | pcDNA3.1-FLAG (plasmid) | This paper | DOI: 10.1126/sciadv.1602296 | See Materials and methods |
| Recombinant DNA reagent | pGEX4T (plasmid) | Sigma Aldrich | Cat# GE28-9545-52 | |
| Recombinant DNA reagent | pFASTBAC1 (plasmid) | Thermo Fisher Scientific | Cat# 10359016 | |
| Recombinant DNA reagent | FLAG-DPF2-pCAG-IP (plasmid) | This paper | See Materials and methods. Kindly provided by J. Kim lab. | |
| Sequence-based reagent | Ipmk shRNA #1 | Sigma Aldrich | TRC Clone ID TRCN0000360808 | . |
| Sequence-based reagent | Ipmk shRNA #2 | Sigma Aldrich | TRC Clone ID TRCN0000360733 | |
| Sequence-based reagent | shNT_F | This paper | Oligo sequence used for cloning pLKO.1 shNT (negative control) | CCGGTCCTAAG GTTAAGTCGCCCTCG CTCGAGCGAG GGCGACTTAA CCTTAGGTTTTTG |
| Sequence-based reagent | shNT_R | This paper | Oligo sequence used for cloning pLKO.1 shNT (negative control) | AATTCAAAAACCT AAGGTTAAGTCGC CCTCGCTCGAG CGAGGGCG ACTTAACCTTAGGA |
| Peptide, recombinant protein | Streptavidin | Thermo Fisher | Cat# 434,302 | |
| Commercial assay or kit | Bradford protein assay | Bio-rad | Cat# 5000006 | |
| Commercial assay or kit | BCA assay | Thermo Fisher Scientific | Cat# 23,225 | |
| Commercial assay or kit | TNT Quick Coupled Transcription/Translation System | Promega | Cat# L1170 | |
| Commercial assay or kit | NEXTflex ChIP-seq Library kit | Bioo Scientific | Cat# 5143–02 | |
| Commercial assay or kit | Magnetic mRNA isolation kit | NEB | Cat# S1550S | |
| Commercial assay or kit | NEXTflex Rapid directional RNA-seq kit | Bioo Scientific | Cat# 5138–08 | |
| Chemical compound, drug | Doxycycline | Sigma Aldrich | Cat# D9891 | |
| Chemical compound, drug | Hygromycin B | Gibco | Cat# 10687010 | |
| Chemical compound, drug | puromycin | Gibco | Cat# A11138-03 | |
| Chemical compound, drug | G418 | Gibco | Cat# 11811023 | |
| Chemical compound, drug | DharmaFECT 1 | Thermo Fisher Scientific | Cat# T-2001–03 | |
| Chemical compound, drug | FUGENE HD | Promega | Cat# E2311 | |
| Chemical compound, drug | Lipofectamine LTX with Plus Reagent | Invitrogen | Cat# 15338100 | |
| Chemical compound, drug | Turbofect | Thermo Fisher Scientific | Cat# R0533 | |
| Software, algorithm | Sequest Sorcerer platform | Sage-N Research | Homo sapiens protein sequence database (20,675 entries, UniProt) | |
| Software, algorithm | Scaffold | Proteome Software Inc. | Version 4.11.0 | |
| Software, algorithm | Protein Prophet algorithm | Protein Prophet algorithm | DOI: 10.1021/ac0341261 |
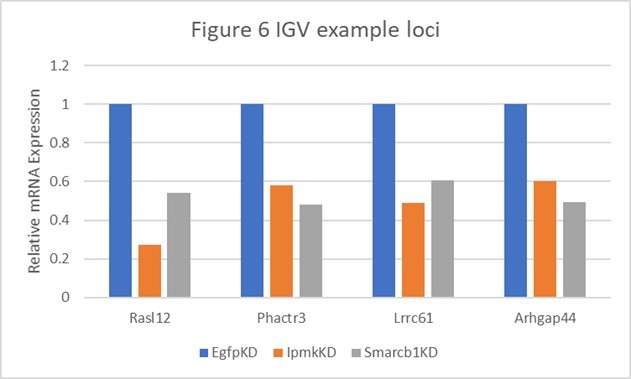
Author response table 1
Table shows the actual values and calculated significance corresponding to Author response image 1.
| Genes | Figure 6 | Relative Expression | Log2 (vs EgfpKD) | P-value (vs EgfpKD) | ||||
|---|---|---|---|---|---|---|---|---|
| EgfpKD | lpmkKD | Smarcb1KD | lpmkKD | Smarcb1KD | lpmkKD | Smarcb1KD | ||
| Rasl12 | A | 1 | 0.272476547 | 0.538887496 | -1.8758 | -0.891947 | 0.00145 | 0.08695 |
| Phactr3 | B and E | 1 | 0.582057348 | 0.480741151 | -0.780767 | -1.05667 | 0.05265 | 0.0278 |
| Lrrc61 | F | 1 | 0.490901076 | 0.604801519 | -1.0265 | -0.725463 | 0.00215 | 0.01485 |
| Arhgap44 | F | 1 | 0.602265871 | 0.491195499 | -0.731528 | -1.02563 | 0.03035 | 0.04435 |
Additional files
-
Supplementary file 1
Yeast two-hybrid screening assay using IPMK as bait.
- https://cdn.elifesciences.org/articles/73523/elife-73523-supp1-v1.xlsx
-
Supplementary file 2
Enriched protein complex-based sets from APEX2-mediated proximity labeling.
- https://cdn.elifesciences.org/articles/73523/elife-73523-supp2-v1.xlsx
-
Supplementary file 3
Appendix_ Sequence-based reagents.
- https://cdn.elifesciences.org/articles/73523/elife-73523-supp3-v1.xlsx
-
Transparent reporting form
- https://cdn.elifesciences.org/articles/73523/elife-73523-transrepform1-v1.docx
Download links
A two-part list of links to download the article, or parts of the article, in various formats.
Downloads (link to download the article as PDF)
Open citations (links to open the citations from this article in various online reference manager services)
Cite this article (links to download the citations from this article in formats compatible with various reference manager tools)
Inositol polyphosphate multikinase physically binds to the SWI/SNF complex and modulates BRG1 occupancy in mouse embryonic stem cells
eLife 11:e73523.
https://doi.org/10.7554/eLife.73523


