Transferrin receptor 1-mediated iron uptake regulates bone mass in mice via osteoclast mitochondria and cytoskeleton
- Southern California Institute for Research and Education, United States
- Department of Orthopedics, The Third People’s Hospital of Hefei, Third Clinical College, Anhui Medical University, China
- Center for Osteoporosis and Metabolic Bone Diseases, Division of Endocrinology, Department of Internal Medicine, University of Arkansas for Medical Sciences, United States
- Department of Orthopedic Surgery, Kyushu University Hospital, Japan
- Department of Orthopedics, First Affiliated Hospital, Anhui Medical University, China
- Division of Radiation Health, Department of Pharmaceutical Sciences, University of Arkansas for Medical Sciences, United States
- Department of Pediatrics, University of Arkansas for Medical Sciences, United States
- Department of Biochemistry and Molecular Biology, University of Arkansas for Medical Sciences, United States
- Department of Physiology and Cell Biology, University of Arkansas for Medical Sciences, United States
- Department of Biomedical Sciences, Texas A&M University, United States
- Department of Orthopedics, Duke University, United States
- Division of Dermatology, Department of medicine, Long Beach VA Healthcare System, United States
- Musculoskeletal Disease Center, VA Loma Linda Healthcare System, United States
Figures
Figure 1 with 1 supplement
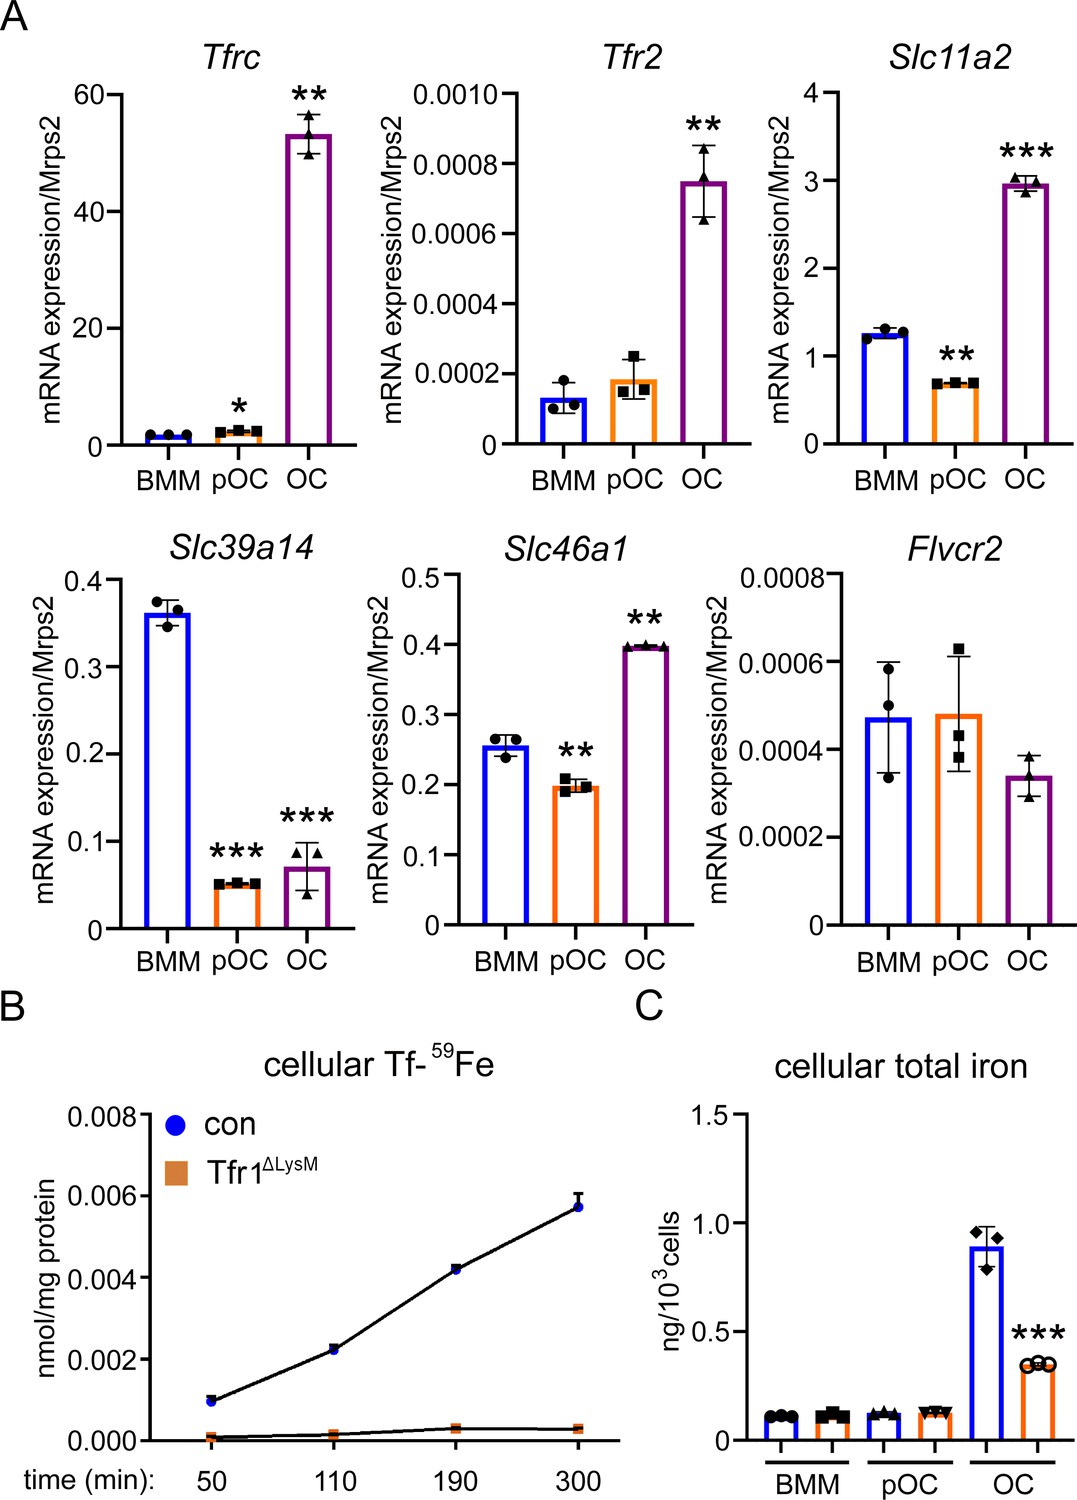
Tfr1 is a major transferrin transporter and regulates cellular iron homeostasis in osteoclasts.
(A) Detection of mRNA expression of genes involved in iron uptake and export pathways in bone marrow monocytes (BMM), mononuclear pre-osteoclasts (pOC), and mature osteoclasts (OC) by real-time quantitative PCR. Tfrc encodes Tfr1; Slc11a1 encodes Dmt1 (divalent metal ion transporter 1); Slc39a14 encodes Zip14; Slc46a1 encodes heme transporter Hcp1; Flvcr2 encodes Flvcr2 heme transporter 2. (B) Measurement of 59Fe-labeled transferrin (Tf-59Fe) uptake in control (con) and Tfr1 myeloid conditional knockout (Tfr1ΔLysM) osteoclasts by a gamma counter. (C) Measurement of intracellular total iron by a colorimetric iron assay kit in control and Tfr1-deficient osteoclast lineage cells. The data are presented as mean ± SD. n=3. * p<0.05, ** p<0.01, and *** p<0.001 vs BMM (A) and vs control OC (C) by one-way ANOVA and Student’s t-test.
-
Figure 1—source data 1
Tfr1 is a major transferrin transporter and regulates cellular iron homeostasis in osteoclasts.
- https://cdn.elifesciences.org/articles/73539/elife-73539-fig1-data1-v2.xlsx
Figure 1—figure supplement 1
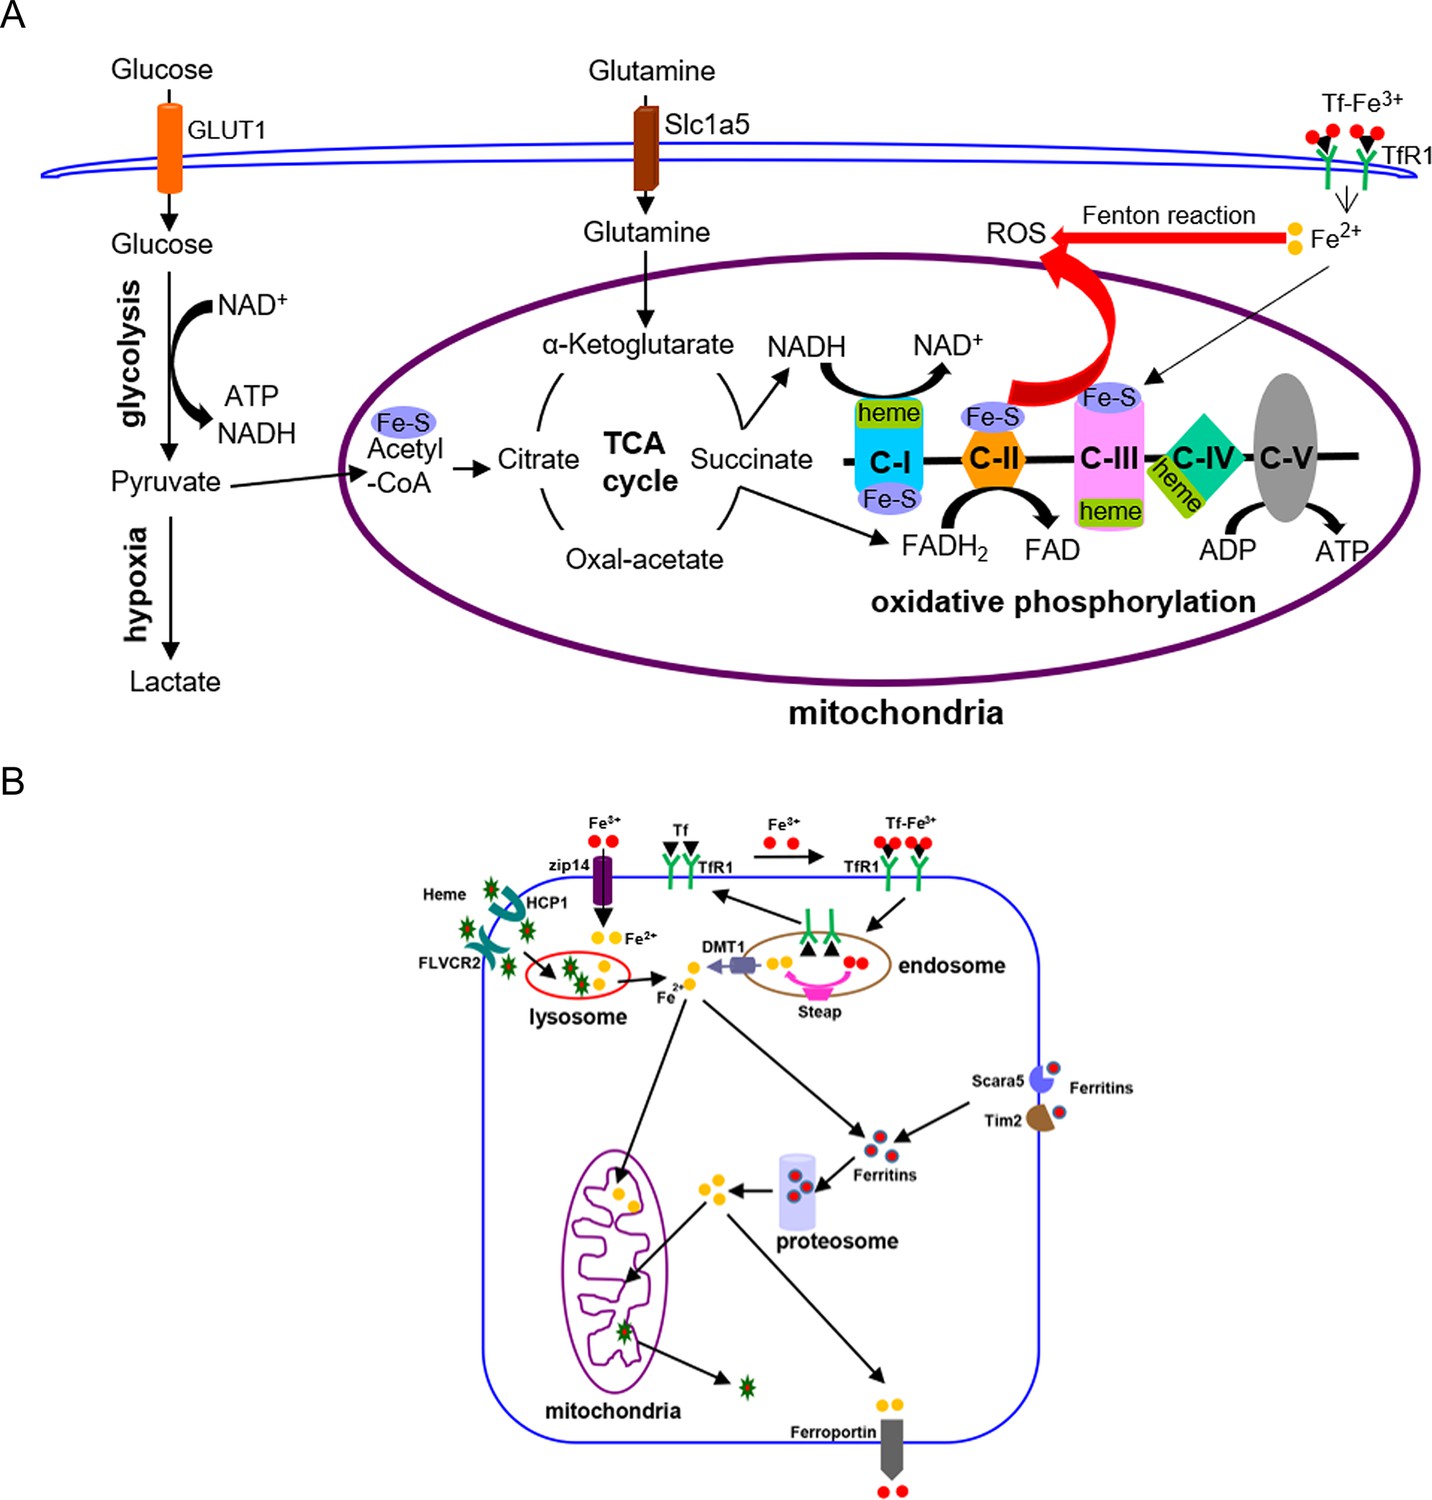
Graphic diagrams of iron in energy metabolism in mammalian cells (A) and cellular iron-uptake pathways (B).
C-I to C-V: mitochondrial respiration chain complex-I to complex-V; DMT1: divalent metal ion transporter 1; GLUT1: glucose transporter 1; ROS: reactive oxygen species; Slc1a5: glutamine transporter; Steap: metalloreductase of the six transmembrane epithelial antigen of the prostate family proteins; Tf: transferrin; TfR1: transferrin receptor 1.
Figure 2 with 9 supplements
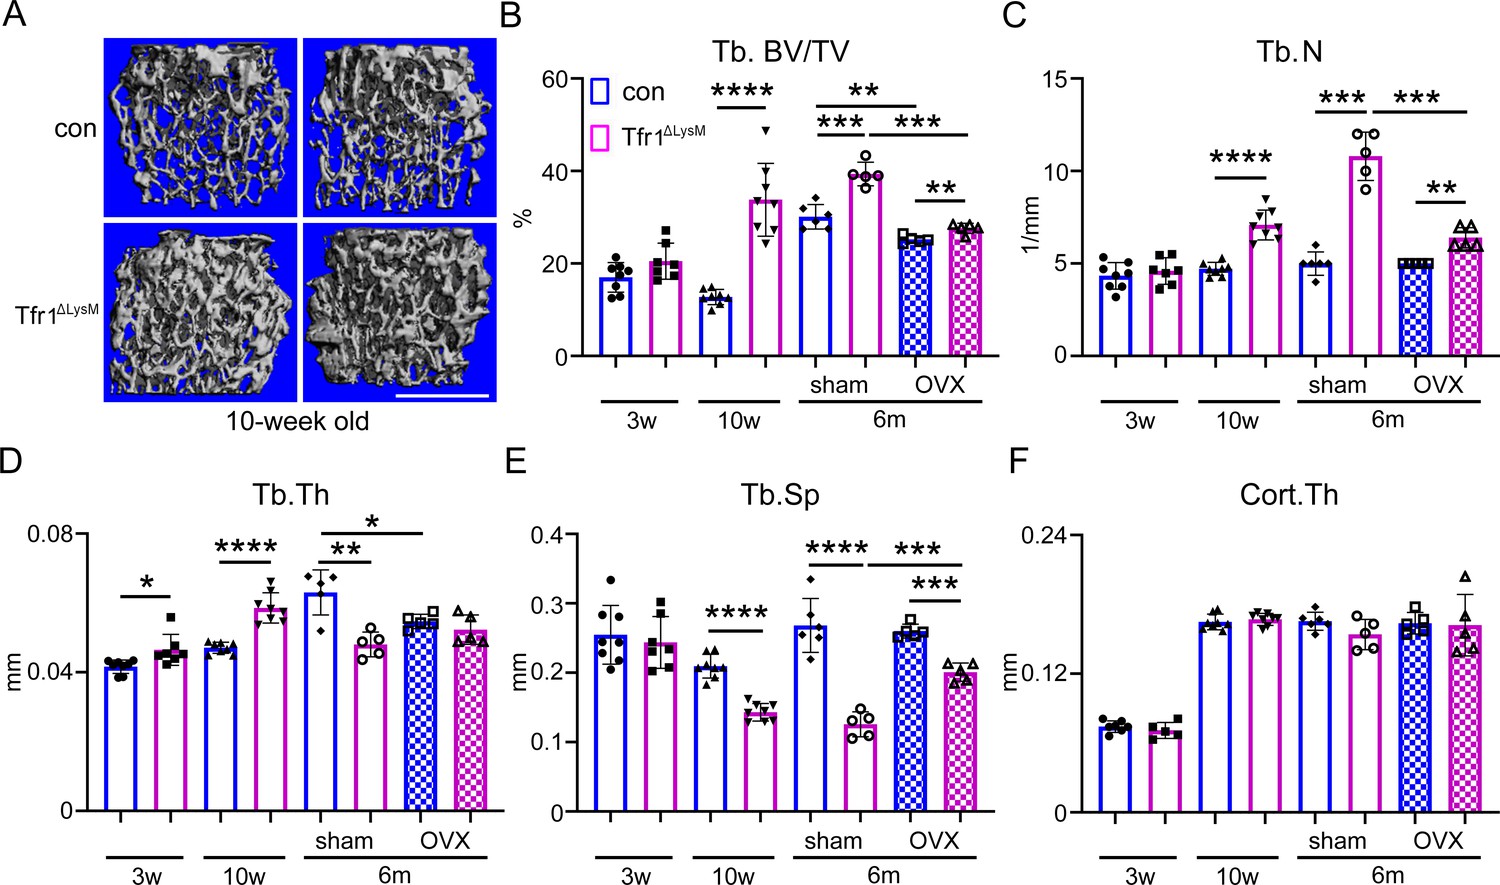
Tfr1 myeloid conditional knockout female mice develop normally and display increased trabecular bone mass in femurs at 10-week-old and 6-month-old ages.
(A) Representative µCT images of distal femurs of 10-week-old female control (con) and Tfr1ΔLysM mice. scale bar = 1 mm. (B– F) µCT analysis of trabecular and cortical bone mass and structure of distal femurs isolated from three different ages of female con and Tfr1ΔLysM mice. Tb: trabecular bone; BV/TV: bone volume/tissue volume; Tb.N: trabecular number; Tb.Th: trabecular thickness; Tb.Sp: trabecular spacing; Cort.Th: cortical bone thickness. The data are presented as mean ± SD. n=5–13. * p<0.05; ** p<0.01; *** p<0.001; **** <0.0001 by one-way ANOVA.
-
Figure 2—source data 1
Tfr1 myeloid conditional knockout female mice develop normally and display increased trabecular bone mass in femurs at 10-week-old and 6-month-old ages.
- https://cdn.elifesciences.org/articles/73539/elife-73539-fig2-data1-v2.xlsx
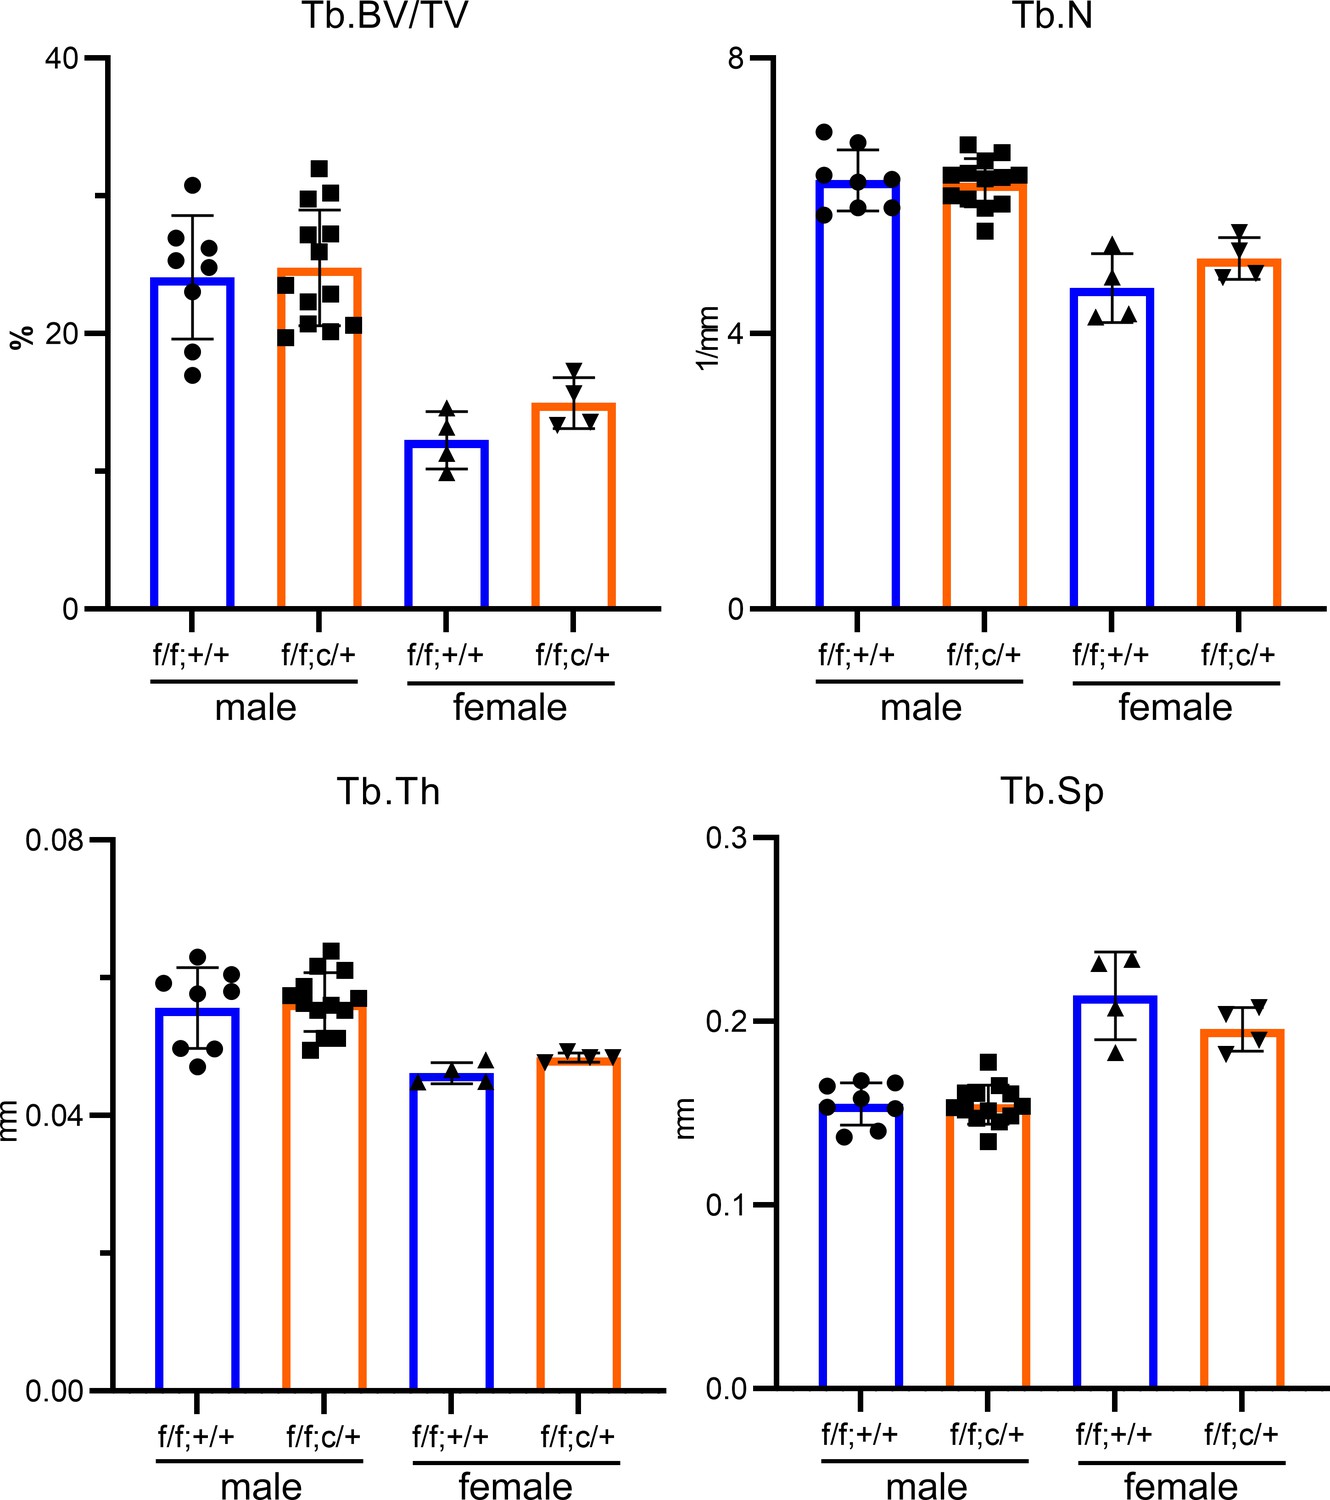
Figure 2—figure supplement 1
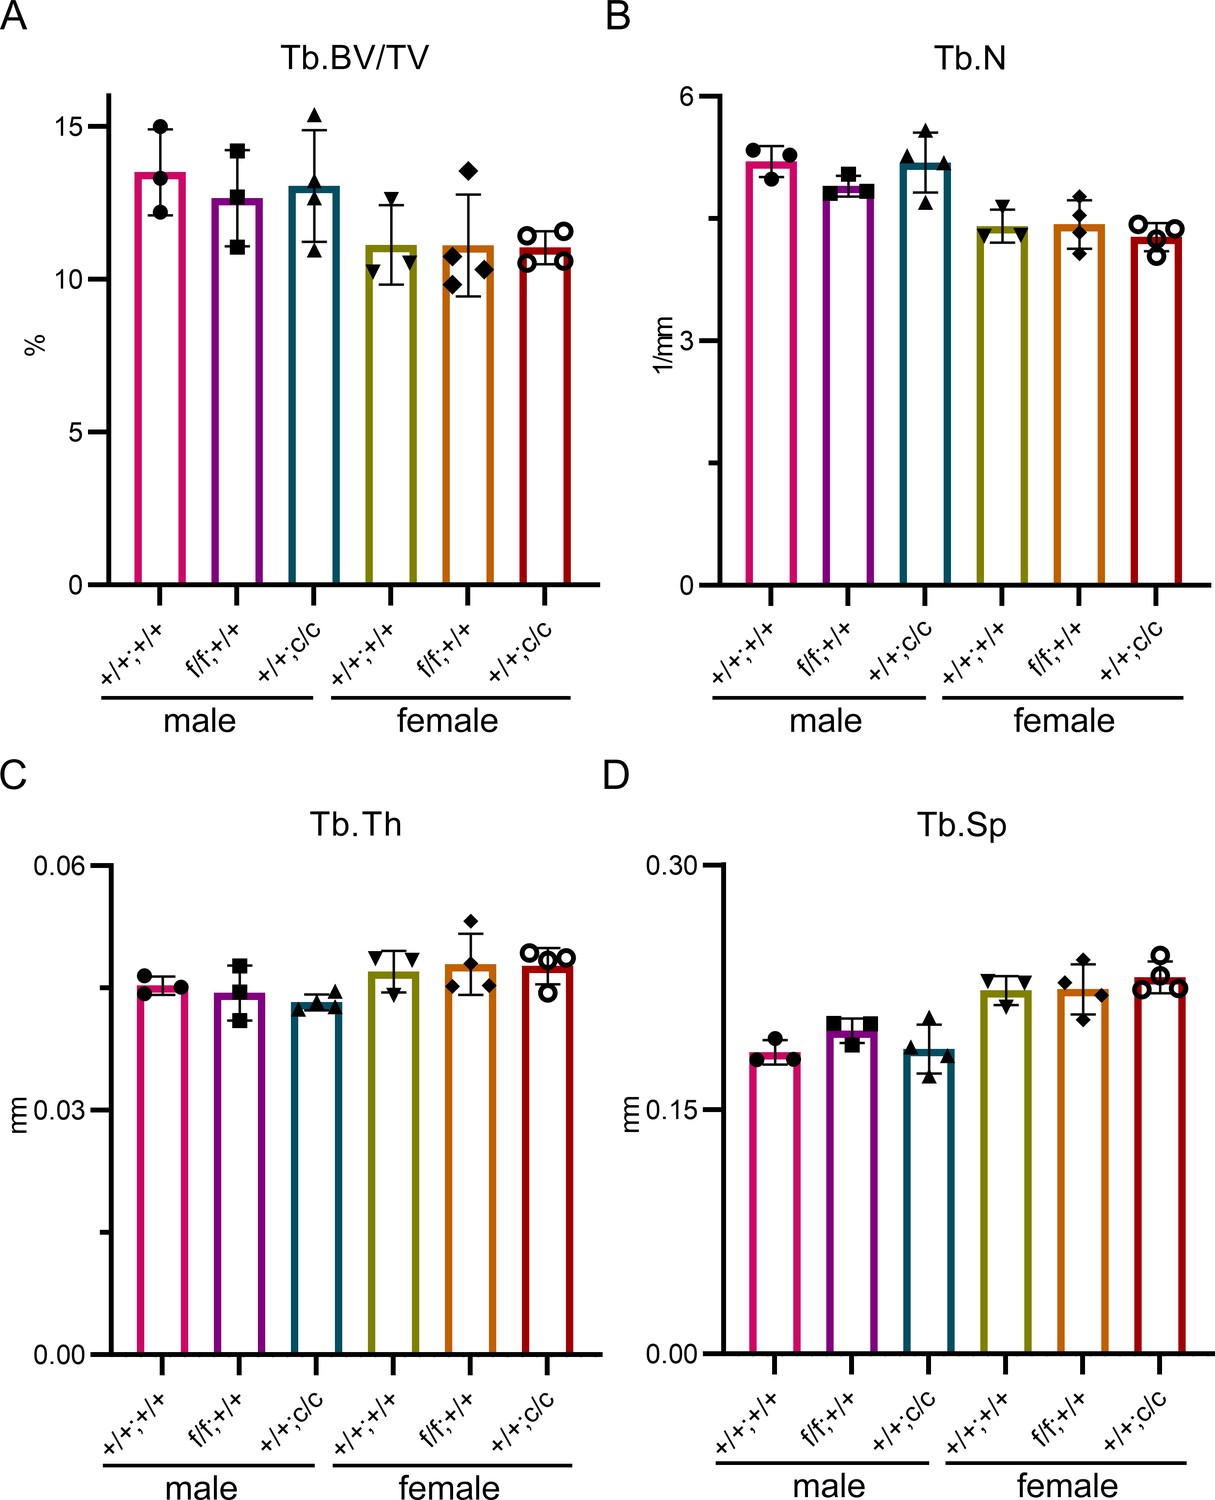
The trabecular bone mass and structure among three different genotypes of control mice are similar.
μCT analysis of distal femurs of three different genotypes of 10-week-old male and female control mice. Tb: trabecular bone; BV/TV: bone volume/tissue volume; Tb.N: trabecular number; Tb.Th: trabecular thickness; Tb.Sp: trabecular spacing. The data are presented as mean ± SD and analyzed by one-way ANOVA. n=3–4.
-
Figure 2—figure supplement 1—source data 1
The trabecular bone mass and structure among three different genotypes of control mice are similar.
- https://cdn.elifesciences.org/articles/73539/elife-73539-fig2-figsupp1-data1-v2.xlsx
Figure 2—figure supplement 2
Partial deletion of Tfr1 by one-allele of LysM-Cre has no effects on bone mass and structure in male and female mice on C57BL6/J background.
µCT analysis of trabecular bone mass and structure of distal femurs from 10-week-old C57BL6/J background mice. Tb: trabecular bone; BV/TV: bone volume/tissue volume; Tb.N: trabecular number; Tb.Th: trabecular thickness; Tb.Sp: trabecular spacing. The data are presented as mean ± SD and analyzed by Student’s t-test. n=4–13.
-
Figure 2—figure supplement 2—source data 1
Partial deletion of Tfr1 by one-allele of LysM-Cre has no effects on bone mass and structure in male and female mice on C57BL6/J background.
- https://cdn.elifesciences.org/articles/73539/elife-73539-fig2-figsupp2-data1-v2.xlsx
Figure 2—figure supplement 3
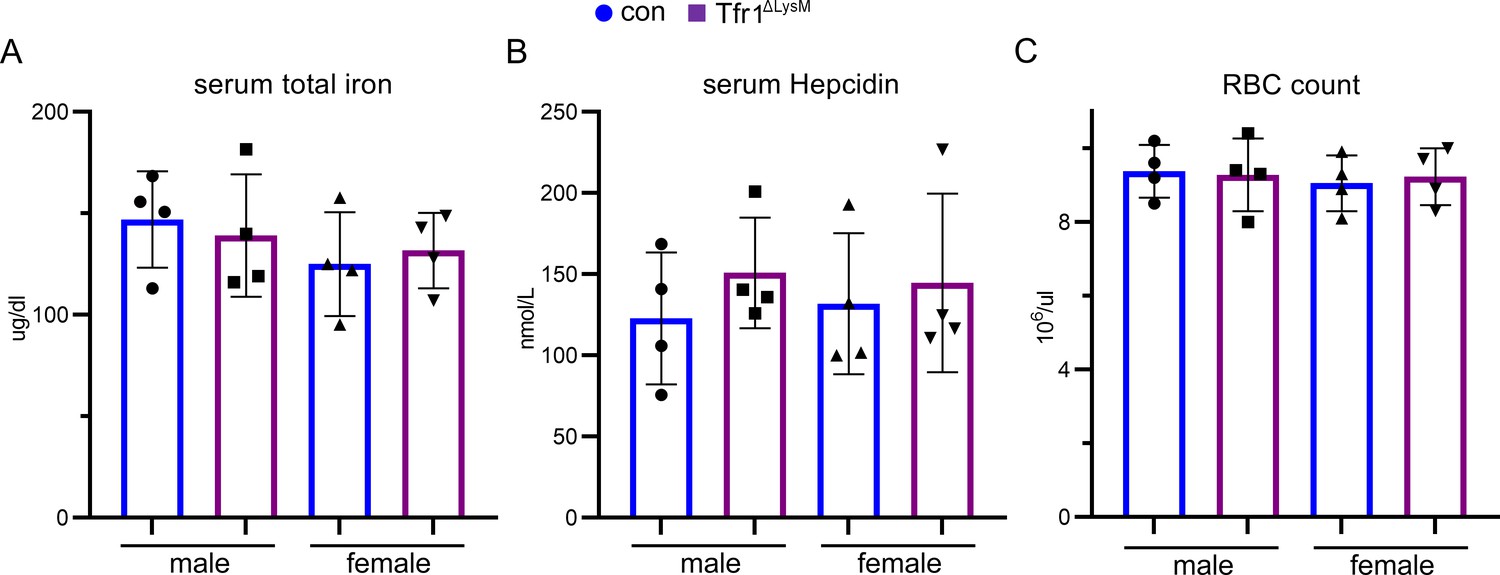
Loss of Tfr1 in myeloid osteoclast precursor cells did not alter the serum iron and hepcidin levels and had no effects on erythropoiesis in 10-week-old male and female mice.
The serum total iron concentration of 10-week-old control (con) and Tfr1ΔLysM mice was measured by a colorimetric based iron detection kit from Fisherscientic Inc. The serum hepcidin level was measured by a Hepcidin Murine-Complete ELISA kit from Intrinsic Lifesciences. The red blood cell number of peripheral bloods was counted using hemacytometer. The data are presented as mean ± SD and analyzed by one-way ANOVA. n=4.
-
Figure 2—figure supplement 3—source data 1
Loss of Tfr1 in myeloid osteoclast precursor cells did not alter the serum iron and hepcidin levels and had no effects on erythropoiesis in 10-week-old male and female mice.
- https://cdn.elifesciences.org/articles/73539/elife-73539-fig2-figsupp3-data1-v2.xlsx
Figure 2—figure supplement 4

Tfr1 myeloid conditional knockout male mice develop normally and exhibit no significant changes in trabecular and cortical bone.
(A) Representative µCT images of distal femurs of 10-week-old male control (con) and Tfr1ΔLysM mice. scale bar = 1 mm. (B–F) µCT analysis of trabecular and cortical bone mass and structure of distal femurs from 3-week-old, 10-week-old, and 6-month-old of male con and Tfr1ΔLysM mice. Tb: trabecular bone; BV/TV: bone volume/tissue volume; Tb.N: trabecular number; Tb.Th: trabecular thickness; Tb.Sp: trabecular spacing; Cort.Th: cortical bone thickness. The data are presented as mean ± SD. n=5–13. * p<0.05 vs con by Student’s t-test.
-
Figure 2—figure supplement 4—source data 1
Tfr1 myeloid conditional knockout male mice develop normally and exhibit no significant changes in trabecular and cortical bone.
- https://cdn.elifesciences.org/articles/73539/elife-73539-fig2-figsupp4-data1-v2.xlsx
Figure 2—figure supplement 5
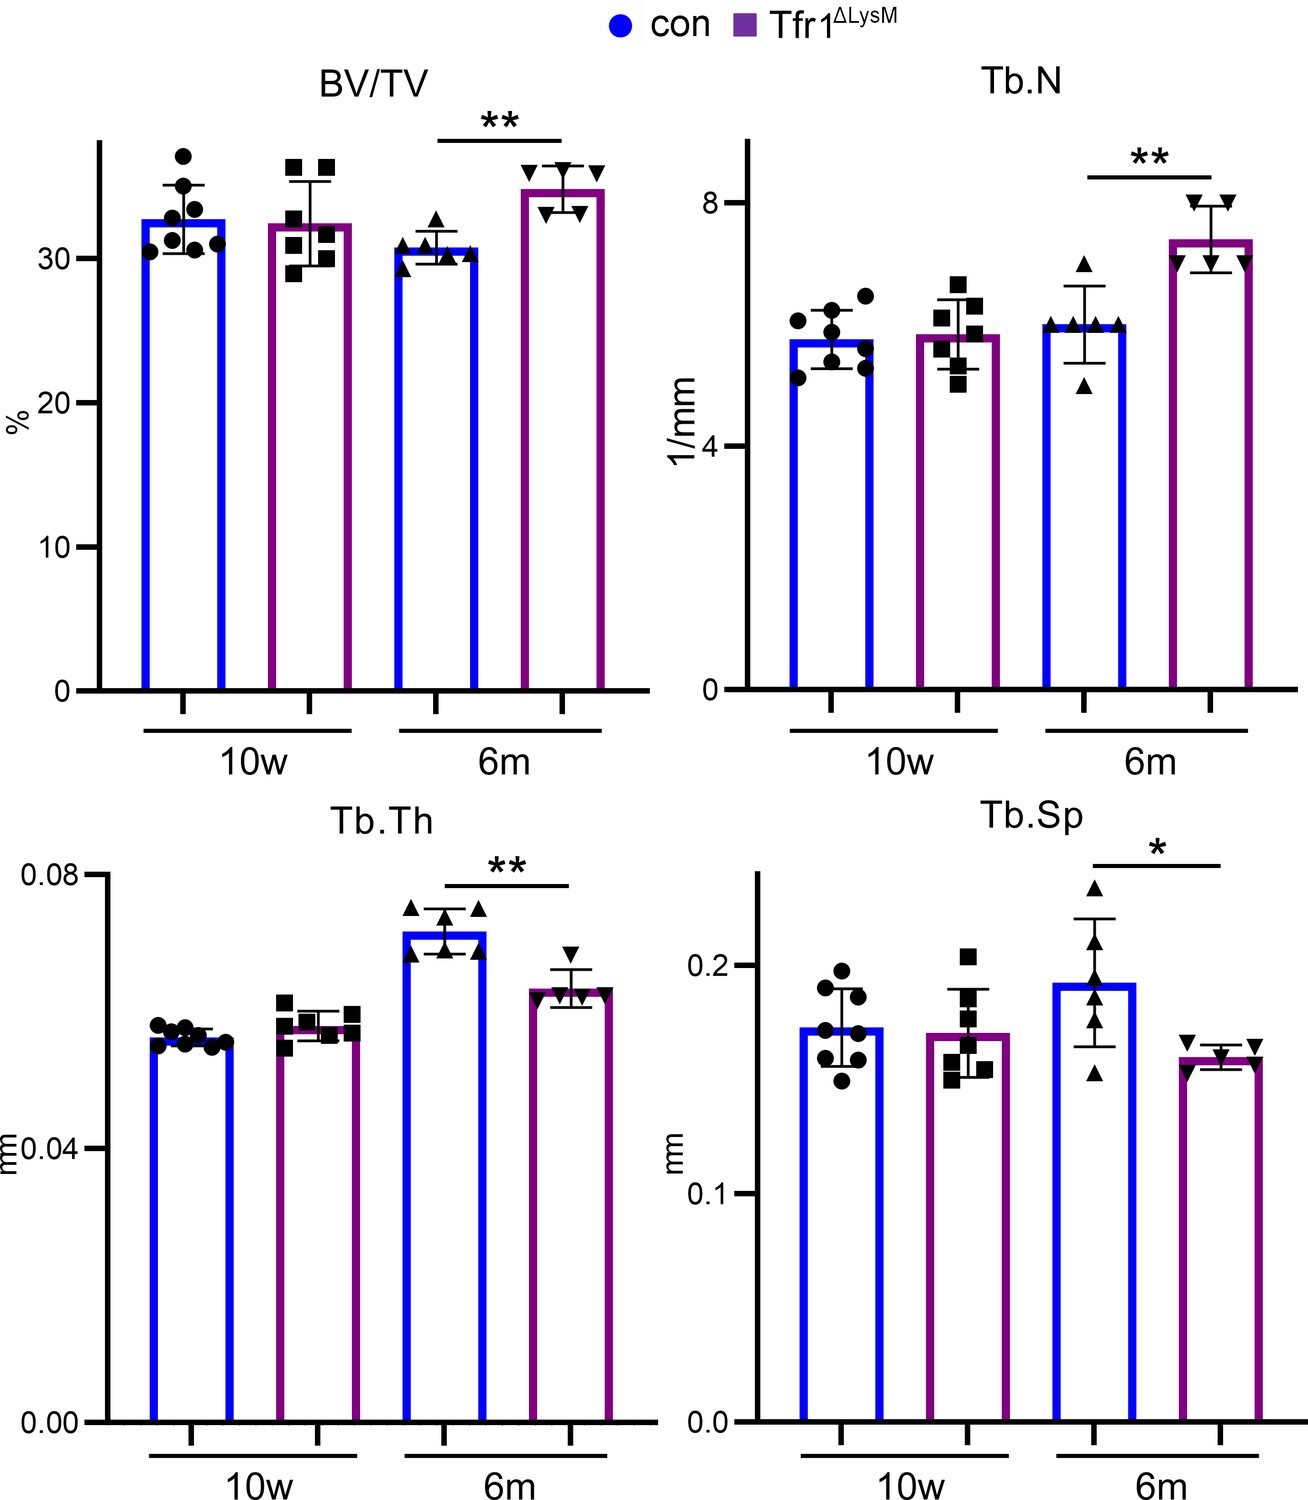
Loss of Tfr1 in myeloid osteoclast precursor cells had less effects on trabecular bone mass in lumber vertebrae than femurs.
µCT analysis of lumber vertebrae of 10-week-old and 6-month-old control (con) and Tfr1ΔLysM mice. Tb: trabecular bone; BV/TV: bone volume/tissue volume; Tb.N: trabecular number; Tb.Th: trabecular thickness; Tb.Sp: trabecular spacing; BMD: bone mineral density; Cort: cortical bone. The data are presented as mean ± SD. n=5–8. * p<0.05; ** P<0.01 vs con by one-way ANOVA.
-
Figure 2—figure supplement 5—source data 1
Loss of Tfr1 in myeloid osteoclast precursor cells had less effects on trabecular bone mass in lumber vertebrae than femurs.
- https://cdn.elifesciences.org/articles/73539/elife-73539-fig2-figsupp5-data1-v2.xlsx
Figure 2—figure supplement 6
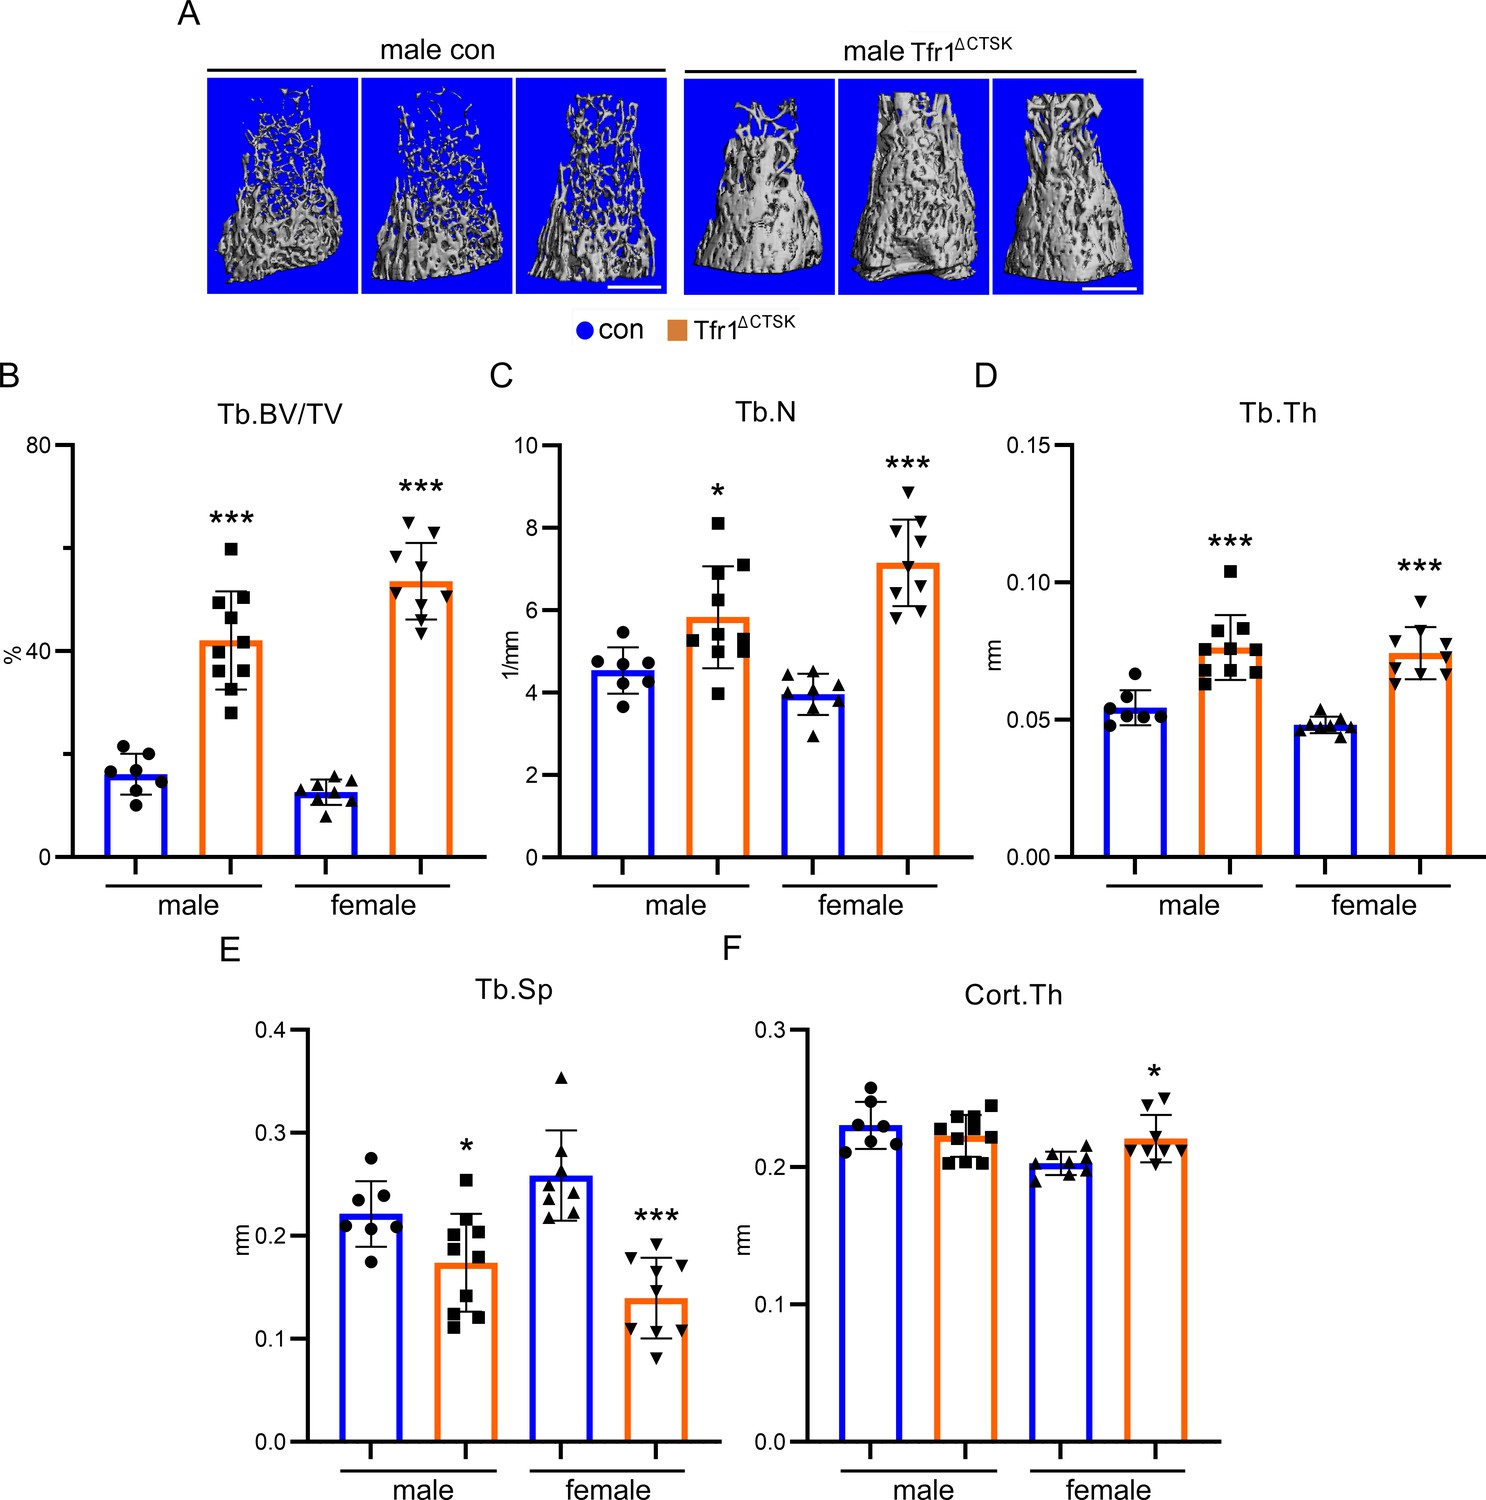
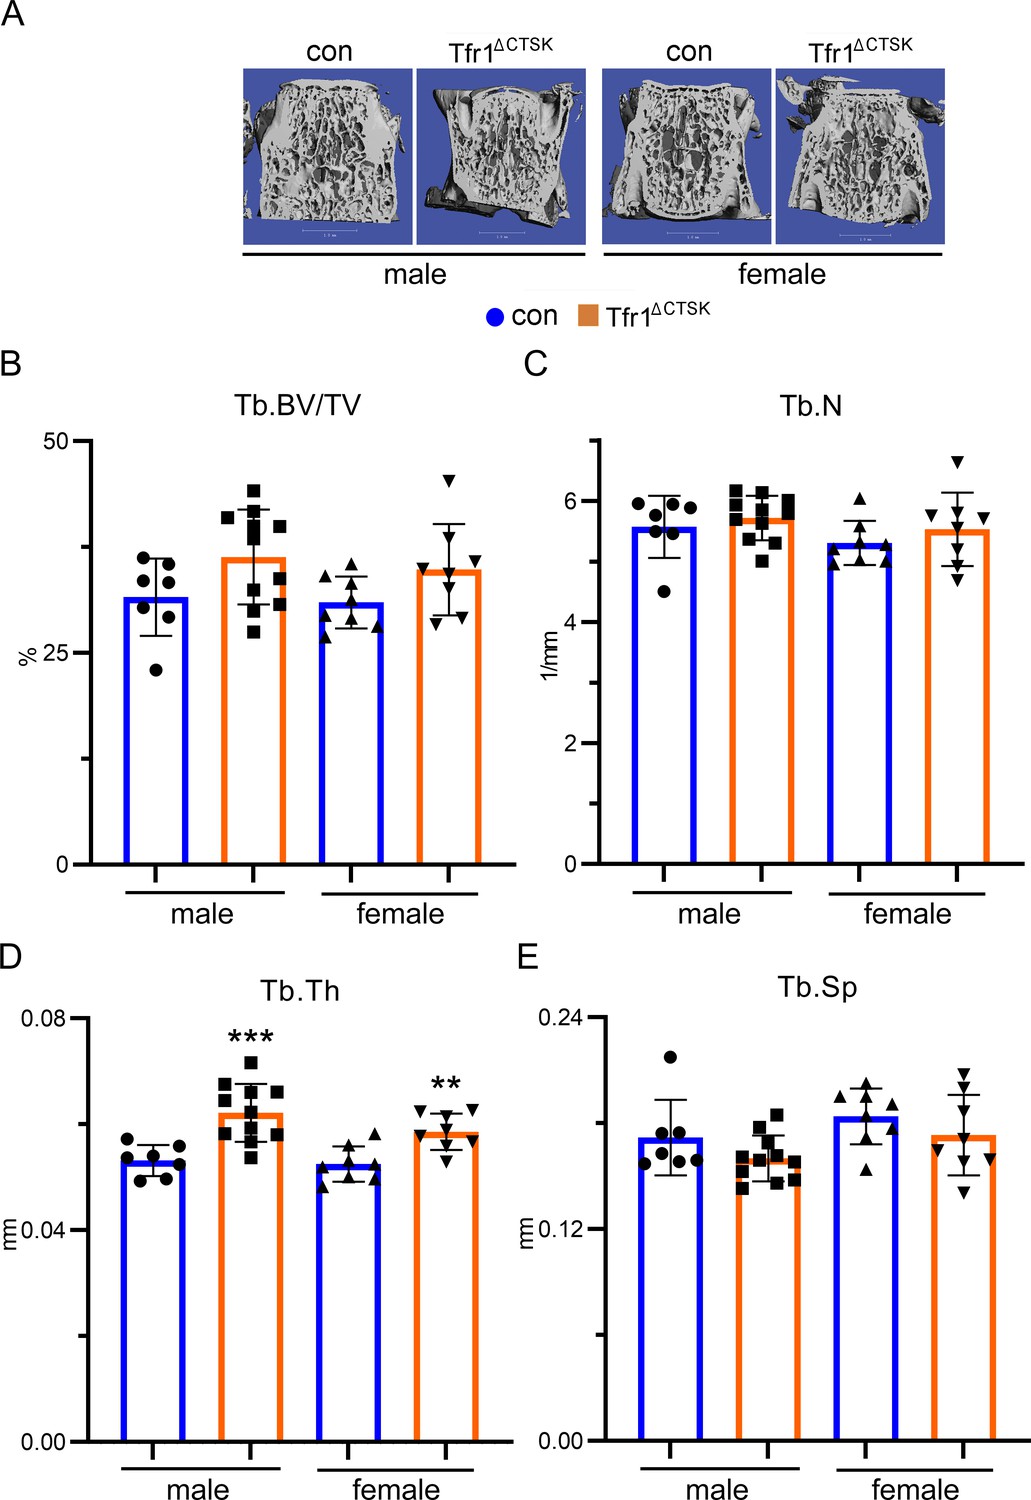
Deletion of Tfr1 in cathepsin K-Cre expressing osteoclasts results in increased trabecular bone mass in distal femurs of 10-week-old male and female mice.
(A) The representative µCT images of distal femurs of male and female control (con) and Tfr1ΔCTSK mice on the 129×C57BL6J mixed background. scale bar = 1 mm. (B–F) µCT analysis of trabecular and cortical bone mass and structure of distal femurs. Tb: trabecular bone; BV/TV: bone volume/tissue volume; Tb.N: trabecular number; Tb.Th: trabecular thickness; Tb.Sp: trabecular spacing; Cort: cortical bone. The data are presented as mean ± SD. n=7–10. * p<0.05, *** p<0.001 vs con by one-way ANOVA.
-
Figure 2—figure supplement 6—source data 1
Deletion of Tfr1 in cathepsin K-Cre expressing osteoclasts results in increased trabecular bone mass in distal femurs of 10-week-old male and female mice.
- https://cdn.elifesciences.org/articles/73539/elife-73539-fig2-figsupp6-data1-v2.xlsx
Figure 2—figure supplement 7
Deletion of Tfr1 in cathepsin K-Cre expressing osteoclasts slightly increases trabecular thickness of lumber vertebrae of 10-week-old male and female mice.
(A) Representative µCT images of L4 lumber vertebra of male and female control (con) and conditional knockout (Tfr1ΔCTSK) mice on the 129×C57BL6J mixed background. scale bar = 1 mm. (B–E) µCT analysis of bone mass and structure of L4 lumber vertebra. Tb: trabecular bone; BV/TV: bone volume/tissue volume; Tb.N: trabecular number; Tb.Th: trabecular thickness; Tb.Sp: trabecular spacing. The data are presented as mean ± SD. n=7–11. ** p<0.01, *** p<0.001 vs con by one-way ANOVA.
-
Figure 2—figure supplement 7—source data 1
Deletion of Tfr1 in cathepsin K-Cre expressing osteoclasts slightly increases trabecular thickness of lumber vertebrae of 10-week-old male and female mice.
- https://cdn.elifesciences.org/articles/73539/elife-73539-fig2-figsupp7-data1-v2.xlsx
Figure 2—figure supplement 8
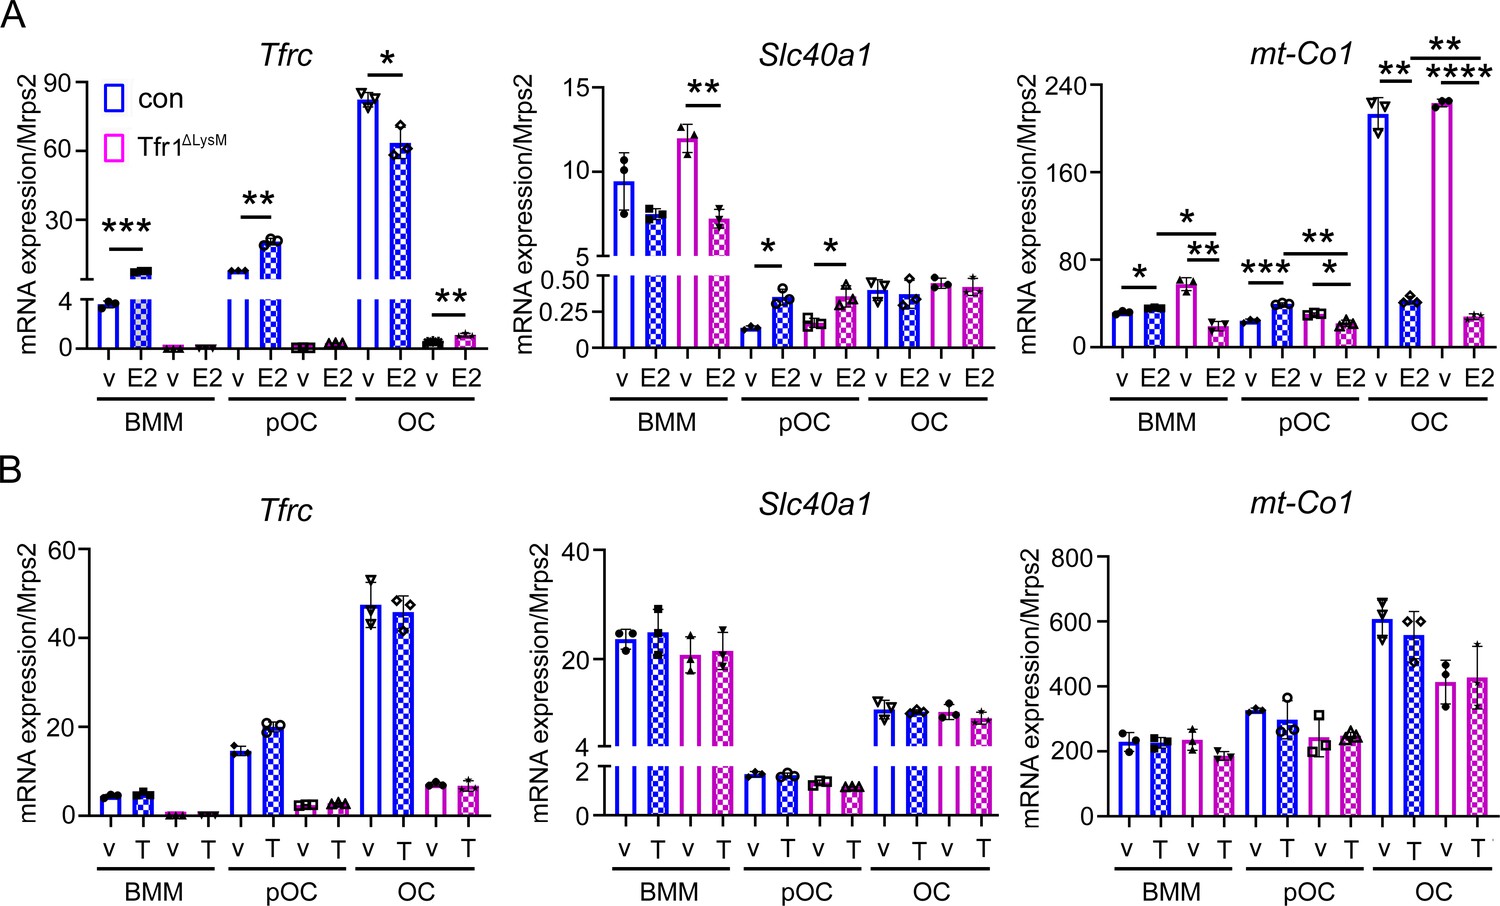
Estrogen but not androgen synergistically with Tfr1-deficiency inhibits the mRNA expression of mitochondrial cytochrome c oxidase subunit I in osteoclast lineage cells.
Quantitative PCR detection of the mRNA levels of Tfrc, Fpn, and mt-Co1 in vehicle (v), estrogen (E2), and androgen (T) treated control (con) and Tfr1ΔLysM osteoclast lineage cells. The data are presented as mean ± SD. n=3. * p<0.05; ** p<0.01; *** p<0.001, **** p<0.0001 vs vehicle or control analyzed by one-way ANOVA.
-
Figure 2—figure supplement 8—source data 1
Estrogen but not androgen synergistically with Tfr1-deficiency inhibits the mRNA expression of mitochondrial cytochrome c oxidase subunit I in osteoclast lineage cells.
- https://cdn.elifesciences.org/articles/73539/elife-73539-fig2-figsupp8-data1-v2.xlsx
Figure 2—figure supplement 9
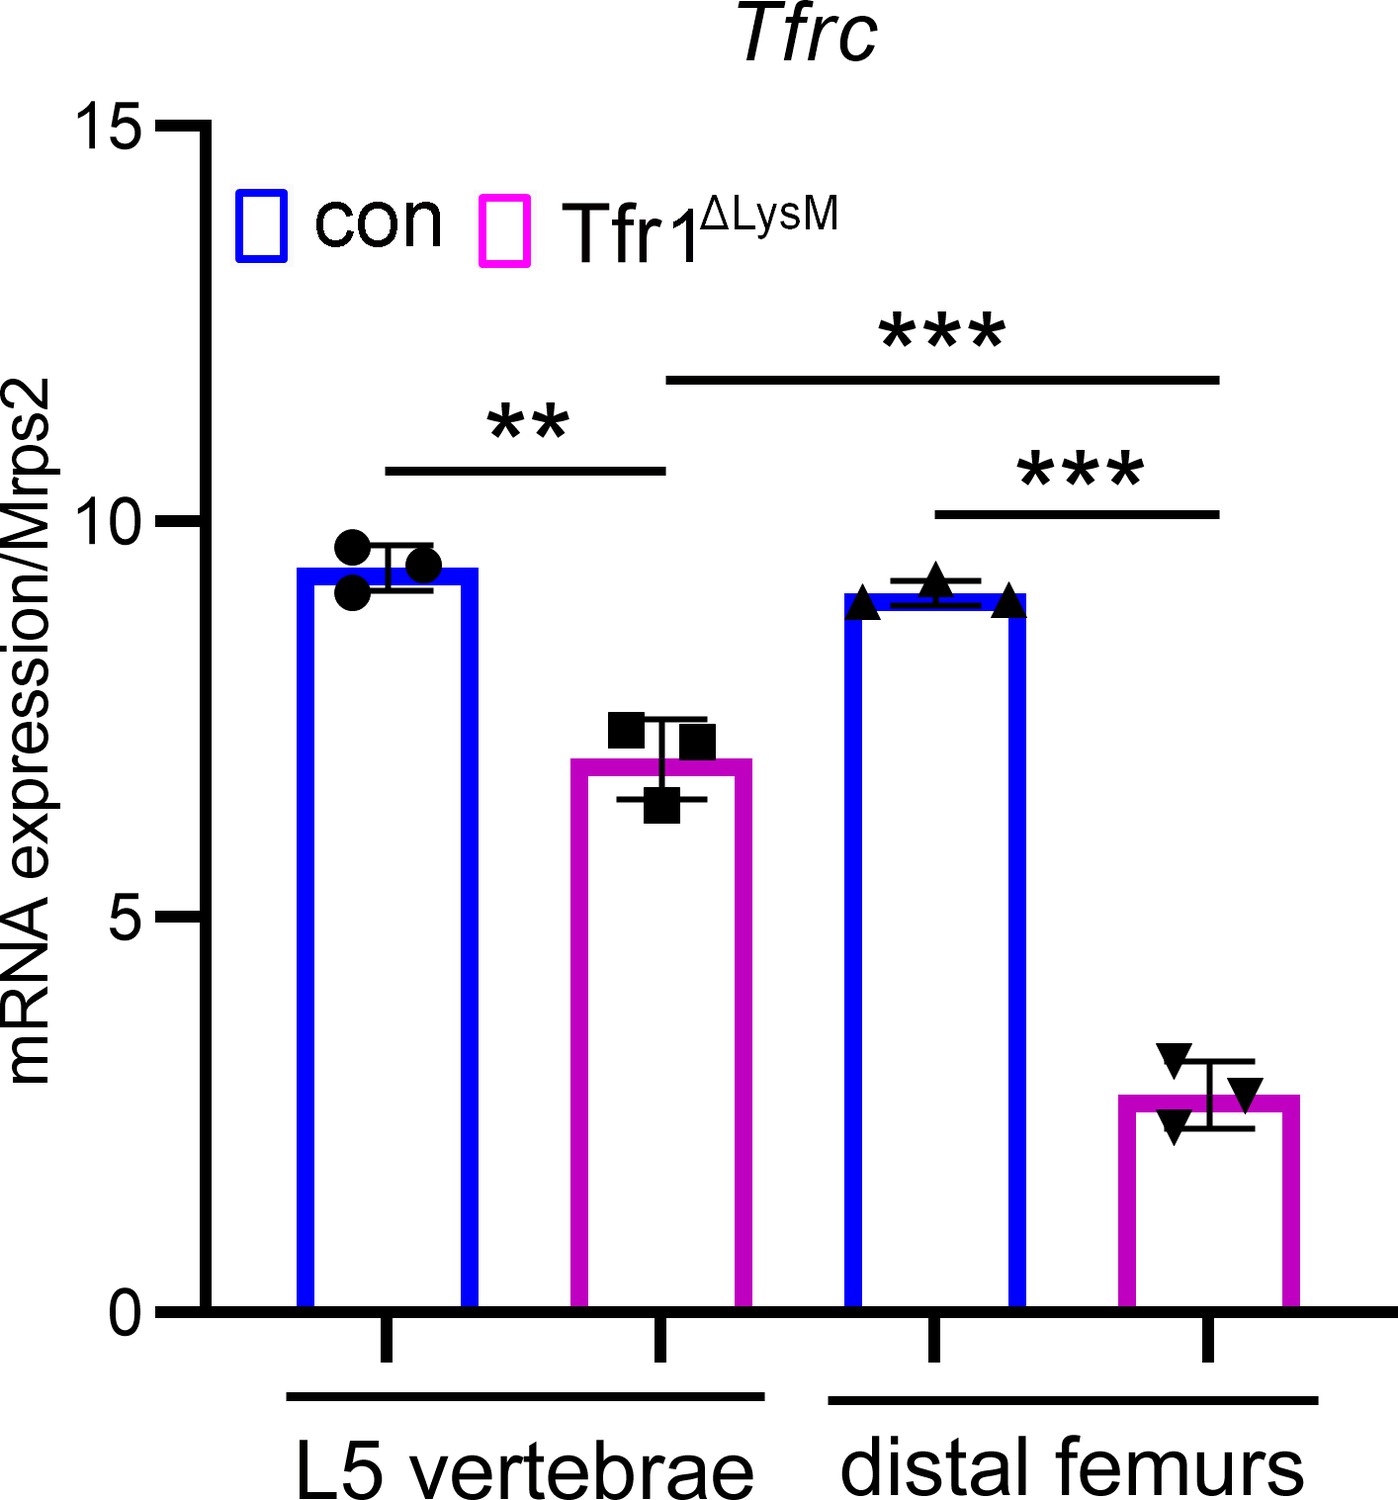
The deletion efficiency of Tfr1 by LysM-Cre is more potent in the distal femur than in the lumber vertebra as examined by quantitative PCR.
The data are presented as mean ± SD. n=3. ** p<0.01 and *** p<0.001 vs control (con) or vertebra analyzed by one-way ANOVA.
-
Figure 2—figure supplement 9—source data 1
The deletion efficiency of Tfr1 by LysM-Cre is more potent in the distal femur than in the lumber vertebra as examined by quantitative PCR.
- https://cdn.elifesciences.org/articles/73539/elife-73539-fig2-figsupp9-data1-v2.xlsx
Figure 3 with 3 supplements
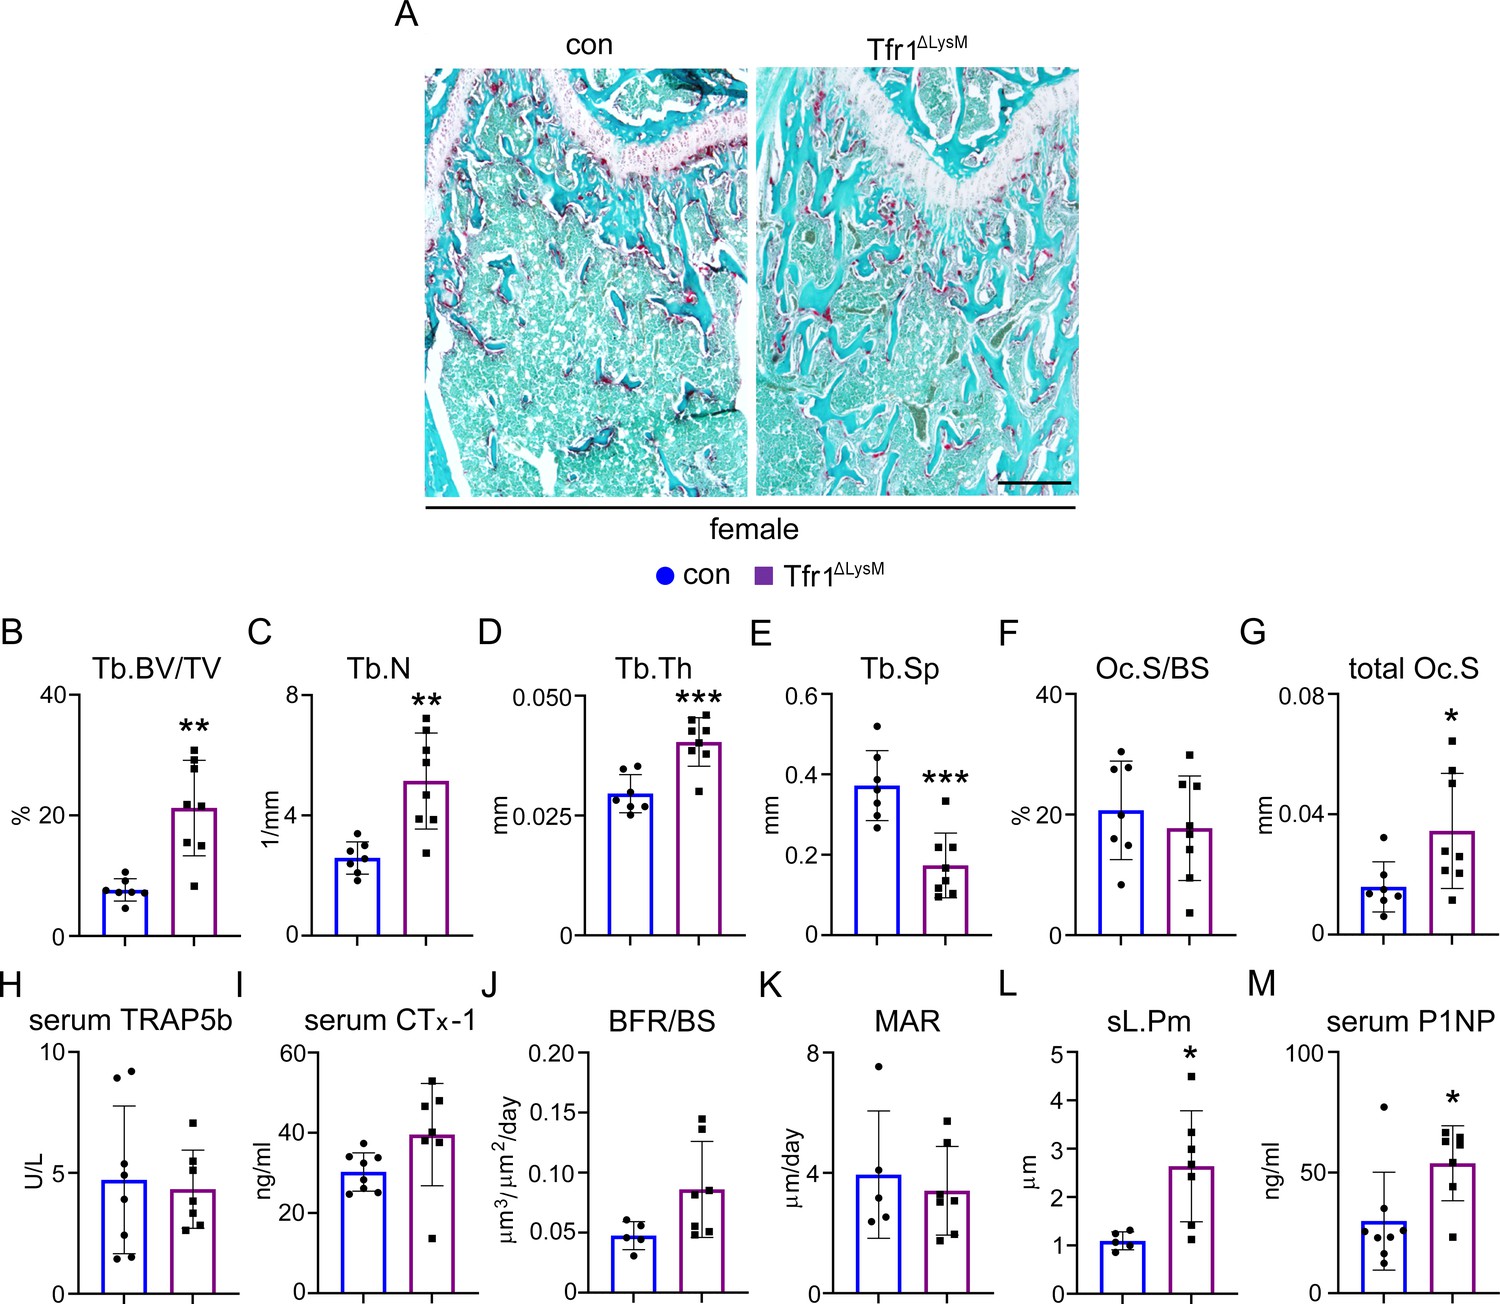
Loss of Tfr1 in myeloid osteoclast precursors has no impacts on osteoclast number and bone formation in 10-week-old female mice.
(A) Images of fast green and TRAP staining (scale bar = 200 μm) and (B–G) histomorphometric analysis of the metaphysis of decalcified distal femur histological sections of 10-week-old female control (con) and Tfr1ΔLysM mice. (H), (I), and (M) quantitative measurements of serum markers for bone resorption and bone formation by ELISA. (J–L) Dynamic histomorphometry analysis of tetracycline-labeled sections from undecalcified distal femurs. Tb: trabecular bone; BV/TV: bone volume/tissue volume; Tb.N: trabecular number; Tb.Th: trabecular thickness; Tb.Sp: trabecular spacing; Oc.S/BS: osteoclast surface/bone surface; BFR: bone formation rate; MAR: mineral apposition rate; sL.Pm: single tetracycline labeled surface. The data are presented as mean ± SD. n=5–13. * p<0.05, ** p<0.01, and *** p<0.001 vs con by one-way ANOVA.
-
Figure 3—source data 1
Loss of Tfr1 in myeloid osteoclast precursors has no impacts on osteoclast number and bone formation in 10-week-old female mice.
- https://cdn.elifesciences.org/articles/73539/elife-73539-fig3-data1-v2.xlsx
Figure 3—figure supplement 1

Loss of Tfr1 in myeloid osteoclast precursors has no impacts on osteoclast number and bone formation in 10-week-old male mice.
(A) Images of fast green and TRAP staining (scale bar = 200 μm) and (B–G) histomorphometric analysis of the metaphysis of decalcified distal femur histological sections of 10-week-old male control (con) and Tfr1ΔLysM mice. (H), (I), and (M) quantitative measurements of serum markers for bone resorption and bone formation by ELISA. (J–L) Dynamic histomorphometry analysis of tetracycline-labeled sections from undecalcified distal femurs. Tb: trabecular bone; BV/TV: bone volume/tissue volume; Tb.N: trabecular number; Tb.Th: trabecular thickness; Tb.Sp: trabecular spacing; Oc.S/BS: osteoclast surface/bone surface; BFR: bone formation rate; MAR: mineral apposition rate; sL.Pm: single tetracycline labeled surface. The data are presented as mean ± SD and analyzed by Student’s t-test. n=4-13.
-
Figure 3—figure supplement 1—source data 1
Loss of Tfr1 in myeloid osteoclast precursors has no impacts on osteoclast number and bone formation in 10-week-old male mice.
- https://cdn.elifesciences.org/articles/73539/elife-73539-fig3-figsupp1-data1-v2.xlsx
Figure 3—figure supplement 2
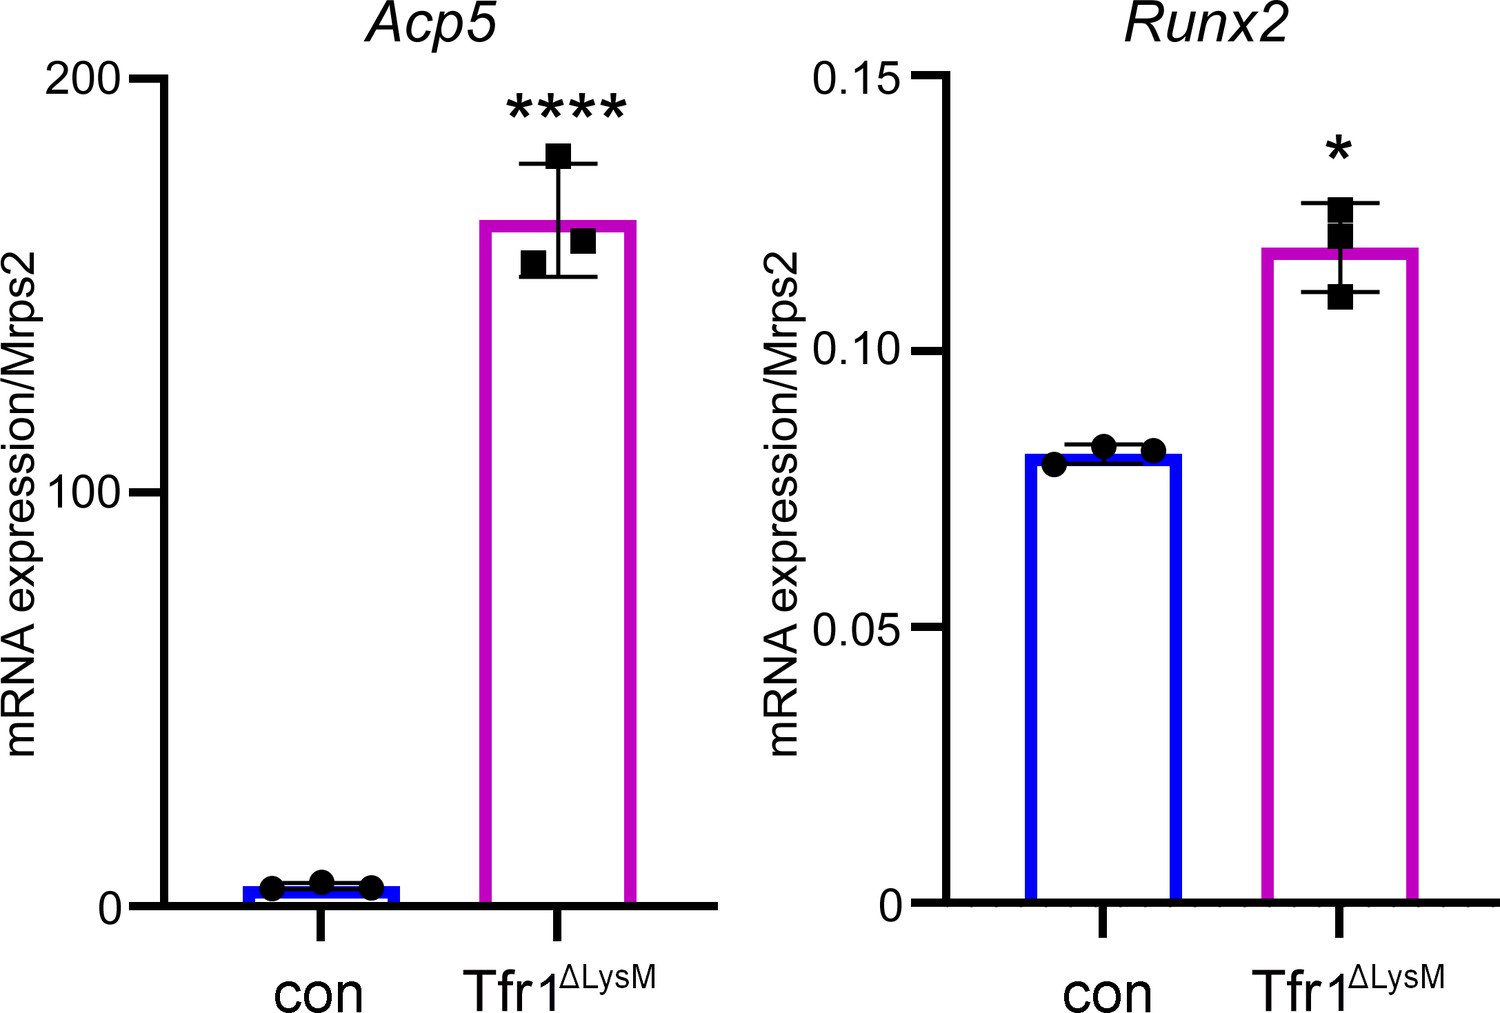
The mRNA levels of osteoclast marker gene Acp5 and osteoblast marker gene Runx2 increase in the distal femurs of female Tfr1ΔLysM mice.
Quantitative PCR detect of the mRNA expression of Acp5 and Runx2 in the distal femurs of control (con) and Tfr1ΔLysM 10-week-old female mice. The data are presented as mean ± SD. n=3. * p<0.05 and **** p<0.0001 vs con analyzed by Student’s t-test.
-
Figure 3—figure supplement 2—source data 1
The mRNA levels of osteoclast marker gene Acp5 and osteoblast marker gene Runx2 increase in the distal femurs of female Tfr1ΔLysM mice.
- https://cdn.elifesciences.org/articles/73539/elife-73539-fig3-figsupp2-data1-v2.xlsx
Figure 3—figure supplement 3
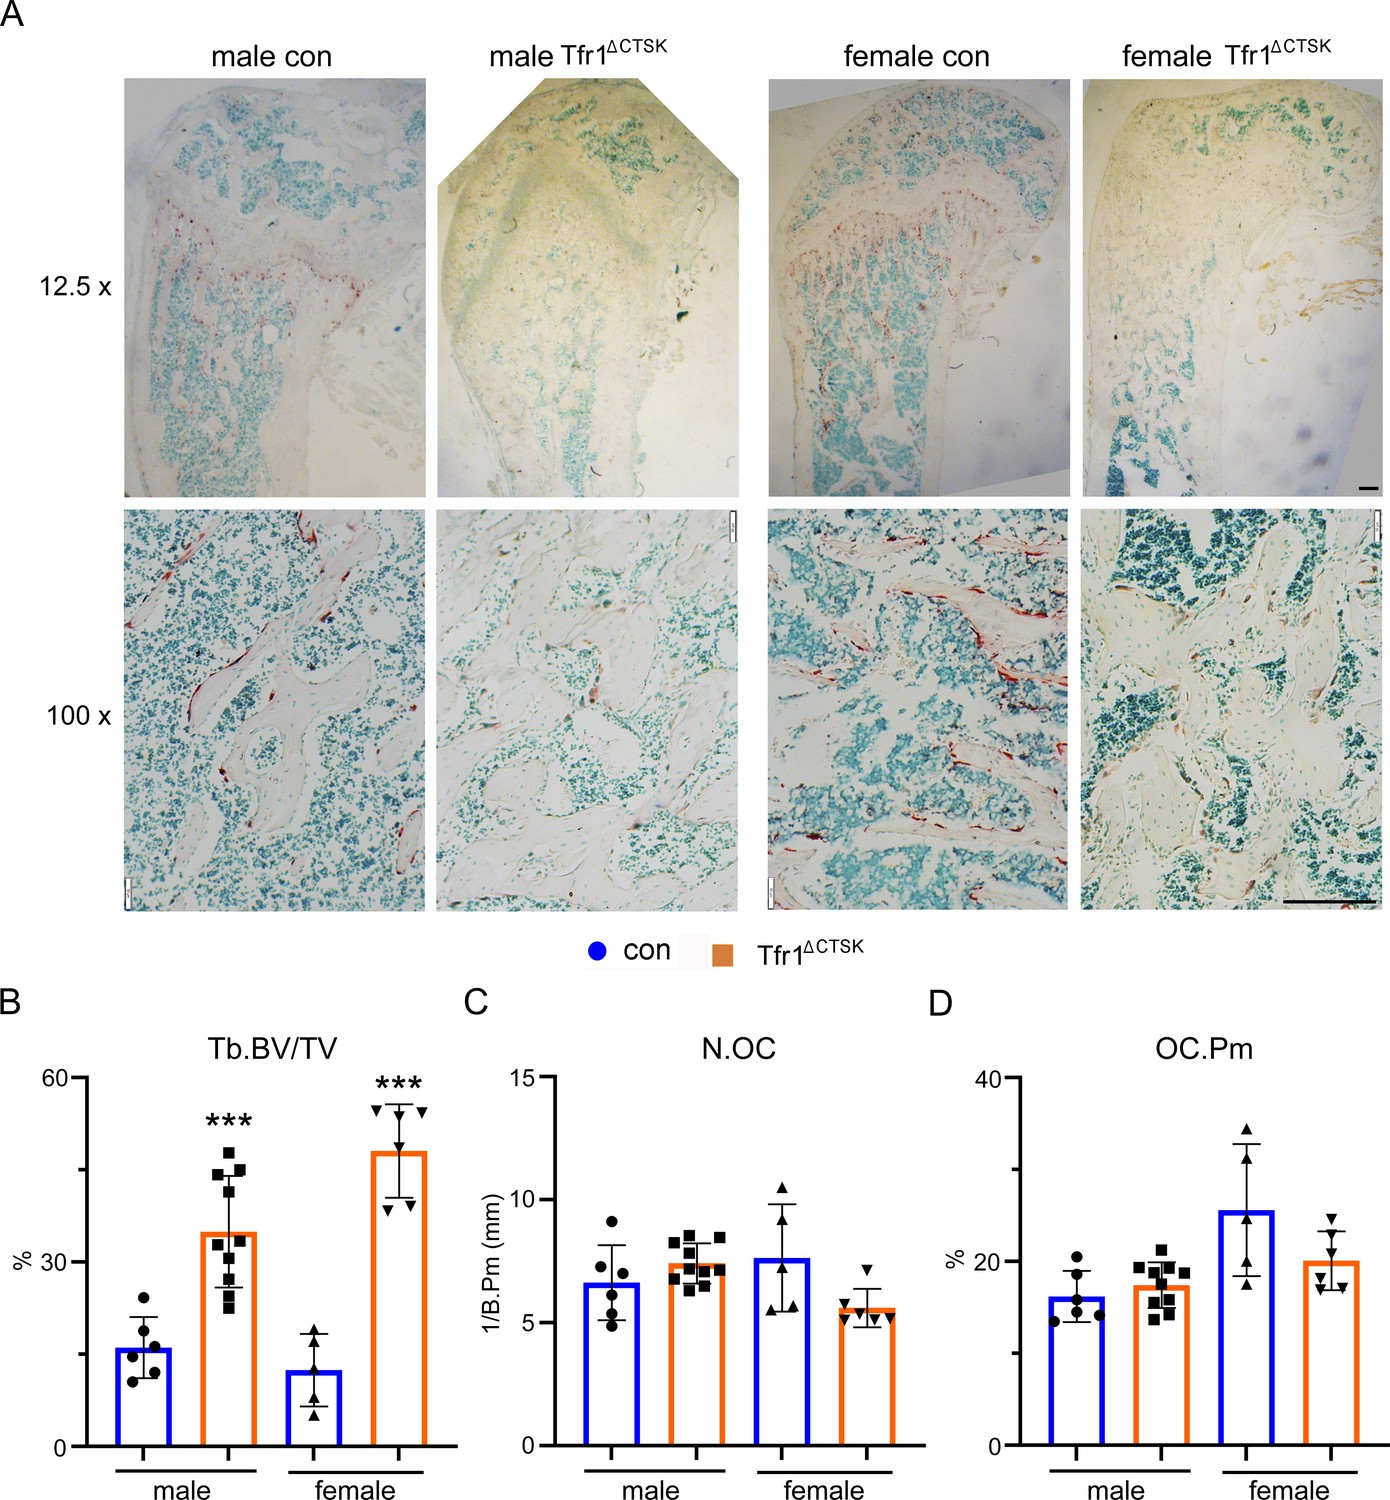
Deletion of Tfr1 in cathepsin K-Cre expressing osteoclasts increases trabecular bone mass without influence on osteoclastogenesis in vivo.
(A) The low (12.5×) and high (100×) magnification of images of TRAP staining of histological sections of decalcified distal femurs of 10-week-old control (con) and Tfr1 conditional knockout (Tfr1ΔCTSK) mice on the 129×C57BL6J mixed background. scale bars = 20 μm and 80 μm, respectively. (B–D) Histomorphometric analysis of trabecular bone mass and osteoclast number. BV/TV: bone volume/tissue volume; N.OC: osteoclast number/mm bone surface; OC.Pm: percentage of osteoclast surface/bone surface. The data are presented as mean ± SD. n=5–10. *** p<0.001 vs control by one-way ANOVA.
-
Figure 3—figure supplement 3—source data 1
Deletion of Tfr1 in cathepsin K-Cre expressing osteoclasts increases trabecular bone mass without influence on osteoclastogenesis in vivo.
- https://cdn.elifesciences.org/articles/73539/elife-73539-fig3-figsupp3-data1-v2.xlsx
Figure 4 with 1 supplement
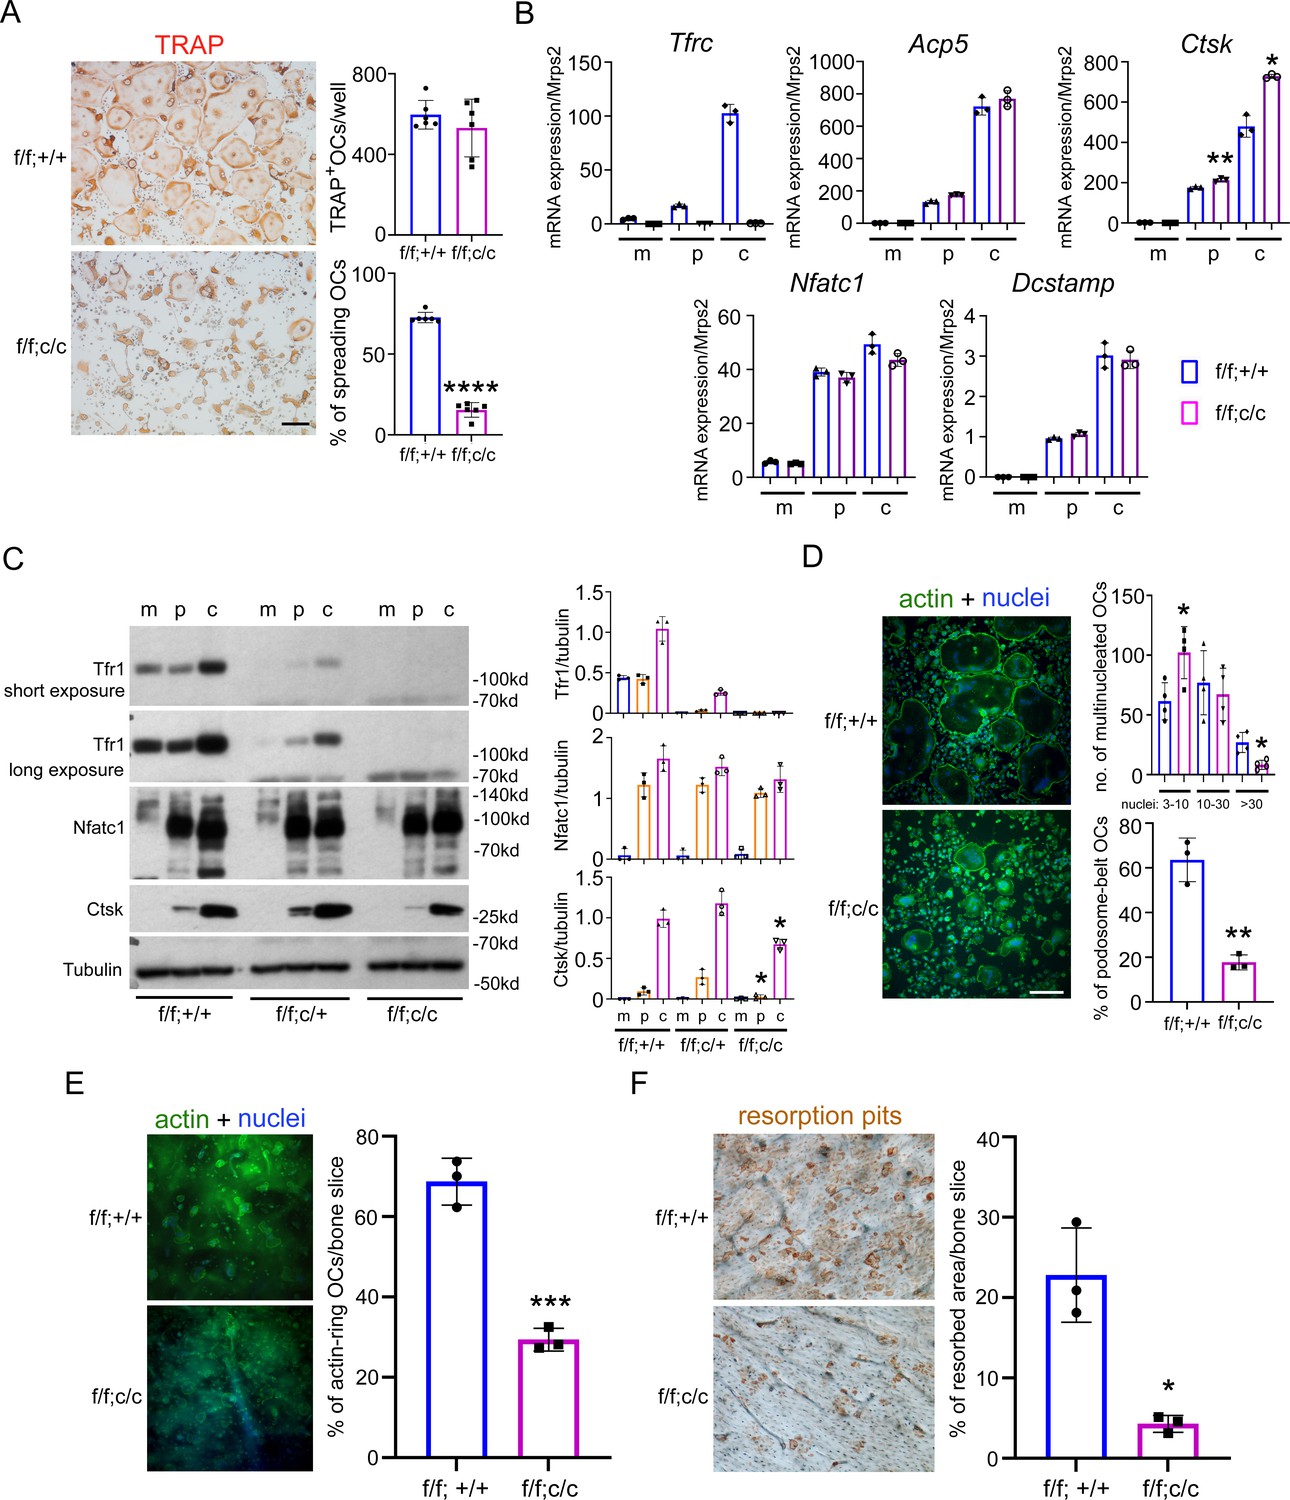
Deletion of Tfr1 in osteoclast myeloid precursors has no effects on osteoclast differentiation but attenuates cytoskeleton organization and bone resorption in mature osteoclasts cultured from female mice.
(A) TRAP staining (scale bar = 10 μm) and quantification of numbers of total and spreading osteoclasts (OCs) cultured on plastic 24-well dishes. n=6. (B) Quantitative PCR detection of the mRNA expression of Tfr1 and osteoclast marker genes relative to the mitochondrial gene Mrps2. Tfrc, encoding Tfr1; Acp5, encoding TRAP; Ctsk, encoding Cathepsin K; Nfatc1, encoding NFATc1; Dcstamp, encoding DC-Stamp. n=3. (C) The protein level of Tfr1 and osteoclast markers, NFATc1 and Cathepsin K (Ctsk), in bone marrow monocytes (m), mono-nuclear pre-osteoclasts (p), and mature osteoclasts (c) was detected by western blotting and quantified by densitometry using the NIH ImageJ software. Tubulin served as loading control. n=3. (D) The actin filaments and nuclear were stained by Alexa-488 conjugated Phalloidin and Hoechst 33258, respectively, in osteoclasts cultured on glass coverslips (scale bar = 10 μm). The number of osteoclasts with different nuclei and the percentage of spreading osteoclasts with the peripheral distributed podosome-belt were counted. n=3–4. (E) The actin filaments and nuclear were stained by Alexa-488 conjugated Phalloidin and Hoechst 33342, respectively, in osteoclasts cultured on cortical bovine bone slices (scale bar = 10 μm). The total number of osteoclasts and the number of osteoclasts with actin-ring were counted, and the percentage of active osteoclasts per bone slices was calculated. n=3. (F) Resorption pits were stained by horseradish peroxidase conjugated wheat-germ agglutinin (scale bar = 20 μm). The percentage of resorbed area per bone slice was calculated using the NIH ImageJ software. The data are presented as mean ± SD. n=3. * p<0.05; ** p<0.01; *** p<0.001;**** p<0.0001 vs control (f/f;+/+) by one-way ANOVA and Student’s t-test.
-
Figure 4—source data 1
Deletion of Tfr1 in osteoclast myeloid precursors has no effects on osteoclast differentiation but attenuates cytoskeleton organization and bone resorption in mature osteoclasts cultured from female mice.
- https://cdn.elifesciences.org/articles/73539/elife-73539-fig4-data1-v2.xlsx
-
Figure 4—source data 2
Immunoblotting for Figure 4C.
- https://cdn.elifesciences.org/articles/73539/elife-73539-fig4-data2-v2.tif
Figure 4—figure supplement 1
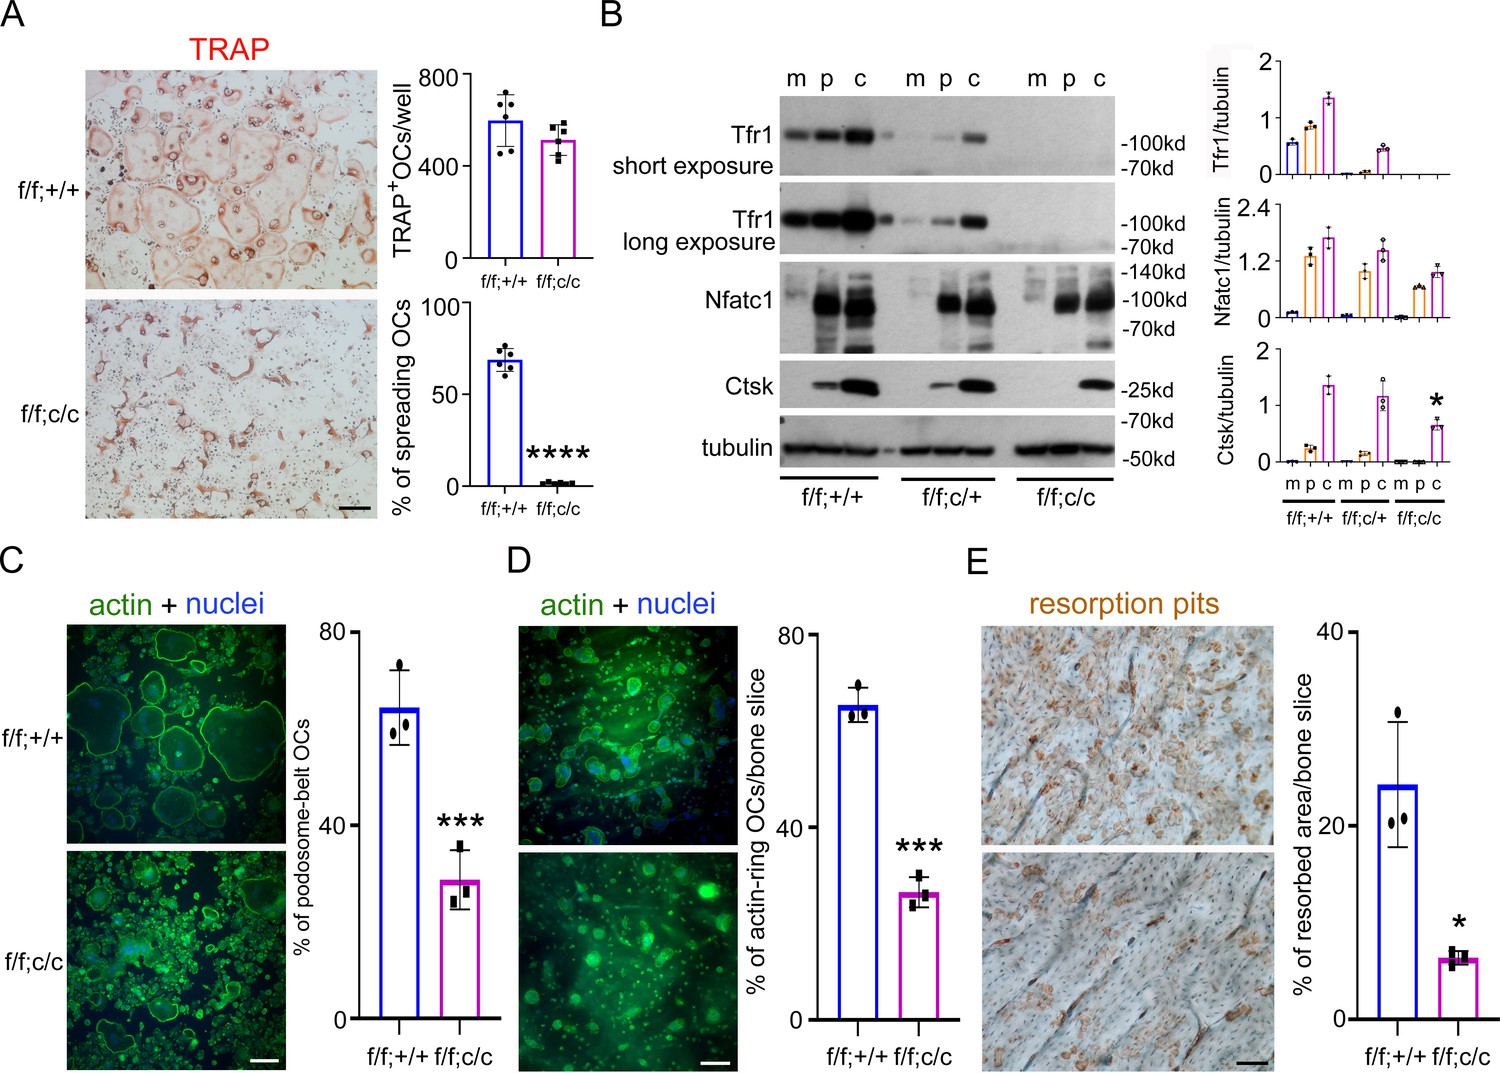
Deletion of Tfr1 in osteoclast myeloid precursors has no effects on osteoclast differentiation but attenuates cytoskeleton organization and bone resorption in mature osteoclasts cultured from male mice.
(A) TRAP staining (scale bar = 10 μm) and quantification of numbers of total and spreading osteoclasts (OCs) cultured on plastic 24-well dishes. n=6. (B) The protein level of Tfr1 and osteoclast markers, NFATc1 and Cathepsin K (Ctsk), in bone marrow monocytes (m), mono-nuclear pre-osteoclasts (p), and mature osteoclasts (c) was detected by western blotting and quantified by densitometry using the NIH ImageJ software. Tubulin served as loading control. n=3. (C) The actin filaments and nuclear were stained by Alexa-488 conjugated Phalloidin and Hoechst 33258, respectively, in osteoclasts cultured on glass coverslips (scale bar = 10 μm). The percentage of spreading osteoclasts with the peripheral distributed podosome-belt were counted. n=3–4. (D) The actin filaments and nuclear were stained by Alexa-488 conjugated Phalloidin and Hoechst 33342, respectively, in osteoclasts cultured on cortical bovine bone slices (scale bar = 10 μm). The total number of osteoclasts and the number of osteoclasts with actin-ring were counted and the percentage of active osteoclasts per bone slices was calculated. n=3. (E) Resorption pits were stained by horseradish peroxidase conjugated wheat-germ agglutinin (scale bar = 20 μm). The percentage of resorbed area per bone slice was calculated using the NIH ImageJ software. The data are presented as mean ± SD. n=3. * p<0.05, *** p<0.001, and **** p<0.0001 vs control (f/f;+/+) by one-way ANOVA and Student’s t-test.
-
Figure 4—figure supplement 1—source data 1
Deletion of Tfr1 in osteoclast myeloid precursors has no effects on osteoclast differentiation but attenuates cytoskeleton organization and bone resorption in mature osteoclasts cultured from male mice.
- https://cdn.elifesciences.org/articles/73539/elife-73539-fig4-figsupp1-data1-v2.xlsx
-
Figure 4—figure supplement 1—source data 2
Immunoblotting for Figure 4—figure supplement 1B.
- https://cdn.elifesciences.org/articles/73539/elife-73539-fig4-figsupp1-data2-v2.tif
Figure 5

High dose of hemin but not ferric ammonium citrate rescues the phenotypes of Tfr1-deficient osteoclasts.
(A) and (B) TRAP staining and quantification of the number of spreading osteoclasts in control (con) and Tfr1ΔLysM osteoclast cultures. n=6. scale bar = 10 μm. (C) and (D) Staining of actin filaments and nuclear and quantification of the number of podosome-belt and actin-ring osteoclasts cultured on glass coverslips and bone slices, respectively. n=4. scale bar = 10 μm. (E) Resorption pit staining in con and Tfr1ΔLysM cultures. Scale bar = 20 μm. The data are presented as mean ± SD. n=4. * p<0.05 and *** p<0.001 vs vehicle-treated cells; # p<0.05, ## p<0.01, and ### p<0.001 vs vehicle- or 10 μM hemin-treated control cells, respectively, by one-way ANOVA.
-
Figure 5—source data 1
High dose of hemin but not ferric ammonium citrate rescues the phenotypes of Tfr1-deficient osteoclasts.
- https://cdn.elifesciences.org/articles/73539/elife-73539-fig5-data1-v2.xlsx
Figure 6 with 1 supplement
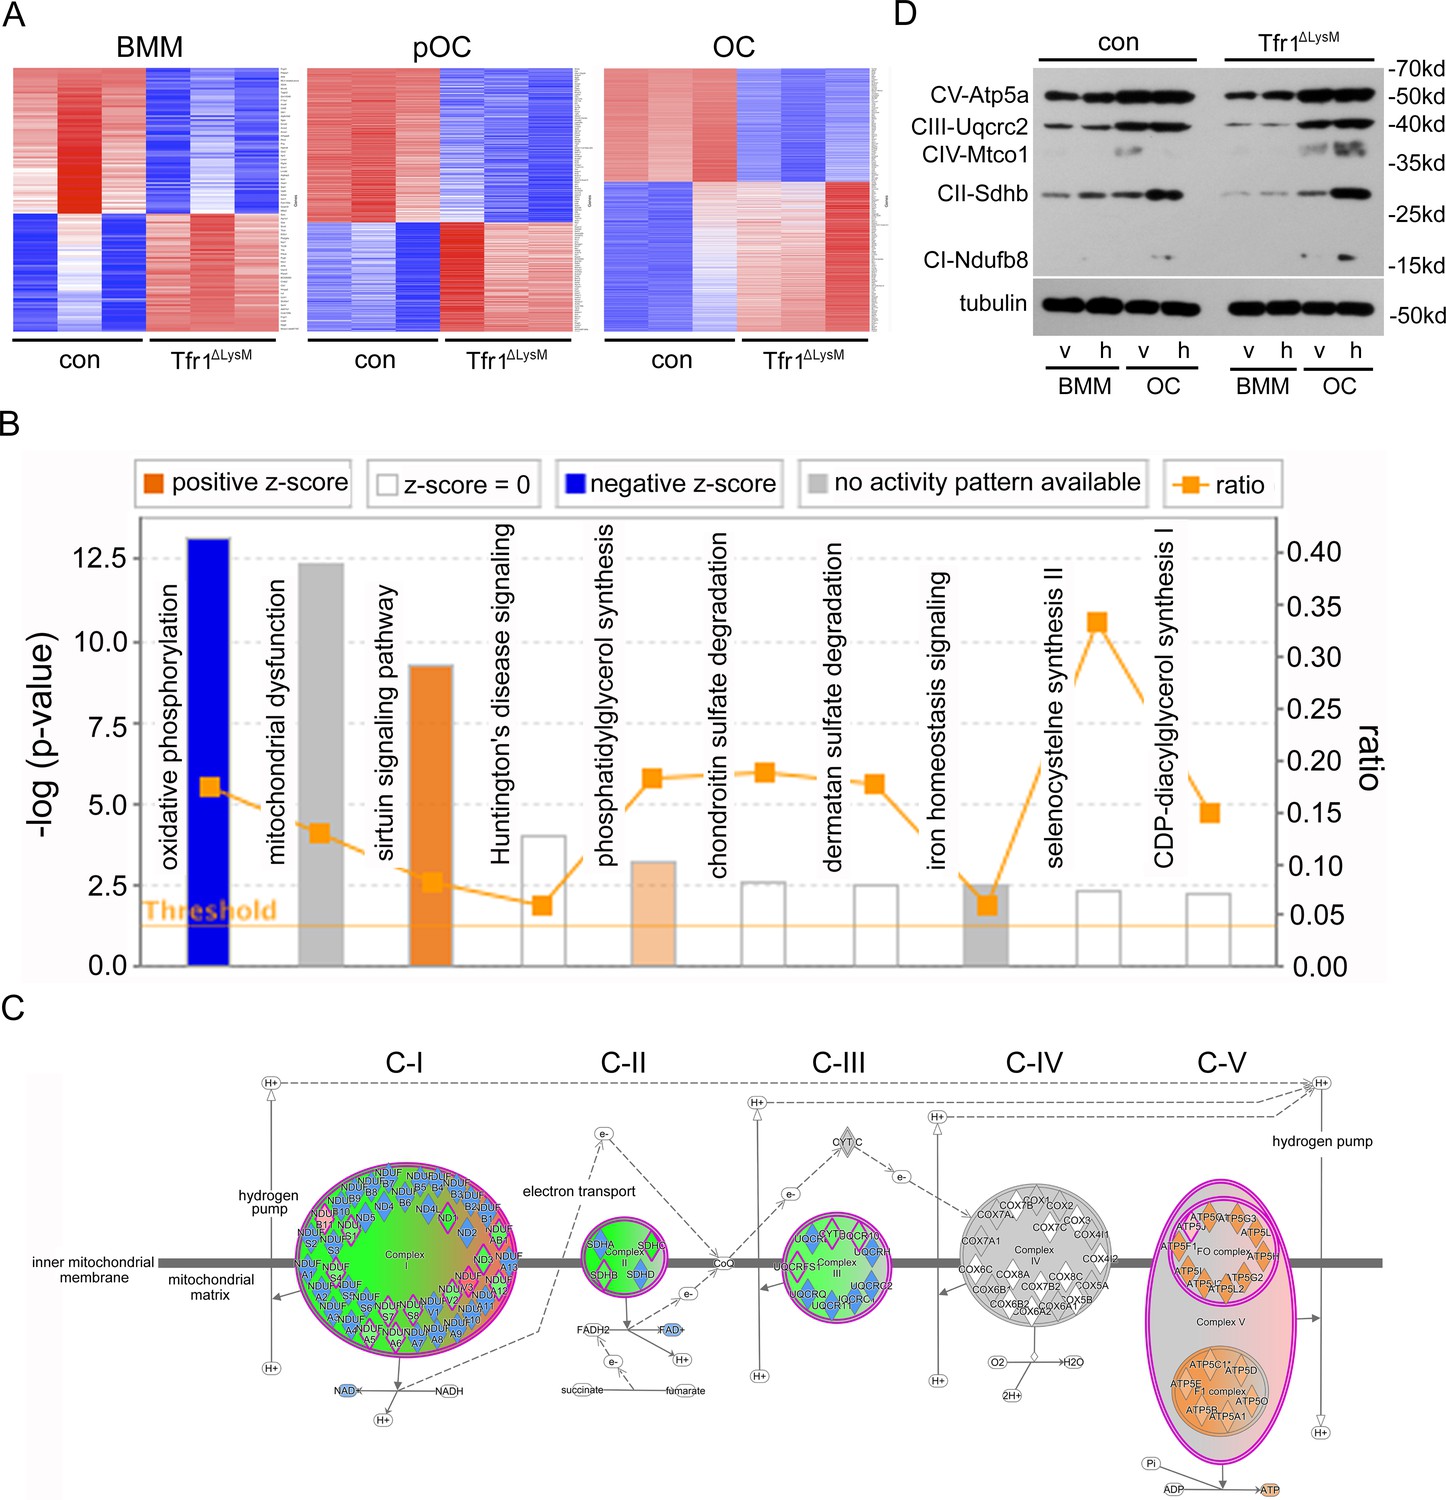
The mitochondrial oxidative phosphorylation is mostly affected by Tfr1-deficiency in mature osteoclasts.
(A) Heatmaps of proteins that are differentially regulated in control (con) and Tfr1ΔLysM bone marrow monocytes (BMM), mononuclear pre-osteoclasts (pOC), and mature osteoclasts (OC) identified by quantitative proteomics. (B) The signaling pathways that are affected by Tfr1-deficiency in mature osteoclasts identified by Ingenuity pathway analysis (IPA). (C) The changes of proteins along the mitochondrial respiration chain that are regulated by Tfr1 in mature osteoclasts. C-I to C-V: mitochondrial respiratory complex-I to complex-V. (D) Western blotting detection of the components of mitochondrial respiratory C-I to C-V in vehicle and 10 μM hemin treated con and Tfr1ΔLysM BMM and OCs.
-
Figure 6—source data 1
Immunoblotting for Figure 6D.
- https://cdn.elifesciences.org/articles/73539/elife-73539-fig6-data1-v2.tif
Figure 6—figure supplement 1
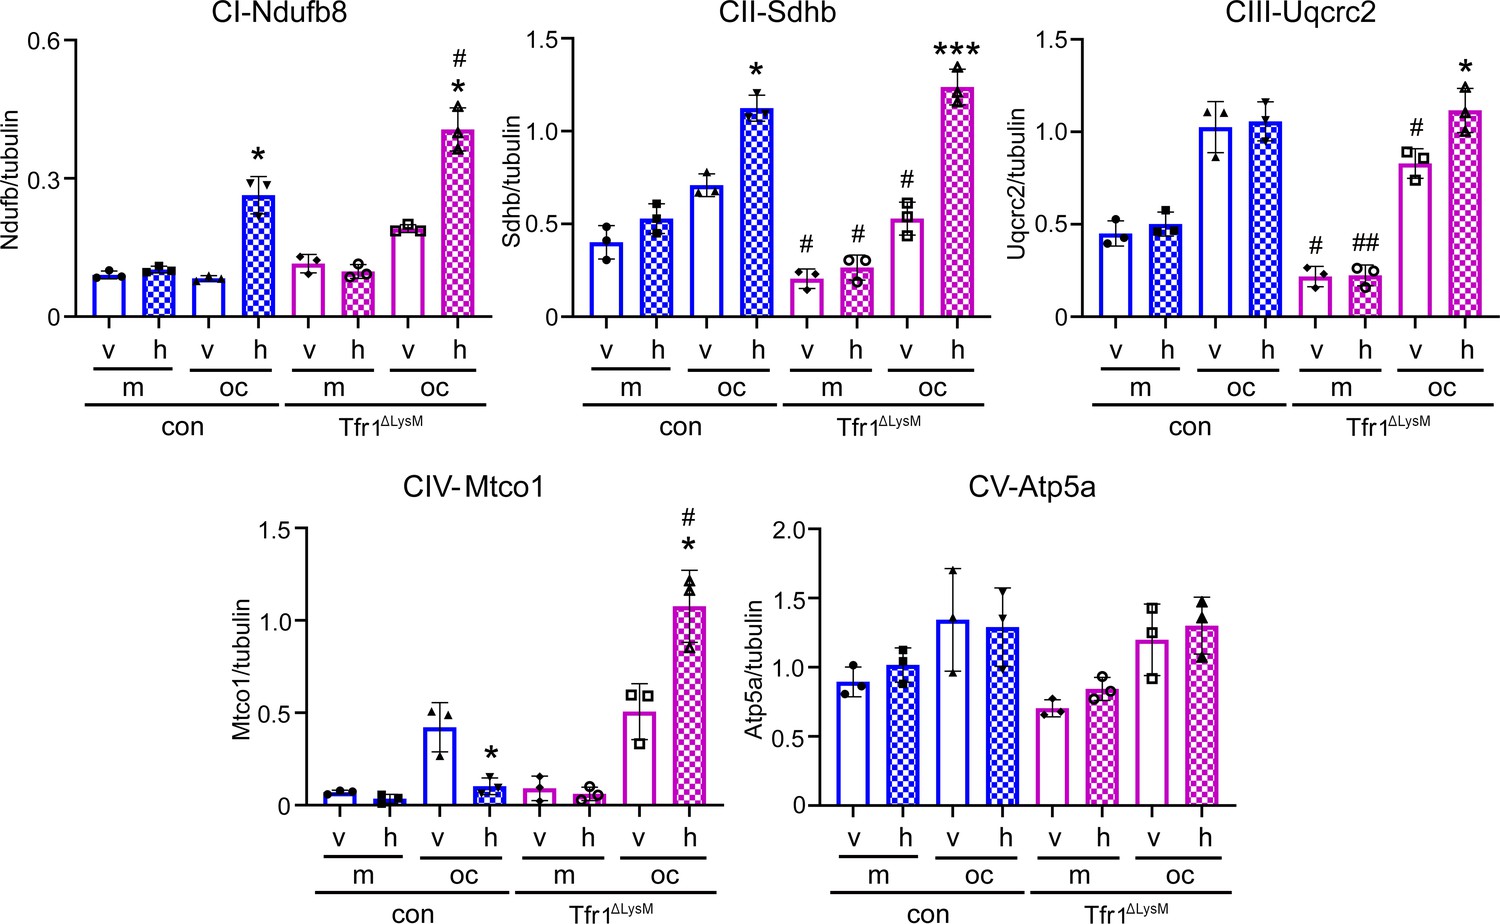
Quantification of immunoblotting bands in Figure 6D.
Each band in immunoblots was quantified by densitometry using the NIH ImageJ software. n=3 from three immunoblots. * p<0.05 and *** p<0.001 vs the corresponding vehicle-treated cells of the same genotype; The data are presented as mean ± SD. # p<0.05 and ## p<0.01 vs the respective control cells of the same treatment by one-way ANOVA.
-
Figure 6—figure supplement 1—source data 1
Quantification of immunoblotting bands in Figure 6D.
- https://cdn.elifesciences.org/articles/73539/elife-73539-fig6-figsupp1-data1-v2.xlsx
Figure 7
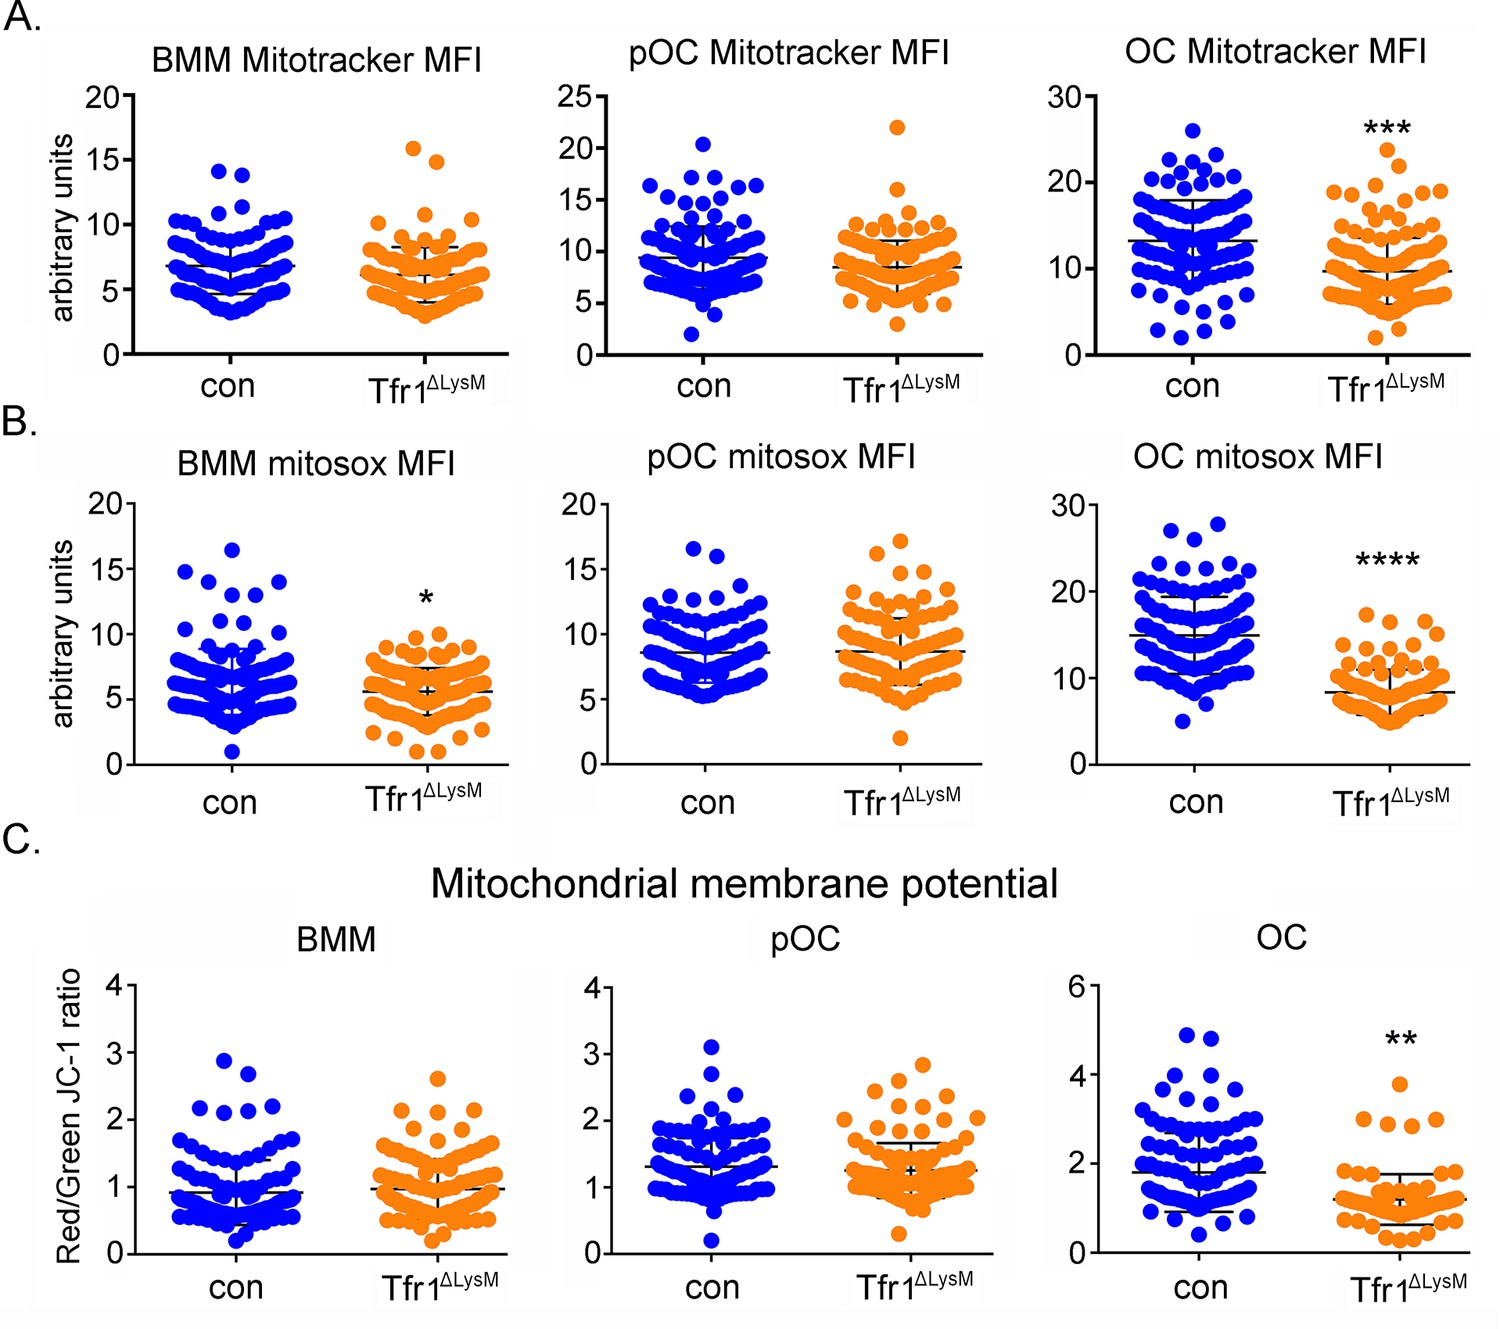
Loss of Tfr1 inhibits mitochondrial mass, reactive oxygen species (ROS) production, and membrane potential in mature osteoclasts.
(A) Quantification of mitochondrial mass by Mito Tracker green staining in control (con) and Tfr1ΔLysM bone marrow monocytes (BMM), mononuclear pre-osteoclasts (pOC), and mature osteoclasts (OC). (B) Measurement of mitochondria-derived ROS by Mitosox staining in con and Tfr1-deficient osteoclast lineage cells. (C) Measurement of mitochondrial membrane potential by JC-1 cationic carbocyanine dye staining in con and cKO osteoclast lineage cells. The data are presented as mean ± SD. n=25–50. ** p<0.01, *** p<0.001, and **** p<0.0001 vs con by unpaired Student’s t-test. MFI: mean fluorescent intensity per cell in arbitrary units.
-
Figure 7—source data 1
Loss of Tfr1 inhibits mitochondrial mass, reactive oxygen species (ROS) production, and membrane potential in mature osteoclasts.
- https://cdn.elifesciences.org/articles/73539/elife-73539-fig7-data1-v2.xlsx
Figure 8
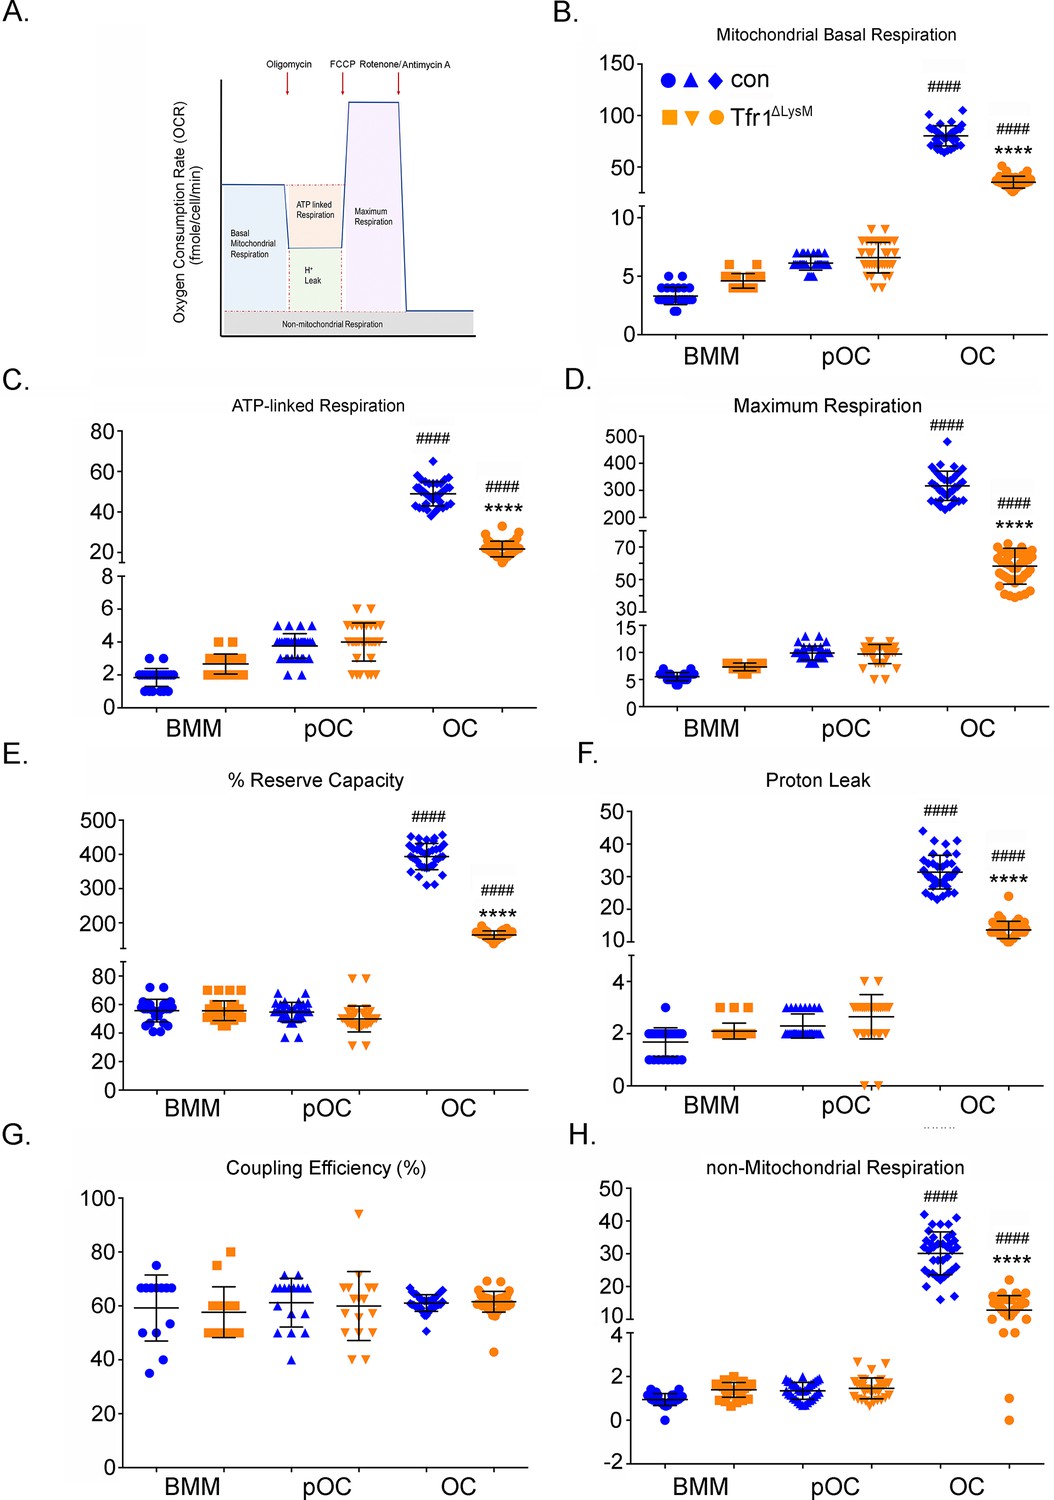
Tfr1-deletion in osteoclast lineage cells impairs mitochondrial and non-mitochondrial respirations in mature osteoclasts.
(A) A graphic illustration of oxygen consumption measured by a Seahorse Extracellular Flux analyzer. FCCP: carbonyl cyanide p-trifluoro-methoxyphenyl hydrazone, a synthetic mitochondrial uncoupler. (B–H) Different fractions of mitochondrial and non-mitochondrial respirations per cell of control (blue) and Tfr1ΔLysM (orange) bone marrow monocytes (BMM), mononuclear pre-osteoclasts (pOC), and mature osteoclasts (OC). The data are presented as mean ± SD. n=15-30. #### p<0.0001 vs BMM and pOC; **** p<0.0001 vs control OC by unpaired Student’s t-test.
-
Figure 8—source data 1
Tfr1-deletion in osteoclast lineage cells impairs mitochondrial and non-mitochondrial respirations in mature osteoclasts.
- https://cdn.elifesciences.org/articles/73539/elife-73539-fig8-data1-v2.xlsx
Figure 9 with 1 supplement
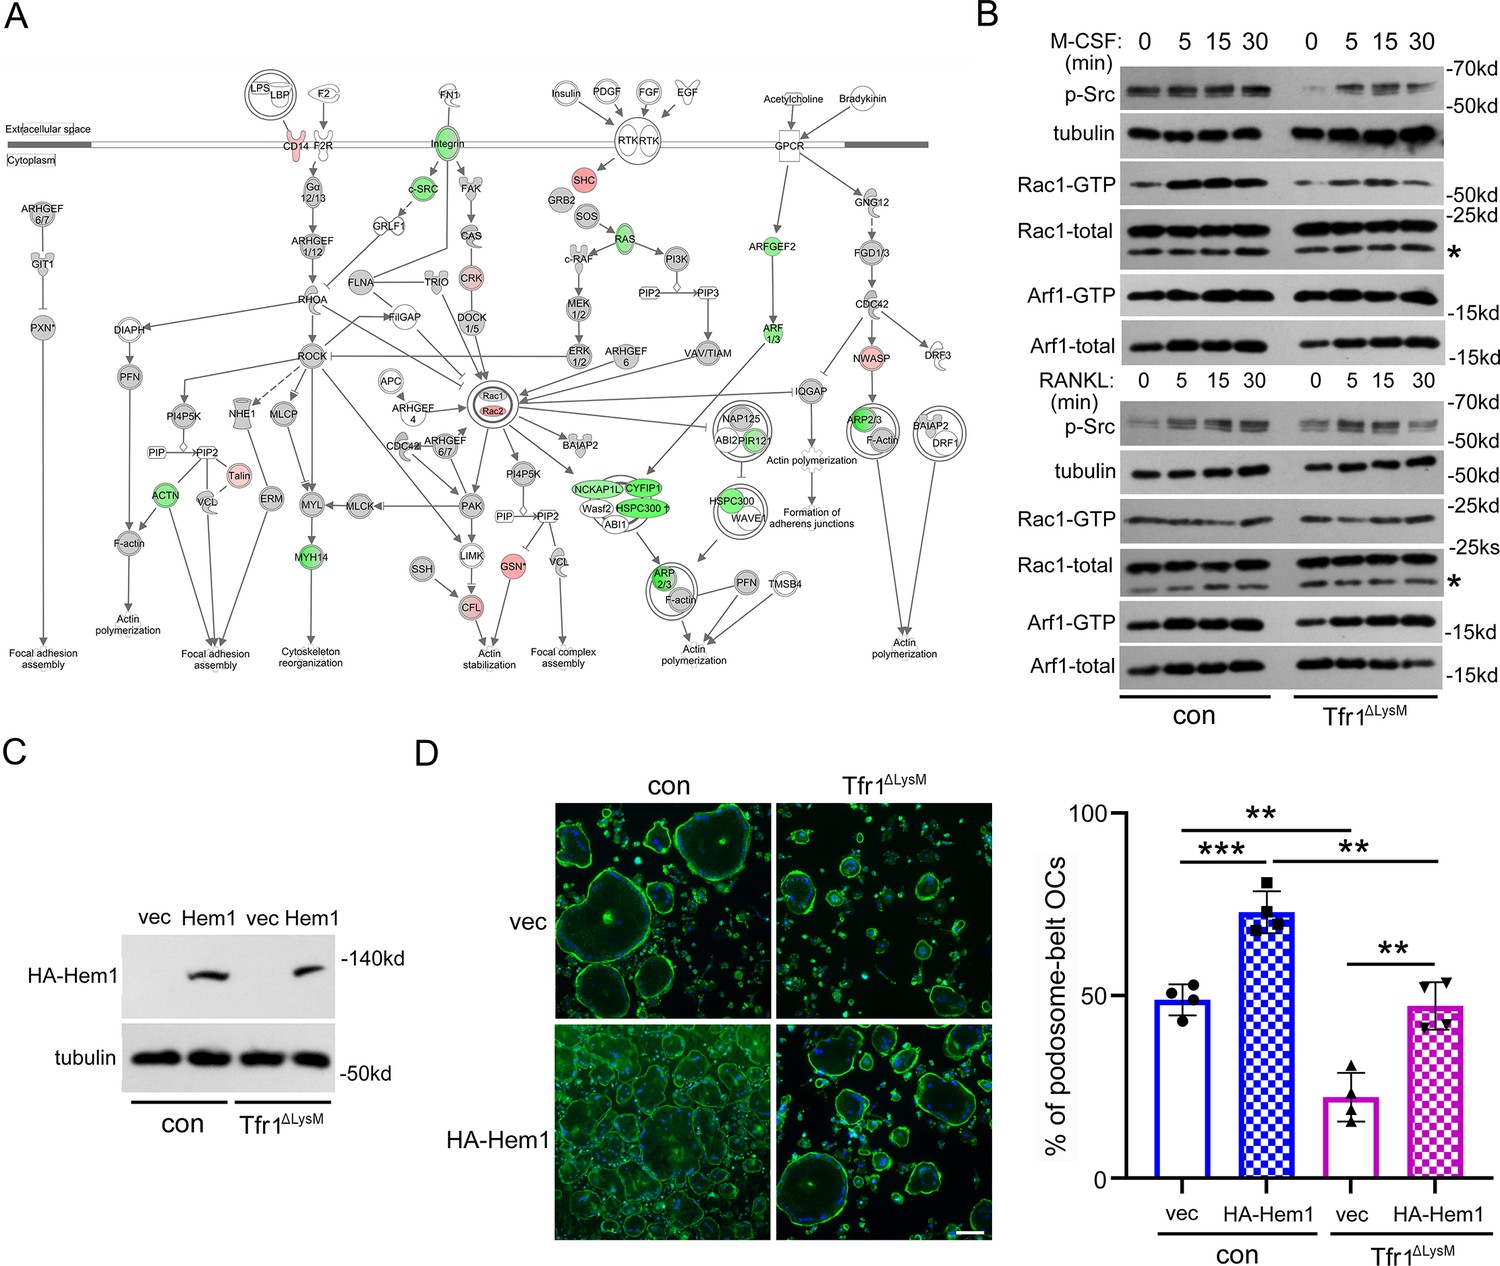
Loss of Tfr1 in osteoclasts inhibits the macrophage colony-stimulating factor (M-CSF) stimulated activation of c-Src and Rac1, and overexpression of Hem1 partially recuses the cytoskeletal organization defect in Tfr1-null osteoclasts.
(A) A schematic map of cytoskeletal pathways generated by Ingenuity pathway analysis (IPA). The downregulated proteins are shown in green and upregulated proteins are marked in red orange. (B) Western blotting detection of M-CSF and receptor activator of NF-κB ligand (RANKL) induced phosphorylation of c-Src and the GTP-bound (active) form of small GTPase Rac1 and Arf1 in con and Tfr1ΔLysM osteoclasts. The stars indicate unspecific bands. (C) Detection of HA-tagged Hem1 (encoded by Nckap1l) by western blotting in retroviral transduced con and Tfr1ΔLysM bone marrow monocytes expressing empty vector (vec) and recombinant Hem1. Tubulin served as loading control. (D) The staining of actin filaments and nuclear in osteoclasts cultured on glass coverslips and quantification of the number of osteoclasts with podosome-belt. scale bar = 10 μm. The data are presented as mean ± SD. n=4. ** p<0.01 and *** p<0.001 by one-way ANOVA.
-
Figure 9—source data 1
Loss of Tfr1 in osteoclasts inhibits the macrophage colony-stimulating factor (M-CSF) stimulated activation of c-Src and Rac1 and overexpression of Hem1 partially recuses the cytoskeletal organization defect in Tfr1-null osteoclasts.
- https://cdn.elifesciences.org/articles/73539/elife-73539-fig9-data1-v2.xlsx
-
Figure 9—source data 2
Immunoblotting for Figure 9B.
- https://cdn.elifesciences.org/articles/73539/elife-73539-fig9-data2-v2.tif
Figure 9—figure supplement 1

Quantification of immunoblotting bands in Figure 9B.
Each band in immunoblots was quantified by densitometry using the NIH ImageJ software. n=3 from three immunoblots. * p<0.05, ** p<0.01, and p<0.001 vs control (con) of the same time point; The data are presented as mean ± SD. # p<0.05, ## p<0.01, and ### p<0.001 vs 0 min of the same genotype by one-way ANOVA.
-
Figure 9—figure supplement 1—source data 1
Quantification of immunoblotting bands in Figure 9B.
- https://cdn.elifesciences.org/articles/73539/elife-73539-fig9-figsupp1-data1-v2.xlsx
Tables
Key resources table
| Reagent type (species) or resource | Designation | Source or reference | Identifiers | Additional information |
|---|---|---|---|---|
| Strain and strain background (Mus musculus) | Tfrc-flox | Dr. Nancy C Andrews | 129Sv | |
| Strain and strain background (Mus musculus) | Tfrc-flox | Zhao Lab | C57BL6/J | |
| Strain and strain background (Mus musculus) | Lyz2-Cre | The Jackson Laboratory | cat#004781 | C57BL6/J |
| Strain and strain background (Mus musculus) | Ctsk-Cre | Dr. Takashi Nakamura | C57BL6/J | |
| Other | alpha-MEM | MilliporeSigma | M0644 | cell culture medium |
| Other | Blasticidin | MilliporeSigma | 203,350 | Antibiotics (2 μg/ml) |
| Other | DMEM | MilliporeSigma | D-5648 | cell culture medium |
| Other | Fetal bovine serum (FBS) | Hyclone | cell culture (10%) | |
| Other | 10× penicillin-streptomycin- l-glutamine | MilliporeSigma | G1146 | Antibiotics (1×) |
| Other | 10× trypsin/EDTA | Thermo-Fisher Scientific | 15400–054 | Antibiotics (1×) |
| Chemical compound and drug | Mouse apo-transferrin | MilliporeSigma | T0523 | |
| Chemical compound and drug | Dihydrotestosterone | MilliporeSigma | D-073 | 10–8 M |
| Chemical compound and drug | Estrodiol | MilliporeSigma | E2257 | 10–8 M |
| Chemical compound and drug | ferric ammonium citrate (FAC) | MilliporeSigma | F5879 | |
| Chemical compound and drug | Fe59 ferric chloride | PerkinElmer Inc | ||
| Chemical compound and drug | Hemin | MilliporeSigma | H9039 | |
| Chemical compound and drug | Sodium bicarbonate | MilliporeSigma | S5761 | |
| Other | Albumin | MilliporeSigma | A7906 | Blocking reagent (0.20% in PBS) |
| Other | Alexa Fluro-488 Phalloidin | Thermo-Fisher Scientific | A12379 | Filament actin staining (1:400) |
| Other | Glycerol | MilliporeSigma | G5516 | mounting reagent (80% in PBS) |
| Other | Hoechst 33,342 | Thermo-Fisher Scientific | H3570 | Nuclei staining (1:4,000 in PBS) |
| Other | Paraformaldehyde | MilliporeSigma | P6148 | immunofluorescent staining (4% in PBS) |
| Other | Triton X-100 | MilliporeSigma | T-9284 | immunofluorescent staining (0.1%) |
| Other | NaK tartrate | MilliporeSigma | S6170 | TRAP staining |
| Other | Naphthol AS-BI (phosphoric acid solution) | MilliporeSigma | 1,802 | TRAP staining |
| Other | 3,3’-diaminobenzidine (DAB) tablets | MilliporeSigma | D-5905 | pit staining |
| Other | 30% H2O2 | MilliporeSigma | 216,763 | pit staining |
| Other | Peroxidase-conjugated WGA (wheat germ agglutinin) lectin | MilliporeSigma | L-7017 | pit staining (20 μg/ml) |
| Other | cOmplete EDTA-free protease inhibitor cocktail | MilliporeSigma | 4693159001 | protease inhibitor |
| Other | Enhanced chemiluminescent detection reagents (ECL) | MilliporeSigma | WBKLS0100 | immunoblotting |
| Other | Polyvinylidene difluoride membrane (PVDF) | MilliporeSigma | IPVH00010 | immunoblotting |
| Other | RIPA buffer | MilliporeSigma | R-0278 | cell lysate |
| Antibody | Mouse monoclonal anti-cathepsin K (clone 182–12 G5) | MilliporeSigma | MAB3324 | 1:2000 |
| Antibody | Mouse monoclonal anti-HA.11 (clone 16B12) | Biolegend | 901,513 | 1:5000 |
| Antibody | Mouse monoclonal anti-Tfr1 (clone H68.4) | Thermo-Fisher Scientific | 13–6800 | 1:500 |
| Antibody | Mouse monoclonal anti-tubulin (clone DM1A) | MilliporeSigma | T9026 | 1:3000 |
| Antibody | Mouse monoclonal Total OXPHOS Antibody Cocktail | Abcam | ab110413 | 1:1000 |
| Antibody | Goat polyclonal HRP-anti-mouse secondary antibody | Cell Signaling Technology | 7,076 | 1:5000 |
| Antibody | Goat polyclonal HRP-anti-rabbit secondary antibody | Cell Signaling Technology | 7,074 | 1:5000 |
| Commercial assay or kit | High-capacity cDNA reverse transcription kit | Thermo-Fisher Scientific | 4368813 | |
| Commercial assay or kit | RNeasy mini kit | Qiagen | 74,104 | |
| Commercial assay or kit | Serum TRAcP-5b | Immunodiagnostic Systems | SB-TR103 | |
| Commercial assay or kit | RatLaps (CTx-I) EIA | Immunodiagnostic Systems | AC-06F1 | |
| Commercial assay or kit | Rat/mouse PINP EIA | Immunodiagnostic Systems | AC-33F1 | |
| Commercial assay or kit | Hepcidin Murine-Complete ELISA Kit | Intrinsic Lifesciences | HMC-001 | |
| Commercial assay or kit | Pointe Scientific Iron/TIBC Reagents | Fisherscientific | 23-666-320 | |
| Commercial assay or kit | Iron Assay Kit | Abcam | ab83366 | |
| Commercial assay or kit | Active Arf1 pull-down and detection kit | Thermo-Fisher Scientific | 16,121 | |
| Commercial assay or kit | Active Rac1 pull-down and detection kit | Thermo-Fisher Scientific | 16,118 | |
| Commercial assay or kit | TMTsixplex isobaric Mass Tagging kit | Thermo-Fisher Scientific | 90,064 | |
| Other | MitoTracker Green fluorescence | Thermo-Fisher Scientific | M7514 | Mitochondrial assay reagent |
| Other | MitoSOX Red | Thermo-Fisher Scientific | M36008 | Mitochondrial assay reagent |
| Other | JC-1 Dye | Thermo-Fisher Scientific | T3168 | Mitochondrial assay reagent |
| Recombinant DNA reagent | Murine Nckap1l | Dharmacon Inc | MMM1013-202769283 | cDNA template |
| Commercial assay or kit | TransIT-LT1 | Mirus Bio LLC | MIR2300 | DNA transfection reagent |
| Commercial assay or kit | Acp5 | Thermo-Fisher Scientific | Mm00475698_m1 | Quantitative PCR (qPCR) primer |
| Commercial assay or kit | Ctsk | Thermo-Fisher Scientific | Mm00484039_m1 | qPCR primer |
| Commercial assay or kit | mt-Cox1 | Thermo-Fisher Scientific | Mm00432648_m1 | qPCR primer |
| Commercial assay or kit | Dcstamp | Thermo-Fisher Scientific | Mm04209236_m1 | qPCR primer |
| Commercial assay or kit | Nfatc1 | Thermo-Fisher Scientific | Mm00479445_m1 | qPCR primer |
| Commercial assay or kit | Mfsd7c | Thermo-Fisher Scientific | Mm01302920_m1 | qPCR primer |
| Commercial assay or kit | Mrps2 | Thermo-Fisher Scientific | Mm00475529_m1 | qPCR primer |
| Commercial assay or kit | Runx2 | Thermo-Fisher Scientific | Mm00501584_m1 | qPCR primer |
| Commercial assay or kit | Slc11a2 | Thermo-Fisher Scientific | Mm00435363_m1 | qPCR primer |
| Commercial assay or kit | Slc39a14 | Thermo-Fisher Scientific | Mm01317439_m1 | qPCR primer |
| Commercial assay or kit | Slc40a1 | Thermo-Fisher Scientific | Mm01254822_m1 | qPCR primer |
| Commercial assay or kit | Slc46a1 | Thermo-Fisher Scientific | Mm00546630_m1 | qPCR primer |
| Commercial assay or kit | Tfrc | Thermo-Fisher Scientific | Mm00441941_m1 | qPCR primer |
| Commercial assay or kit | Tfr2 | Thermo-Fisher Scientific | Mm00443703_m1 | qPCR primer |
Additional files
-
Supplementary file 1
Bone marrow monocytes qProteomics.
- https://cdn.elifesciences.org/articles/73539/elife-73539-supp1-v2.xlsx
-
Supplementary file 2
Pre-osteoclasts qProteomics.
- https://cdn.elifesciences.org/articles/73539/elife-73539-supp2-v2.xlsx
-
Supplementary file 3
Osteoclasts qProteomics.
- https://cdn.elifesciences.org/articles/73539/elife-73539-supp3-v2.xlsx
-
Supplementary file 4
Ingenuity pathway analysis (IPA) of canonical pathways in osteoclasts.
- https://cdn.elifesciences.org/articles/73539/elife-73539-supp4-v2.xls
-
Supplementary file 5
Changes of cytoskeletal proteins in TfR1-null osteoclast lineage cells revealed by qProteomics.
- https://cdn.elifesciences.org/articles/73539/elife-73539-supp5-v2.docx
-
MDAR checklist
- https://cdn.elifesciences.org/articles/73539/elife-73539-mdarchecklist1-v2.docx
Download links
A two-part list of links to download the article, or parts of the article, in various formats.
Downloads (link to download the article as PDF)
Open citations (links to open the citations from this article in various online reference manager services)
Cite this article (links to download the citations from this article in formats compatible with various reference manager tools)
Transferrin receptor 1-mediated iron uptake regulates bone mass in mice via osteoclast mitochondria and cytoskeleton
eLife 11:e73539.
https://doi.org/10.7554/eLife.73539


