Notch controls the cell cycle to define leader versus follower identities during collective cell migration
- Randall Centre for Cell and Molecular Biophysics, Guy's Campus, King's College London, United Kingdom
- Cellular Adaptive Behaviour Lab, Francis Crick Institute, United Kingdom
- Department of Biology & Biochemistry, University of Bath, United Kingdom
- Committee on Development, Regeneration and Stem Cell Biology, The University of Chicago, United States
- Department of Biology, University of Padova, Italy
- Department of Organismal Biology and Anatomy, The University of Chicago, United States
- Department of Informatics, King's College London, United Kingdom
Figures
Figure 1 with 1 supplement
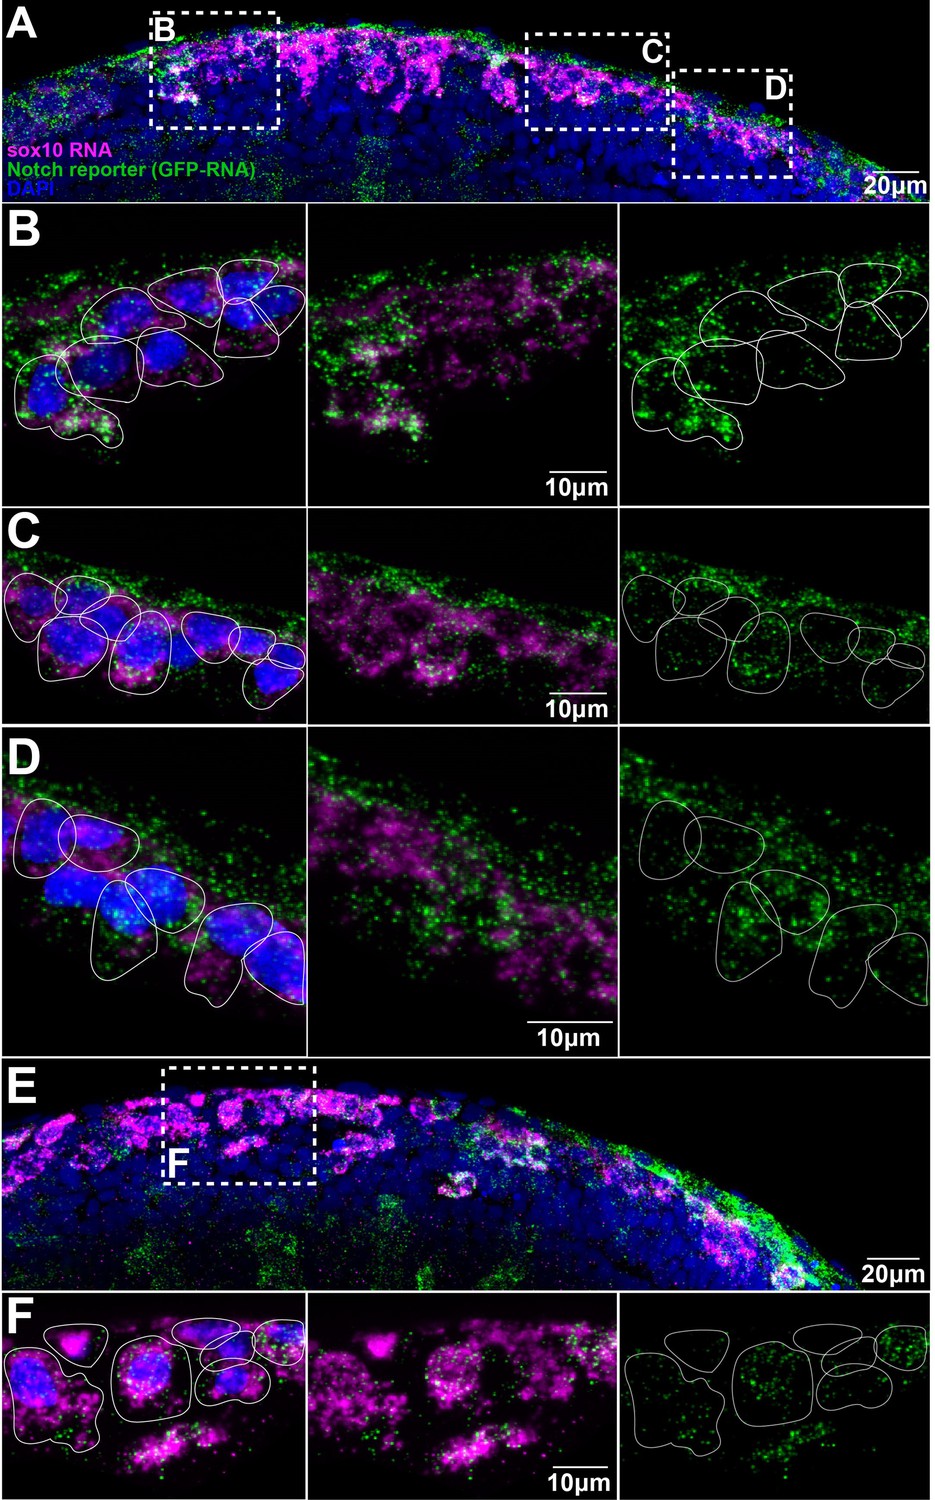
Trunk neural crest (TNC) present different levels of Notch activity.
(A, E) Images of two different Notch reporter 12xNRE:egfp embryos (18 hpf) stained for sox10 (magenta) and GFP (green) RNAs, and nuclei stained with DAPI (blue). (B) Enlargement of the anterior area in (A). (C) Enlargement of the more posterior area in (A). (D) Enlargement of the anterior most posterior area in (A). (F) Enlargement of the outlined area in (E). Anterior to the left, dorsal top. White lines show approximate cell boundaries.
Figure 1—figure supplement 1
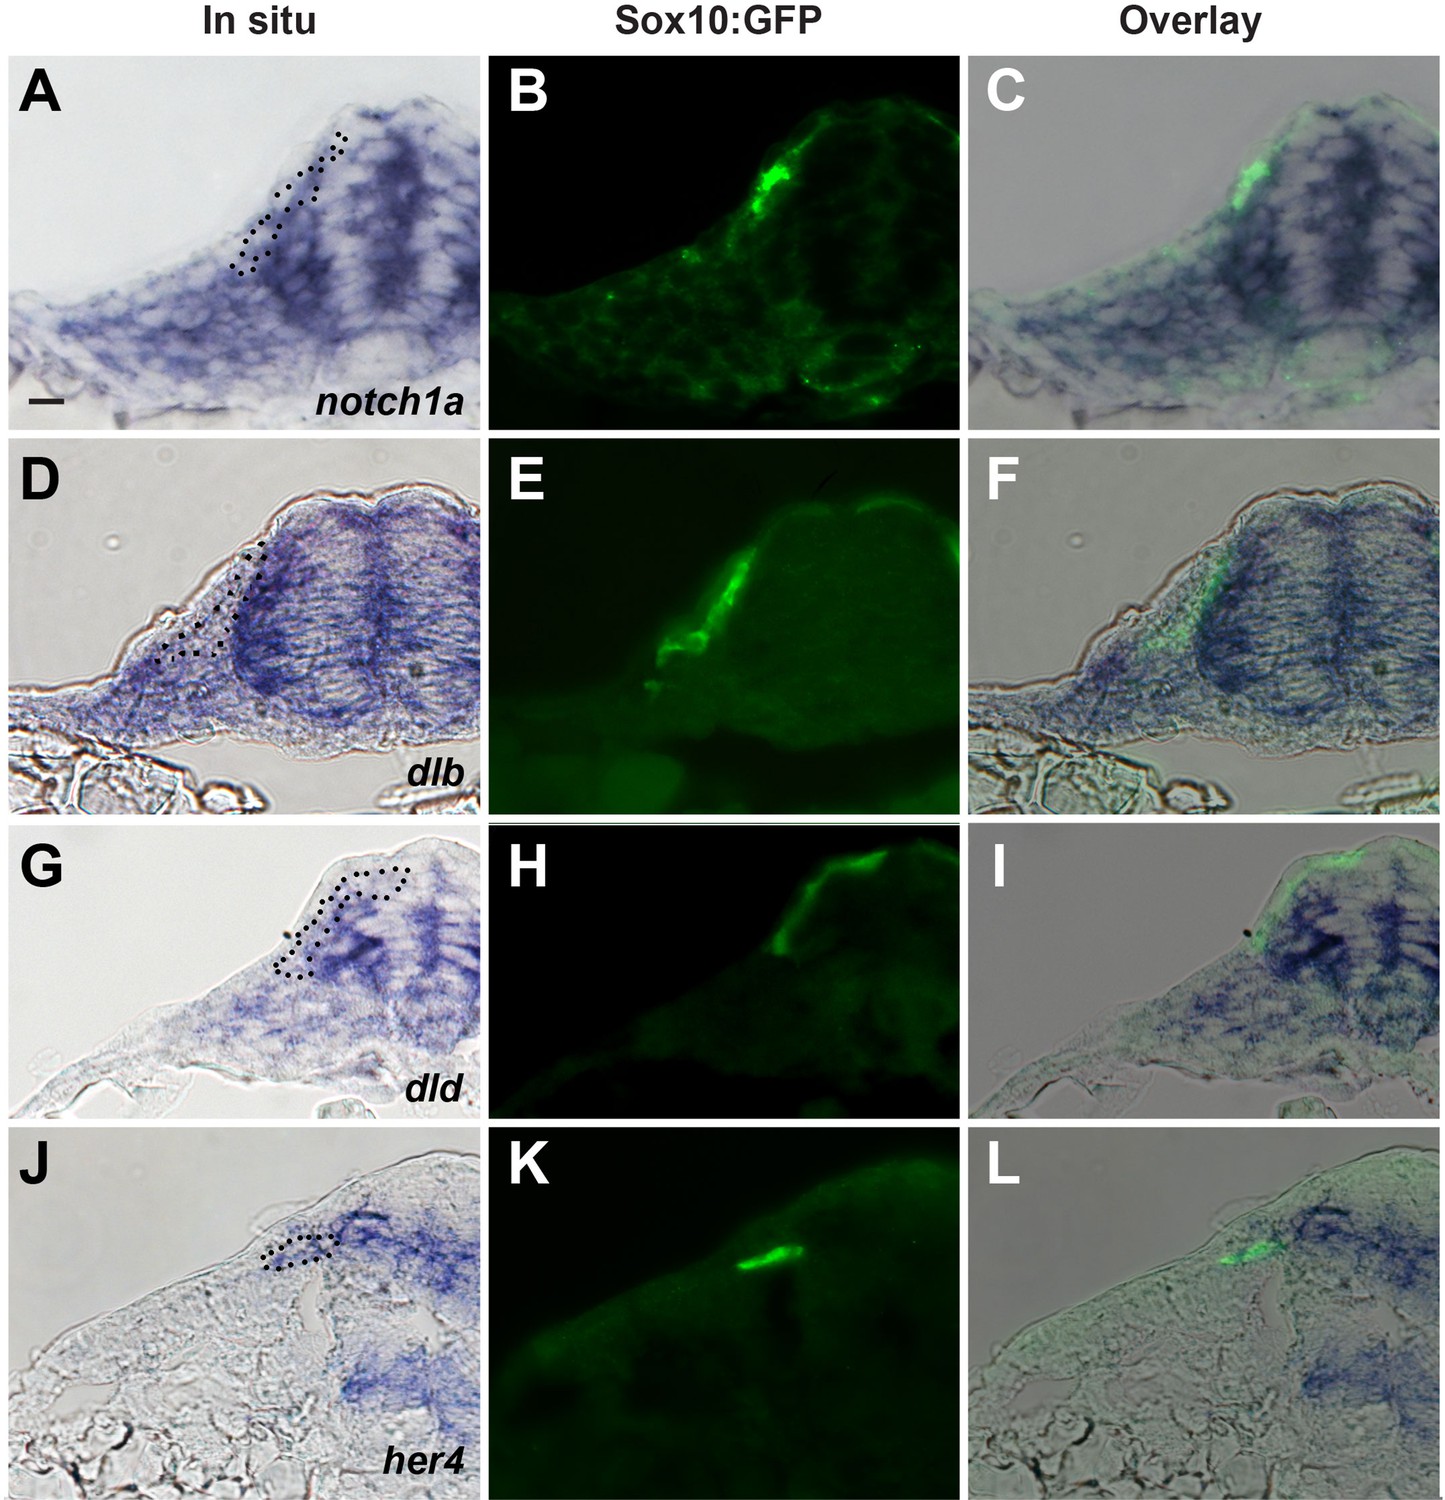
Expression of Notch signalling components during trunk neural crest (TNC) migration.
Transversal sections at trunk level of Sox10:GFP embryos showing the expression of (A–C) notch1a, (D–F) dlb (deltaB), (G–I) dld (deltaD), and (J–L) her4. (A), (D), (G), and (J) bright field, (B), (E), (H), and (K) GFP-fluorescence, and (C), (F), (I), and (L) overlay. Dotted black line in the brightfield frames indicates TNC cells seen in the fluorescent image.
Figure 2

Trunk neural crest (TNC) induction is independent of Notch signalling after 12 hpf.
(A) crestin in situ hybridisation in wildtype (WT) embryo at 18 hpf. (B, C) crestin in situ hybridisation in DAPT-treated embryos: (B) reduced or (C) absent TNC. (D) Quantification of the crestin expression phenotypes upon DAPT treatment (phenotypes: WT, black; reduced, orange; absent, red; 30% epiboly n = 38, 75% epiboly n = 32, 11 hpf n = 35, 12 hpf n = 39). (E–J) In situ hybridisation for neural crest (NC) markers in representative control (DMSO) and DAPT-treated embryos from 12 to 16 hpf. (E, F) crestin (DMSO n = 32, DAPT n = 38), (G, H) foxd3 (DMSO n = 16, DAPT n = 35), and (I, J) sox10 (DMSO n = 27, DAPT n = 29). Anterior to the left, dorsal top.
Figure 3

Notch signalling is required for trunk neural crest (TNC) migration and derivatives formation.
(A, B) Glial marker mbp in situ hybridisation upon (A) control (DMSO; n = 15) and (B) DAPT (n = 20) treatment from 12 hpf. (C, D) Neuronal marker bdh in situ hybridisation upon (C) control (DMSO; n = 25) and (D) DAPT (n = 18) treatment from 12 hpf. (E, F) Pigmentation upon (E) control (DMSO; n = 40) and (F) DAPT (n = 52) treatment from 12 hpf. (G, H) Neural crest marker crestin in situ hybridisation upon (G) control (DMSO) and (H) DAPT treatment from 12 to 18 hpf. (I, J) crestin in situ hybridisation upon (I) control (DMSO) and (J) DAPT treatment from 12 to 24 hpf. (K) Quantification of migratory chain formation upon control (DMSO) and DAPT treatment from 12 to 18 hpf (DMSO n = 98; DAPT n = 126), 20 hpf (DMSO n = 111; DAPT n = 109), and 24 hpf (DMSO n = 42; DAPT n = 61). (L) Quantification of migratory chain formation in control (HS:Gal4; n = 516), Notch loss of function (LOF) (HS:dnSu(H); n = 220), and gain of function (GOF) conditions (HS:Gal4xUAS:NICD; n = 142) heat shocked at 11 hpf and analysed at 18 hpf. Mann–Whitney U-test, control vs. LOF ****p<0.0001, control vs. GOF **p=0.0020. Anterior to the left, dorsal top, except in (C, D) anterior left, ventral view. Arrowheads indicate gene expression. All treatments performed from 12 hpf.
Figure 4 with 5 supplements

Notch activity allocates trunk neural crest (TNC) migratory identity.
(A) Selected frames from in vivo imaging of Sox10:Kalt4 control (DMSO treated) embryos. (B) Selected frames from control simulation with 1:3 leader/follower ratio. (C) Selected frames from in vivo imaging under Notch-inhibited condition, Sox10:Kalt4 embryos treated with CompE. (D) Selected frames from in vivo imaging of Notch loss of function (LOF) condition, Sox10:Kalt4; UAS:dnSu(H) embryos. (E) Selected frames from all followers simulation. (F) Selected frames from in vivo imaging of Notch gain of function (GOF) condition Sox10:Kalt4; UAS:NICD embryos. (G) Selected frames from all leaders simulation. Magenta tracks and green arrowheads indicate leaders; green arrows and cyan tracks follower cells. Asterisks indicate cells crossing somite borders. White line marks dorsal midline. Anterior to the left, dorsal up. Time in minutes.
Figure 4—figure supplement 1
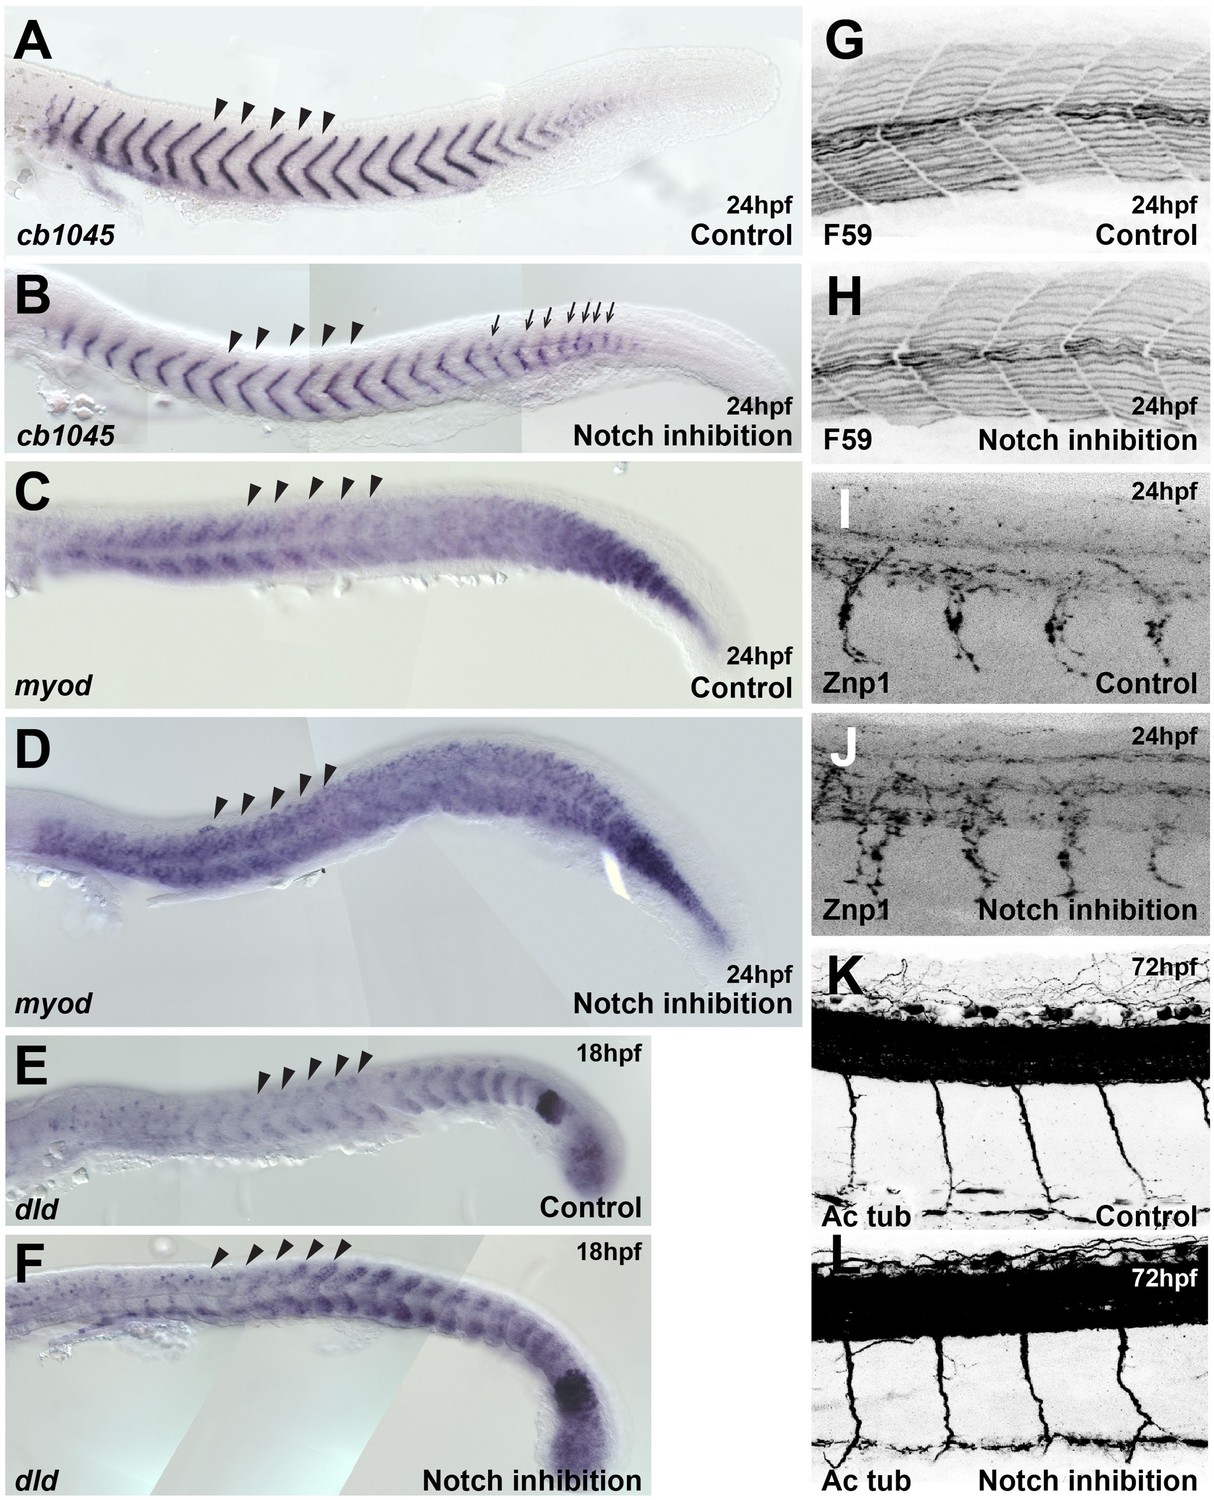
Somites and neural tissue formation are not altered by Notch inhibition.
(A, B) cb1045 in situ hybridisation upon (A) control (DMSO, n = 23) and (B) DAPT (n = 30) treatment. Arrows indicate segmentation defects. (C, D) myod in situ hybridisation upon (C) control (DMSO, n = 47) and (D) DAPT (n = 45) treatment. (E, F) dld (deltaD) in situ hybridisation upon (E) control (DMSO, n = 25) and (F) DAPT (n = 30) treatment. (G, H) Antibody staining for heavy myosin (F59) upon (G) control (DMSO, n = 37) and (H) DAPT (n = 32) treatment. (I, J) Antibody staining for Znp1 upon (I) control (DMSO, n = 35) and (J) DAPT (n = 42) treatment. (K, L) Antibody staining for acetylated tubulin (Ac Tub) upon (K) control (DMSO, n = 20) and (L) DAPT (n = 27) treatment. Arrowheads indicate the level at which trunk neural crest (TNC) migration was analysed. Anterior to the left, dorsal top.
Figure 4—figure supplement 2
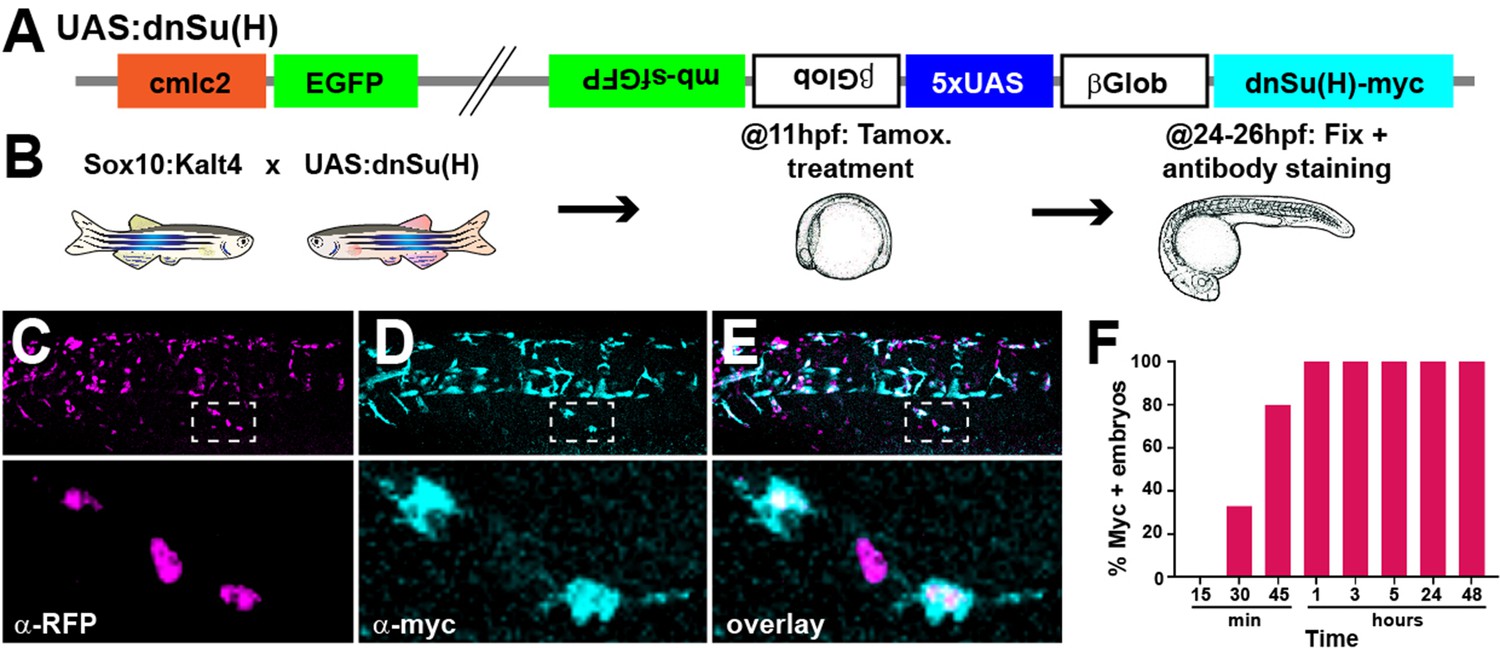
UAS:dnSu(H) transgenic line.
(A) Diagram of the construct used to generate the UAS:dnSu(H) line. (B) Scheme of protocol used. (C–E) Trunk region of a Sox10:Kalt4;UAS:dnSu(H) embryo treated with tamoxifen from 11 to 24 hpf and immunostained for (C) RFP and (D) myc. (E) overlay. Dotted squares indicate enlargement. (F) Number of embryos expressing the UAS driven transcripts (myc+) after tamoxifen treatment from 11 hpf for different times (15′ n = 20, 30′ n = 27, 45′ n = 25, 1 hr n = 22, 3 hr n = 18, 5 hr n = 20, 24 hr n = 14, 48 hr n = 10).
Figure 4—video 1
Notch inhibition disrupts trunk neural crest (TNC) migratory identity allocation.
(A, B) Time lapse of Sox10:mG control (DMSO treated) embryo from 16 to 27 hpf. (C, D) Time lapse of Sox10:mG CompE-treated embryo from 16 to 30 hpf. Upper panels show fluorescent nuclei in grey and membranes in green. Lower panels show nuclei in grey, leaders tracked in magenta and followers in cyan. Arrowheads indicate leaders and arrows follower cells. Time in minutes. Related to Figures 4 and 5.
Figure 4—video 2
Notch gain and loss of function disrupts trunk neural crest (TNC) migratory identity allocation.
(A, B) Time lapse of control Sox10:Kalt4 embryo from 18 to 28.5 hpf. (C, D) Time lapse of Notch loss of function Sox10:Kalt4;UAS:dnSu(H) embryo from 18 to 27.9 hpf. (E, F) Time lapse of Notch gain of function, Sox10:Kalt4;UAS:NICD, embryo from 18 to 28.5 hpf. Upper panels show fluorescent nuclei in grey. Lower panels show nuclei in grey, leaders tracked in magenta, and followers in cyan. Arrowheads indicate leaders, arrows follower cells. Time in minutes. Related to Figures 4 and 5.
Figure 4—video 3
In silico simulation of trunk neural crest (TNC) chain migration.
(A) Simulation of a population with a single leader cell (Only 1L). (B) Simulation of a 1:1 leader follower ratio population (1L:1F). (C) Simulation of a 1:3 leader follower ratio population (1L:3F). (D) Simulation of a population composed only of follower cells (All followers). (E) Simulation of a population composed only of leader cells (All leaders). Leaders tracked in magenta and followers in cyan. Arrowheads indicate leaders, arrows follower cells. Time in minutes. Related to Figures 4, 5 and 7.
Figure 5
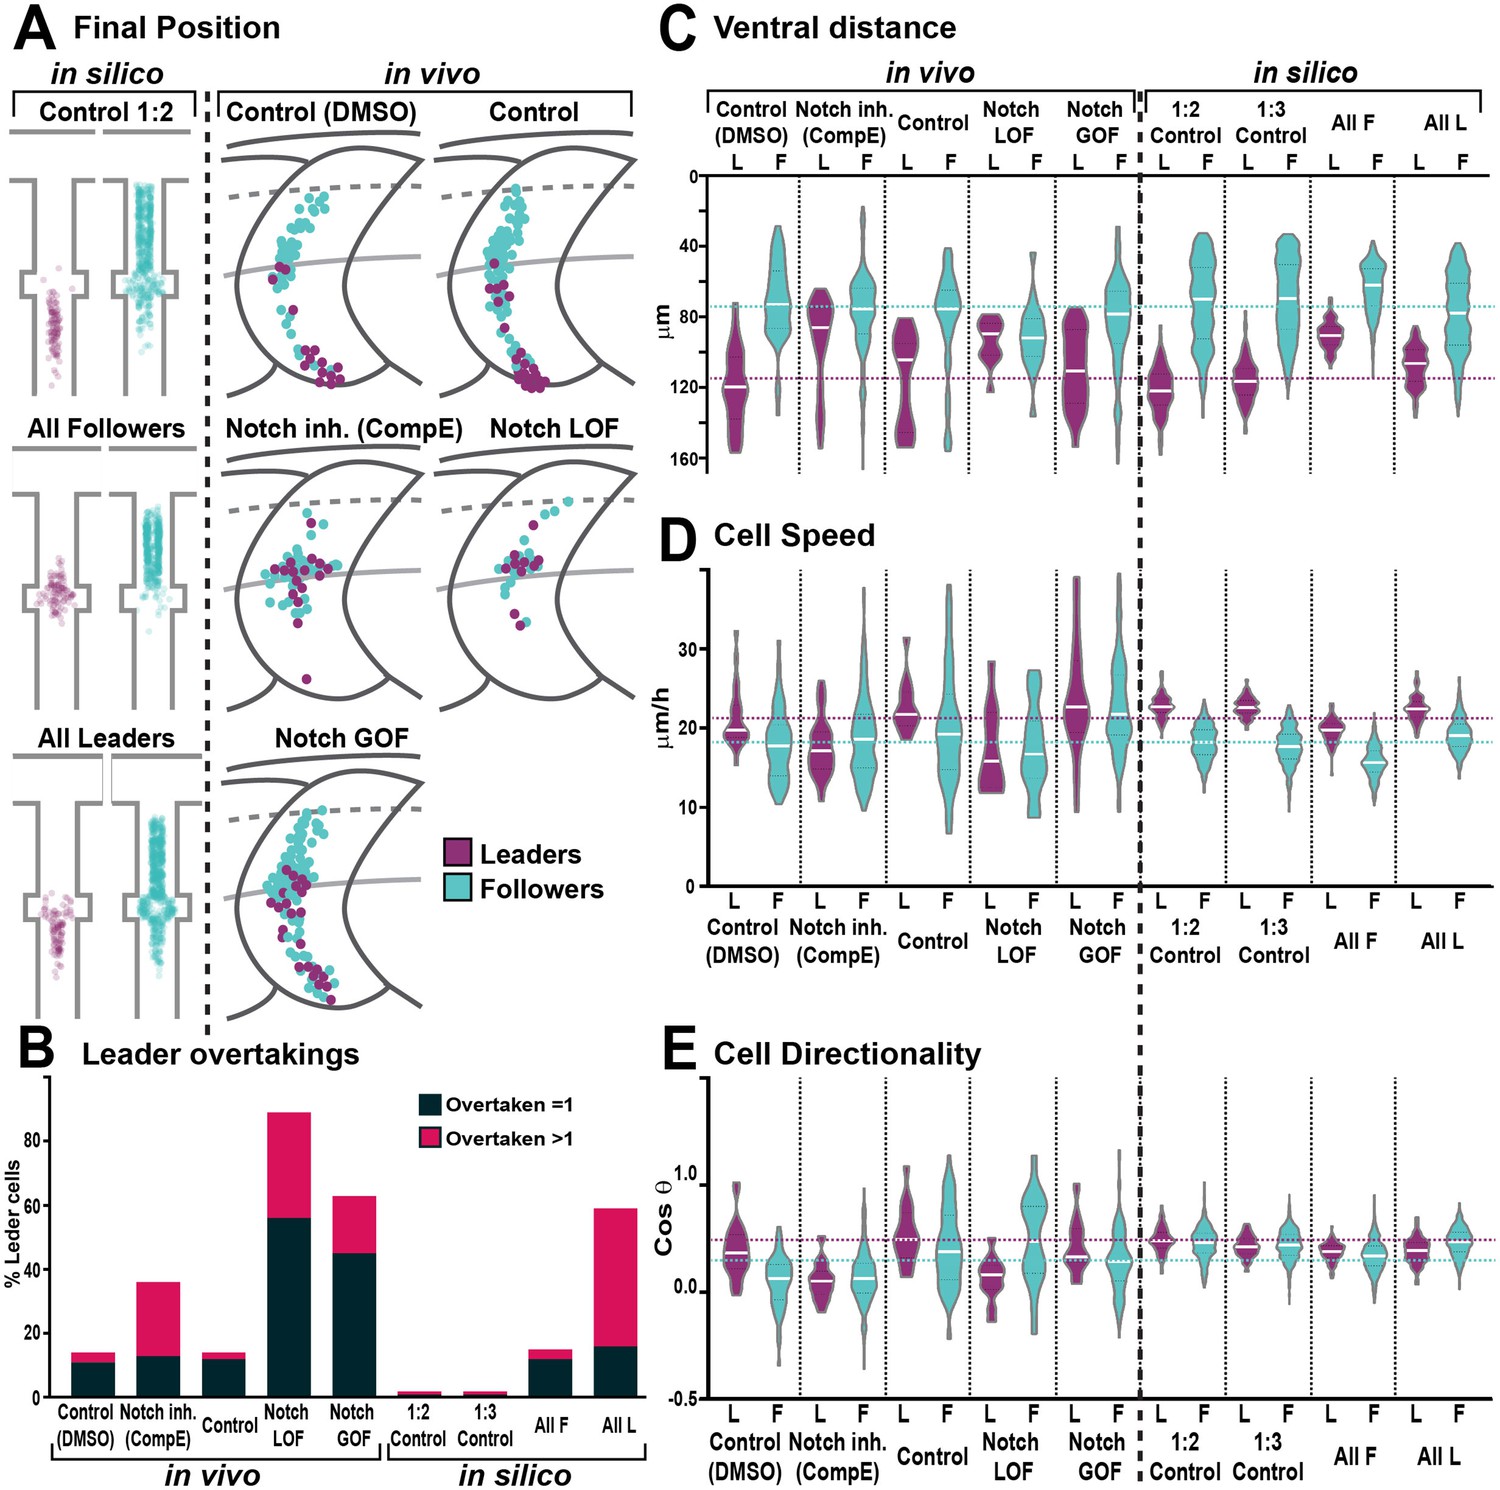
Trunk neural crest (TNC) migration measurements in vivo and in silico.
(A) Final position of each cell in model simulations and in vivo experiments under different conditions. In silico results depicted in confined pathway, in vivo data graphed in model embryo, somites contour and dorsal midline (dark grey lines), edge of the premigratory area (dashed lines), and NT/not boundary (light grey lines). Anterior left, dorsal up. (B) Quantification of leader overtaking events in vivo and in silico. Leader overtaken by a single follower is overtaken = 1; leader overtaken by more than one follower cell is overtaken >1. (C) Quantification of the ventral advance of cells in vivo and in silico. (D) Quantification of cell speed in vivo and in silico. (E) Quantification of cell directionality in vivo and in silico. Leader cells in magenta, followers in cyan. Magenta and cyan dashed lines indicate the average values for leaders and followers respectively. Full statistical analysis in Supplementary file 1.
Figure 6
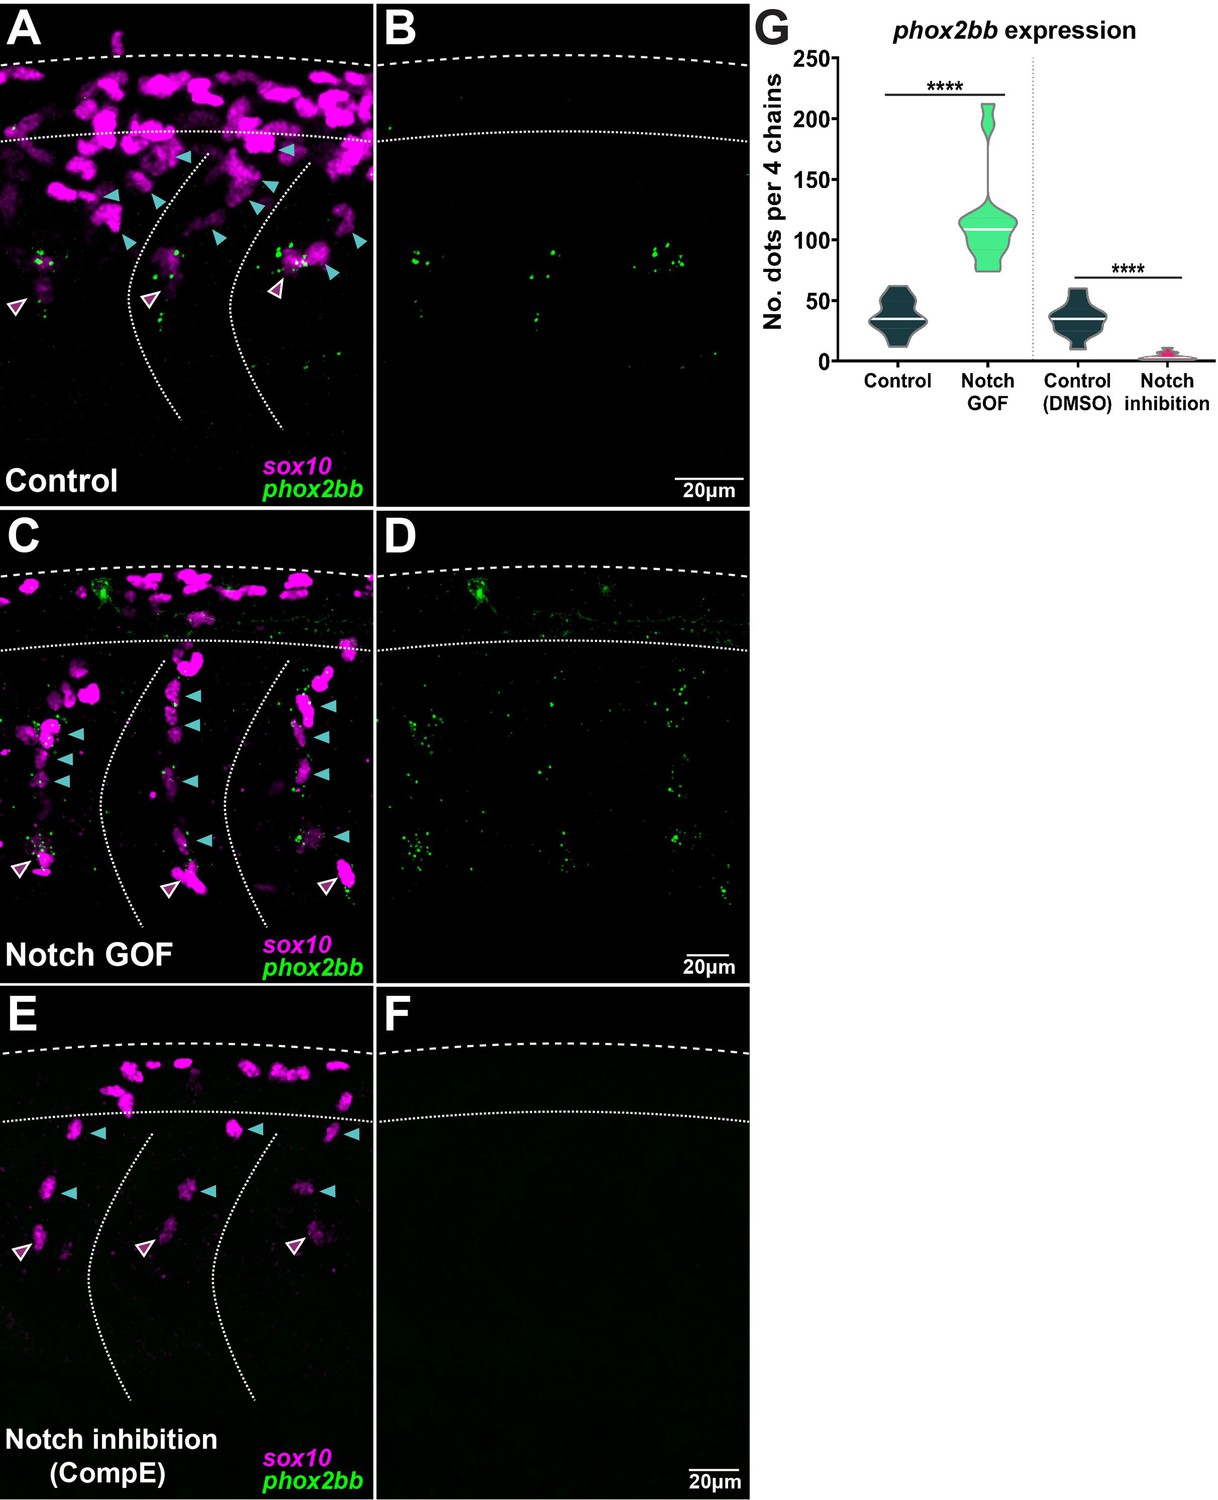
Notch signalling controls phox2bb expression defining leader cells.
(A, B) Images of phox2bb expression in control embryos (Sox10:Kalt4). (C, D) Images of phox2bb expression under Notch gain of function (GOF) conditions (Sox10:Kalt4; UAS:NICD embryos). (E, F) Images of phox2bb expression in Notch inhibition conditions (Compound E). Magenta and cyan arrowheads indicate leaders and followers respectively. (G) Quantification of phox2bb expression in control (n = 13), Notch GOF (n = 14), and Notch inhibition conditions (n = 11). Welch’s t-test, Kalt4 control vs. GOF ****p<0.0001, DMSO control vs. inhibition ****p<0.0001.
Figure 7
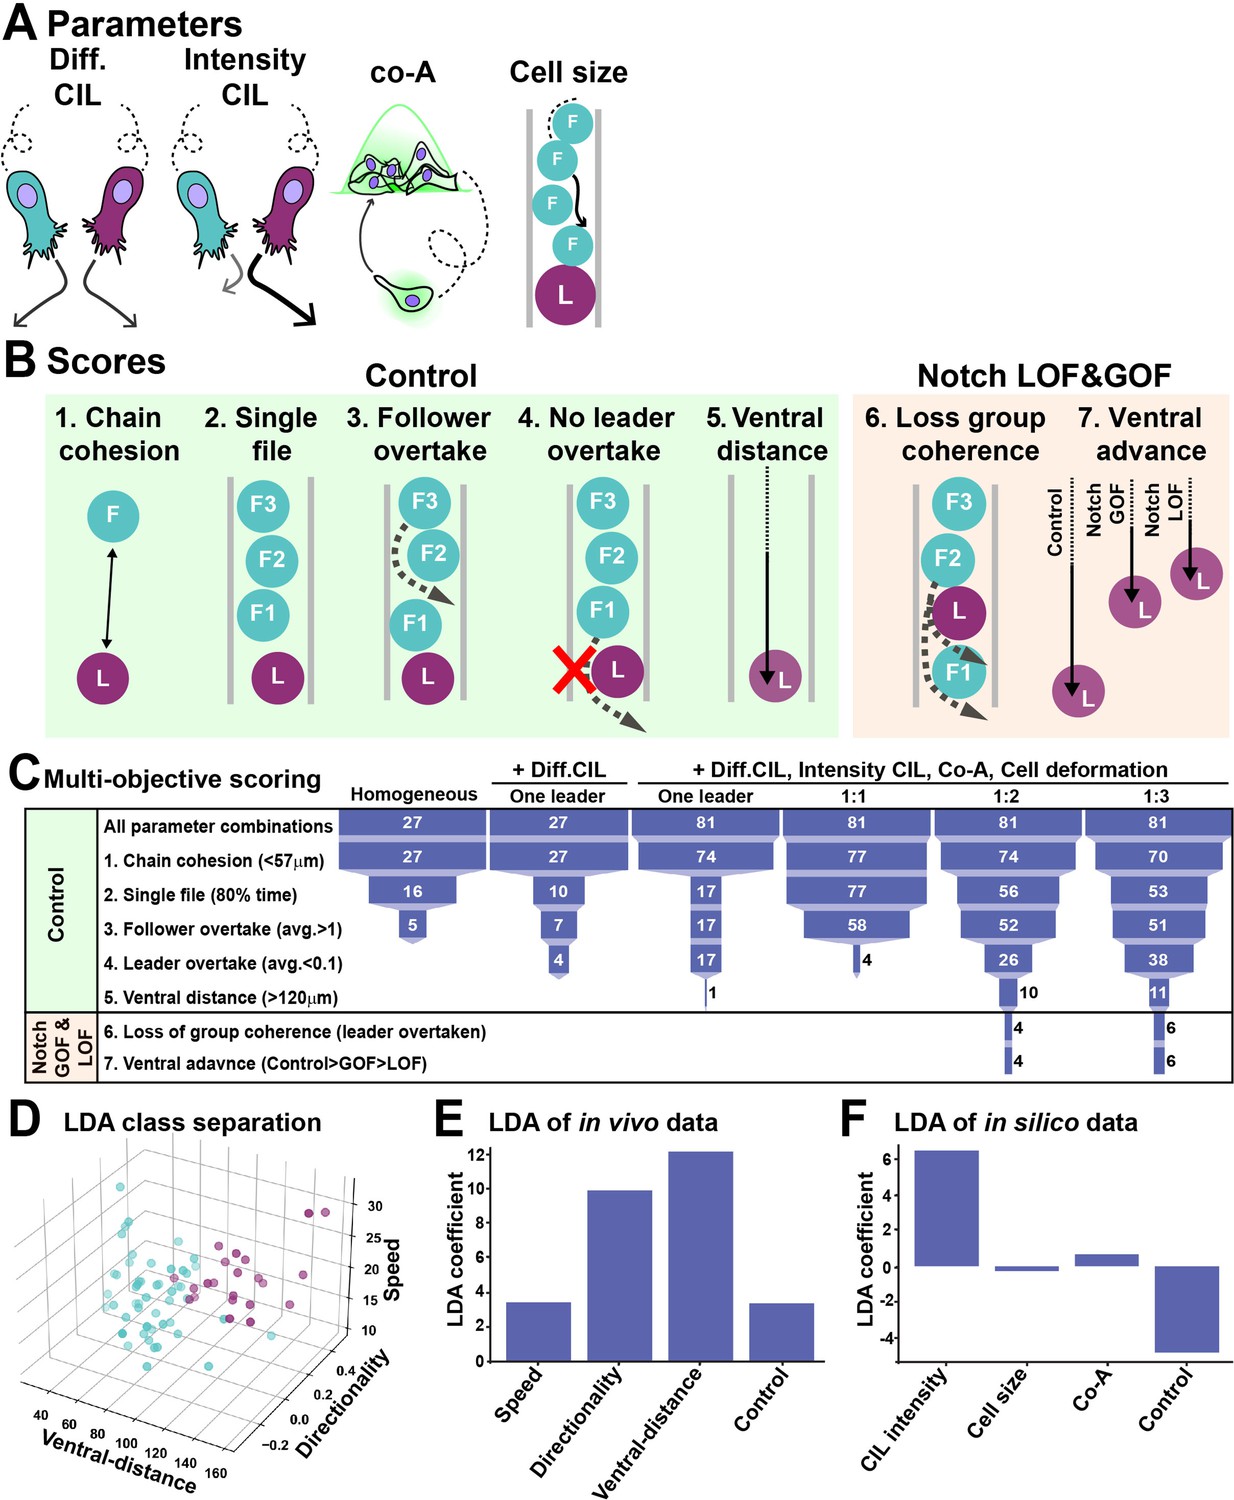
In silico modelling of trunk neural crest (TNC) migration.
(A) Schematics of model parameters. Diff CIL: only leader/follower collisions induce repulsion and change of directionality. Intensity CIL: the leader’s response upon collision is stronger than the follower’s response. Co-A: co-attraction pulls together cells at a distance. Cell size: volume exclusion. (B) Schematics of simulations multi-objective scores. (C) Depiction of parameter space analysis showing the number of parameters sets that fulfilled each score when different variables were tested. One leader refers to chains with a single leader cell. 1:1, 1:2, and 1:3 refer to leader/follower ratios. (D) 3D plot of linear discriminant analysis (LDA). (E) LDA coefficients of in vivo data. A random dataset was used as control. (F) LDA coefficients of in silico data. A random dataset was used as control.
Figure 8 with 2 supplements
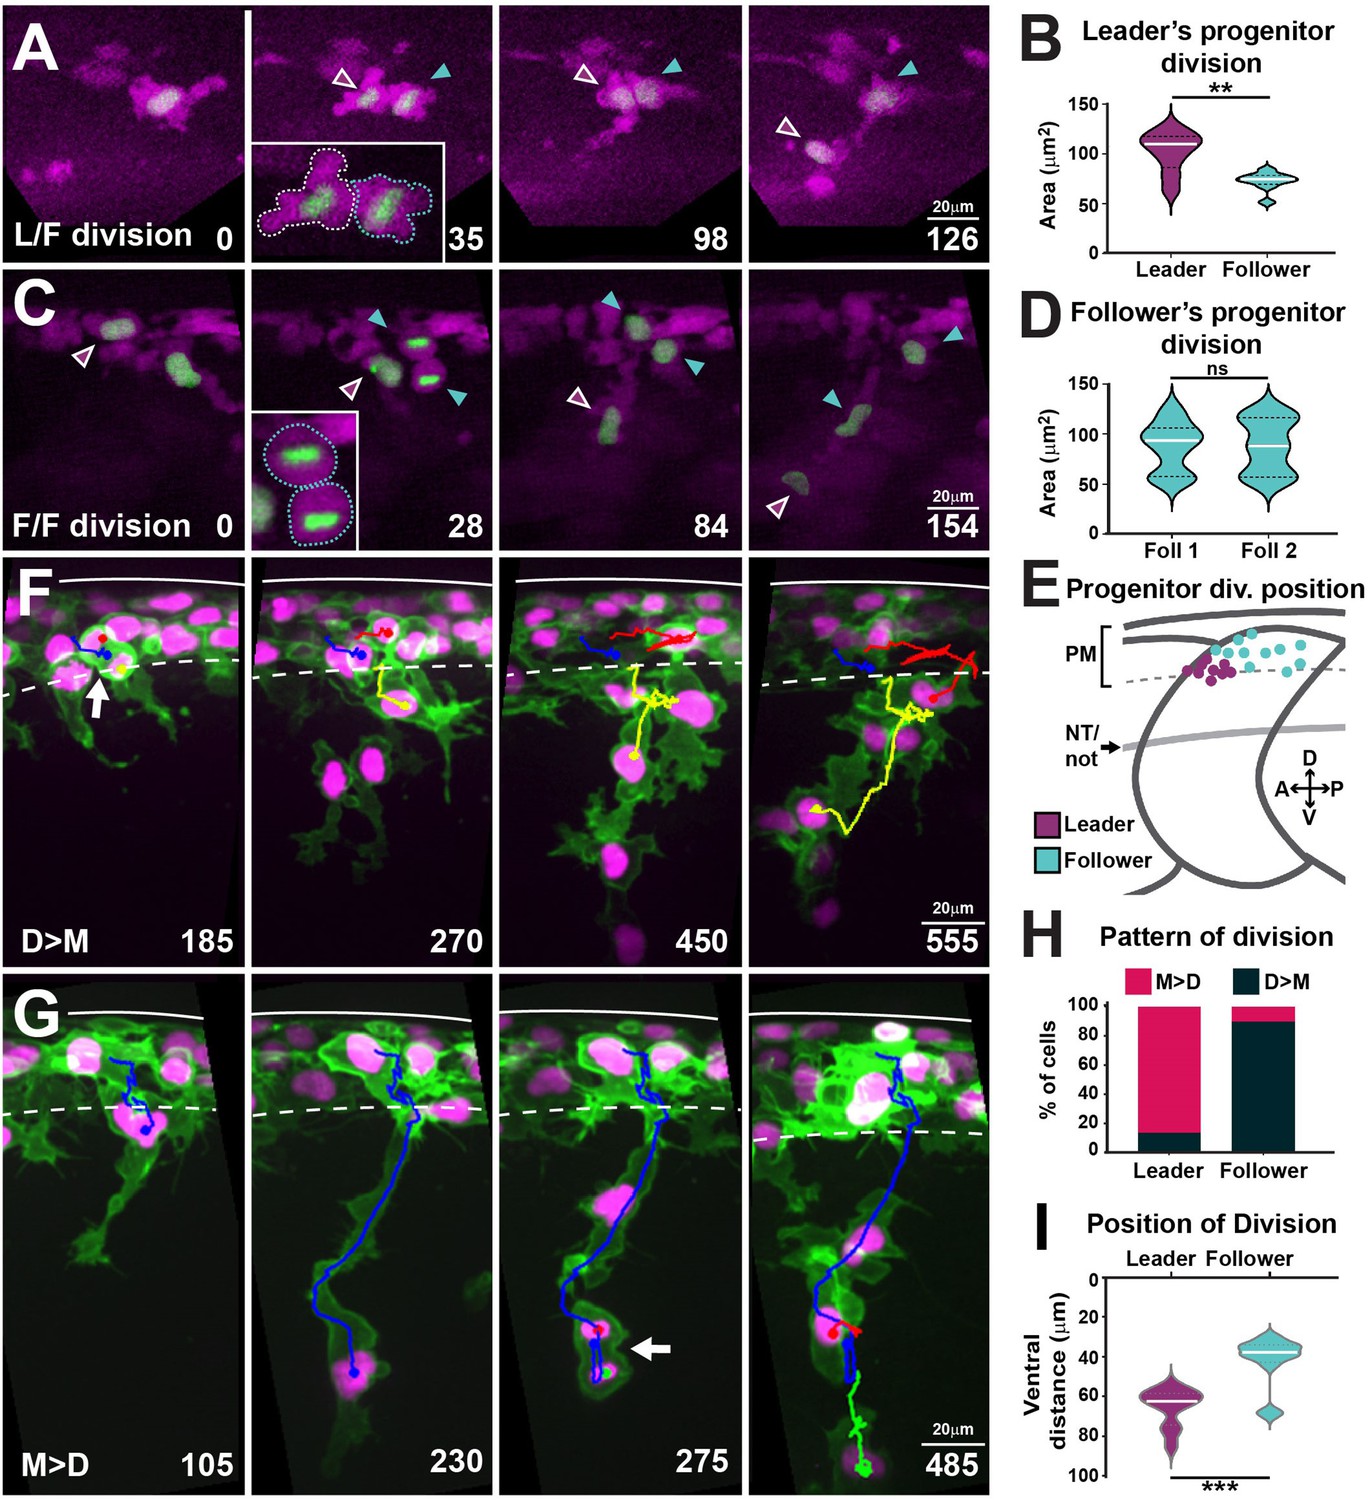
Leaders arise from the asymmetric division of a progenitor cell and present characteristic division patterns.
(A) Selected frames from in vivo imaging of leaders’ progenitor division in FoxD3:mCherry;H2aFVA:H2a-GFP embryos. (B) Area of leaders’ progenitor daughter cells (n = 9 cells, seven embryos; Mann–Whitney U-test, p=0.0056). (C) Selected frames from in vivo imaging of followers’ progenitor division in FoxD3:mCherry;H2aFVA:H2a-GFP embryos. (D) Area of followers’ progenitor daughter cells (n = 10, four embryos; Mann–Whitney U-test, p>0.9999). (E) Position of progenitors’ divisions on model embryo (leaders n = 9, seven embryos; followers n = 10, four embryos). PM, premigratory area; NT/not, neural tube/notochord boundary. (F) Selected frames showing the D>M division pattern from 16 to 28 hpf in vivo imaging of a Sox10:mG embryo. Blue, before division; yellow and red, after division. Arrow indicates division position. (G) Selected frames showing the M>D division pattern from 16 to 28 hpf in vivo imaging of a Sox10:mG embryo. Labelling as in (F). (H) Quantification of leaders’ (n = 21, seven embryos) and follower’s division patterns (n = 43, seven embryos). Red, M>D; black, D>M. (I) Quantification of division positions (n = 13 leaders, n = 19 followers, seven embryos; Mann–Whitney U-test, p=0.0002). Time in minutes. Leaders in magenta, followers in cyan. Anterior left, dorsal top.
Figure 8—video 1
Leader cells arise from the asymmetric division of a progenitor cell.
3D rotation and volume reconstruction of a FoxD3:mCherry;H2aFVA:H2a-GFP specimen at 18 hpf showing the daughter cells of a leader progenitor, the prospective leader in yellow, and its sibling a prospective follower in cyan. Related to Figure 8.
Figure 8—video 2
Leader and follower cells present distinct division patterns.
M>D time lapse of Sox10:mG embryo from 16 to 23 hpf, showing a leader cell dividing during migration. D>M time lapse of Sox10:mG from 16 to 28 hpf, showing a follower cell dividing before migration initiation. Tracks before division in blue, after division in red and yellow. Arrows indicate divisions. Imaged from 16 to 28 hpf. Related to Figure 8.
Figure 9 with 3 supplements
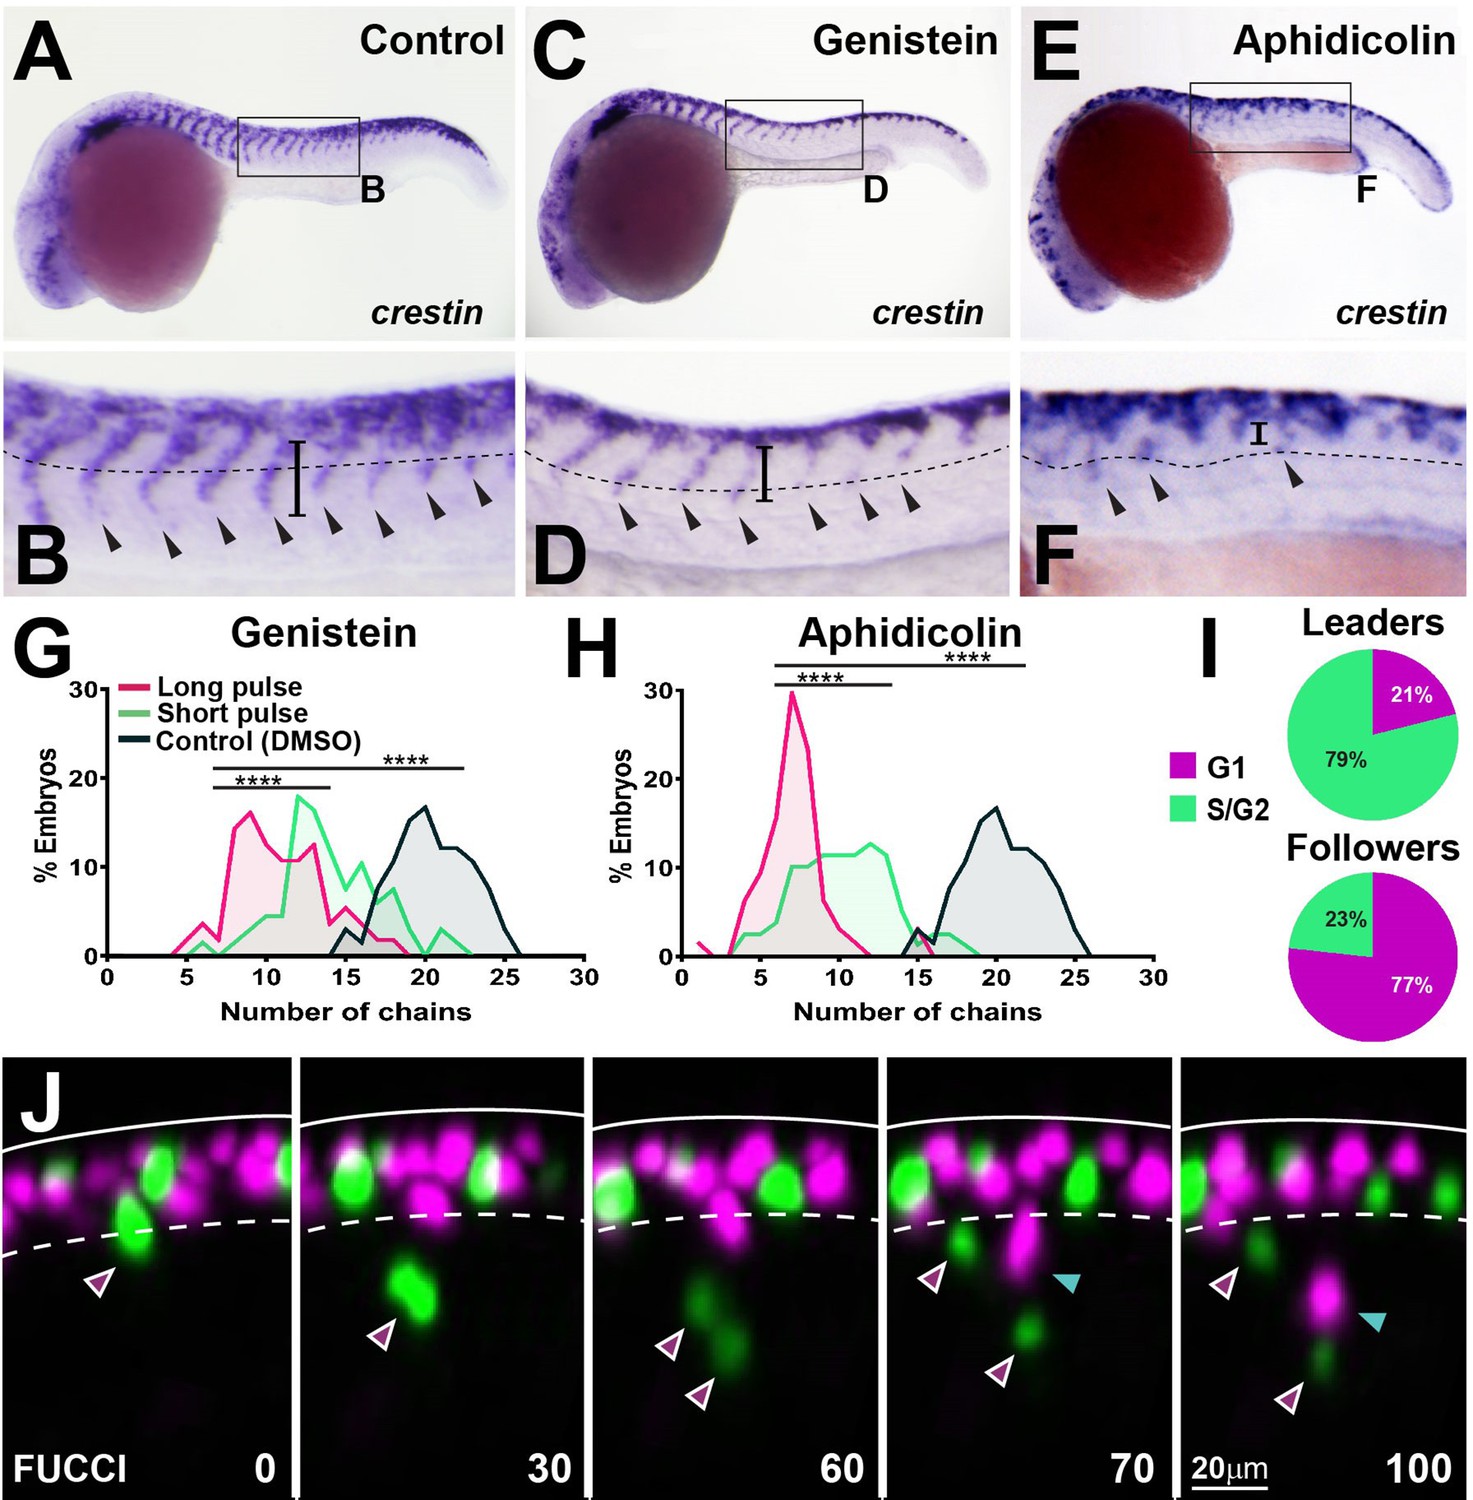
Cell cycle progression is required for trunk neural crest (TNC) migration.
(A, C, E) crestin in situ hybridisation upon (A) DMSO, (C) genistein, or (E) aphidicolin treatment from 12 to 24 hpf. (B, D, F) Enlargement of areas indicated by boxes in (A, C, E). Dotted line marks NT/not boundary, arrowheads migratory chains, and vertical line the chain length. (G, H) Frequency distribution of migratory chains upon control (DMSO; n = 66), (G) genistein (12 hr pulse, n = 56; 6 hr pulse, n = 67), or (H) aphidicolin (12 hr, n = 64; 3 hr, n = 79). (I) Cell cycle phase at migration initiation for leaders (n = 38, four embryos) and followers (n = 43, four embryos). (J) Selected framed from in vivo imaging of Sox10:FUCCI. Time in minutes. Solid line marks dorsal midline, dotted line marks the premigratory area. Magenta arrowheads indicate leader and its daughters. Cyan arrowheads indicate followers.
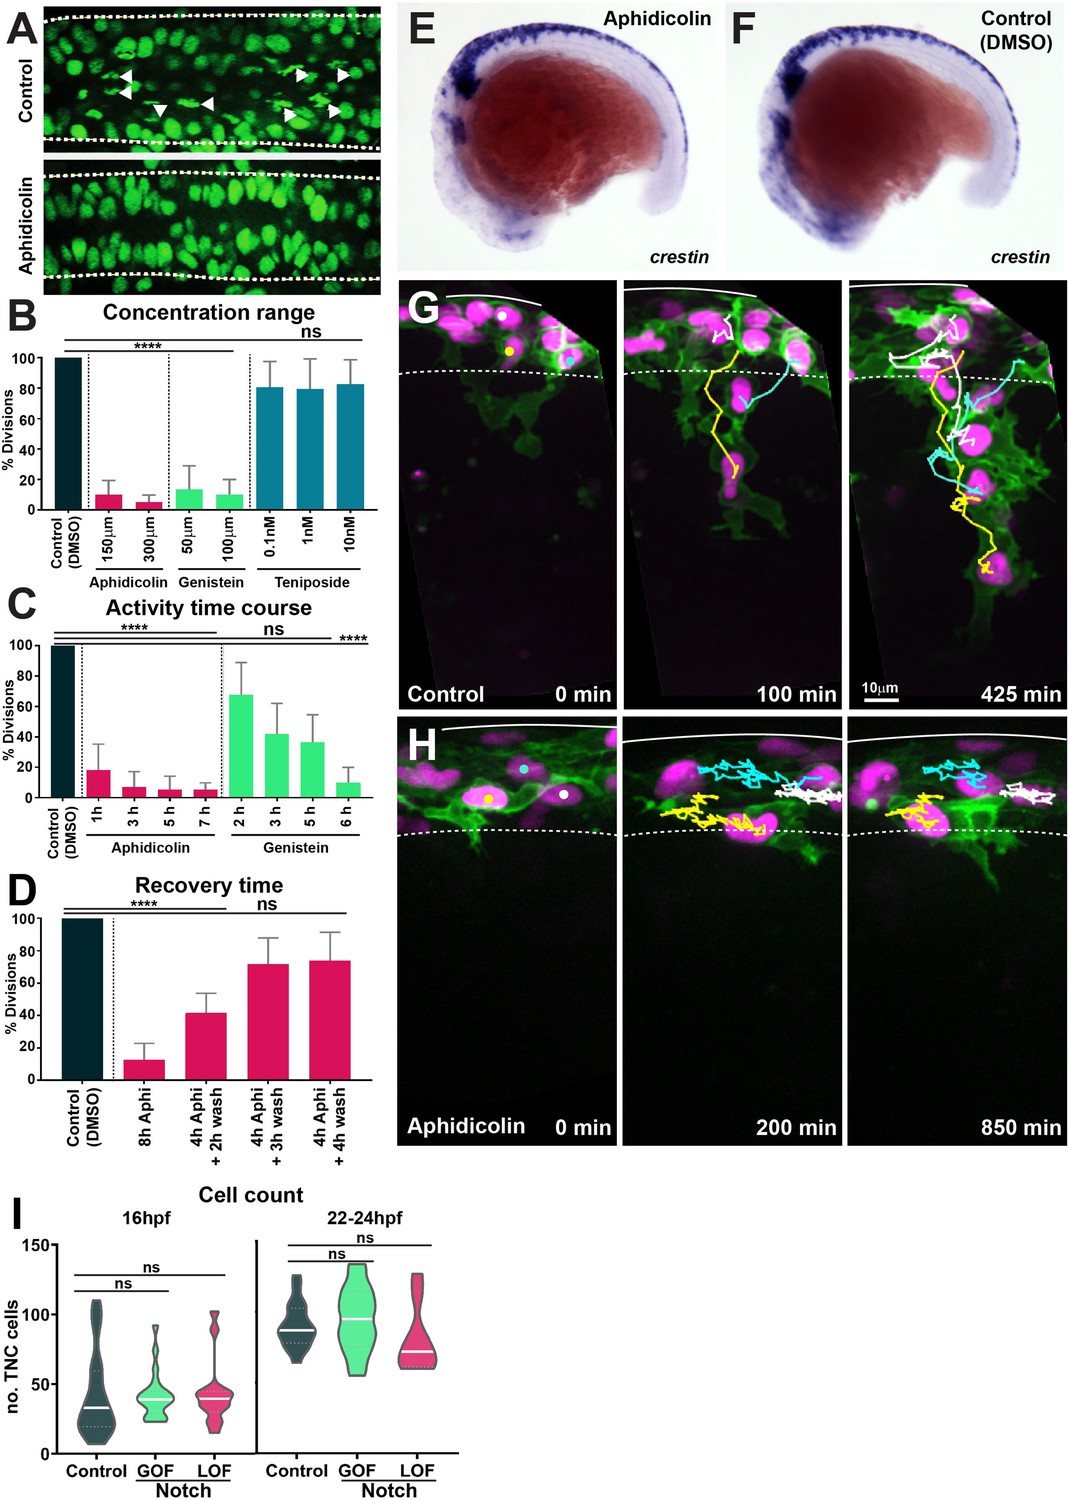
Figure 9—figure supplement 1
Cell cycle inhibitor drugs working conditions.
(A) Confocal images showing nuclei and mitotic figures in control (DMSO) and aphidicolin treated H2aFVA:H2a-GFP embryos. Arrowheads indicate mitotic figures; dashed lines mark the neural tube borders. Dorsal view, anterior to the left. (B) Percentage of mitotic figures in control (DMSO-treated embryos) and embryos treated with different concentrations of cell cycle inhibitors (Kruskal–Wallis test, p<0.0001, aphidicolin n = 20 and genistein n = 32; teniposide p>0.9999, n = 27). (C) Time course of the effect of cell cycle drugs (Kruskal–Wallis test, control vs. 1 hr aphidicolin p=0.0007; control vs. 3 hr, 5 hr, and 7 hr aphidicolin p<0.0001; control vs. 2 hr, 3 hr, and 5 hr genistein p>0.0892; control vs. 6 hr genistein p<0.0001; control n = 62 embryos; aphidicolin 1 hr n = 16, aphidicolin 3 hr n = 15, aphidicolin 5 hr n = 16, aphidicolin 7 hr n = 15; genistein 2 hr n = 15, genistein 3 hr n = 16, genistein 5 hr n = 17, genistein 6 hr n = 16). (D) Quantification of cell cycle recovery times following aphidicolin removal (control n = 21; aphidicolin 8 hr n = 18, aphidicolin 4 + 2 hr wash n = 15, 4 + 3 hr wash n = 15 and 4 + 4 hr wash n = 15 embryos; one-way ANOVA, control vs. 8 hr and 4 + 2 hr wash p<0.0001; control vs. 4 + 3 hr wash and 4 + 4 hr wash p>0.0851). (E, F) Whole-mount in situ hybridisation of the neural crest (NC) marker crestin in 16 hpf embryos upon (E) aphidicolin and (F) DMSO treatment from 12 hpf. Anterior to the left, dorsal top. (G, H) Selected frames of in vivo imaging from Sox10:mG embryos showing cell tracks under (G) control (DMSO) 16–28 hpf and (H) aphidicolin 16–33 hpf treatment. Solid line indicates the dorsal midline, dashed line the premigratory area; time in minutes. (I) Quantification of the number of trunk neural crest (TNC) cells per three migratory chains under control, Notch gain of function (GOF) and loss of function (LOF) conditions at either 16 hpf (control n = 25 embryos; GOF n = 21; LOF n = 14) and 22–24 hpf (control n = 18 embryos; GOF n = 18; LOF n = 9). Brown–Forsythe and Welch’s ANOVA tests, 16 hpf: control vs. GOF p>0.9999, control vs. LOF p=0.9976, GOF vs. LOF p=0.9942; 22–24 hpf: control vs. GOF p=0.8985, control vs. LOF p=0.5940, GOF vs. LOF p=0.3892.
Figure 9—video 1
Cell cycle progression is required for trunk neural crest (TNC) migration.
Time lapse of control (DMSO treated) Sox10:mG embryo from 16 to 23 hpf, and aphidicolin-treated Sox10:mG embryo from 16 to 30 hpf. Leaders tracked in yellow, followers tracked in cyan and white. Time in minutes. Related to Figure 9 and Figure 9—figure supplement 1.
Figure 9—video 2
Leader and follower cells initiate migration at different phases of the cell cycle.
Representative time lapse of Sox10:FUCCI from 16 to 18 hpf showing leaders initiate migration in S-phase, while followers emigrate in G1. Magenta arrowheads indicate the leader and its daughter cells; cyan arrowhead indicate follower cells. Time in minutes. Related to Figure 9 and Figure 9—figure supplement 1.
Figure 10 with 2 supplements
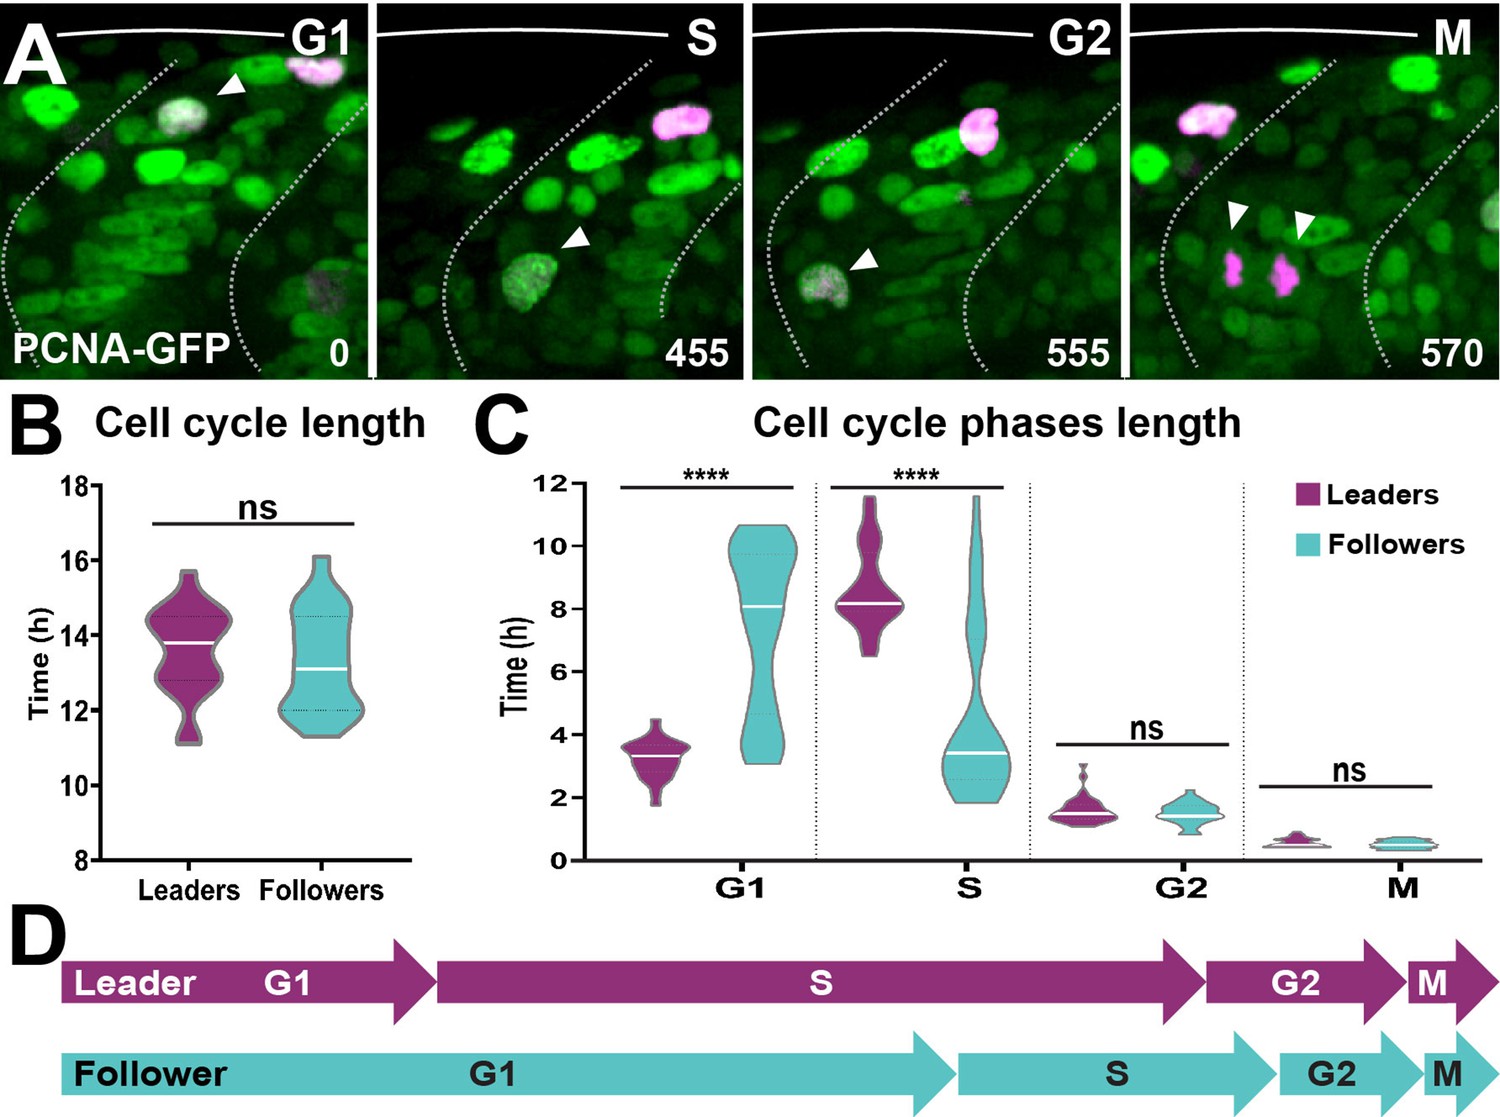
Leader and follower cells progress through the cell cycle at different rates.
(A) Selected frames from in vivo imaging of Sox10:Kalt4 embryos from 16 to 28 hpf injected with PCNA-GFP mRNA. White arrow points to cycling cell. Time in minutes. (B) Quantification of the cell cycle total duration in leaders (n = 20, seven embryos) and followers (n = 19, seven embryos; unpaired t-test, p=0.5240). (C) Quantification of the cell cycle phases duration in leaders (G1 n = 45, S n = 44, G2 n = 33 and M n = 32, 11 embryos) and followers (G1 n = 50, S n = 48, G2 n = 33 and M n = 34, 11 embryos). Brown–Forsythe and Welch’s ANOVA tests, G1 p<0.0001, S p<0.0001, G2 p=0.9997, M p=0.9231. (D) Schematic representation of the cell cycle phases durations.
Figure 10—figure supplement 1
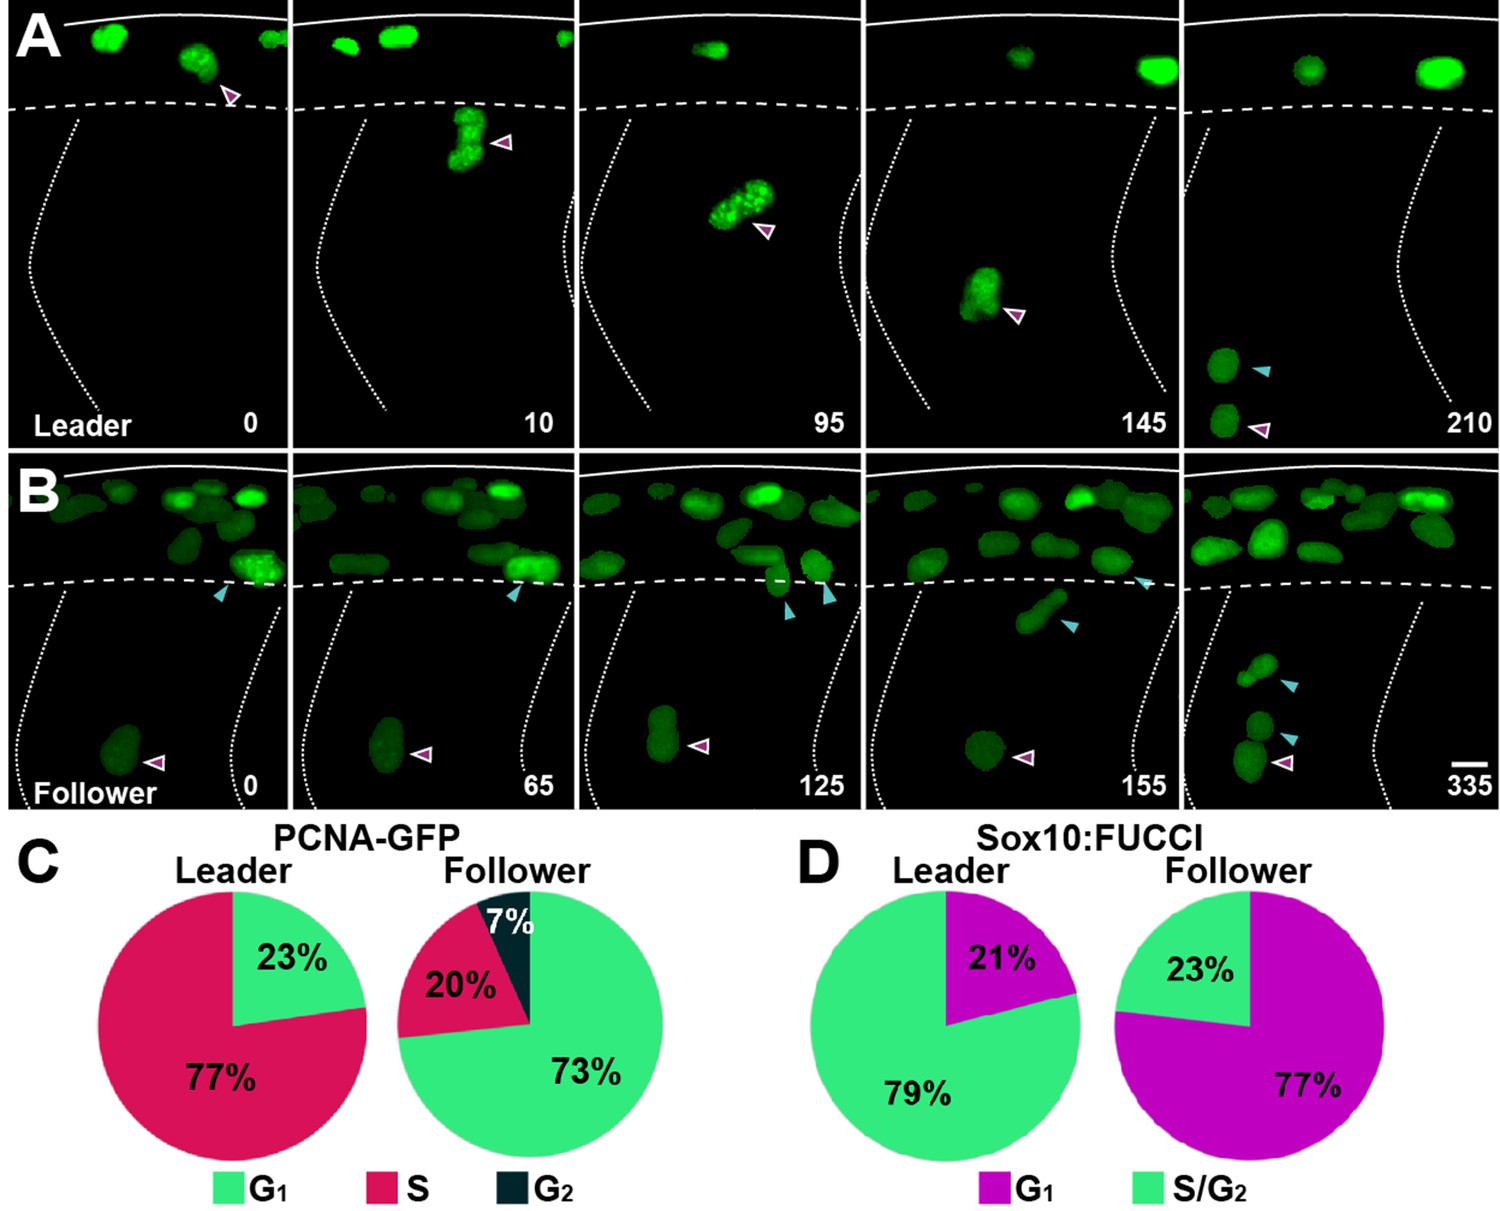
Leader and follower cells initiate migration at distinct cell cycle phases.
(A, B) Selected frames of in vivo imaging from Sox10:Kalt4 embryos injected with PCNA-GFP mRNA, showing PCNA localisation in trunk neural crest (TNC). (A) Leader cell initiates migration in S-phase. (B) Follower cell divides before initiating migration in G1. Solid lines indicate embryo dorsal border, dotted lines the somite borders, segmented line the premigratory ventral border. Time in minutes. Anterior to the left, dorsal up. (C) Quantification of the cell cycle phase at which cells initiate migration in PCNA-GFP mRNA injected embryos (leaders n = 22, 10 embryos; followers n = 45, 10 embryos). (D) Quantification of the cell cycle phase at which cells initiate migration in Sox10:FUCCI embryos (leaders n = 38, four embryos; followers n = 43, four embryos).
Figure 10—video 1
PCNA-GFP reveals the cell cycle dynamics in trunk neural crest (TNC).
Time lapse of PCNA-GFP mRNA-injected Sox10:Kalt4 embryo from 20 to 27.6 hpf. Left, raw image; right, the same image showing only RFP+ TNC. Time in minutes. Related to Figures 10 and 11 and Figure 9—figure supplement 1.
Figure 11
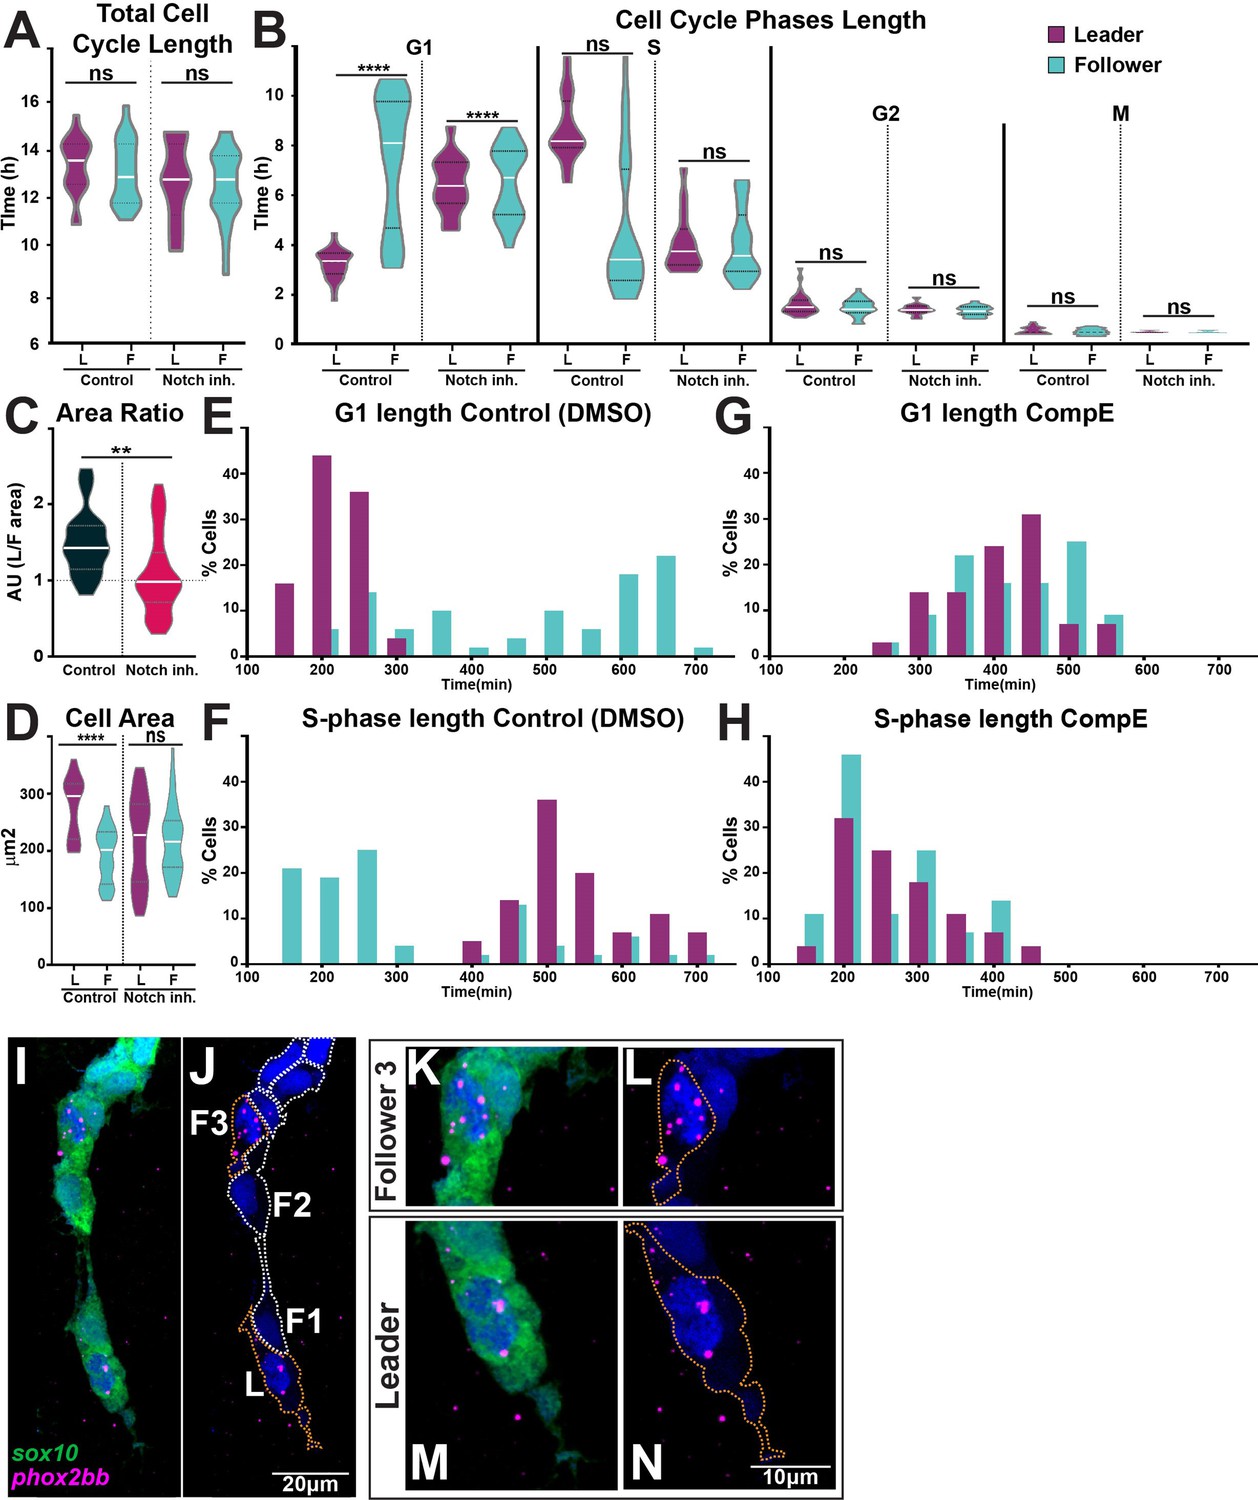
Notch signalling regulates trunk neural crest (TNC) cell cycle progression.
(A) Quantification of the cell cycle total duration under control (DMSO, numbers as in Figure 10B) and Notch inhibition conditions (CompE, leaders n = 17, followers n = 22, eight embryos; one-way ANOVA, p=0.1939). (B) Quantification of the cell cycle phases duration under DMSO (numbers as in Figure 10C) and Notch inhibition conditions CompE, leaders G1 n = 29, S n = 28, G2 n = 25, and M n = 25, seven embryos; followers G1 n = 32, S n = 32, G2 n = 30, and M n = 30, seven embryos; Brown–Forsythe and Welch’s ANOVA tests, all phases G1, S, G2, and M p>0.9999 between leaders and followers. (C) Quantification of cell area ratio (leaders/followers) under DMSO and Notch-inhibited conditions (n as in D; Brown–Forsythe and Welch’s ANOVA tests, DMSO control vs. CompE p= 0.0157). (D) Quantification of cell area under DMSO (leaders n = 26, followers n = 22, six embryos) and CompE conditions (leaders n = 44, followers n = 41, seven embryos). Brown–Forsythe and Welch’s ANOVA tests, DMSO leaders vs. followers p<0.0001, CompE leaders vs. followers p>0.9999. (E, F) Frequency distribution of G1- and S-phases durations in control conditions (DMSO; leaders: G1 n = 45, S n = 44, 11 embryos; followers: G1 n = 50, S n = 48, 11 embryos). (G, H) Frequency distribution of G1- and S-phases durations in Notch inhibition conditions (CompE; leaders: G1 n = 29, S n = 28, seven embryos; followers: G1 n = 32, S n = 32, seven embryos). (I–N) Images of phox2bb expression in 24 hpf Sox10:GFP embryo. (K–N) Enlargements of follower 3 and leader cells in (I, J). Orange dotted lines mark leader and third follower cell outline; white dotted lines mark followers' outline.
Figure 12
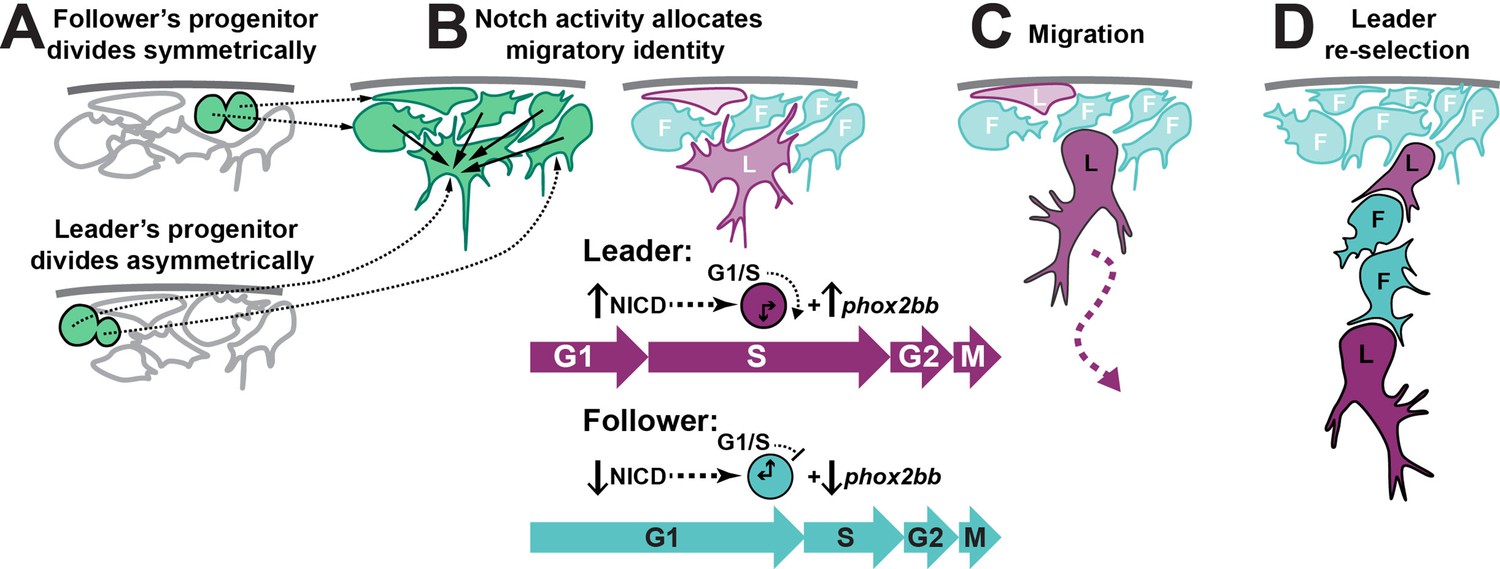
Working model of trunk neural crest (TNC) migratory identity allocation through Notch-cell cycle interaction.
(A) Leader TNC progenitors divide asymmetrically giving rise to a prospective leader cell that is larger than the prospective followers that arise from symmetric divisions. (B) Interactions between TNC through Notch lateral inhibition establish higher levels of Notch activity in the bigger cell, triggering the initiation of S-phase and increased levels of phox2bb expression. (C) Leader cell initiated the chain movement while in S-phase trailed by followers in G1. (D) Loss of the leader contact with premigratory TNC allows for a new round of Notch interaction that establishes a second leader cell.
Appendix 1—figure 1
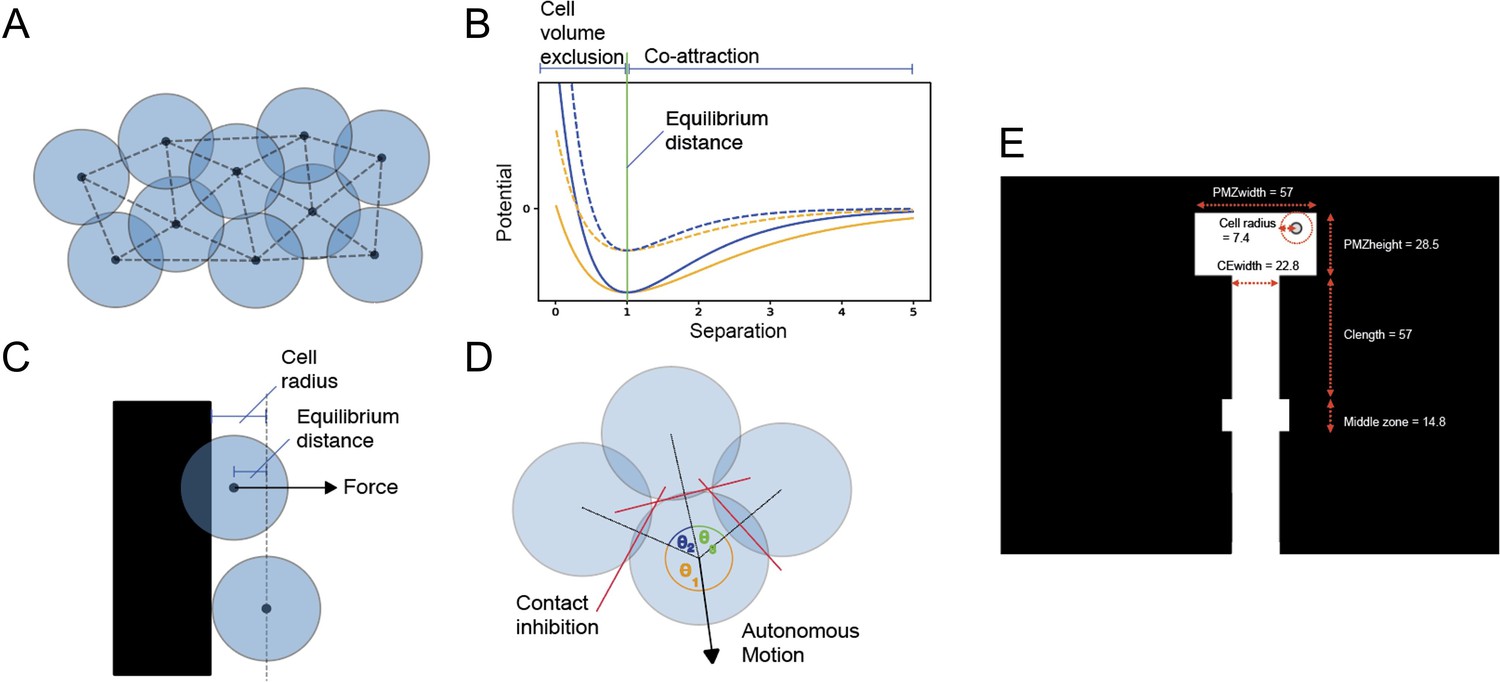
Description of model mechanisms and configuration.
(A) Diagram of 10 cells modelled as infinitesimal particles, with Delaunay triangulation showing nearest neighbours and circles showing typical cell radii around each particle. (B) Morse potential for low-volume exclusion k (orange), high cell volume exclusion (blue), high-energy depth De (solid line), and low-energy depth (dashed line). The portion of the curve that relates to repulsion is distinguished from the portion that relates to attraction by the vertical green line. (C) Demonstrating calculation of force component from a boundary. When the centre point of a cell moves within a cell radius of the boundary, the cell experiences a force perpendicular to and away from the boundary with magnitude determined by a Morse potential and with offset from equilibrium distance. (D) Demonstrating calculation of cell polarisation. Adjacent nearest neighbours of a cell subtend angles θ1, θ2, and θ3 around the cell centre. The direction of polarisation, and hence autonomous motion, bisects θ3, the largest such angle. Forces on each cell arise from interactions between neighbouring particles. These interactions are defined by a Morse potential (Morse, 1929), a function of the separation between particles, and parameterised by an equilibrium separation (re), approximate spring constant (k), and energy depth (De) (Equation 1, Figure 1B). These parameters model the typical radius of a cell, its volume exclusion, and chemoattractive magnitude (‘co-attraction’). (E) Dimensions of the model. White space represents empty space where cells can move freely, black space is space where cells cannot move due to boundaries. Horizontal movement is restricted while moving down the chain except for in the middle zone (for values associated with these parameters, see Appendix 1—table 1).
Appendix 1—figure 2
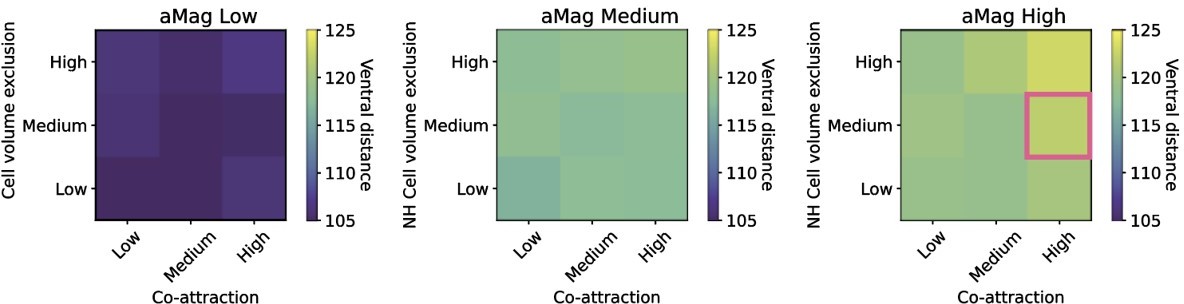
Calibration on final position of the furthest travelling cell in µm.
The optimal distance is 120 µm which is shown by the pink square. Ventral distance increases with increases in cell volume exclusion and co-attraction, which is most apparent in the rightmost heatmap.
Author response image 1
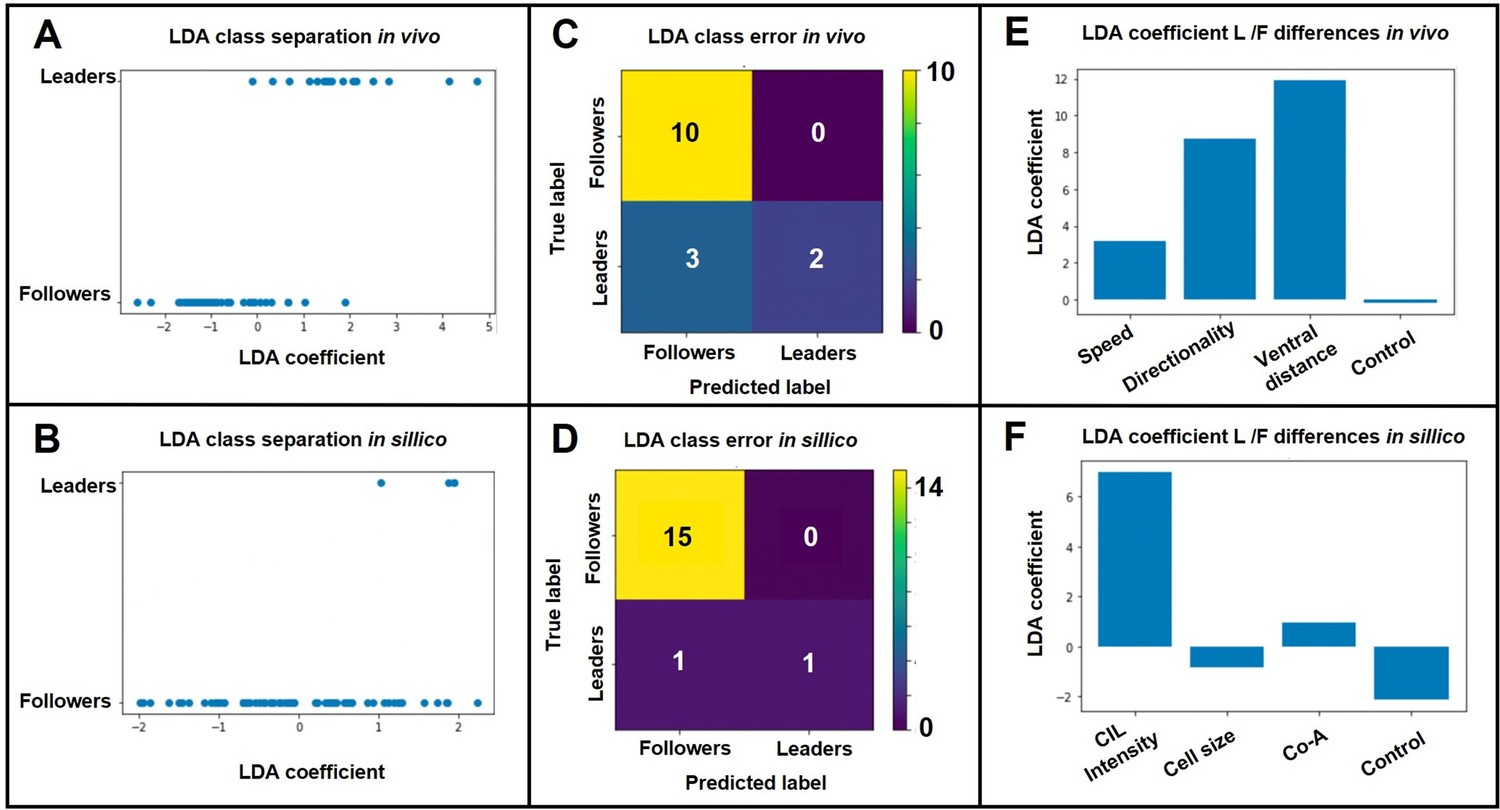
LDA results.
A. LDA leader/follower class separation of in vivo data. B. LDA leader/follower class separation of in-sillico data. C. LDA matrix of class separation confusion of in vivo data. D. LDA matrix of class separation confusion of in-sillico data. E. LDA coefficients of in vivo measurements. F. LDA coefficients of in-sillico parameters..
Tables
Key resources table
| Reagent type (species) or resource | Designation | Source or reference | Identifiers | Additional information |
|---|---|---|---|---|
| Genetic reagent (Danio rerio) | Sox10:mG; Tg(–4.9sox10: Hsa.HIST1H2BJ-mCherry-2A-GLYPI-EGFP) | Richardson et al., 2016 | ZDB-TGCONSTRCT-171205-3 | |
| Genetic reagent (D. rerio) | Sox10:Fucci; Tg(–4.9sox10:mAGFP-gmnn-2A-mCherry-cdt1) | Rajan and Gallik, 2018 | ZDB-TGCONSTRCT-190118-1 | |
| Genetic reagent (D. rerio) | hs:dnSu(H); vu21Tg (hsp70l:XdnSu(H)-myc) | Latimer et al., 2005 | ZDB-ALT-050519-2 | |
| Genetic reagent (D. rerio) | hs:Gal4; kca4Tg Tg(hsp70l:Gal4)1.5kca4 (1) | Scheer and Campos-Ortega, 1999 | ZDB-ALT-020918-6 | |
| Genetic reagent (D. rerio) | UAS:NICD; Tg(UAS:myc-Notch1a-intra)kca3Tg | Scheer and Campos-Ortega, 1999 | ZDB-ALT-020918-8 | |
| Genetic reagent (D. rerio) | Tg(UAS:dnSu(H)) | This paper | Transgenic line details are in materials and methods | |
| Genetic reagent (D. rerio) | Sox10:Kalt4; Tg(–4.9sox10: Hsa.HIST1H2BJ-mCherry-2A-Kalt4ER) | Alhashem et al., 2021 | ||
| Genetic reagent (D. rerio) | Tg(h2afva:GFP)kca13 | Pauls et al., 2001 | ZDB-ALT-071217-3 | |
| Genetic reagent (D. rerio) | Gt(FoxD3:mCherry)ct110aR | Hochgreb-Hägele and Bronner, 2013; Lukoseviciute et al., 2018 | ZDB-FISH-150901-9571 | |
| Antibody | Anti-myosin heavy chain (mouse monoclonal) | Developmental Studies Hybridoma Bank | F59 | IF (1:200) |
| Antibody | Anti-synaptotagmin 2 (mouse monoclonal) | Developmental Studies Hybridoma Bank | Znp1 | IF (1:50) |
| Antibody | Anti-acetylated tubulin (mouse monoclonal) | Sigma-Aldrich | Clone 6-11B-1; Cat# MABT868 | IF (1:1000) |
| Antibody | Anti-digoxigenin-AP (sheep polyclonal) | Sigma-Aldrich | Cat# 11093274910 | IF (1:2000) |
| Antibody | Anti-GFP (chicken polyclonal) | Merck Millipore | Cat# 06-896 | IF (1:750) |
| Antibody | Anti-RFP (rabbit polyclonal) | MBL | Cat# PM005 | IF (1:750) |
| Antibody | Myc-Tag (mouse monoclonal) | Cell Signaling | Clone 9B11; Cat# 2276S | IF (1:1000) |
| Antibody | Anti-GFP (chicken polyclonal) | Thermo Fisher | Cat# A10262 | IF (1:750) |
| Recombinant DNA reagent | PCNA-GFP | Addgene | Cat# 105942 | Leung et al., 2011 |
| Sequence-based reagent | UAS:NICD F UAS:NICD R | This paper | Genotyping primer | CATCGCGTCTCAGCCTCAC CGGAATCGTTTATTGGTGTCG 500 bp band |
| Sequence-based reagent | UAS:dnSu(H) F UAS:dnSu(H) R | This paper | Genotyping primer | GCGGTGTGTGTACTTCAGTC TCTCCCCAAACTTCCCTGTC 409 bp band |
| Sequence-based reagent | hs:dnSu(H) F hs:dnSu(H) R | This paper | Genotyping primer | CGGGCATTTACTTTATGTTGC TGCATTTCTTGCTCACTGTTTC 1 kb band |
| Commercial assay or kit | RNAscope Multiplex Fluorescent kit | Bio-Techne | Cat# 320850 | |
| Commercial assay or kit | mMESSAGE mMACHINE SP6 Transcription Kit | Thermo Fisher | Cat# AM1340 | |
| Chemical compound, drug | In-Fusion HD Cloning Plus | Takara | Cat# 638910 | |
| Chemical compound, drug | ProLong Gold Antifade Mountant | Thermo Fisher | Cat# P10144 | |
| Chemical compound, drug | Hydroxyurea | Sigma-Aldrich | Cat# H8627 | 20 μM |
| Chemical compound, drug | Aphidicolin | Sigma-Aldrich | Cat# A0781 | 300 μM |
| Chemical compound, drug | Genistein | Calbiochem | Cat# 345834 | 100 μM |
| Chemical compound, drug | Teniposide | Sigma-Aldrich | Cat# SML0609 | No effect on cell cycle in zebrafish |
| Chemical compound, drug | DAPT | Sigma-Aldrich | Cat# D5942-25MG | 100 μM |
| Chemical compound, drug | Compound E | Abcam | Cat# ab142164 | 50 μM |
| Software, algorithm | Tamoxifen | Sigma-Aldrich | Cat# H7904 | 2.5 μM |
| Software, algorithm | GraphPad Prism 9 | GraphPad Software | ||
| Software, algorithm | Fiji | ImageJ | Schindelin et al., 2012 |
Appendix 1—table 1
Simulation parameters, description, range, and source.
| Name | Description | Range | Optimised setting | Units | Source |
|---|---|---|---|---|---|
| PMZ width | Horizontal space of the premigratory zone. | 57.0 | 57.0 | μm | Measurement |
| PMZ height | Vertical space in the premigratory zone. | 28.5 | 28.5 | μm | Measurement |
| CE width | Horizontal width in the migratory chain. | 22.8 | 22.8 | μm | Model specific |
| MZ ratio | Vertical space around the midpoint relative to the height of the PMZ. | 0.5 | 0.5 | Units | Model specific |
| Cell radius | Interaction radius of cell radius was inferred assuming cells were perfect spheres, based on volumetric measurements (Richardson et al., 2016). | 7.4 | 7.4 | mm | Measurement |
| Nc | Number of cells. | 18 | 18 | Number | Measurement |
| ζ | Magnitude of stochastic component. Term of the Langevin equation, which controls random cell movement magnitude. | 0.035 | 0.035 | Units | Model specific |
| Overdamped Langevin equation drag factor. | 1 | 1 | Units | Model specific | |
| S | Leader spacing – number of follower cells between leader cells in migration. | {0, 1, 2, 3, ∞} | 3 | Number | Calibrated |
| Follower k | Spring constant near equilibrium (parameter of Morse potential) for follower type cells. This can be thought of as the cell volume exclusion of the cells. High k means that cells are stiffer. | Low: [0.01] Medium: [0.02] High: [0.03] | 0.01 | Units | Calibrated |
| Leader k | As above but for leader-type cells. | Low: [0.01] Medium: [0.02] High: [0.03] | 0.02 | Units | Calibrated |
| Follower De | Depth of potential well (parameter of Morse potential). Greater De means greater range of co-attraction. This can be thought of as the amount of chemotactic attraction signal released by each cell. | Low: [3e-05] Medium: [6e-05] High: [9e-05] | 3e-05 | Units | Calibrated |
| Leader De | As above but for leader-type cells. | Low: [3e-05] Medium: [6e-05] High: [9e-05] | 6e-05 | Units | Calibrated |
| Follower aMag | Magnitude of autonomous cell velocity. In the model’s implementation of contact inhibition, cells move into the widest open space. This parameter modulates the velocity with which they move into this space. | Low: [1.1e-07] Medium: [1.56e-06] High: [3e-06] | 1.1e-07 | Units | Calibrated |
| Leader aMag | As above but for leader-type cells. | Low: [1.1e-07] Medium: [1.56e-06] High: [3e-06] | 3e-06 | Units | Calibrated |
| Interaction threshold | Multiples of cell radii beyond which neighbours no longer cause polarisation by contact inhibition. | 1 | 1 | Units | Model specific |
| T max | Total run time in arbitrary units. | 2000 | 2000 | Units | Model specific |
| dt | Time interval between iterations. | 0.1 | 0.1 | Units | Model specific |
| Output interval | Time interval between data outputs. | 10 | 10 | Units | Model specific |
Additional files
-
Supplementary file 1
Statistical analysis of migratory parameters.
- https://cdn.elifesciences.org/articles/73550/elife-73550-supp1-v2.xlsx
-
Transparent reporting form
- https://cdn.elifesciences.org/articles/73550/elife-73550-transrepform1-v2.pdf
-
Source code 1
In vivo LDA code.
- https://cdn.elifesciences.org/articles/73550/elife-73550-code1-v2.zip
-
Source code 2
In silico LDA code.
- https://cdn.elifesciences.org/articles/73550/elife-73550-code2-v2.zip
-
Source data 1
Figures source data.
- https://cdn.elifesciences.org/articles/73550/elife-73550-data1-v2.xlsx
Download links
A two-part list of links to download the article, or parts of the article, in various formats.
Downloads (link to download the article as PDF)
Open citations (links to open the citations from this article in various online reference manager services)
Cite this article (links to download the citations from this article in formats compatible with various reference manager tools)
Notch controls the cell cycle to define leader versus follower identities during collective cell migration
eLife 11:e73550.
https://doi.org/10.7554/eLife.73550


