A theory of synaptic transmission
- Department of Physics, University of California, San Diego, United States
Figures
Figure 1
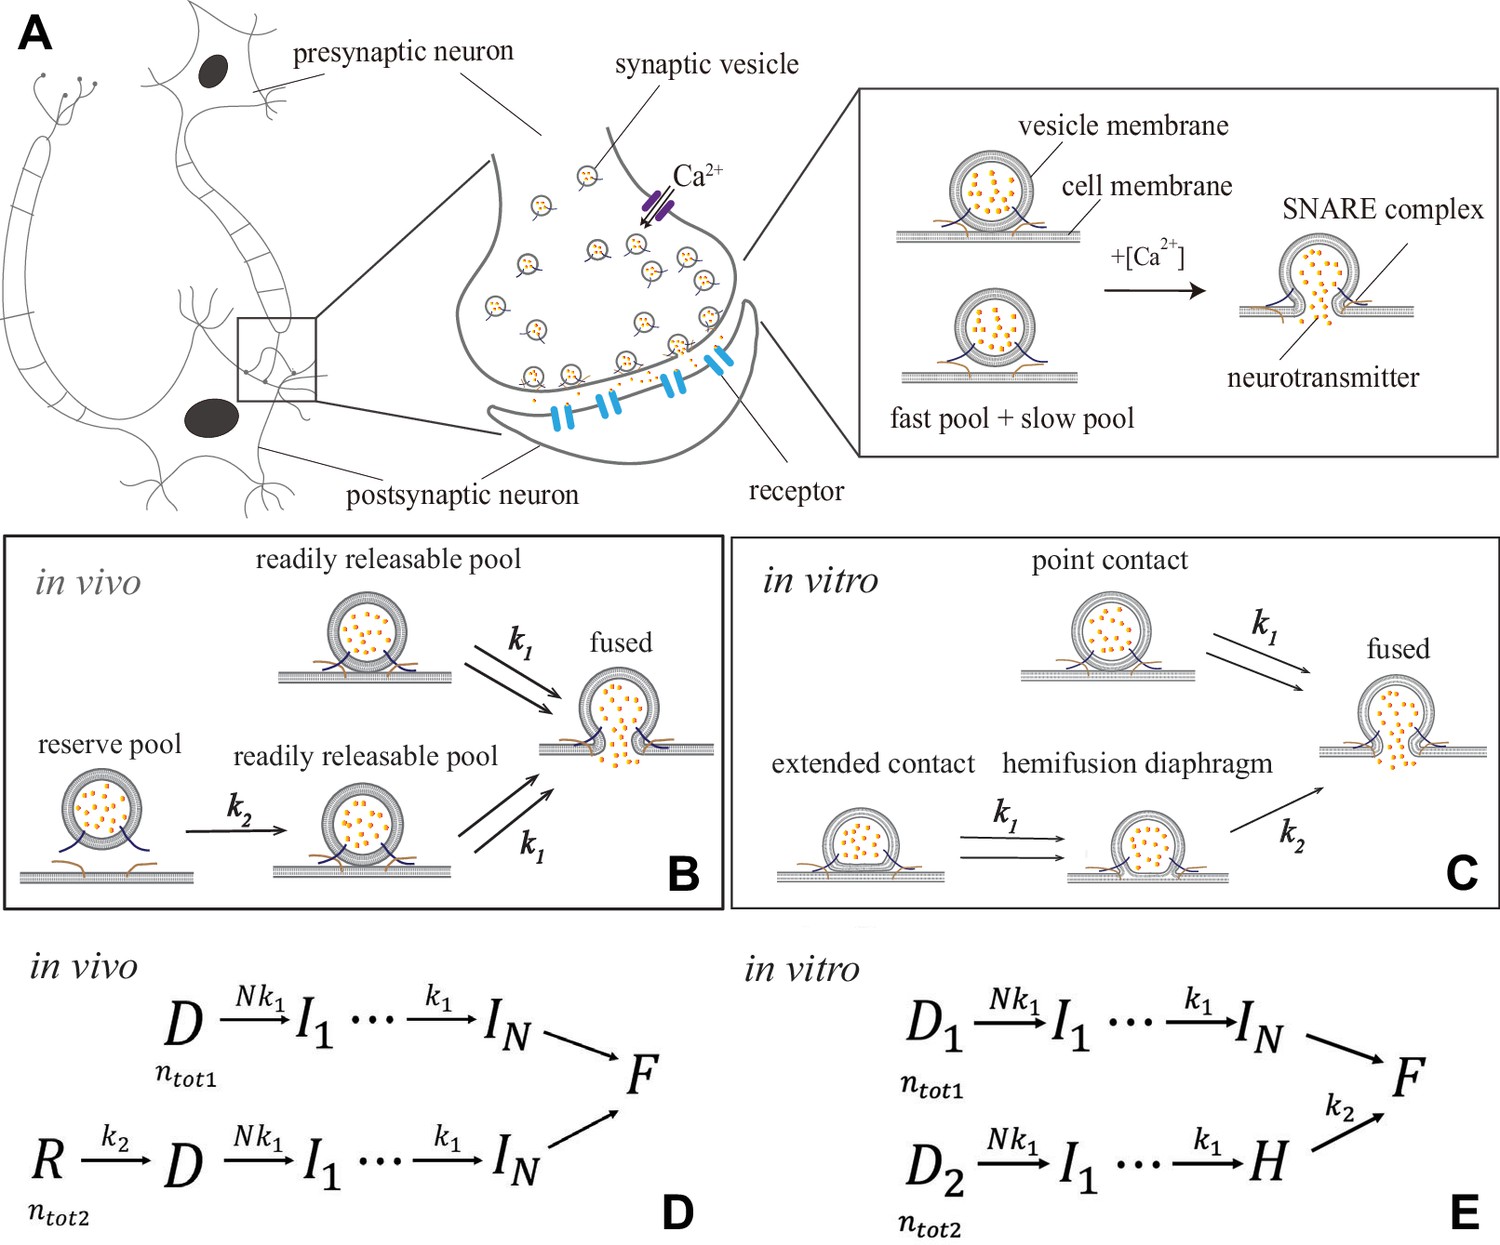
Synaptic transmission in vivo and in vitro.
(A) Release of neurotransmitters into the synaptic cleft (diameter ) occurs when neurotransmitter-loaded vesicles (diameter ) fuse with the presynaptic cell membrane in response to influx during an action potential. Fusion is facilitated by SNARE protein complexes and proceeds via two parallel pathways that originate in the ‘fast’ and ‘slow’ vesicle pools. (B and C) Fusion stages in vivo and in vitro. SNARE conformational transition constitutes the fast step, k1. Vesicle transfer from the reserve pool to the readily releasable pool (RRP) in vivo and escape from the hemifusion diaphragm in vitro constitute the slow step, k2. (D and E) Reaction schemes for (B) and (C). In vivo, state represents the reserve pool, the RRP, the state with i independent SNARE assemblies that underwent conformational transitions, the fused state. In vitro, and represent docked vesicles with point- and extended-contact morphologies, the hemifusion diaphragm. Mathematical equivalence of the reaction schemes in vivo and in vitro enables the treatment through a unifying theory.
Scheme 1
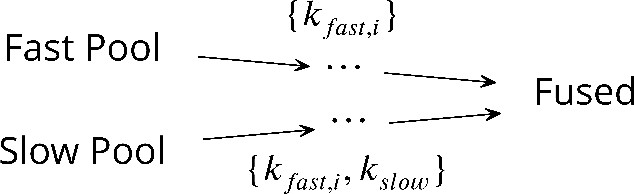
The unifying kinetic scheme for synaptic vesicle fusion.
Figure 2

Application of the theory to experiments: verifying universality and quantifying specificity.
(Left) Measured peak release rate versus calcium concentration for a variety of synapses (Schneggenburger and Neher, 2000; Bollmann et al., 2000; Miki et al., 2018; Duncan et al., 2010; Diao et al., 2012; Kochubey et al., 2009; Wölfel et al., 2007; Lou et al., 2005; Heidelberger et al., 1994; Beutner et al., 2001; Fukaya et al., 2021; Sakaba, 2008; Voets, 2000; Yang and Gillis, 2004; Sun et al., 2007). (Right) The same data as shown on the left, after the peak release rate and calcium concentration have been rescaled. Despite ten orders of magnitude variation in the dynamic range and more than 3 orders of magnitude variation in calcium concentration (left), the data collapse onto a single master curve, Equation 5 (right). The collapse indicates that the established scaling in Equation 5 is universal across different synapses. The distinct sets of parameters for each of the synapses (Appendix 3—table 2) demonstrate the predictive power of the theory as a tool for extracting the unique properties of individual synapses from experimental data.
Figure 3
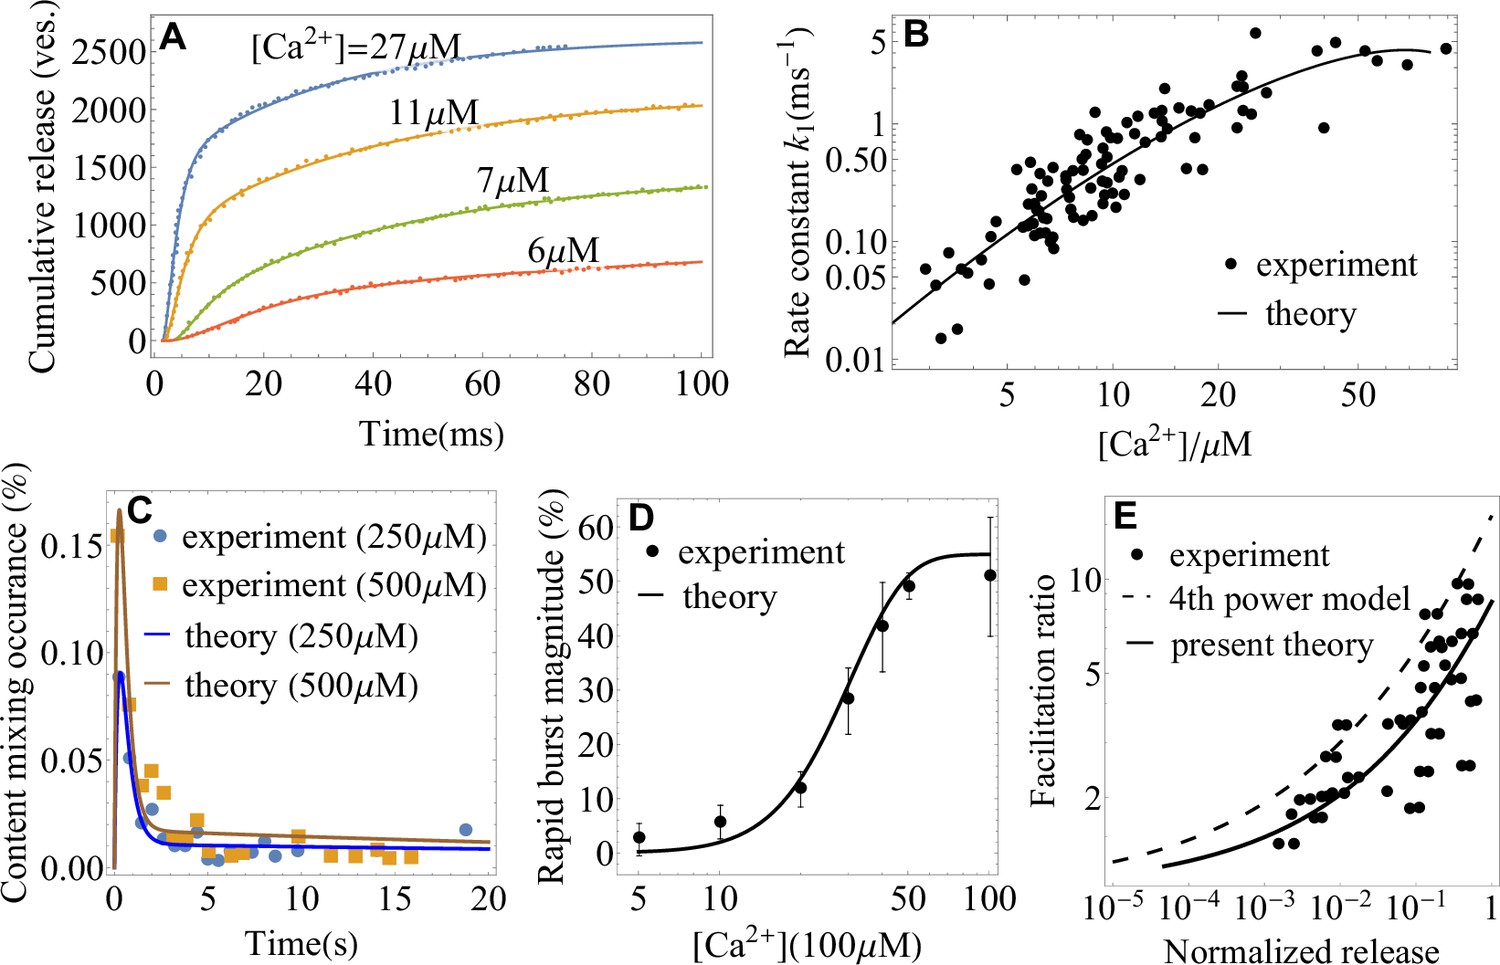
Application of the theory to experiments: extracting parameters of synaptic fusion machinery.
(A) Cumulative release from in vivo experiments (Wölfel et al., 2007) on the Calyx of Held (symbols) and a fit with Equation 2 (lines) for different calcium concentrations. (B) -dependent rate constant of SNARE conformational transition from in vivo experiments (Wölfel et al., 2007) and a fit with Equation 4. (C) Content mixing occurrence from in vitro experiments (Diao et al., 2012) and a fit with Equation 1. (D) Rapid burst magnitude from in vitro experiments (Kyoung et al., 2011) and Equation 2. (E) Facilitation as a function of the ratio of residual and control release (as defined in Appendix 3) from the experiment (Barrett and Stevens, 1972) on the frog neuromuscular junction (symbols) and from the present theory, Equation 4 (solid line). The fourth-power model (Barrett and Stevens, 1972; Jackman and Regehr, 2017) is also shown for comparison (dashed line). Parameters are shown in Appendix 3.
Figure 4

Functional implications of the theory.
(A–F) The paired-pulse ratio as a measure of short-term plasticity from experiments (Jackman et al., 2016; Turecek and Regehr, 2018; Müller et al., 2007) (symbols) and theory (lines) on a variety of synapses. Equation 7 for the syt7-mediated facilitation captures the data in A-E, and Equation 8 for the buffer saturation mechanisms captures the data in F over most of the interstimulus timescales probed in the experiments. The theory also identifies the regimes where particular mechanisms fail to account for the observed facilitation (A, B, D, E). (G) Paired-pulse ratio predicted by Equation 8. Synapses exhibit short-term facilitation or depression depending on the relative timescales of the recovery of the readily releasable pool, , and dissociation of calcium, . A given synapse can exhibit multiple forms of short-term plasticity as the time interval is varied. (H) Trade-off between the maximum transmission rate and fidelity from Equation 9 for different RRP sizes. (I) Synaptic efficacy, , from Equation 11. The plateau around the optimal synaptic strength (Equation 12) indicates that no fine-tuning is required for near-optimal transmission of large synapses. Higher -sensitivity results in broader plateau for near-optimal performance. Parameters are shown in Appendix 3.
Appendix 1—figure 1

Schematic representation of the free energy profile of a SNARE assembly.
(Left) The free energy profile at a reference calcium level . The activation barrier and the average number of calcium ions bound to the SNARE assembly at transition state are indicated. (Right) An elevation of the calcium level lowers the free energy barrier and thereby increases the rate k1 of the SNARE conformation transition.
Appendix 1—figure 2
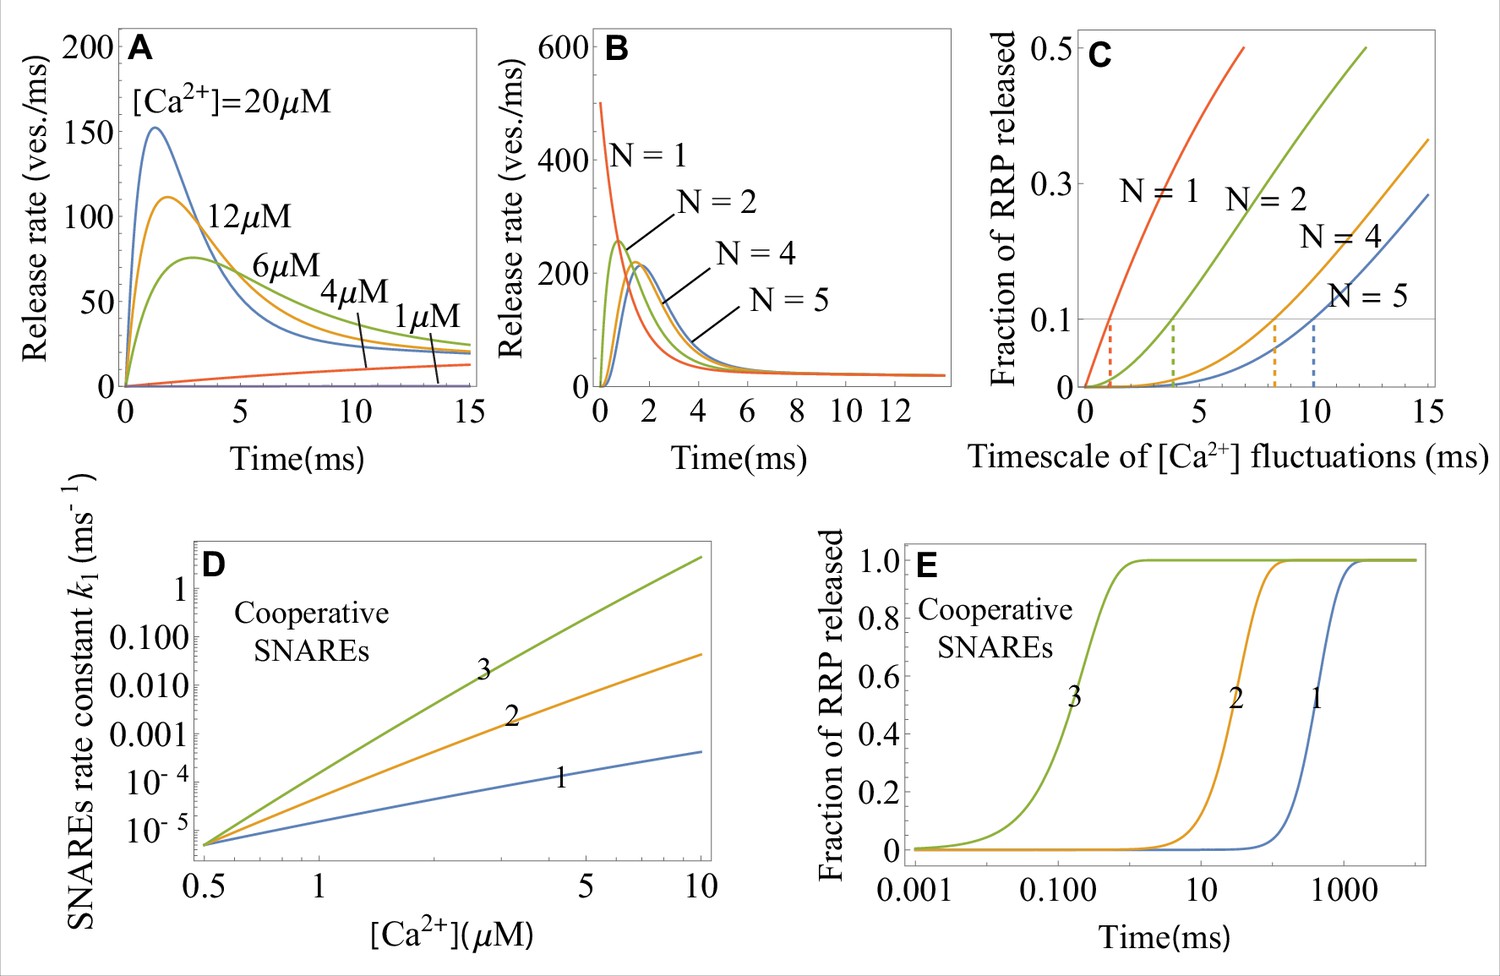
The effects of calcium concentration, the critical number of independent SNARE assemblies, and the number of cooperative SNAREs within a super-assembly on the neurotransmitter release dynamics, as predicted by the theory.
(A) Temporal profiles of the average release rate from Equations 1 and 4 across the range of calcium concentrations (indicated) typical for an action potential. Due to the exponential factor in Equation 4, the release turns on rapidly upon calcium influx and terminates rapidly with calcium depletion, resulting in a high temporal precision of synaptic release. (B) Temporal profile of the average release rate (Equation 1) when independent SNARE assemblies per vesicle are required for fusion. provides the optimal balance between stability with respect to fluctuations in calcium concentration (low release rate on the sub-millisecond timescale) and temporal precision (the fastest rise of average release rate). (C) Fraction of the RRP vesicles released due to spontaneous calcium fluctuations of varying timescales when SNARE assemblies per vesicle are required for fusion. Synapses with the larger exhibit robustness (low release fraction) against slower fluctuations. The timescales of fluctuations for which the synapse with a given is robust (fraction of released RRP , horizontal line) are indicated. (D) Transition rate for a single-SNARE assembly and for a super-assembly of 2 or 3 SNAREs as a function of calcium concentration, from Equation 4. Cooperativity between SNAREs within a super-assembly results in a steeper increase of the rate of conformational change with and hence in a faster vesicle release. Every additional SNARE within the super-assembly increases the release rate by a factor of at . (E) Temporal profiles of the fraction of RRP vesicles released for a (super)-assembly of or 3 SNAREs, from Equation 2, at . The effect of cooperativity between two or three SNAREs is incorporated through the parameter values for the transition barrier, and , which are, respectively, 2 and 3 times the values for a single SNARE. The parameter values for the 1 SNARE curve are matched to the in vitro experiment on syt1 (Hui et al., 2005). Parameter values are given in Appendix 3.
Appendix 1—figure 3
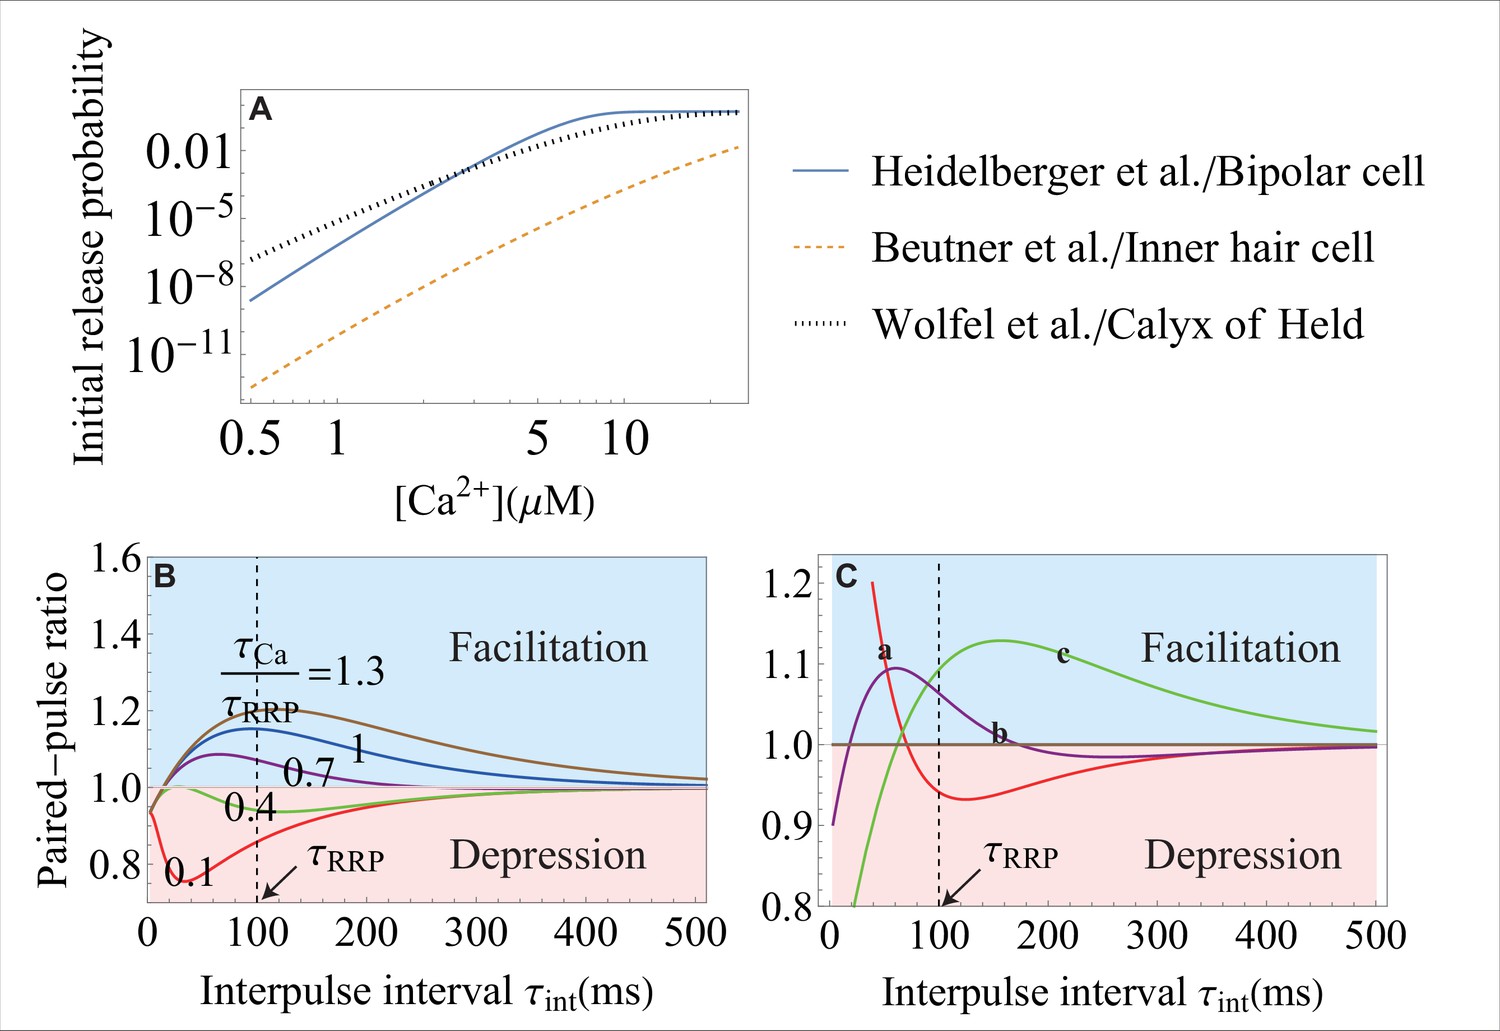
The effect of the molecular-level properties of synapses on release probability and short-term plasticity.
(A) The initial vesicle release probability, , over a range of typical in experiments, for different synapses. The release probability can vary significantly in different synapses because of different types of - sensors, different coupling between regulatory proteins and SNAREs, and different amount of the initial entry. The parameters for each curve correspond to the data from the studies that are indicated on the right. (B) Weaker -sensitivity (here, it is of that in Figure 4G) of a SNARE assembly results in a smaller dynamic range of short-term facilitation. The -sensitivity of a SNARE is defined as the ratio of the conformational rate constants (Equation 4) during the action potential, , and at rest, . The value of is set at . (C) Distinct short-term facilitation/depression modes in synapses that differ on the molecular level, from theory (Equation 8). Three different sets of parameters , , and are used for curves a, b and c, representing different properties of the molecular constituents for the three synapses. In curve a, the high frequency transient input (with small ) is facilitated and the low frequency input (with large ) is depressed. The effects are reversed in curve c with depression at high frequency and facilitation at low frequency. In curve b, inputs with intermediate frequencies are facilitated and inputs with high and low frequencies are depressed. The dynamic range for each curve can be amplified by changing the timescale for RRP replenishment, . Parameter values are given in Appendix 3.
Appendix 2—figure 1
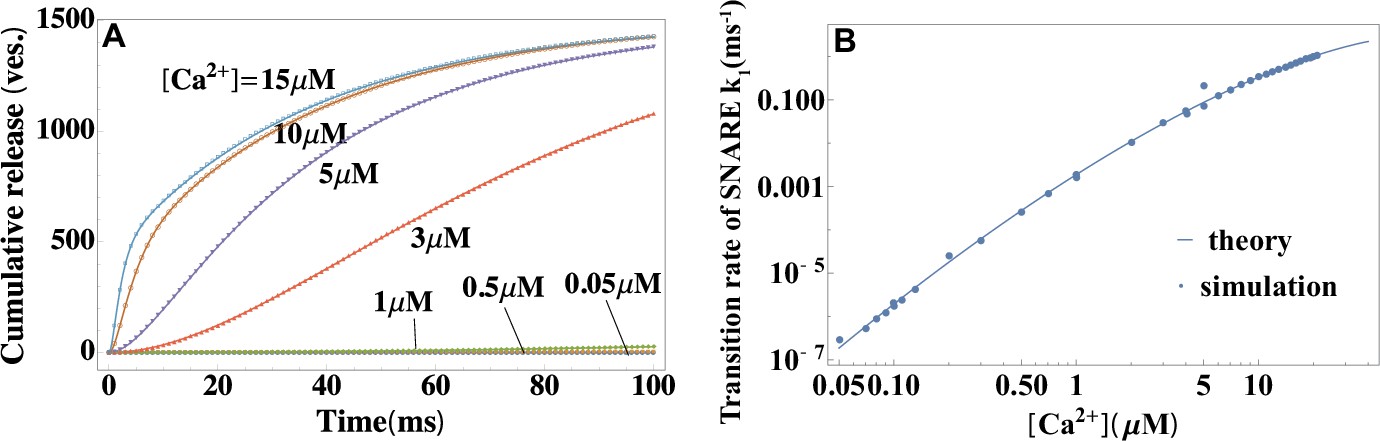
Validation of the theory through simulations.
(A) Temporal profiles of average cumulative release at different values of calcium concentrations from simulations (symbols) and a fit to the theory in Equation 2 (lines). (B) Calcium dependence of the rate constant of SNARE conformational change from simulations in (A), and a fit to Equation 4 . The reference concentration is set at a typical resting value of a synapse in vivo (Kaeser and Regehr, 2014) and . The fit yields the height and width of the activation barrier and the rate constant of SNARE conformational change at , which accurately recover the input parameters of the simulations. Parameters are listed in Appendix 3.
Appendix 2—figure 2
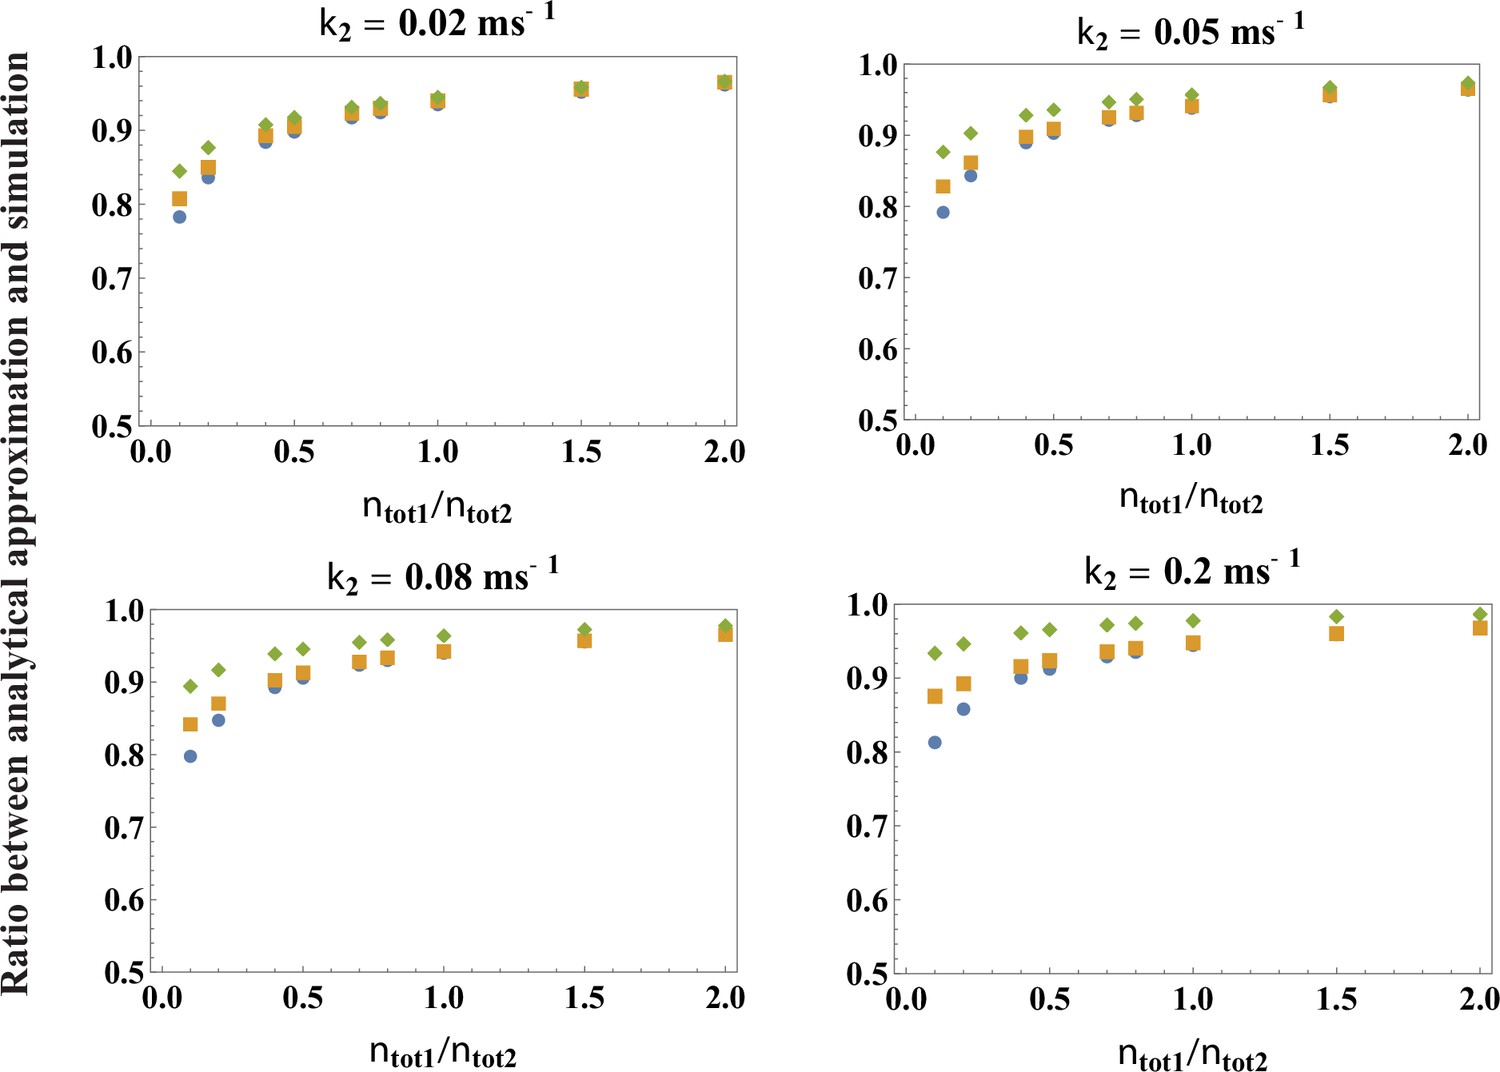
Testing the accuracy of the analytical theory for the peak release rate, Equation 3.
Plotted are the ratios between the parameters extracted from a fit to Equation 3 with k1 given by Equation 4 and the exact parameters of the simulations, across a broad range of values of and k2 (indicated in the figure), over the range of calcium concentrations . Blue circle is the ratio for , orange square for , green diamond for . For the biologically relevant value , the ratios are very close to 1, indicating that the theory is highly accurate ( accuracy).
Appendix 2—figure 3
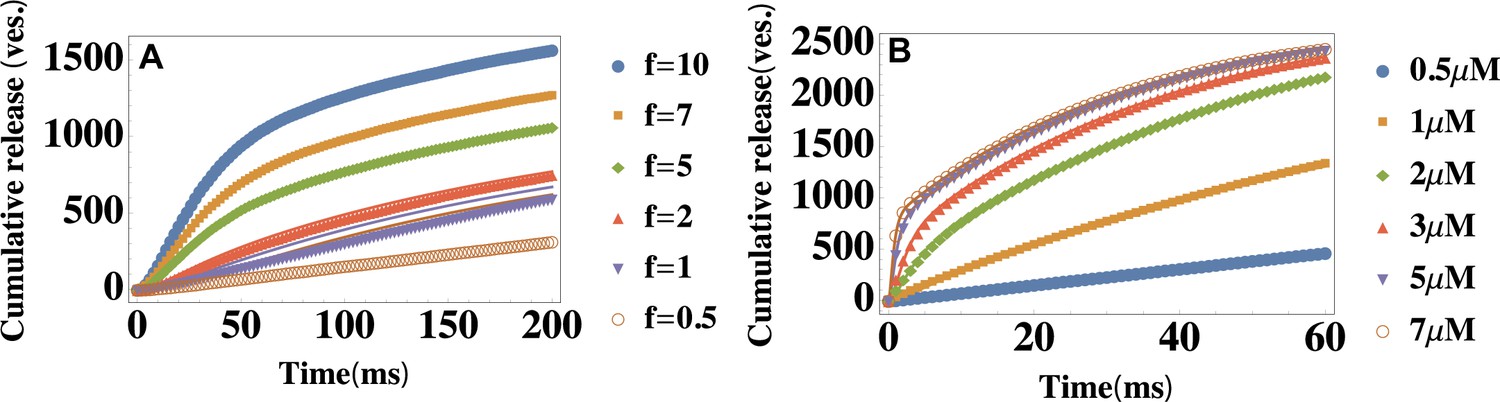
Testing the limitations of the theory: Finite capacity of the readily releasable pool and heterogeneity in vesicle pools.
(A) Temporal profiles of the average cumulative release at different ratios . Parameter values are , and , and is varied to change the ratio of the depletion and replenishment rates of the readily releasable pool. Symbols: data generated from modified simulations that introduced the finite-capacity effect of the readily releasable pool, lines: Equation 2 with the same parameter values as those used in the simulations. (B) Temporal profiles of the average cumulative release at different values of the extracellular calcium concentration . The parameters are described in the text. is shown in the legend. Data is fitted with Equation 2. The cumulative release rate exhibits a double-exponential shape if is not too large ().
Tables
Appendix 3—table 1
Errors from the least square fit for different values of N.
The fits are performed for the experimental data from Wölfel et al., 2007 to Equation 2 in the main text. The fitting error is calculated according to . The fit with N = 2 results in consistently smallest fitting errors across all calcium concentrations used in the experiment.
| Least squares error | N = 1 | N = 2 | N = 3 | N = 4 | N = 5 |
|---|---|---|---|---|---|
| [Ca2+] = 27 µM | 27.431 | 25.896 | 26.742 | 29.016 | 33.234 |
| [Ca2+] = 11 µM | 19.662 | 13.968 | 14.656 | 15.374 | 16.737 |
| [Ca2+] = 7 µM | 10.241 | 8.115 | 8.189 | 8.260 | 8.416 |
| [Ca2+] = 6 µM | 84.908 | 84.732 | 85.255 | 85.553 | 85.701 |
Appendix 3—table 2
Microscopic parameters of synaptic fusion machinery extracted from the fits in Figure 2 in the main text.
Rate constant is in ms−1, and .
| ΔG‡(kBT) | n‡Ca | log10[ntot1k0v] | Data source |
|---|---|---|---|
| 34.1 ± 3.0 | 7.84 ± 1.92 | −11.5 ± 1.3 | Calyx of Held (Schneggenburger and Neher, 2000) |
| 35 ± 19 | 4.48 ± 5.98 | −7.3 ± 0.8 | Calyx of Held (Lou et al., 2005) |
| 27.0 ± 1.31 | 6.22 ± 0.50 | −10.7 ± 0.5 | Calyx of Held (Bollmann et al., 2000) |
| 22.6 ± 1.7 | 5.58 ± 1.18 | −5.4 ± 0.4 | Calyx of Held (Sun et al., 2007) |
| 16.6 | 2.66 | −3.7 | PF-MLI (Miki et al., 2018) |
| 7.63 ± 3.34 | 3.34 ± 2.36 | −2.0 ± 0.7 | Photoreceptor (Duncan et al., 2010) |
| 19.8 ± 1.5 | 3.54 ± 1.00 | −4.7 ± 1.2 | Calyx of Held (Wölfel et al., 2007) |
| 20.3 ± 1.5 | 3.86 ± 0.40 | −5.3 ± 0.6 | Calyx of Held P8-9 (Kochubey et al., 2009) |
| 25.2 ± 1.9 | 5.28 ± 0.54 | −7.2 ± 0.7 | Calyx of Held P12 (Kochubey et al., 2009) |
| 26.3 ± 2.1 | 5.96 ± 0.56 | −11.1 ± 0.9 | Inner hair cell (Beutner et al., 2001) |
| 19.5 ± 5.1 | 5.92 ± 2.26 | −8.7 ± 2.5 | Hippocampal mossy 1ber (Fukaya et al., 2021) |
| 20.3 ± 2.0 | 4.40 ± 0.74 | −8.8 ± 0.8 | Cerebellar basket cell (Sakaba, 2008) |
| 30.3 ± 3.4 | 4.92 ± 0.56 | −9.6 ± 1.3 | Retina bipolar cell (Heidelberger et al., 1994) |
| 20.5 | 1.28 | −5.1 | Chromaffin cell (Voets, 2000) |
| 25.7 | 1.02 | −7.6 | Insulin-secreting cell (Yang and Gillis, 2004) |
| 20 | 2.82 | −9.3 | in vitro (Diao et al., 2012) |
Appendix 3—table 3
Parameter values extracted from the fit in Figure 4A-E in the main text for syt7-mediated facilitation.
In addition, and were fixed at the values typical for the synapse with syt1 as the main -sensor (see Appendix 3—table 2, and . The value of was set at for the facilitation-dominated synapses (Figure 4A, B, D and E) and 2000ms for the retinal ribbon synapse (Figure 4C).
| σ | τres (ms) | log10 [k0(ms–1)] | Data source |
|---|---|---|---|
| 1.90 | 200 | −8.0 | Corticothalamic Jackman et al., 2016 |
| 1.66 | 108 | −8.1 | Schaffer collateral Jackman et al., 2016 |
| 1.47 | 110 | −8.0 | Perforant path Jackman et al., 2016 |
| 2.05 | 70 | −7.6 | Granule cell Turecek and Regehr, 2018 |
| 1.80 | 860 | −6.7 | Retinal ribbon Luo et al., 2015 |
Additional files
Download links
A two-part list of links to download the article, or parts of the article, in various formats.
Downloads (link to download the article as PDF)
Open citations (links to open the citations from this article in various online reference manager services)
Cite this article (links to download the citations from this article in formats compatible with various reference manager tools)
A theory of synaptic transmission
eLife 10:e73585.
https://doi.org/10.7554/eLife.73585


