Endothelial cell signature in muscle stem cells validated by VEGFA-FLT1-AKT1 axis promoting survival of muscle stem cell
- Department of Pediatrics & Neurology, Division of Pediatric Neurology, The University of Texas Southwestern Medical Center, United States
- Stem Cell Institute, University of Minnesota Medical School, United States
- Greg Marzolf Jr. Muscular Dystrophy Center, University of Minnesota Medical School, United States
- Department of Neurology, University of Minnesota Medical School, United States
- Department of Cell, Developmental, and Regenerative Biology, Icahn School of Medicine at Mount Sinai, United States
- Graduate School of Biomedical Sciencesf, Icahn School of Medicine at Mount Sinai, United States
Figures
Figure 1 with 1 supplement
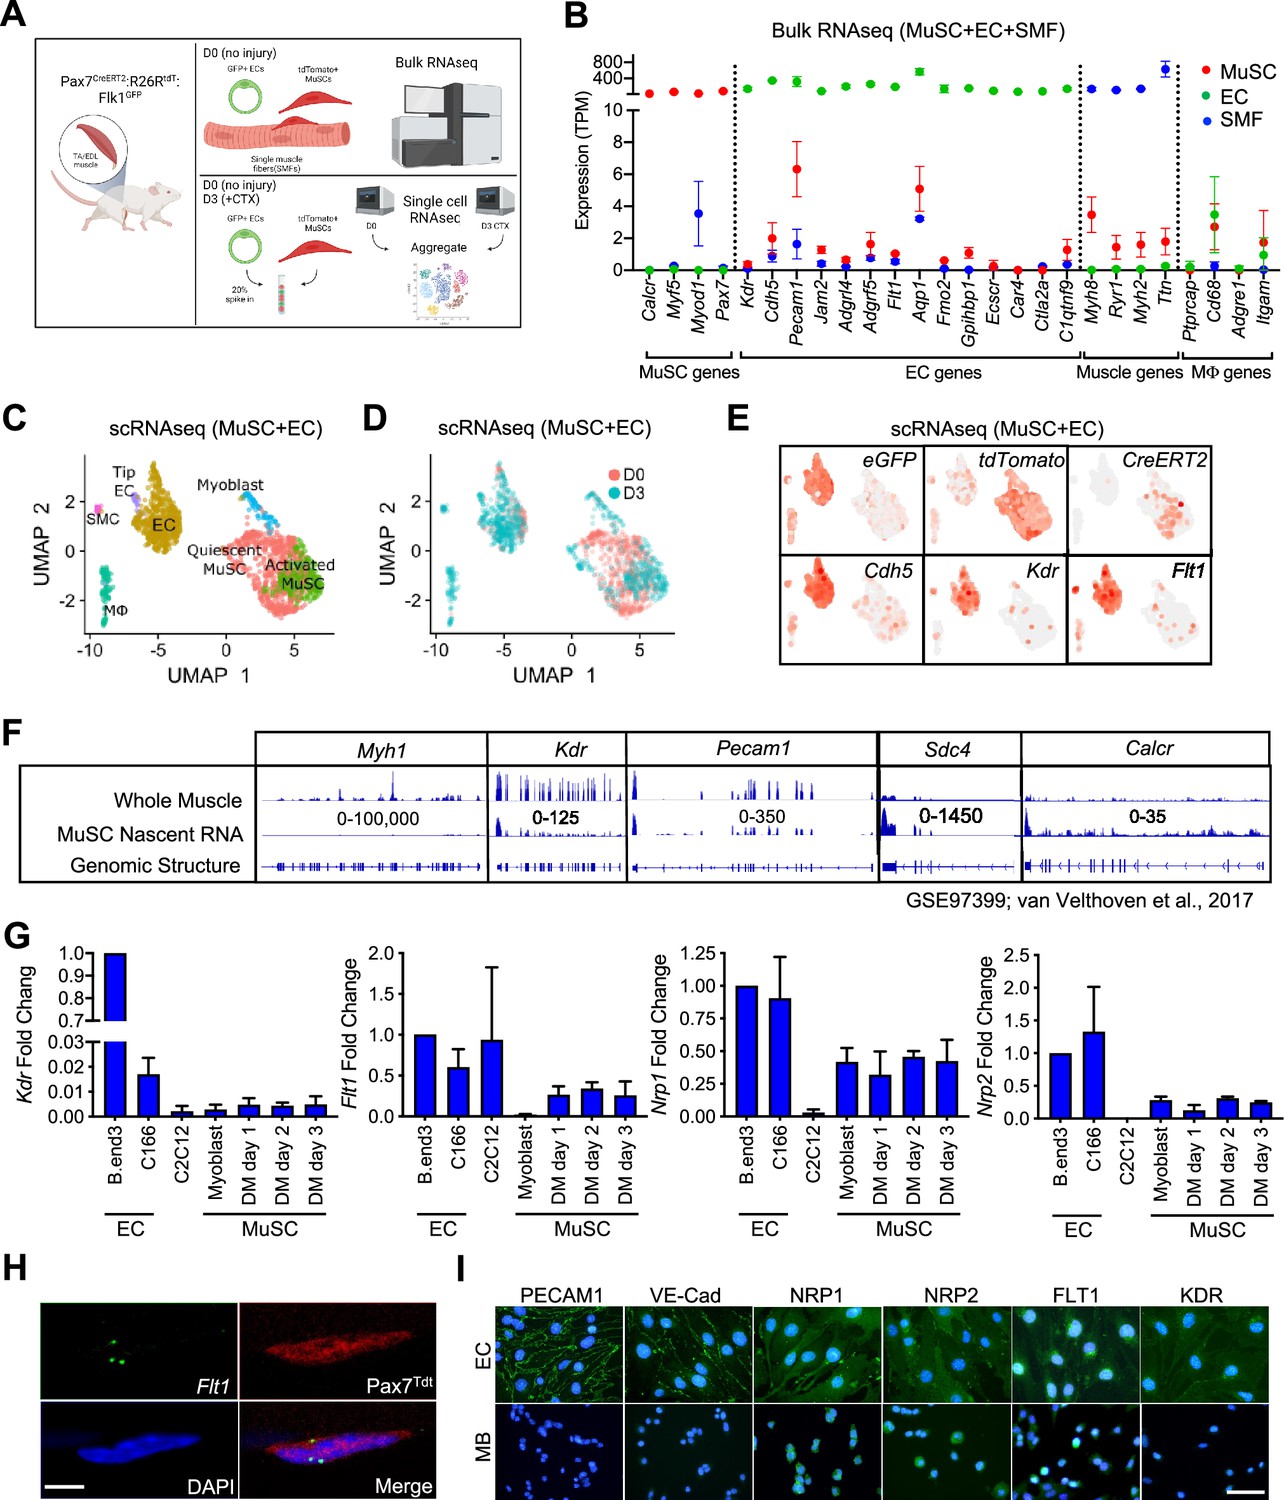
EC gene signal including VEGF receptor genes in MuSCs.
(A) Experimental schema for bulk and scRNA-seq from the Pax7CreERT2:R26RtdT:Flk1GFP mice. Bulk RNA-seq performed on MuSCs, ECs and single muscle fibers (SMFs) from uninjured muscle. FACS sorted MuSCs and ECs from uninjured and regenerating TA muscle (3 days following CTX) were run separately on the 10 X single cell platform and aggregated. This panel created with BioRender.com, and published using a BW26O8AXHL license with permission. (B) Bulk RNA-seq showing EC signature in MuSCs. Subset dividing genes that are commonly used to delineate cell identity for MuSCs, ECs and SMFs. Last column shows genes that define macrophages (Mφ), which should not be highly expressed in any on our cell types. Red dots indicate MuSCs, green dots indicate ECs and blue dots indicate SMFs. Data show mean ± SD (n=3). (C) UMAP from aggregated single cell RNA-seq shows expression of different phases of MuSCs (quiescent MuSCs, activated MuSCs and myoblasts), ECs (tip ECs and ECs) and from likely contaminant cells such as macrophages (Mφ) and smooth muscle cells (SMC). (D) UMAP from aggregated data visualized by sample day showing MuSCs segregated by the sample day but overlap in the EC population. Red dots indicate intact (day 0) and blue dots indicate 3 days following CTX. (E) Expression of quality control genes such as eGFP, tdTomato, CreERT2, and EC genes such as Cdh5, Kdr, and Flt1. (F) Genome browser tracks of whole muscle and TU-tagged MuSC nascent RNA (GSE97399, van Velthoven et al., 2017). Kdr and Pecam1 expression can be found in the MuSC fraction. As control, Myh1 is highly expressed in the whole muscle preparation but largely absent in the MuSC fraction. Sdc4 and Calcr are highly expressed in MuSC and less so in the whole muscle fraction. (G) qPCR for Kdr, Flt1, Nrp1 and Nrp2 in EC lines (bEnd.3 and C166), muscle cell line (C2C12) and MuSC-derived myoblasts in growth and differentiation medium (DM) shows low level expression of VEGFRs and VEGF co-receptors. Data show mean ± SD (n=3). (H) RNAScope of Flt1 on freshly isolated single muscle fibers from Pax7tdT mice shows Flt1 expression (green) and tdTomato (red) in MuSCs. Nuclei were counterstained with DAPI (blue). Scale bar indicates 5 µm. (I) Immunostaining for PECAM1, VE-cadherin (VE-Cad), VEGFA co-receptors (NRP1 and NRP2) and VEGFA receptors (FLT1 and FLK1) in bEnd.3 EC cell line and MuSC-derived myoblasts (MB). Nuclei were counterstained with DAPI (blue). Scale bar indicates 20 µm.
© 2024, BioRender Inc. Figure 1 was created using BioRender, and is published under a CC BY-NC-ND 4.0. Further reproductions must adhere to the terms of this license
-
Figure 1—source data 1
Measurement of EC gene signal including VEGF receptor genes in MuSCs.
- https://cdn.elifesciences.org/articles/73592/elife-73592-fig1-data1-v2.xlsx
Figure 1—figure supplement 1
EC gene signal in MuSCs.
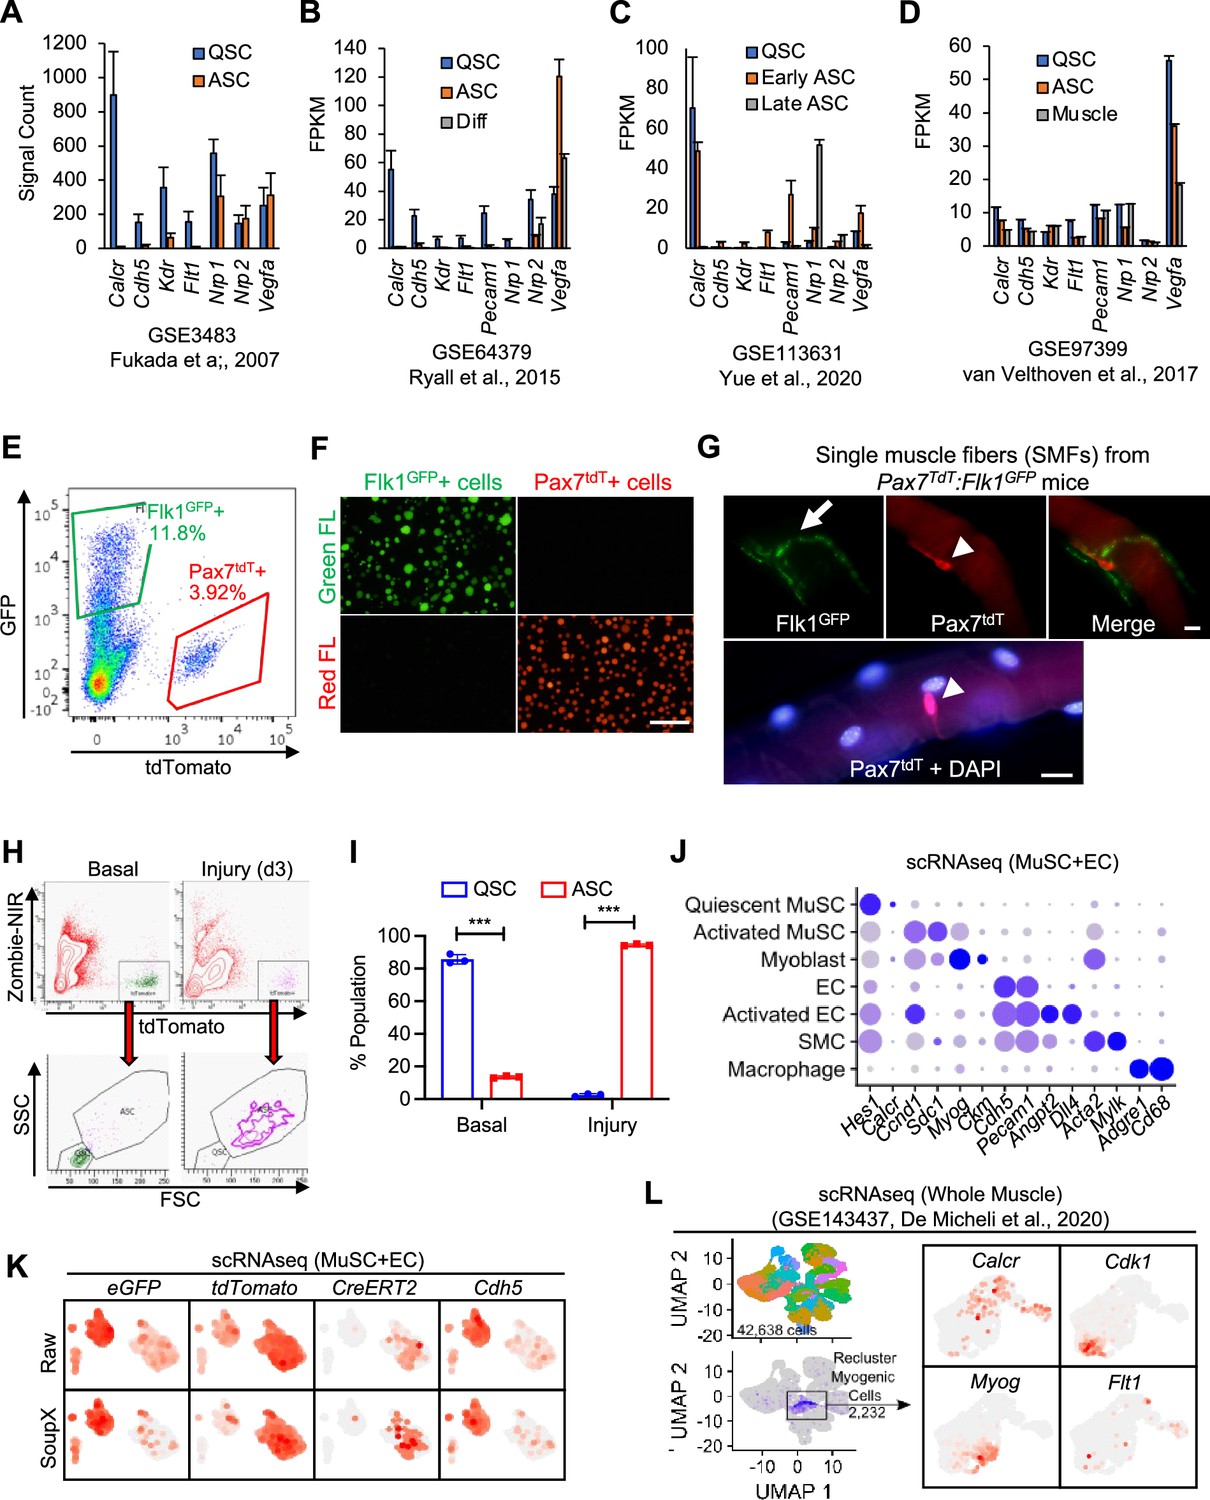
(A, B, C and D) MuSC and EC genes expressed in MuSC from various published repositories show a discrepancy in expression of EC-related genes [GSE3483 (n=3), Fukada et al., 2007; GSE64379 (n=2), Ryall et al., 2015; GSE113631 (n=2), Yue et al., 2020; GSE97399 (n=3), van Velthoven et al., 2017]. Data show mean ± SD. (E) Example of FACS isolation of Flk1GFP(+) ECs and Pax7tdT(+) MuSCs from Pax7+/CreERT2:R26R+/tdT:Flk1+/GFP mice. (F) Green (Green FL) and red (Red FL) fluorescence microscopic images of freshly isolated Flk1GFP(+) ECs and Pax7tdT(+) MuSCs from Pax7+/CreERT2:R26R+/tdT:Flk1+/GFP mice. Nuclei were counterstained with DAPI (blue). Scale bar indicates 100 µm. (G) EC fragment contamination with single muscle fiber (SMF) preparation. Flk1GFP(+)ECs (arrow, green) from the Pax7+/CreERT2:R26R+/tdT:Flk1+/GFP mice can be found enwrapping the muscle fibers when single muscle fibers (SMFs) were isolated, and that may result in EC gene expression in muscle fiber preparation. Arrowheads indicate Pax7tdT(+) MuSCs (red). Nuclei were counterstained with DAPI (blue). Scale bar indicates 10 µm. (H) FACS shows clear delineation between the SSC and FSC in quiescent vs. activated MuSCs isolated from day 3-injured muscle of Pax7+/CreERT2:R26R+/tdT:Flk1+/GFP mouse. (I) Quantification of quiescent MuSCs (QSCs) vs. activated MuSCs (ASCs) based only on the FSC and SSC from basal and regenerating muscle from Pax7+/CreERT2:R26R+/tdT:Flk1+/GFP mice. Data show mean ± SD (n=3). (J) Genes used to define different cell identities in the scRNA-seq. Of note, quiescent MuSCs were supported by high expression of Hes1 in myogenic cells, activated MuSCs were defined as myogenic cells with high expression of Ccnd1 and myoblasts were defined as myogenic cells expressing Myogenin (Myog). Activated ECs were defined as the population having higher Ccnd1 expression. (K) Background subtraction using SoupX maintains EC identity in the tdTomato(+) and CreERT2(+) myogenic cell clusters as evident by preserved expression of EC genes (eGFP and Cdh5). (L) Calcr(+), Myog(+) and Cdk1(+) myogenic cell cluster from aggregated scRNA-seq collection (GSE143437, De Micheli et al., 2020) shows Flt1 is expressed diffusely throughout the whole myogenic population.
-
Figure 1—figure supplement 1—source data 1
Measurement of EC gene signal in MuSCs.
- https://cdn.elifesciences.org/articles/73592/elife-73592-fig1-figsupp1-data1-v2.xlsx
Figure 2 with 1 supplement
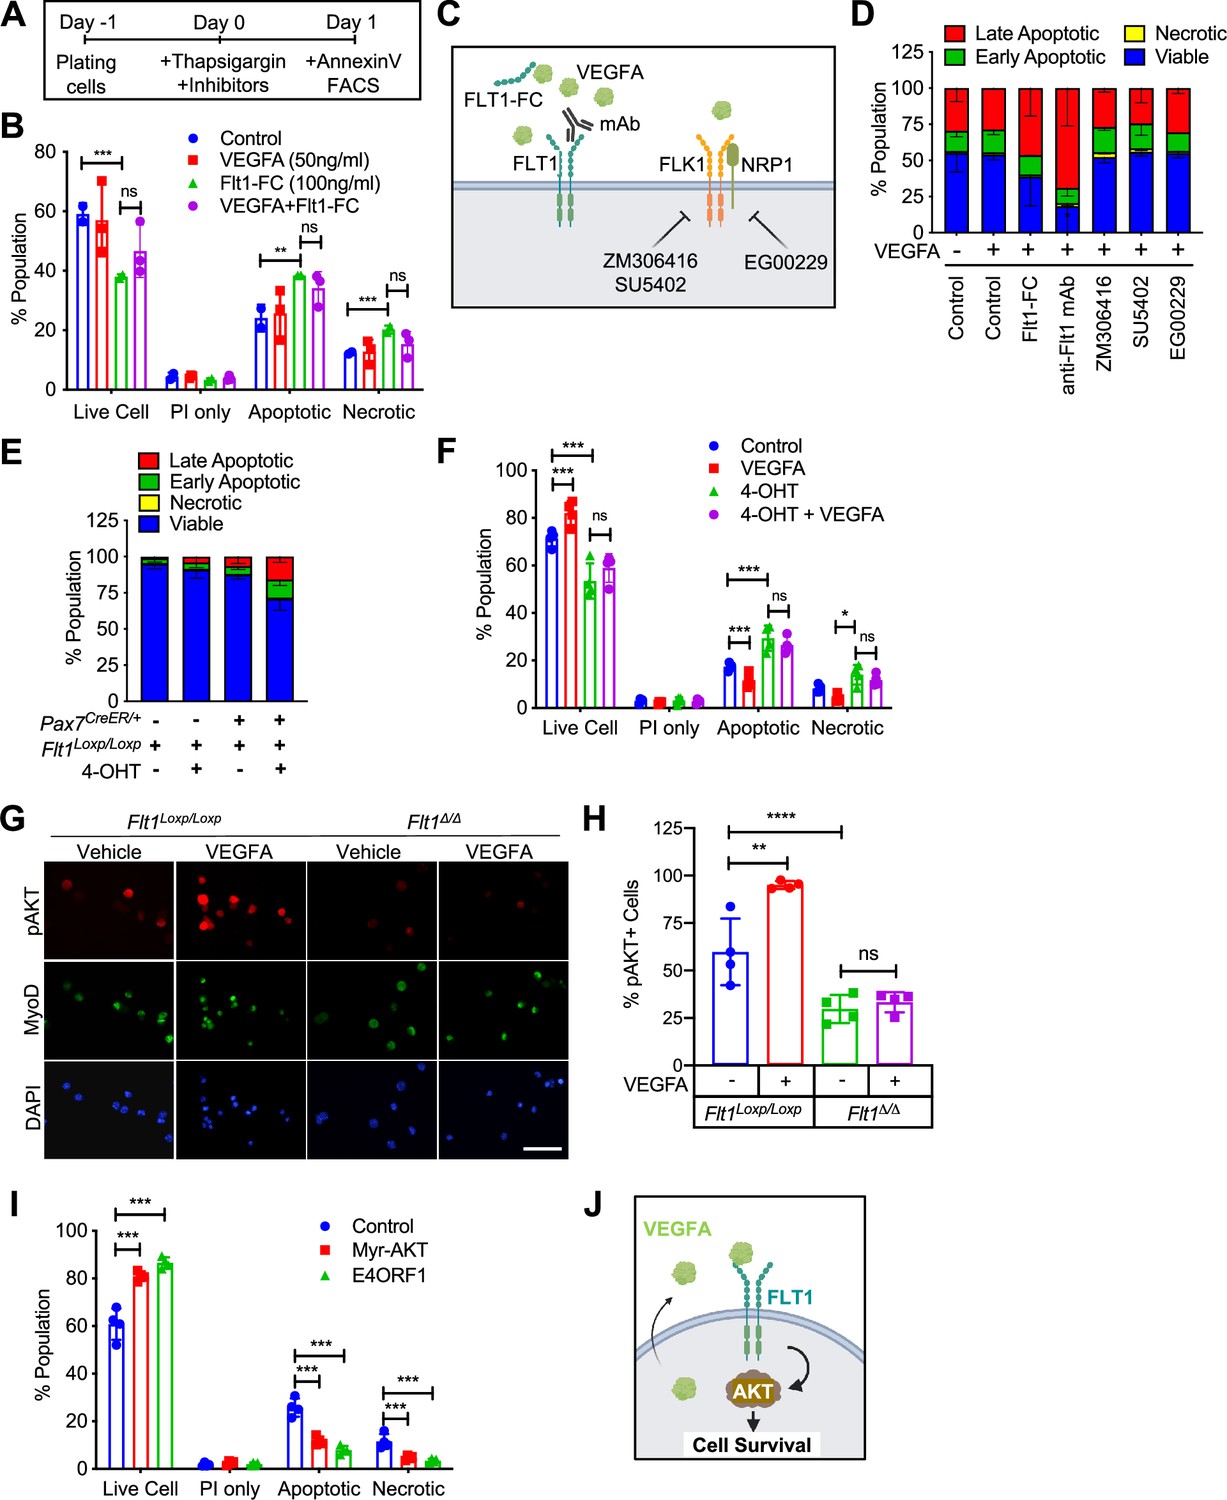
VEGFA-FLT1-AKT1 axis controls apoptosis in MuSC in vitro.
(A) Experimental scheme for assessing apoptosis following thapsigargin induction in myoblast culture. (B) Decreased cell survival in myoblast in vitro as VEGFA is blocked using 100 ng/ml FLT1-FC (a VEFGA trap) following thapsigargin induction. This phenotype is partially rescued with exogenous VEGFA (50 ng/ml). Data show mean ± SD (n=3). (C) Graphical representation of the various tools used to interrogate the VEGFA pathway in this figure. This panel created with BioRender.com, and published using a TQ26O8B2M7 license with permission. (D) Following thapsigargin induction, apoptotic and necrotic cells are increased with inhibition of FLT1 via FLT1-FC or anti-FLT1 antibody (anti-FLT1 mAb) but not FLK1 (SU5402 and ZM306416) or NRP1-FLK1 inhibition (EG00229) following exogenous VEGFA (50 ng/ml). Data show mean ± SD (n=3). (E) 4-OHT induced deletion of Flt1 in Pax7+/CreER:Flt1Loxp/Loxp myoblasts is sufficient to reduce cell survival in myoblast without induction of apoptosis. Data show mean ± SD (n=3). (F) Cell survival is decreased in vitro in myoblast with thapsigargin induction following 4-OHT mediated deletion of Flt1 in Pax7+/CreER:Flt1Loxp/Loxp myoblast that is not rescued by exogenous VEGFA. Blue indicates MuSC-Flt1+/+, red indicates MuSC-Flt1+/+ with 50 ng/ml VEGFA, green indicates MuSC-Flt1Δ/Δ and purple indicates MuSC-Flt1Δ/Δ with 50 ng/ml VEGFA. Data show mean ± SD (n=3). (G) Representative images of pAKT1 (red) in myoblast stained by MyoD (green) in MuSC-Flt1+/+ and MuSC-Flt1Δ/Δ myoblasts induced with exogenous VEGFA. Nuclei were counterstained with DAPI (blue). Scale bar indicates 50 µm. (H) Quantification of pAKT1 in myoblasts stained by MyoD in MuSC-Flt1+/+ and MuSC-Flt1Δ/Δ myoblast induced w/wo exogenous VEGFA. VEGFA induction increases pAKT1 in MuSC-Flt1+/+ myoblasts but this response is lost in MuSC-Flt1Δ/Δ myoblasts. Data show mean ± SD (n=3). (I) Annexin V quantification of myoblasts transfected with myr-AKT1 and E4ORF1 to activate AKT1 showed increased cell survival of myoblasts following thapsigargin induction. Data show mean ± SD (n=3). (J) Representative model for VEGFA-FLT1-AKT1 axis-mediated MuSC survival. This panel created with BioRender.com, and published using a TQ26O8B2M7 license with permission.
© 2024, BioRender Inc. Figure 2 was created using BioRender, and is published under a CC BY-NC-ND 4.0. Further reproductions must adhere to the terms of this license.
-
Figure 2—source data 1
Measurement of VEGFA-FLT1-AKT1 axis for apoptosis in MuSC in vitro.
- https://cdn.elifesciences.org/articles/73592/elife-73592-fig2-data1-v2.xlsx
Figure 2—figure supplement 1
VEGFA-FLT1-AKT1 axis for cell survival in MuSC in vitro.
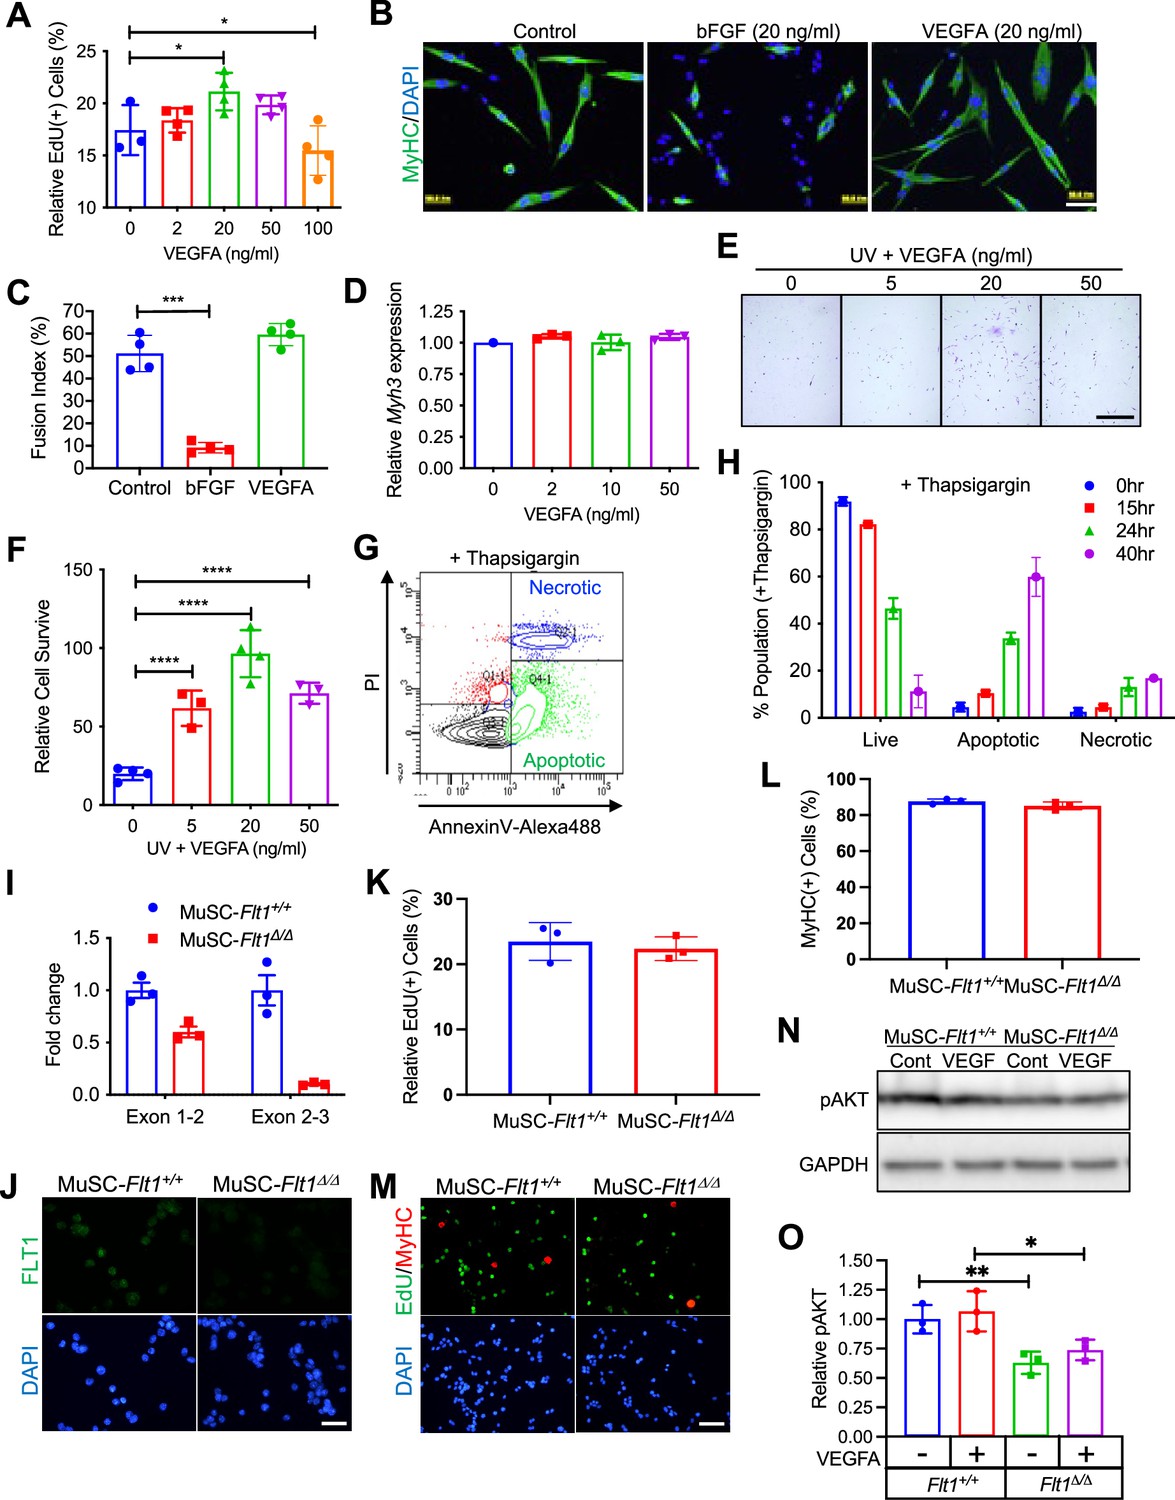
(A) MuSC-derived myoblast proliferation as assessed by % EdU following 6 hr of induction with exogenous VEGFA is increased at 20 ng/ml but decreased at 100 ng/ml. Data show mean ± SD (n=3). (B) Representative images of myoblast differentiation for 1 day stained with MyHC following bFGF or VEGFA treatment. Nuclei were counterstained with DAPI (blue). Scale bar indicates 100 µm. (C) Quantification of experiment shown in panel A showing that fusion index (equal or greater than 2 nuclei per cell) following 3 days in the differentiation medium is reduced by exogenous 20 ng/ml bFGF but unchanged with 20 ng/ml VEGFA. Data show mean ± SD (n=4). (D) Myh3 expression normalized by Htatsf1 in myoblasts was unchanged with exogenous VEGFA following 3 days in the differentiation medium. Data show mean ± SD (n=3). (E) Representative image of myoblast stained with crystal violet treated with VEGFA following induction of apoptosis via UV light. Scale bar indicates 200 µm. (F) Quantification of experiment shown in panel E shows improved cell survival of myoblasts with 20 ng/ml of VEGFA following induction of apoptosis via UV light. (G) Example of Annexin V/PI staining used for quantification of apoptosis by FACS shows the transition from live cells to apoptotic cells and necrotic cells following thapsigargin induction. (H) Time course of thapsigargin-induced cell apoptosis shows that cell survival is reduced to ~50% at 24 hr following thapsigargin induction. (I) RT-qPCR shows deletion of the Flt1 exon 3 in MuSC-Flt1Δ/Δ myoblasts while exons 1 and 2 are retained in MuSC-Flt1+/+ myoblasts. Data show mean ± SD (n=3). (J) Anti-FLT1 antibody staining shows downregulation of FLT1 in MuSC-Flt1Δ/Δ myoblasts while FLT1 is detected in MuSC-Flt1+/+ myoblasts. Nuclei were counterstained with DAPI (blue). Scale bar indicates 50 µm. (K) Myoblast proliferation as assessed by % EdU in MuSC-Flt1Δ/Δ cells was not significantly altered compared with MuSC-Flt1+/+ cells. Data show mean ± SD (n=3). (L) Myogenic differentiation as assessed by MyHC staining in MuSC-Flt1Δ/Δ myoblasts was not significantly altered compared with MuSC-Flt1+/+ myoblasts following 3 days in the differentiation medium. Data show mean ± SD (n=3). (M) Representative images of myoblast cultures following EdU exposure in growth medium stained for EdU (green) and MyHC (red). Nuclei were counterstained with DAPI (blue). Scale bar indicates 100 µm. (N) Western blotting for pAKT proteins (62 kDa) in MuSC-Flt1+/+ and MuSC-Flt1Δ/Δ myoblasts with or without VEGFA treatment. GAPDH (36 kDa) was used as an internal control for loading. (O) Western blotting showed reduced amounts of pAKT1 in MuSC-Flt1Δ/Δ myoblasts with or without VEGFA treatment compared to MuSC-Flt1+/+ myoblasts. Data show mean ± SD (n=3).
-
Figure 2—figure supplement 1—source data 1
Measurement of VEGFA-FLT1-AKT1 axis for cell survival in MuSC in vitro.
- https://cdn.elifesciences.org/articles/73592/elife-73592-fig2-figsupp1-data1-v2.xlsx
-
Figure 2—figure supplement 1—source data 2
Uncropped blotting image of Figure 2—figure supplement 1N.
- https://cdn.elifesciences.org/articles/73592/elife-73592-fig2-figsupp1-data2-v2.pdf
Figure 3 with 2 supplements

MuSC-derived VEGFA and Flt1 requires proper skeletal muscle regeneration.
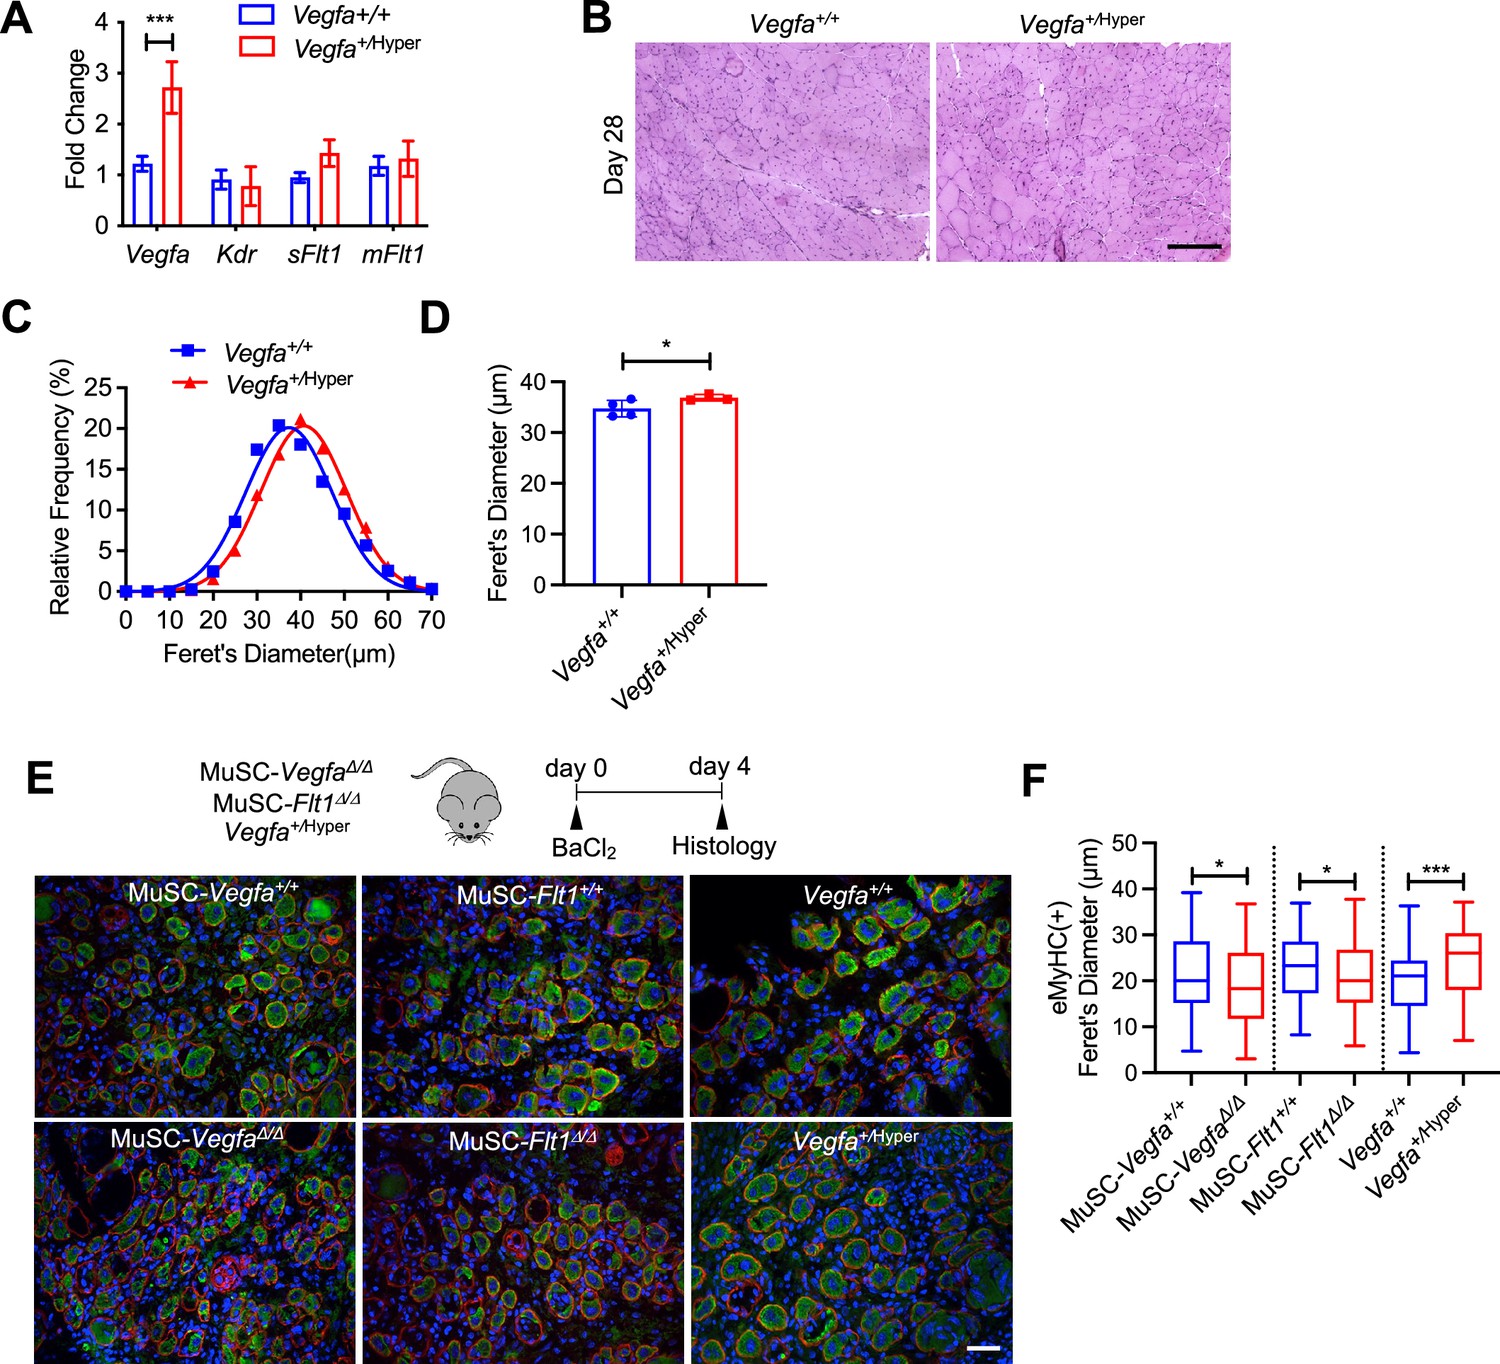
(A) Experimental schema detailing the experiments performed in this figure. The Pax7+/CreER:R26RtdT:Vegfa+/Hyper (Vegfa+/Hyper) Pax7+/CreER:R26RtdT:VegfaLoxp/Loxp for MuSC-VegfaΔ/Δ and Pax7tdT:Flt1Loxp/Loxp for MuSC-Flt1Δ/Δ lines were pulsed with tamoxifen (TMX) prior to BaCl2-induced muscle injury followed by investigations. (B) Representative H&E-stained images for intact and on 14-day post injury TA muscle from MuSC-Vegfa+/Hyper, MuSC-Flt1Δ/Δ and MuSC-VegfaΔ/Δ mice and their representative controls. Scale bar indicates 100 µm. (C) Annexin V staining show less necrotic cells in MuSC from Vegfa+/Hyper mice compared with the control one day following injury. Data show mean ± SD (n=3). (D) Quantification of MuSCs from single muscle fibers show increased Pax7 immunofluorescence positive MuSCs in Vegfa+/Hyper EDL muscle compared with the control mice at base line and 14 days post injury. Data show mean ± SD (n=4). (E) Fiber size distribution and (F) mean feret’s diameter of uninjured and regenerating muscle 14 days post injury from Vegfa+/Hyper and control mice show no difference at baseline but an increase in fiber diameter following injury. Data show mean ± SD (n=3). (G) Annexin V staining show increased dead cells in MuSCs from MuSC-VegfaΔ/Δ mice one day following BaCl2 compared with the control MuSC-Vegfa+/+ mice. Data show mean ± SD (n=4). (H) Quantification of MuSCs from single muscle fiber at base line and 14 days post injury shows no difference at baseline and reduced MuSC numbers at 14 days. Data show mean ± SD (n=4). (I) Fiber size distribution and (J) mean feret’s diameter of uninjured and regenerating muscle 14 days post injury from MuSC-VegfaΔ/Δ and MuSC-Vegfa+/+ mice show no difference at baseline but a decrease in fiber diameter following injury. Data show mean ± SD (n=3 or 5). (K) Annexin V staining show increased apoptosis in MuSCs from MuSC-Flt1Δ/Δ mice one day following injury compared with the control MuSC-Flt1+/+ mice. Data show mean ± SD (n=4). (L) Quantification of MuSCs from single muscle fiber show decreased MuSCs in MuSC-Flt1Δ/Δ EDL muscle at base line and 14 days post injury compared with the control MuSC-Flt1+/+ mice. Data show mean ± SD (n=4). (M) Fiber size distribution and (N) mean feret’s diameter of uninjured and regenerating muscle from MuSC-Flt1Δ/Δ and compared with the control MuSC-Flt1+/+ mice show no difference at baseline but a decrease in fiber diameter following injury. Data show mean ± SD (n=3).
-
Figure 3—source data 1
Measurement of MuSC-derived VEGFA and Flt1 for proper skeletal muscle regeneration.
- https://cdn.elifesciences.org/articles/73592/elife-73592-fig3-data1-v2.xlsx
Figure 3—figure supplement 1
MuSC-derived VEGFA and Flt1 for skeletal muscle regeneration.
(A) Vegfa is increased in Vegfa+/Hyper mouse muscle but does not lead to an increase in Flk1, soluble Flt1 (sFlt1) or membrane-bound Flt1 (mFlt1). Data show mean ± SD (n=3). (B) Representative H&E images from Vegfa+/+ and Vegfa+/Hyper mouse TA muscle in 28 days post-injury. Scale bar indicates 50 µm. (C) Fiber size distribution and (D) mean feret’s diameter of uninjured muscle from Vegfa+/Hyper mice show an increase in fiber diameter compared with the control following injury. Data show mean ± SD (n=4). (E) eMHC(+) fibers (green) in the TA muscle sections of MuSC-Vegfa Δ/Δ, MuSC-Flt1Δ/Δ and Vegfa+/Hyper mice were compared with the control MuSC-Vegfa+/+, MuSC-Flt1+/+ and Vegfa+/+ mice day 4 following BaCl2 injection. Red and blue staining show laminin staining and DAPI. Scale bar indicates 20 µm. (F) TA muscle sections of MuSC-VegfaΔ/Δ, MuSC-Flt1Δ/Δ and Vegfa+/Hyper mice compared with the control MuSC-Vegfa+/+, MuSC-Flt1+/+ and Vegfa+/+ mice show decreased (MuSC-Vegfa Δ/Δ and MuSC-Flt1Δ/Δ) and increased (Vegfa+/Hyper) eMHC(+) fibers day 4 following BaCl2 injection. Data show mean ± SD (n=3).
-
Figure 3—figure supplement 1—source data 1
Mesurement of MuSC-derived VEGFA and Flt1 for skeletal muscle regeneration.
- https://cdn.elifesciences.org/articles/73592/elife-73592-fig3-figsupp1-data1-v2.xlsx
Figure 3—figure supplement 2
MuSC-derived VEGFA and Flt1 regulating skeletal muscle regeneration.
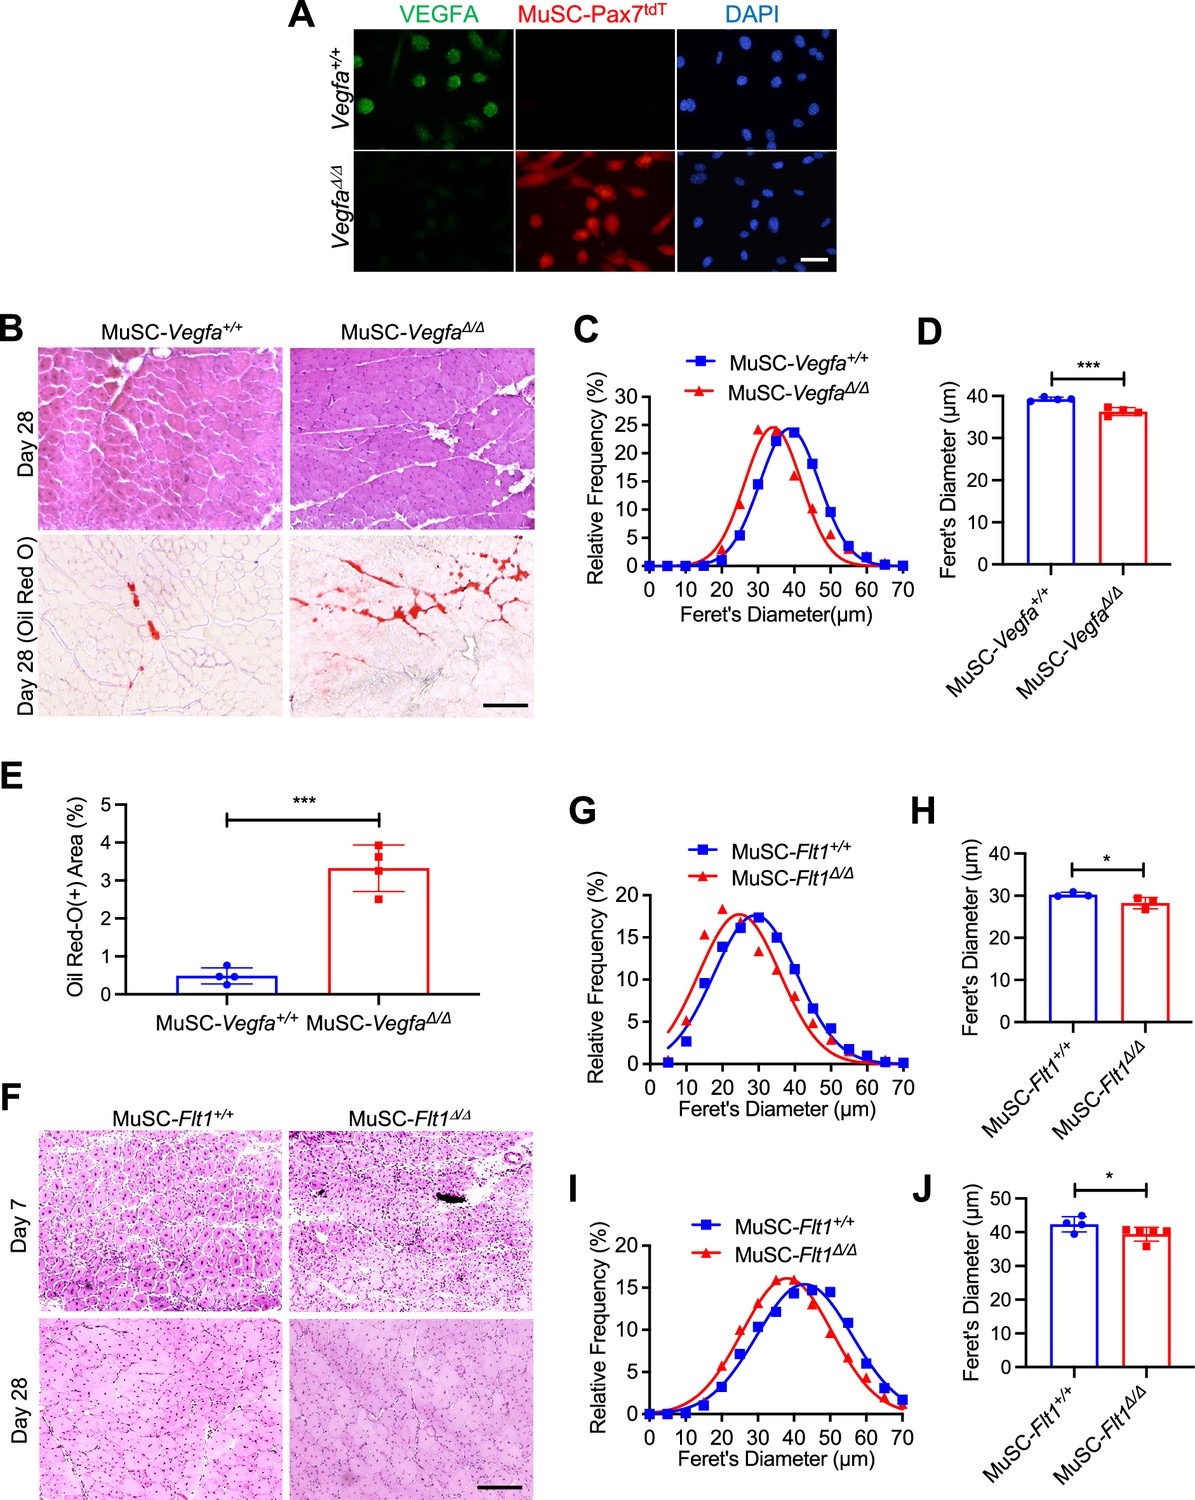
(A) Anti-VEGFA antibody staining shows downregulation of VEGFA protein (green) in MuSC-VegfaΔ/Δ myoblasts while VEGFA is detected in MuSC-Vegfa+/+ myoblasts. Pax7tdT(+) cells (red) was clearly detected only in MuSC-VegfaΔ/Δ myoblasts but not in MuSC-Vegfa+/+ myoblasts. Nuclei were counterstained with DAPI (blue). Scale bar indicates 25 µm. (B) Representative H&E and Oil Red O (showing fat infiltration as red color) images from regenerating TA muscle of MuSC-Vegfa+/+ and MuSC-VegfaΔ/Δ mice in 28 days post-injury. Scale bar indicates 100 µm. (C) Fiber size distribution and (D) average fiber diameters are decreased in MuSC-VegfaΔ/Δ mouse TA muscle compared with the control from Vegfa+/+ mouse TA muscle. Data show mean ± SD (n=4). (E) Average Oil Red O(+) fat infiltration from regenerating TA muscle of MuSC-Vegfa+/+ and MuSC-VegfaΔ/Δ mice in 28 days post-injury. Data show mean ± SD (n=4). (F) Representative H&E images from MuSC-Flt1+/+ and MuSC-Flt1Δ/Δ mouse TA in 7 and 14 days post-injury. Scale bar indicates 100 µm. (G) Fiber size distribution and (H) mean feret’s diameter are decreased 7 days post-injury in MuSC-Flt1Δ/Δ mouse TA muscle compared with the control from MuSC-Flt1+/+ mouse TA muscle. Data show mean ± SD (n=3). (I) Fiber size distribution and (J) average fiber diameter are decreased 14 days post-injury in MuSC-Flt1Δ/Δ mouse TA muscle compared with the control from MuSC-Flt1+/+ mouse TA muscle. Data show mean ± SD (n=4 or 5).
-
Figure 3—figure supplement 2—source data 1
Measurement of MuSC-derived VEGFA and Flt1 during skeletal muscle regeneration.
- https://cdn.elifesciences.org/articles/73592/elife-73592-fig3-figsupp2-data1-v2.xlsx
Figure 4 with 2 supplements
VEGFA-FLT1 pathway in MuSCs regulates muscle pathology in DMD model mice.
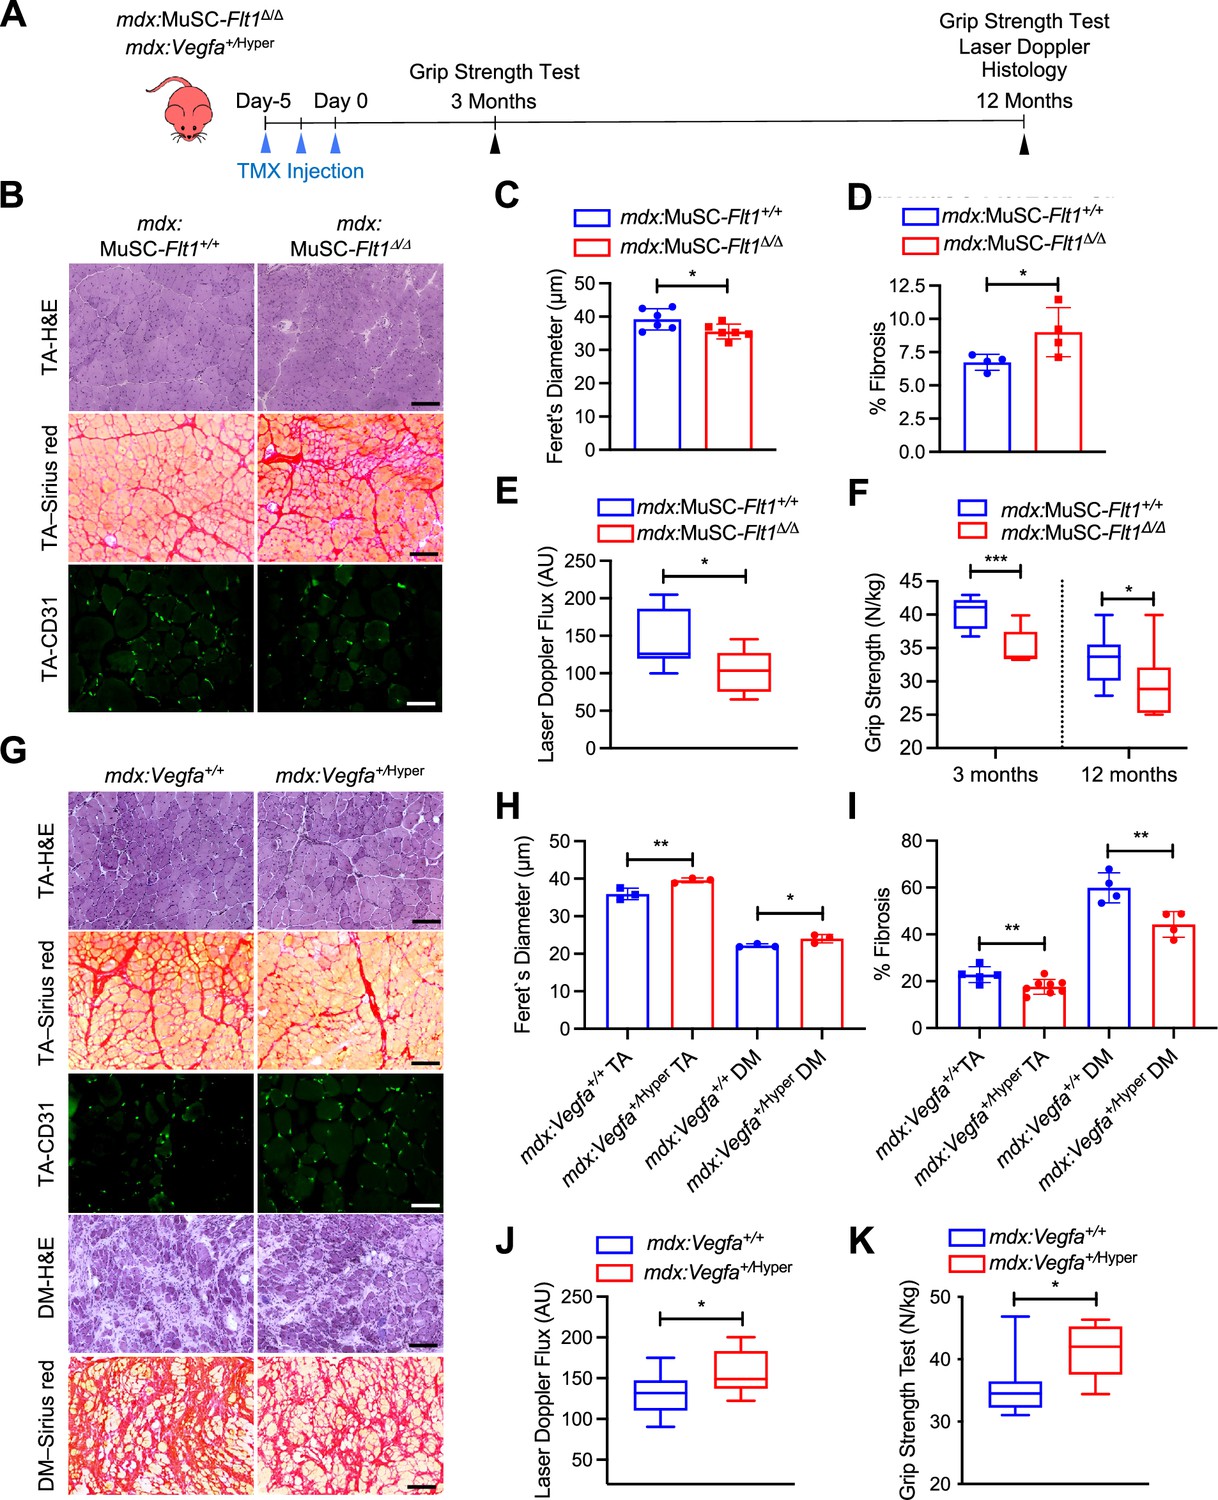
(A) Experimental schema detailing the experiments performed in this figure. The mdx:Pax7tdT:Flt1Loxp/Loxp was pulsed with tamoxifen (TMX) to generate mdx:MuSC-Flt1Δ/Δ mice prior to investigation. mdx:Vegfa+/Hyper mouse line was used without any induction. (B) Representative H&E (scale bar, 100 µm), Sirius red staining (red; scale bar, 100 µm) and CD31(+) capillaries (green; scale bar, 25 µm) from mdx:MuSC-Flt1+/+ and mdx:MuSC-Flt1Δ/Δ mouse TA muscle at 3 months of age. (C) Smaller average fiber size in mdx:MuSC-Flt1Δ/Δ compared with the control mdx:MuSC-Flt1+/+ mouse TA muscle. Data show mean ± SD (n=6). (D) Increased fibrotic area in mdx:MuSC-Flt1Δ/Δ compared with the control mdx:MuSC-Flt1+/+ mouse TA muscle. Data show mean ± SD (n=4). (E) Decreased muscle perfusion in mdx:MuSC-Flt1Δ/Δ compared with the control mdx:MuSC-Flt1+/+ mouse TA muscle. Data show mean ± SD (n=3). (n=3). (F) Decreased grip strength normalized to body weight in mdx:MuSC-Flt1Δ/Δ compared with the control mdx:MuSC-Flt1+/+ mouse TA muscle at both 3 and 12 months of age. Data show mean ± SD (n=3). (G) Representative H&E (scale bars, 100 µm), Sirus red stain staining (red; scale bars, 100 µm) and CD31(+) capillaries (green; scale bar, 25 µm) from TA muscle of mdx:Vegfa+/Hyper and mdx:Vegfa+/+ mouse at 3 months. (H) Increased average fiber size in mdx:Vegfa+/Hyper compared with the control mdx:Vegfa+/+ mouse TA and diaphragm (DM) muscle. Data show mean ± SD (n=3). (I) Decreased fibrosis in mdx: Vegfa+/Hyper compared with the control mdx:Vegfa+/+ mouse TA muscle and diaphragm (DM) muscle. Data show mean ± SD (n=4 to 8). (J) Muscle perfusion is increased in mdx:Vegfa+/Hyper compared with the control mdx:Vegfa+/+ mouse TA muscle. Data show mean ± SD (n=3). (K) Grip strength normalized to body weight is increased in mdx:Vegfa+/Hyper compared with the control mdx:Vegfa+/+ mice. Data show mean ± SD (n=3).
-
Figure 4—source data 1
Measurement of VEGFA-FLT1 pathway in MuSCs for muscle pathology in DMD model mice.
- https://cdn.elifesciences.org/articles/73592/elife-73592-fig4-data1-v2.xlsx
Figure 4—figure supplement 1
VEGFA-FLT1 pathway in MuSCs for muscle pathology in DMD model mice.
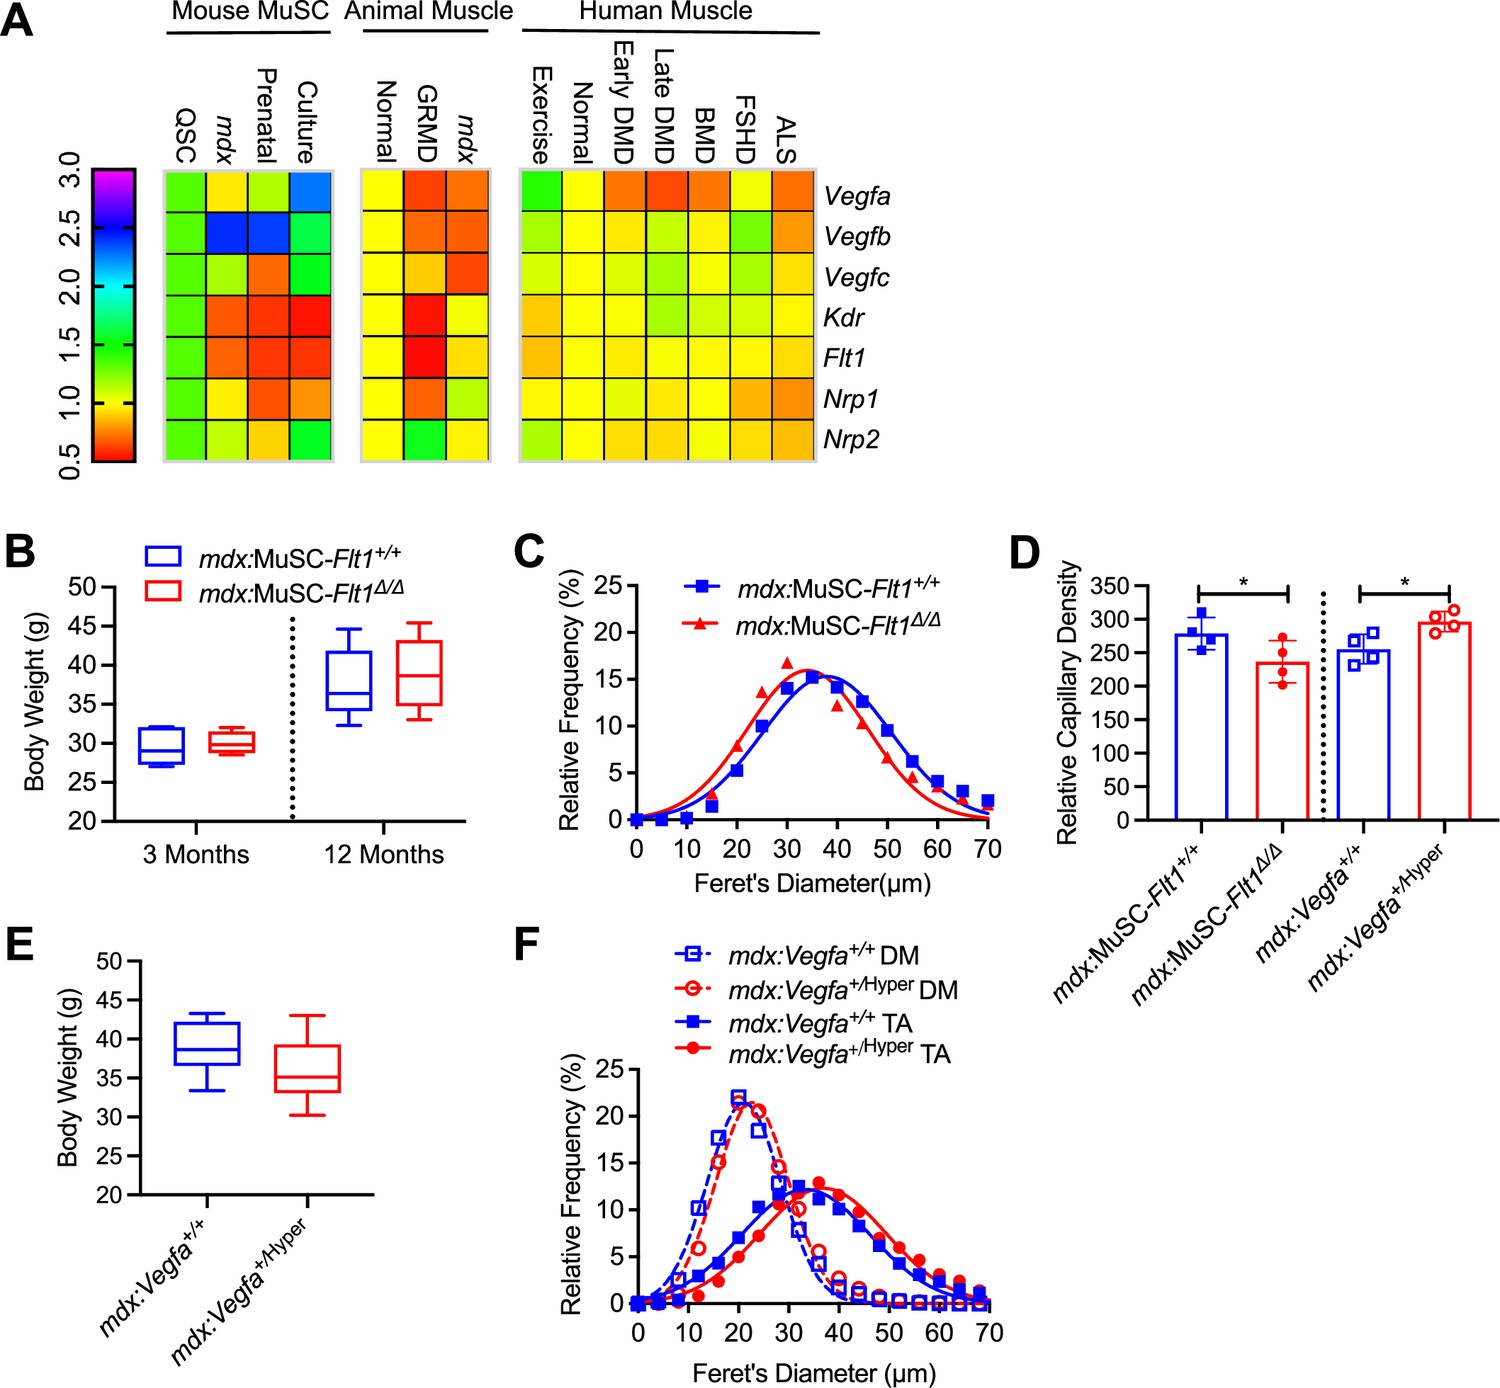
(A) Heatmap of microarray data profiling Vegfa ligands and receptors in mouse MuSC cultures (left), whole muscle in animal models (middle) and huma patient biopsy samples (right). (B) Body mass is preserved in mdx:MuSC-Flt1Δ/Δ compared with the control mdx:MuSC-Flt1+/+ mice at both 3 and 12 months of age. Data show mean ± SD (n=4). (C) Fiber size distribution of mdx:MuSC-Flt1Δ/Δ compared with the control mdx:MuSC-Flt1+/+ mouse TA muscle shows a small decrease in fiber size at 12 months of age. Data show mean ± SD (n=4). (D) CD31(+) capillaries shown in Figure 4B and G are slightly decreased in mdx:MuSC-Flt1Δ/Δ mice but increased in mdx:Vegfa+/Hyper mice compared with the control mdx:MuSC-Flt1+/+ mice or mdx:Vegfa+/+ mice at 12 months of age. Data show mean ± SD (n=4). (E) Body mass is preserved in mdx:Vegfa+/Hyper compared with the control mdx:Vegfa+/+ mice at 12 months of age. Data show mean ± SD (n=3). (F) Fiber size distribution of mdx:Vegfa+/a compared with the control mdx:Vegfa+/+ mice TA and diaphragm (DM) muscle shows a small increase in fiber size at 12 months of age. Data show mean ± SD (n=3).
-
Figure 4—figure supplement 1—source data 1
Measurement of VEGFA-FLT1 pathway in MuSCs for muscle pathology in DMD model mice.
- https://cdn.elifesciences.org/articles/73592/elife-73592-fig4-figsupp1-data1-v2.xlsx
Figure 4—figure supplement 2
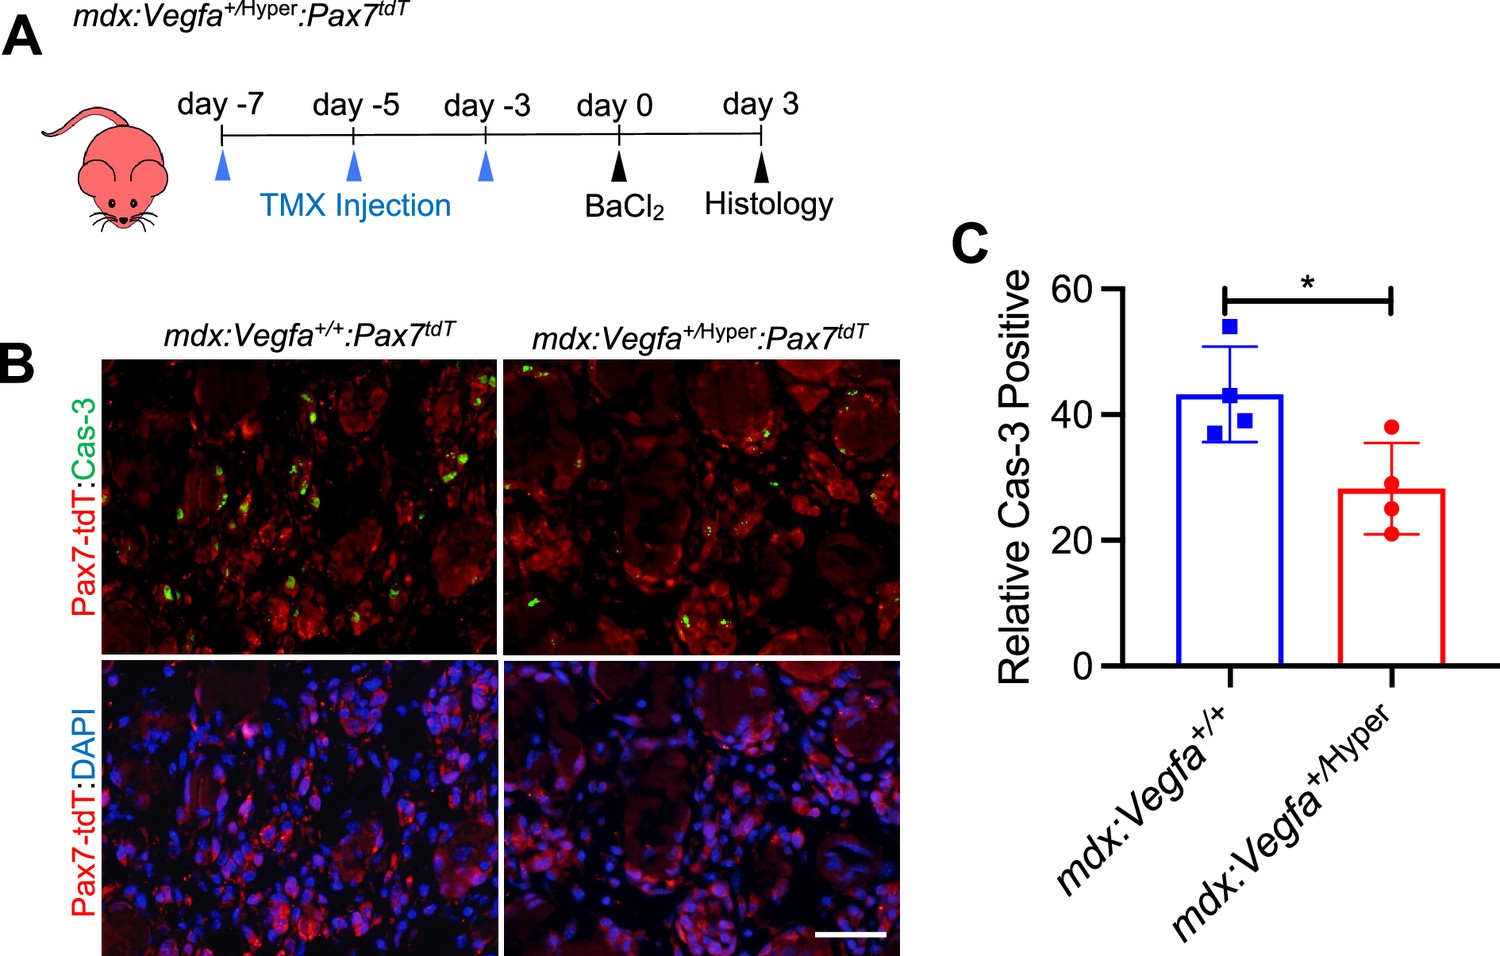
VEGFA-FLT1 pathway in MuSCs regulates apoptotic cell death in DMD model mice.
(A) Experimental schema detailing the experiments performed in this figure. The mdx:Vegf+/Hyper:Pax7tdT was pulsed with TMX to label Pax7-tdTomato(+) MuSCs prior to investigation. Three days following BaCl2 injection, TA muscle was harvested for apoptotic cell death detection. (B) Caspase-3 (+) (Cas-3, green) apoptotic cells in theta muscle of the mdx:Vegfa+/+:Pax7tdT and mdx:Vegfa+/Hyper:Pax7tdT mice. Red and blue staining show Pax7-tdTomato and DAPI staining. Scale bar indicates 25 µm. (C) Caspase-3(+) apoptotic cells were decreased in Pax7-tdTomato(+) MuSCs in the TA muscle of Vegfa+/Hyper:Pax7tdT mice compared with control Vegfa+/+:Pax7tdT mice 3 days following muscle injury. Data show mean ± SD (n=4).
-
Figure 4—figure supplement 2—source data 1
Measurement of apoptotic cell death.
- https://cdn.elifesciences.org/articles/73592/elife-73592-fig4-figsupp2-data1-v2.xlsx
Tables
Appendix 1—key resources table
| Reagent type (species) or resource | Designation | Source or reference | Identifiers | Additional information |
|---|---|---|---|---|
| Strain (Mus musculus) | Flt1LoxP/LoxP | The Jackson Laboratory | JAX: 028098 | Mouse line obtained from Guo-Hua Fong |
| Strain (Mus musculus) | VEGFA+/Hyper | The Jackson Laboratory | JAX: 027314 | |
| Strain (Mus musculus) | Pax7CreERT2/+ | The Jackson Laboratory | JAX: 017763 | |
| Strain (Mus musculus) | mdx5cv | The Jackson Laboratory | JAX: 002379 | |
| Strain (Mus musculus) | Flk1GFP | The Jackson Laboratory | JAX: 017006 | Mouse line obtained from Masatsugu Ema |
| Strain (Mus musculus) | R26RtdT | The Jackson Laboratory | JAX: 007909 | |
| Strain (Mus musculus) | VEGFALoxP/LoxP | Mouse line obtained from Napoleone Ferrara | ||
| Genetic reagent | Lentiviral pCCL-E4ORF1 | PMID:20972423 | Viral vector production | |
| Genetic reagent | Lentiviral pCCL-myrAkt1 | PMID:20972423 | Viral vector production | |
| Genetic reagent | pCMV-VSV-G | Addgene | 8454 | Viral vector production |
| Genetic reagent | pRSV-Rev | Addgene | 12253 | Viral vector production |
| Genetic reagent | pMDLg/pRRE | Addgene | 12251 | Viral vector production |
| Genetic reagent | RNAscope Probe - Mm-Flt1 (C1) | ACDBio | 415541 | RNAscope |
| Cell line (Homo sapiens) | 293 FT | ThermoFisher Scoentific | R70007 | Viral vector production |
| Cell line (Mus musculus) | C2C12 | American Type Culture Collection (ATCC) | CRL-1772 | MuSC line |
| Cell line (Mus musculus) | bEnd.3 | American Type Culture Collection (ATCC) | CRL-2299 | EC line |
| Cell line (Mus musculus) | C166 | American Type Culture Collection (ATCC) | CRL-2581 | EC line |
| Antibody | Anti-CD31-PE (Rat monoclonal) | ThermoFisher Scientific | 12-0311-82; RRID: AB_465632 | 1:200 |
| Antibody | Anti-CD45-PE (Rat monoclonal) | ThermoFisher Scientific | 12-0451-81; RRID: AB_465668 | 1:200 |
| Antibody | Anti-Sca-1-PE (Rat monoclonal) | ThermoFisher Scientific | A18486; RRID: AB_2535332 | 1:200 |
| Antibody | Anti-FLT1 (Mouse monoclonal) | R&D systems | MAB4711; RRID: AB_2107038 | 1:200 |
| Antibody | Anti-FLT1-APC (Rat monoclonal) | R&D systems | FAB4711A; RRID: AB_622149 | 1:200 |
| Antibody | Anti-FLK1 (Rat monoclonal) | BD Biosceinces | 555307; RRID: AB_395720 | 1:200 |
| Antibody | Anti-FLK1-APC (Rat monoclonal) | BD Biosceinces | 560070; RRID: C28AB_1645226 | 1:200 |
| Antibody | Anti-VE-cadherin (Rat monoclonal) | BD Biosciences | 555289; RRID: AB_2244723 | 1:200 |
| Antibody | Anti-NRP1 (Rabbit monoclonal) | Cell Signaling Technology | 3725; RRID:AB_2155231 | 1:200 |
| Antibody | Anti-NRP1-APC (Rat monoclonal) | R&D systems | FAB5994A | 1:200 |
| Antibody | Anti-NRP2 (Rabbit monoclonal) | Cell Signaling Technology | 3366; RRID: AB_2155250 | 1:200 |
| Antibody | Anti-NRP2-APC (Mouse monoclonal) | R&D systems | FAB22151A; RRID: AB_10973479 | 1:200 |
| Antibody | Anti-Sca-1-PE (Rat monoclonal) | eBiosciences | 12-5981-81; RRID: AB_466085 | 1:200 |
| Antibody | Anti-integrin a7-biotin (Mouse monoclonal) | Miltenyi Biotec | 130-101-979; RRID: AB_2652472 | 1:200 |
| Antibody | Anti-IgG-APC (Mouse) | ThermoFisher Scientific | PA5-33237; RRID: AB_2550652 | 1:200 |
| Antibody | Anti-IgG-APC (Rat) | ThermoFisher Scientific | 17-4321-81; RRID: AB_470181 | 1:200 |
| Antibody | Anti-MyHC (Mouse monoclonal) | Developmental Study Hybridoma Bank | MF-20; RRID: AB_2147781 | 1:50 |
| Antibody | Anti-MyoD (Mouse monoclonal) | DAKO | M3512; RRID: AB_2148874 | 1:200 |
| Antibody | Anti-Pax7 (Mouse monoclonal) | Developmental Study Hybridoma Bank | PAX7; RRID: AB_528428 | 1:20 |
| Antibody | Anti-pAKT (Rabbit monoclonal) | Cell Signaling | 4060; RRID: AB_2315049 | 1:500 |
| Antibody | Anti-VEGFA (Rabbit monoclonal) | Abcam | Ab52917; RRID: AB_883427 | 1:500 |
| Antibody | Anti-mouse IgG Alexa488 | ThermoFisher Scientific | A-11001; RRID: AB_2534069 | 1:1000 |
| Antibody | Anti-rat IgG Alexa488 | ThermoFisher Scientific | A-11006; RRID: AB_141373 | 1:1000 |
| Antibody | Anti-rabbit IgG Alexa488 | ThermoFisher Scientific | A-11008; RRID: AB_143165 | 1:1000 |
| Antibody | Anti-rabbit IgG Alexa568 | ThermoFisher Scientific | A-11011; RRID: AB_143157 | 1:1000 |
| Antibody | Anti-mouse IgG Alexa568 | ThermoFisher Scientific | A-11004; RRID: AB_2534072 | 1:1000 |
| Antibody | Anti-rat IgG Alexa568 | ThermoFisher Scientific | A-11077; RRID: AB_2534121 | 1:1000 |
| Antibody | Anti-biotin beads | Miltenyi Biotec | 130-090-485; RRID: AB_244365 | MACS (1:500) |
| Antibody | Anti-PE beads | Miltenyi Biotec | 130-048-801; RRID: AB_244373 | MACS (1:500) |
| Antibody | Anti-Activated Caspase-3 | Abcam | ab214430; RRID: AB_2938798 | 1:200 |
| Antibody | Anti-phosphoAKT1 | Cell Signaling | 4060; RRID: AB_2315049 | 1:200 for IHC, 1:1000 for WB |
| Antibody | Anti-GAPDH HRP conjugated | Cell Signaling | 3683; RRID: AB_1642205 | 1:10000 |
| Antibody | Anti-eMHC (Mouse monoclonal) | Developmental Study Hybridoma Bank | F1.652; RRID: AB_528358 | 1:200 |
| Antibody | Anti-Laminin-2 (Rat monoclonal) | MilliporeSigma | L0663; RRID: AB_477153 | 1:500 |
| Sequence-based reagent (Oligo DNA) | TTAAACGAACGTACTTGCAGATG | Integrated DNA Technologies (IDT) | N/A | qPCR Vegfa 92 bp (Forward) |
| Sequence-based reagent (Oligo DNA) | AGAGGTCTGGTTCCCGAAA | Integrated DNA Technologies (IDT) | N/A | qPCR Vegfa 92 bp (Reverse) |
| Sequence-based reagent (Oligo DNA) | GCAGAGCCAGGAACATATACACA | Integrated DNA Technologies (IDT) | N/A | qPCR mFlt1 103 bp(Forward) |
| Sequence-based reagent (Oligo DNA) | GAGATCCGAGAGAAAATGGCCTTT | Integrated DNA Technologies (IDT) | N/A | qPCR mFlt1 103 bp (Reverse) |
| Sequence-based reagent (Oligo DNA) | GCAGAGCCAGGAACATATACACA | Integrated DNA Technologies (IDT) | N/A | qPCR sFlt1 73 bp (Forward) |
| Sequence-based reagent (Oligo DNA) | CAGTGCTCACCTCTAACG | Integrated DNA Technologies (IDT) | N/A | qPCR sFlt1 73 bp (Reverse) |
| Sequence-based reagent (Oligo DNA) | CAGTGGTACTGGCAGCTAGAAG | Integrated DNA Technologies (IDT) | N/A | qPCR KDR/Flk1 66 bp (Forward) |
| Sequence-based reagent (Oligo DNA) | ACAAGCATACGGGCTTGTTT | Integrated DNA Technologies (IDT) | N/A | qPCR KDR/Flk1 66 bp (Reverse) |
| Sequence-based reagent (Oligo DNA) | TCCTGGGAAACTGGTATATCTATGA | Integrated DNA Technologies (IDT) | N/A | qPCR Nrp1 75 bp (Forward) |
| Sequence-based reagent (Oligo DNA) | CATTCCAGAGCAAGGATAATCTG | Integrated DNA Technologies (IDT) | N/A | qPCR Nrp1 75 bp (Reverse) |
| Sequence-based reagent (Oligo DNA) | ATGGCTGGACACCCAATTT | Integrated DNA Technologies (IDT) | N/A | qPCR Nrp2 67 bp (Forward) |
| Sequence-based reagent (Oligo DNA) | ATGGTTAGGAAGCGCAGGT | Integrated DNA Technologies (IDT) | N/A | qPCR Nrp2 67 bp (Reverse) |
| Sequence-based reagent (Oligo DNA) | CACCTGGAGAGGATGAAGAAGAA | Integrated DNA Technologies (IDT) | N/A | qPCR Myh3 298 bp (Forward) |
| Sequence-based reagent (Oligo DNA) | AAGACTTGACTTTCACTTGGAGTTTA TC | Integrated DNA Technologies (IDT) | N/A | qPCR Myh3 298 bp (Reverse) |
| Sequence-based reagent (Oligo DNA) | TTCGGAAGCTCCTTCTGTTT | Integrated DNA Technologies (IDT) | N/A | qPCR Htatsf1 79 bp (Forward) |
| Sequence-based reagent (Oligo DNA) | CCAGAGTCTGAATACAATGGTCA | Integrated DNA Technologies (IDT) | N/A | qPCR Htatsf1 79 bp (Reverse) |
| Sequence-based reagent (Oligo DNA) | CGCACGGCCGGTACAGTGAAACTG | Integrated DNA Technologies (IDT) | N/A | qPCR 18 S rRNA 343 bp (Forward) |
| Sequence-based reagent (Oligo DNA) | CGCACGGCCGGTACAGTGAAACTG | Integrated DNA Technologies (IDT) | N/A | qPCR 18 S rRNA 343 bp (Reverse) |
| Sequence-based reagent (Oligo DNA) | CTTGCTCACCATGGTCAGCTGCTG | Integrated DNA Technologies (IDT) | N/A | Genotyping Myh3 Exon1 WT/MUT-103bp (Reverse) |
| Sequence-based reagent (Oligo DNA) | CACTTTTAACTTCGACCCTGAGCC | Integrated DNA Technologies (IDT) | N/A | Genotyping Myh3 Exon2 WT/MUT-103bp (Reverse) |
| Sequence-based reagent (Oligo DNA) | GGCCAGACTCTCTTTCTCAAGTGC | Integrated DNA Technologies (IDT) | N/A | Genotyping Myh3 Exon2 WT-135bp (Forward) |
| Sequence-based reagent (Oligo DNA) | GCAGAATTGCCTGTTATCCCTCCC | Integrated DNA Technologies (IDT) | N/A | Genotyping Myh3 Exon3 WT-135bp (Reverse) |
| Sequence-based reagent (Oligo DNA) | GCTGCTGTTGATTACCTGGC | Integrated DNA Technologies (IDT) | N/A | Genotyping Pax7CreERT2 (Common) |
| Sequence-based reagent (Oligo DNA) | CAAAAGACGGCAATATGGTG | Integrated DNA Technologies (IDT) | N/A | Genotying Pax7CreERT2 MUT-235bp (Reverse) |
| Sequence-based reagent (Oligo DNA) | CTGCACTGAGACAGGACCG | Integrated DNA Technologies (IDT) | N/A | Genotying Pax7CreERT2 WT-419bp (Reverse) |
| Sequence-based reagent (Oligo DNA) | GGCATTAAAGCAGCGTATCC | Integrated DNA Technologies (IDT) | N/A | Genotying R26RtdT (9103) MUT-196bp (Forward) |
| Sequence-based reagent (Oligo DNA) | CTGTTCCTGTACGGCATGG | Integrated DNA Technologies (IDT) | N/A | Genotying R26RtdT (9105) MUT-196bp (Reverse) |
| Sequence-based reagent (Oligo DNA) | AAGGGAGCTGCAGTGGAGTA | Integrated DNA Technologies (IDT) | N/A | Genotying R26RtdT (9020) WT-297bp (Forward) |
| Sequence-based reagent (Oligo DNA) | CCGAAAATCTGTGGGAAGTC | Integrated DNA Technologies (IDT) | N/A | Genotying R26RtdT (9021) WT-297bp (Reserve) |
| Sequence-based reagent (Oligo DNA) | AGCAGCACGACTTCTTCAAGTCCG | Integrated DNA Technologies (IDT) | N/A | Genotying Flk1GFP-161bp (Forward) |
| Sequence-based reagent (Oligo DNA) | CTCCTTGAAGTCGATGCCCTTCAG | Integrated DNA Technologies (IDT) | N/A | Genotying Flk1GFP-161bp (Reserve) |
| Sequence-based reagent (Oligo DNA) | CGCTTTTTGTCAGTCATCTTCA | Integrated DNA Technologies (IDT) | N/A | Genotying Flt1Loxp/Loxp (FlpeEX3F) WT-223bp/MUT-641bp (Forward) |
| Sequence-based reagent (Oligo DNA) | GTGCCACTGACCTAACATGTAAGAG | Integrated DNA Technologies (IDT) | N/A | Genotying Flt1Loxp/Loxp (FlpeInt3R) WT-223bp/MUT-641bp (Reverse) |
| Sequence-based reagent (Oligo DNA) | CCA TAG ATG TGA CAA GCC AAG | Integrated DNA Technologies (IDT) | N/A | Genotyping VEGFAHyper (24286) WT-254bp (Forward) |
| Sequence-based reagent (Oligo DNA) | ACC CGG GGA TCC TCT AGA AC | Integrated DNA Technologies (IDT) | N/A | Genotyping VEGFAHyper (25307) MUT-199bp (Forward) |
| Sequence-based reagent (Oligo DNA) | GAC CGT GCT TGG TCA CCT | Integrated DNA Technologies (IDT) | N/A | Genotyping VEGFAHyper (25308, Common) WT-254bp/MUT-199bp (Reverse) |
| Sequence-based reagent (Oligo DNA) | CCTGGCCCTCAAGTACACCTT | Integrated DNA Technologies (IDT) | N/A | VEGFALoxP/LoxP (muVEGF 419 .F) WT-106bp/MUT-148bp (Forward) |
| Sequence-based reagent (Oligo DNA) | TCCGTACGACGCATTTCTAG | Integrated DNA Technologies (IDT) | N/A | VEGFALoxP/LoxP (muVEGF 567 .R) WT-106bp/MUT-148bp (Reverse) |
| Sequence-based reagent (Oligo DNA) | GAAGCTCCCAGAGACAAGTC | Integrated DNA Technologies (IDT) | N/A | mdx5cv (0981) WT/MUT-180bp (Forward) |
| Sequence-based reagent (Oligo DNA) | TCATGAGCATGAAACTGTTCTT | Integrated DNA Technologies (IDT) | N/A | mdx5cv (0981) WT/MUT-180bp (Reverse) |
| Commercial assay or kit | GoTaq qPCR Master Mix | Promega, | A6002 | qPCR |
| Commercial assay or kit | Click-iT EdU Alexa Fluor 488 Imaging Kit | Thermo Scientific | C10337 | EdU staining |
| Commercial assay or kit | Crystal violet Assay Kit | Abcam | ab232855 | Cell viability assay |
| Commercial assay or kit | Transcriptor First Strand cDNA Synthesis Kit | Roche-Sigma-Aldrich | 4379012001 | cDNA synthesis |
| Commercial assay or kit | Annexin V-Biotin Apoptosis Detection Kit | eBioscience | BMS500BT-100 | Appotosis assay |
| Commercial assay or kit | DirectZolTM RNA Microprep Kit | Zymo Research | R2062 | RNA isolation |
| Commercial assay or kit | Midi Fast Ion Plasmid Kit | IBI Scientific | IB47111 | Plasmid DNA isolation |
| Commercial assay or kit | H&E Staining Kit | Abcam | ab245880 | Histology |
| Commercial assay or kit | SuperSignal West Femto chemiluminescent substrate | Fisher Scientific | PI37074 | Western Blotting |
| Commercial assay or kit | NE-PER Nuclear and Cytoplasmic Extraction reagents | Thermo Fisher Scientific | 78833 | Protein extraction |
| Chemical compound, drug | bFGF | Thermo Fisher Scientific | PHG0263 | MuSC culture (20 ng/ml) |
| Chemical compound, drug | Bovine serum albumin (BSA) | Jackson Immuno Research | 10001620 | FACS/Immunostaining (1–2%) |
| Chemical compound, drug | Chicken embryo extract | MP-Biomedical | 92850145 | Single muscle fiber culture (0.5%) |
| Chemical compound, drug | Collagen | BD Biosciences | 354236 | Culture dish coating (0.01%) |
| Chemical compound, drug | Collagenase type I | Sigma-Aldrich | C0130 | Single myofiber isolation (0.2%) |
| Chemical compound, drug | Collagenase type II | Worthington Biochemical Corp | CLD-2 | FACS and MuSC/ES isolation (0.2%) |
| Chemical compound, drug | DAPI (4’,6-diamidino-2-phenylindole dihydrochloride) | Thermo Fisher Scientific | D1306 | DNA staining (1 µg/ml) |
| Chemical compound, drug | Dulbecco’s Modified Eagle’s Medium (DMEM) | Thermo Fisher Scientific | 41966 | Single myofiber and ES culture |
| Chemical compound, drug | EdU | Thermo Fisher Scientific | C10340 | Cell proliferation (1 μM) |
| Chemical compound, drug | F-10 Ham's media | Sigma-Aldrich | N6635 | MuSC culture |
| Chemical compound, drug | Fetal calf serum (FCS) | Atlas Biological | FS-0500-AD | MuSC/EC/Single muscle fiber culture (10% or 20%) |
| Chemical compound, drug | Horse serum | Thermo Fisher Scientific | 26050088 | 2% (coating), 5% (Differentiation culture) |
| Chemical compound, drug | L-glutamine | Thermo Fisher Scientific | 25030 | Culture medium (20 mM) |
| Chemical compound, drug | Matrigel | Corning Life Sciences | 354230 | Single muscle fiber culture (1:20) |
| Chemical compound, drug | Penicillin/streptomycin | Life Technologies | 15140 | Culture medium (1 X) |
| Chemical compound, drug | Tamoxifen (TMX) | Sigma-Aldrich | T5648 | Cre recombinase (60 mg/kg i.p.) |
| Chemical compound, drug | 4-hydroxy tamoxifen (4-OHT) | Sigma-Aldrich | H6278 | Culture (1 µM) |
| Chemical compound, drug | Cardiotoxin (CTX) | Sigma-Aldrich | V9125 | Muscle injury (10 µM) |
| Chemical compound, drug | DraIII | New England Biolabs | R3510S | DNA digestion (500 U/ml) |
| Chemical compound, drug | ZombieNIR | Biolegends | 423105 | FACS (0.1%) |
| Chemical compound, drug | recombinant VEGFA | R&D Systems | 493 MV | Culture (2–100 ng/ml) |
| Chemical compound, drug | Thapsigargin | Sigma-Aldrich | T9033 | Culture (1 µM) |
| Chemical compound, drug | FLT1-FC | R&D Systems | 7756-FL | Culture (100 ng/ml) |
| Chemical compound, drug | ZM306416 | R&D Systems | 2499/1 | Culture (3 µM) |
| Chemical compound, drug | SU5402 | R&D Systems | 3300/1 | Culture (10 µM) |
| Chemical compound, drug | EG00229 | R&D Systems | 6986/10 | Culture (30 µM) |
| Chemical compound, drug | PolyJet transfection reagent | Signagen Laboratories | SL100688 | DNA transfection (10 µl for 6 cm plate) |
| Chemical compound, drug | Polybrene | MilliporeSigma | H9268 | Viral infection (0.8 μg/ml) |
| Chemical compound, drug | Saponin | ThermoFisher Scientific | ICN10285525 | Immunostaining (0.01%) |
| Chemical compound, drug | Direct Red 80 | Sigma-Aldrich | 365548 | Histology (0.1%) |
| Chemical compound, drug | Proteinase K | Sigma-Aldrich | P2308 | DNA isolation (40 µg/mL) |
| Chemical compound, drug | Oil Red O solution | Sigma-Aldrich | O1391-250ML | Histology (0.5%) |
| Chemical compound, drug | Trizol | ThermoFisher Scientific | 15596026 | RNA isolation |
| Software, algorithm | Photoshop 2020 | Adobe | https://www.adobe.com/products/photoshop.html | Imaging analysis |
| Software, algorithm | Fiji | NIH | https://imagej.net/software/fiji/ | Imaging analysis |
| Software, algorithm | cellSens Entry 1.11 | Olympus | https://www.olympus-lifescience.com/en/software/cellsens/ | Microscopy |
| Software, algorithm | Prism 9 | GraphPad | https://www.graphpad.com/support/faq/prism-900-release-notes/ | Data analysis and statistics |
| Software, algorithm | RStudio | RStudio | https://www.rstudio.com | Data analysis and statistics |
| Software, algorithm | Autodesk Graphic | Autodesk | https://www.graphic.com | Vector design |
| Software, algorithm | BioRender: Scientific Image and Illustration Software | BioRender.com | https://www.biorender.com | Illustrator |
| Other | Anti-biotin beads | Miltenyi Biotec | 130-090-485; RRID:AB_244365 | MACS |
| Other | Anti-PE beads | Miltenyi Biotec | 130-048-801; RRID:AB_244373 | MACS |
| Other | Cell culture plate, 24 well | Sarstedt | 83.3922 | Single myofiber culture |
| Other | Tissue culture dish | Sarstedt | 83.39 | MuSC/ES culture |
| Other | Tissue culture dish | Sarstedt | 83.3901 | MuSC/ES culture |
| Other | Tissue culture dish | Sarstedt | 83.3902 | MuSC/ES culture |
| Other | LD column | Miltenyi Biotec | 130-042-901 | MACS |
| Other | MS column | Miltenyi Biotec | 130-042-201 | MACS |
| Other | Fortessa X-20 | BD Biosciences | FACS | |
| Other | BD FACSAria | BD Biosciences | FACS | |
| Other | moorLabTM laser Doppler | Moor Instruments | MOORVMS-LDF | Laser Doppler flow |
| Other | Grip strength meter | Columbus Instruments | 1027CSM-D54 | Forelimb muscle force |
| Other | iBright FL1500 | ThermoFisher Scientific | A44115 | Western blotting |
| Other | Olympus IX81 Inverted Fluorescense microscope | Olympus | Microscope | |
| Other | Olympus BX51 Fluorescense microscope | Olympus | Microscope |
Additional files
-
Transparent reporting form
- https://cdn.elifesciences.org/articles/73592/elife-73592-transrepform1-v2.pdf
-
Supplementary file 1
Gene Expression Omnibus (GEO) used for this paper was shown in this table, including their repositories and references.
- https://cdn.elifesciences.org/articles/73592/elife-73592-supp1-v2.docx
Download links
A two-part list of links to download the article, or parts of the article, in various formats.
Downloads (link to download the article as PDF)
Open citations (links to open the citations from this article in various online reference manager services)
Cite this article (links to download the citations from this article in formats compatible with various reference manager tools)
Endothelial cell signature in muscle stem cells validated by VEGFA-FLT1-AKT1 axis promoting survival of muscle stem cell
eLife 13:e73592.
https://doi.org/10.7554/eLife.73592


