Enhanced specificity mutations perturb allosteric signaling in CRISPR-Cas9
- Department of Bioengineering and Department of Chemistry, University of California, Riverside, United States
- Department of Molecular Biology, Cell Biology and Biochemistry, Brown University, United States
- International Centre for Theoretical Physics, Italy
- Department of Chemistry, Yale University, United States
Figures
Figure 1 with 2 supplements

Architecture of the Cas9 endonuclease (center, PDB: 5F9R) (Jiang et al., 2016) highlighting its protein domains as follows: HNH (green), RuvC (light blue), PAM-interacting (PI, orange), and recognition lobe (REC, gray).
A portion of the RNA:DNA hybrid behind HNH has been removed for clarity. Close-up view (left): the previously defined allosteric pathway spanning the HNH domain is shown (pink) and the locations of the three specificity enhancement K–to–A mutation sites are labeled (East et al., 2020a). Close-up view (right): 1H-15N HSQC NMR spectra of K810A (red), K848A (green), and K855A (blue) overlaid with that of wild-type (WT) HNH (black). Selected areas of strong chemical shift perturbation are circled on the spectra (Figure 1—figure supplements 1 and 2).
Figure 1—figure supplement 1
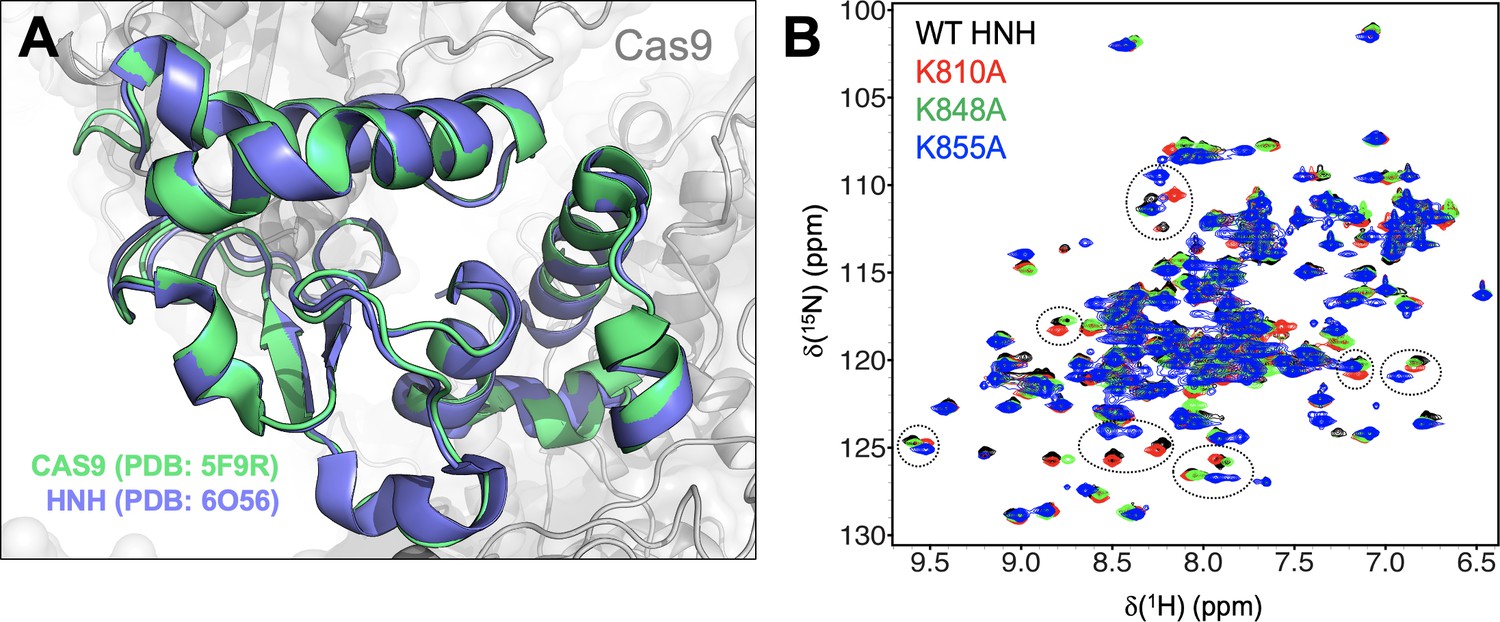
Structure of the HNH domain.
(A) The structure of the HNH domain (residues 775–908) crystallized within the full-length Cas9 (PDB: 5F9R, green) (Jiang and Doudna, 2017) is superposed on the X-ray structure of the HNH construct (PDB: 6O56, blue).(East et al., 2020a). The two structures display a root mean square deviation (RMSD) difference for the C⍺ below 1 Å (i.e., 0.92 Å). (B) NMR spectra of the wild-type (WT) HNH domain and its mutants. The 1H-15N HSQC NMR spectra of K810A (red), K848A (green), and K855A (blue) are overlaid with that of WT HNH (black). Selected areas of strong chemical shift perturbation are circled on the spectra.
Figure 1—figure supplement 2
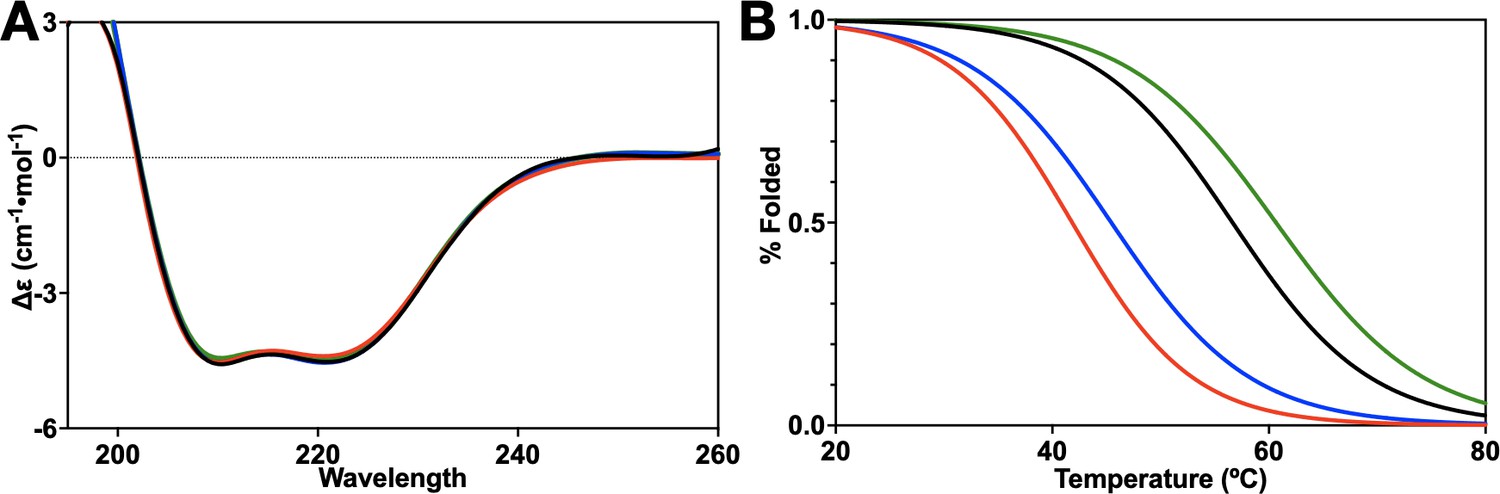
Circular dichroism of HNH mutants.
(A) The CD spectrum from 195 to 260 nm of wild-type (WT) HNH (black), K855A (red), K810A (blue), and K848A (green) showing that all three mutants are similar to the WT spectrum with significant alpha-helical character. (B) CD melting curves of WT HNH (black), K855A (red), K810A (blue), and K848A (green). K855A (46.5°C) and K810A (51.4°C) have a lower melting point than K848A (60.6°C) and the WT (56.6°C). Importantly, all systems are >95% folded at the temperature of the experiments (25°C).
Figure 2 with 1 supplement
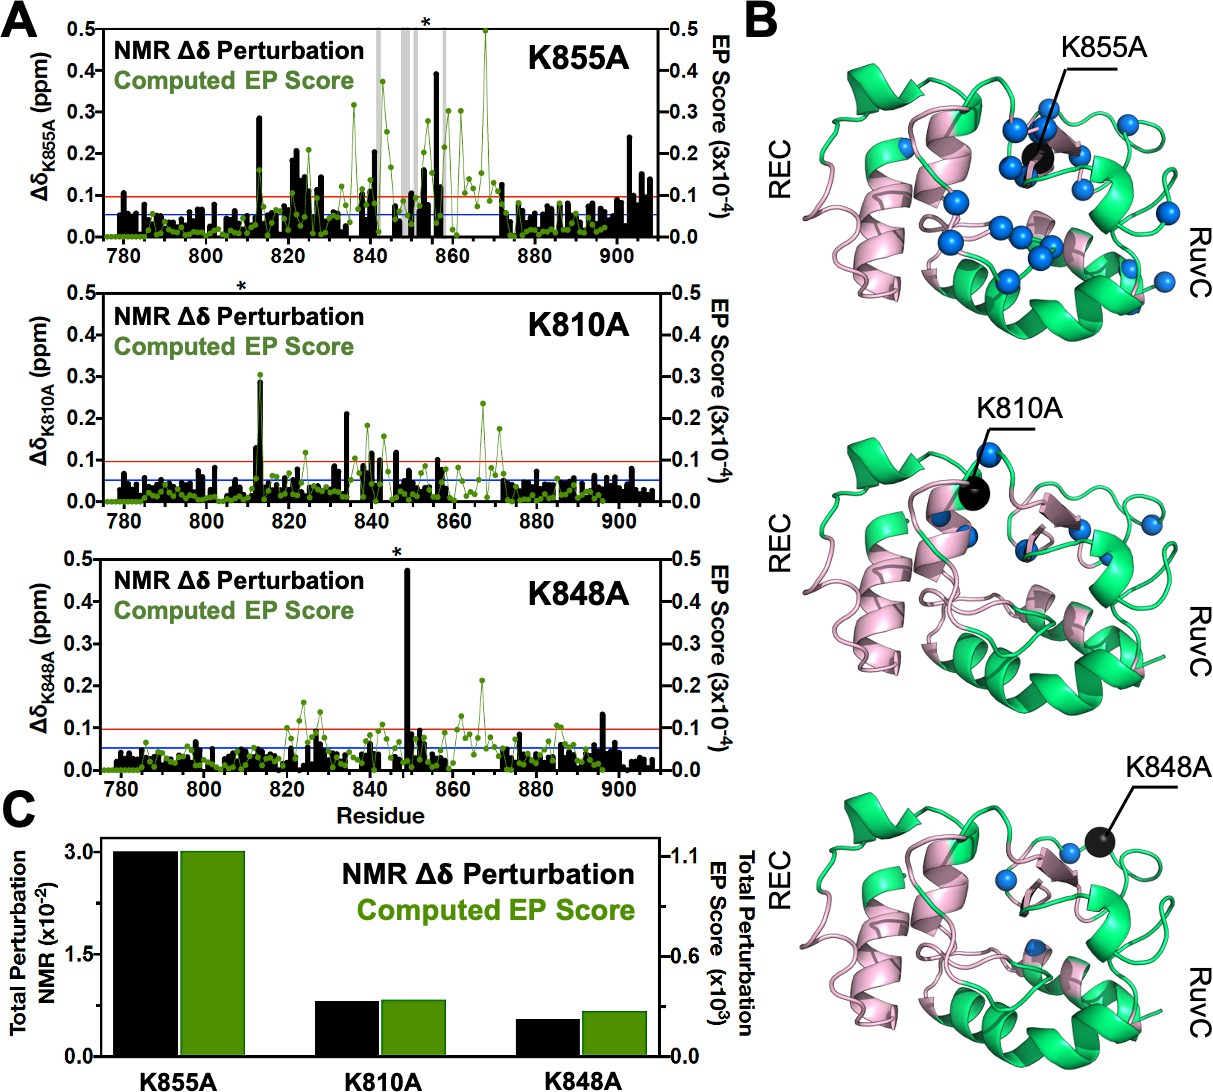
Environmental perturbations (EP) caused by the K855A, K810A, and K848A mutations in HNH.
(A) The NMR composite chemical shifts (black bars) determined by are reported for each mutant. Blue lines are the 10% trimmed mean of all shifts and red lines represent 1.5σ above the 10% trimmed mean. Sites of severe line broadening are represented by light gray bars. The site of mutation is indicated using an asterisk (*) above each plot. The EP scores computed for the isolated HNH domain from molecular dynamics (MD) simulations are shown using a green line. Blue and red lines from chemical shift analysis also represent the mean (+1σ) of the EP score data (right y-axis). (B) Residues with composite chemical shifts above the significance cutoff (blue spheres) are plotted onto the crystal structure of the HNH domain (green). The wild-type (WT) HNH allosteric pathway is also shown (pink). (C) Total chemical shift and EP (black and green bars, respectively) obtained as the sum of the NMR chemical shift perturbations and of the EP scores, respectively, for the isolated HNH domain (Figure 2—figure supplement 1).
Figure 2—figure supplement 1
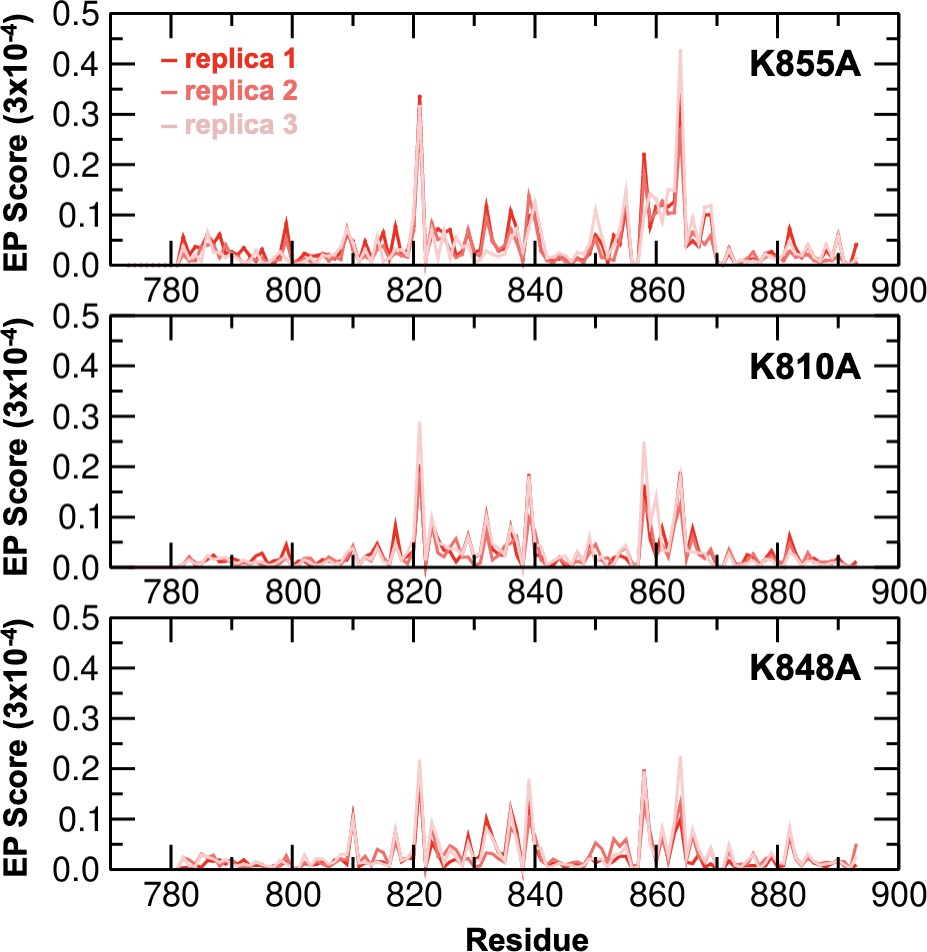
Environmental perturbations (EP) caused by the K855A, K810A, and K848A mutations in HNH.
The EP scores have been computed for the HNH domain (residues 775–908) in the full-length CRISPR-Cas9. Data are reported for three simulation replicas for each system. The site of mutation is indicated using an asterisk (*) above each plot.
Figure 3 with 4 supplements
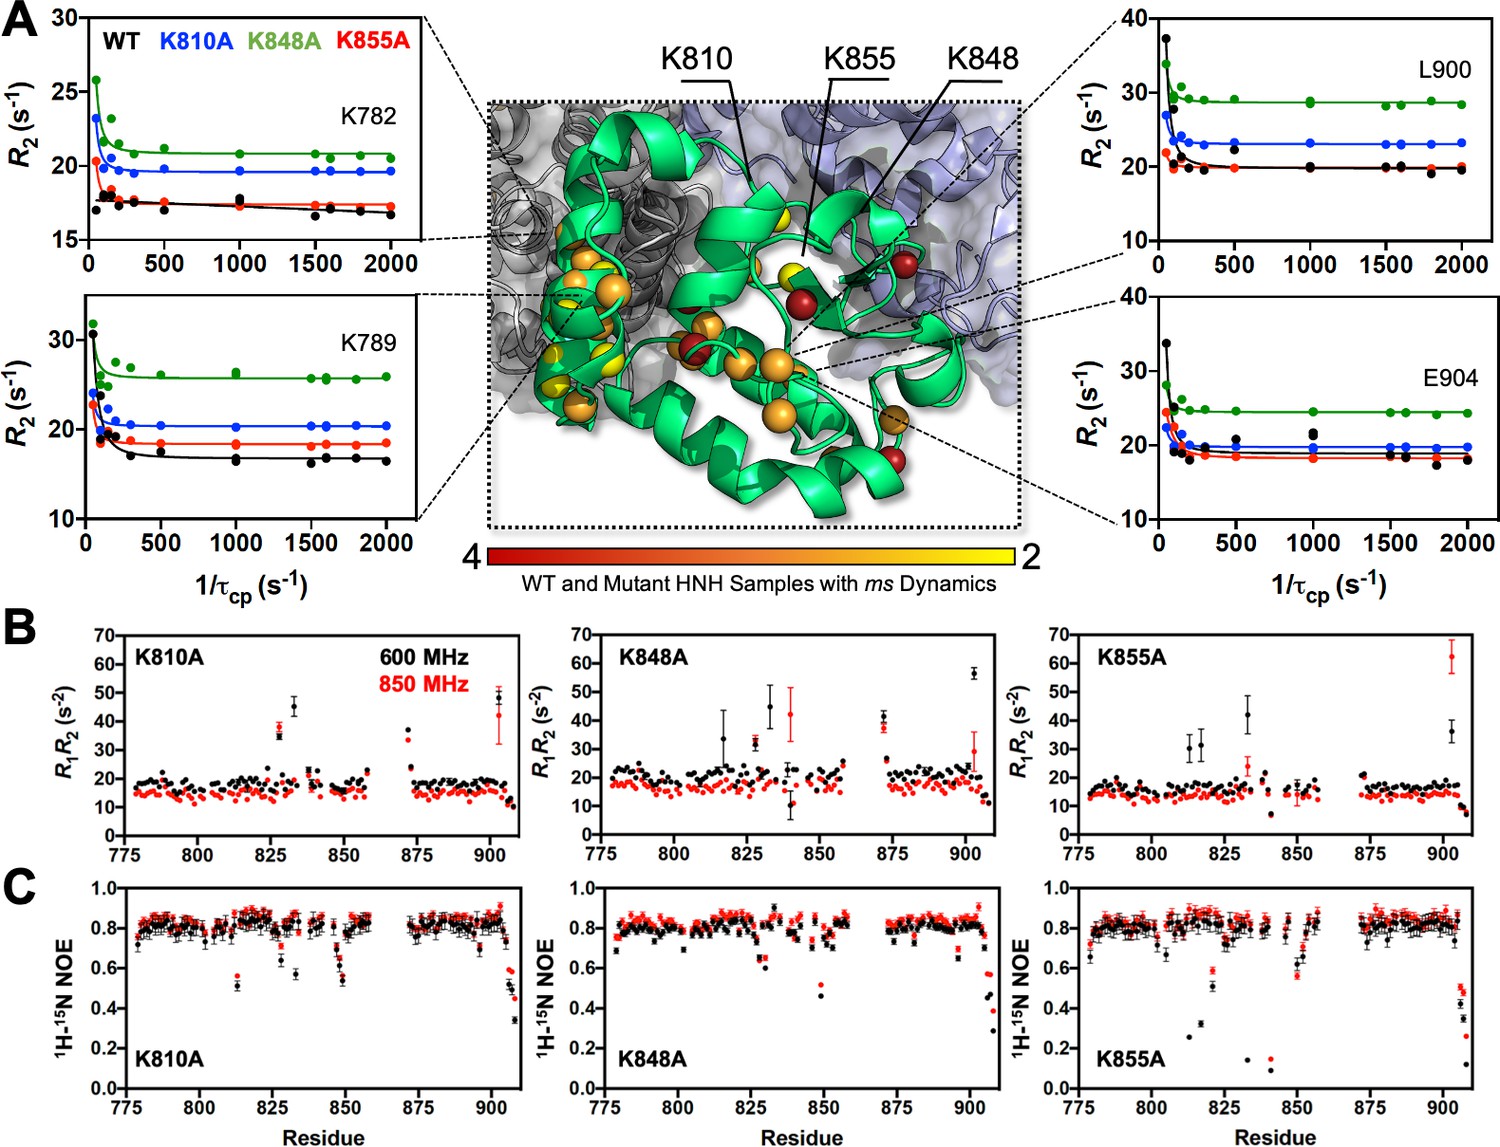
Dynamic properties of HNH and its mutants.
(A) Structure of the HNH domain showing μs-ms timescale dynamics preserved following three K–to–A mutations (central panel). Spheres represent sites of Carr-Purcell-Meiboom-Gill (CPMG) relaxation dispersion that appear in the wild-type (WT) HNH and at least one other specificity enhancement variant. These sites preserve the dynamics upon mutations and are color-coded from red (highly preserved dynamics) to yellow (moderately, yet still preserved dynamics). Close-up views of representative CPMG relaxation dispersion profiles for WT (black), K810A (blue), K848A (green), and K855A (red) HNH are shown for various residues in this cluster. (B) Plots of the relaxation rate product, R1R2 for HNH mutants collected at 600 (black) and 850 (red) MHz. (C) Plots of the 1H-[15N] heteronuclear nuclear overhouser effect (NOE) for HNH mutants collected at 600 (black) and 850 (red) MHz (Figure 3—figure supplements 1–4).
Figure 3—figure supplement 1

Dynamic properties of the HNH mutants.
(A) Sites of ms timescale dynamics (magenta spheres) observed through Carr-Purcell-Meiboom-Gill (CPMG) relaxation dispersion (Loria et al., 1999) studies of the K855A, K810A, and K848A mutants are shown on the 3D structure of the HNH domain (green). The HNH domain is shown on side view (top panels) and top view (bottom panels). The wild-type (WT) allosteric pathway (pink ribbons), previously identified through μs-length molecular dynamics (MD) and CPMG relaxation dispersion (East et al., 2020a), is shown for reference. The K855A, K810A, and K848A mutation sites are shown using black spheres. CPMG relaxation dispersion on the three variants detects μs-ms motions in numerous residues comprising the WT pathway, indicating the retention of the dynamics of the WT pathway previously observed (East et al., 2020a). (B) Representative CPMG relaxation dispersion profiles for WT (black), K810A (blue), K848A (green), and K855A (red) HNH are shown for selected residues (see also Figure 3). The consistently elevated CPMG profiles for the K848A mutant are referred to the elevated overall relaxation rate for that sample. Overall, the K–to–A mutations do not strongly alter the dynamics of the residues composing the WT allosteric pathway.
Figure 3—figure supplement 2
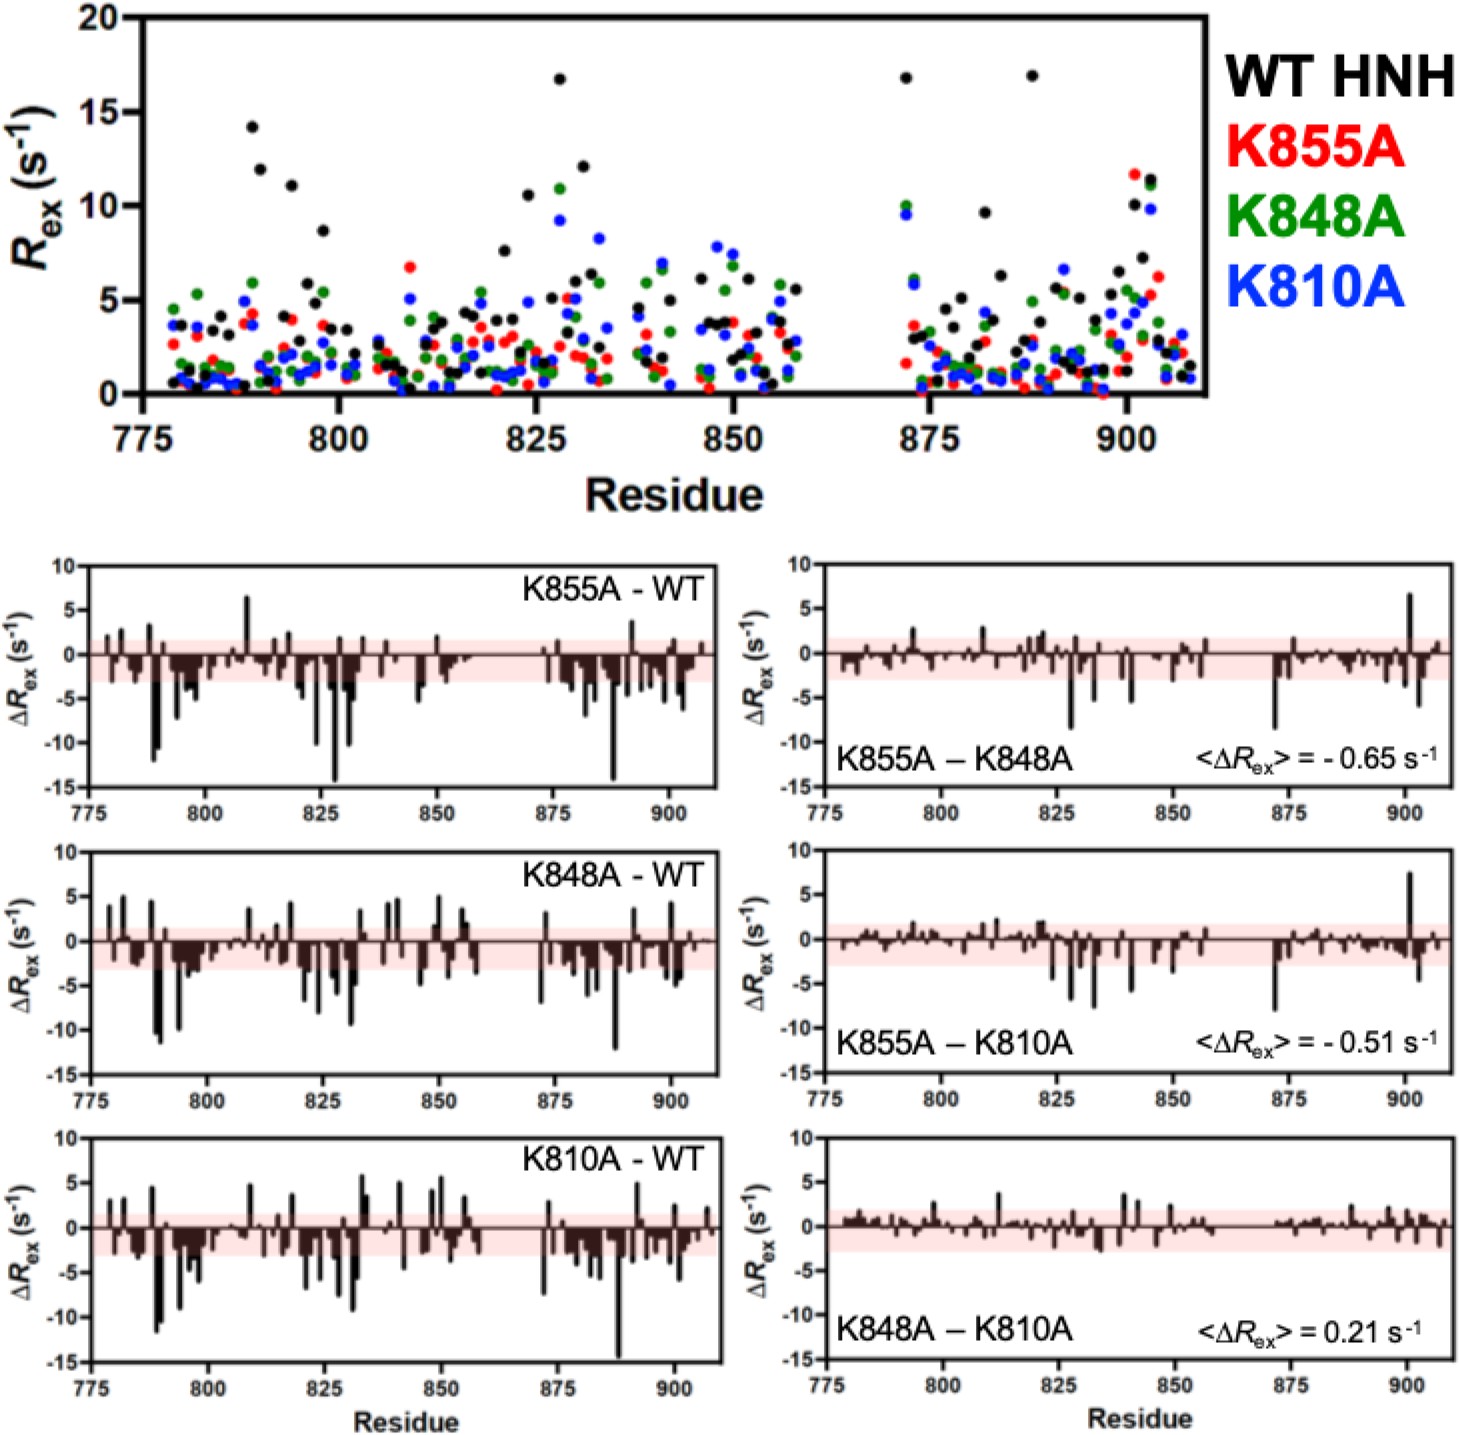
Per-residue Rex determined from Carr-Purcell-Meiboom-Gill (CPMG) relaxation dispersion NMR experiments for wild-type (WT) (black), K855A (red), K848A (green), and K810A (blue) HNH.
Lower panels denote the Rex differences (ΔRex) for each K-to-A mutant from WT HNH (left) and the mutants against each other (right). The average Rex is shown for the mutant comparisons, demonstrating very little difference between the three samples. Red shaded areas denote 1.5σ from the 10% trimmed mean of all Rex values, and serves as a significance cutoff.
Figure 3—figure supplement 3
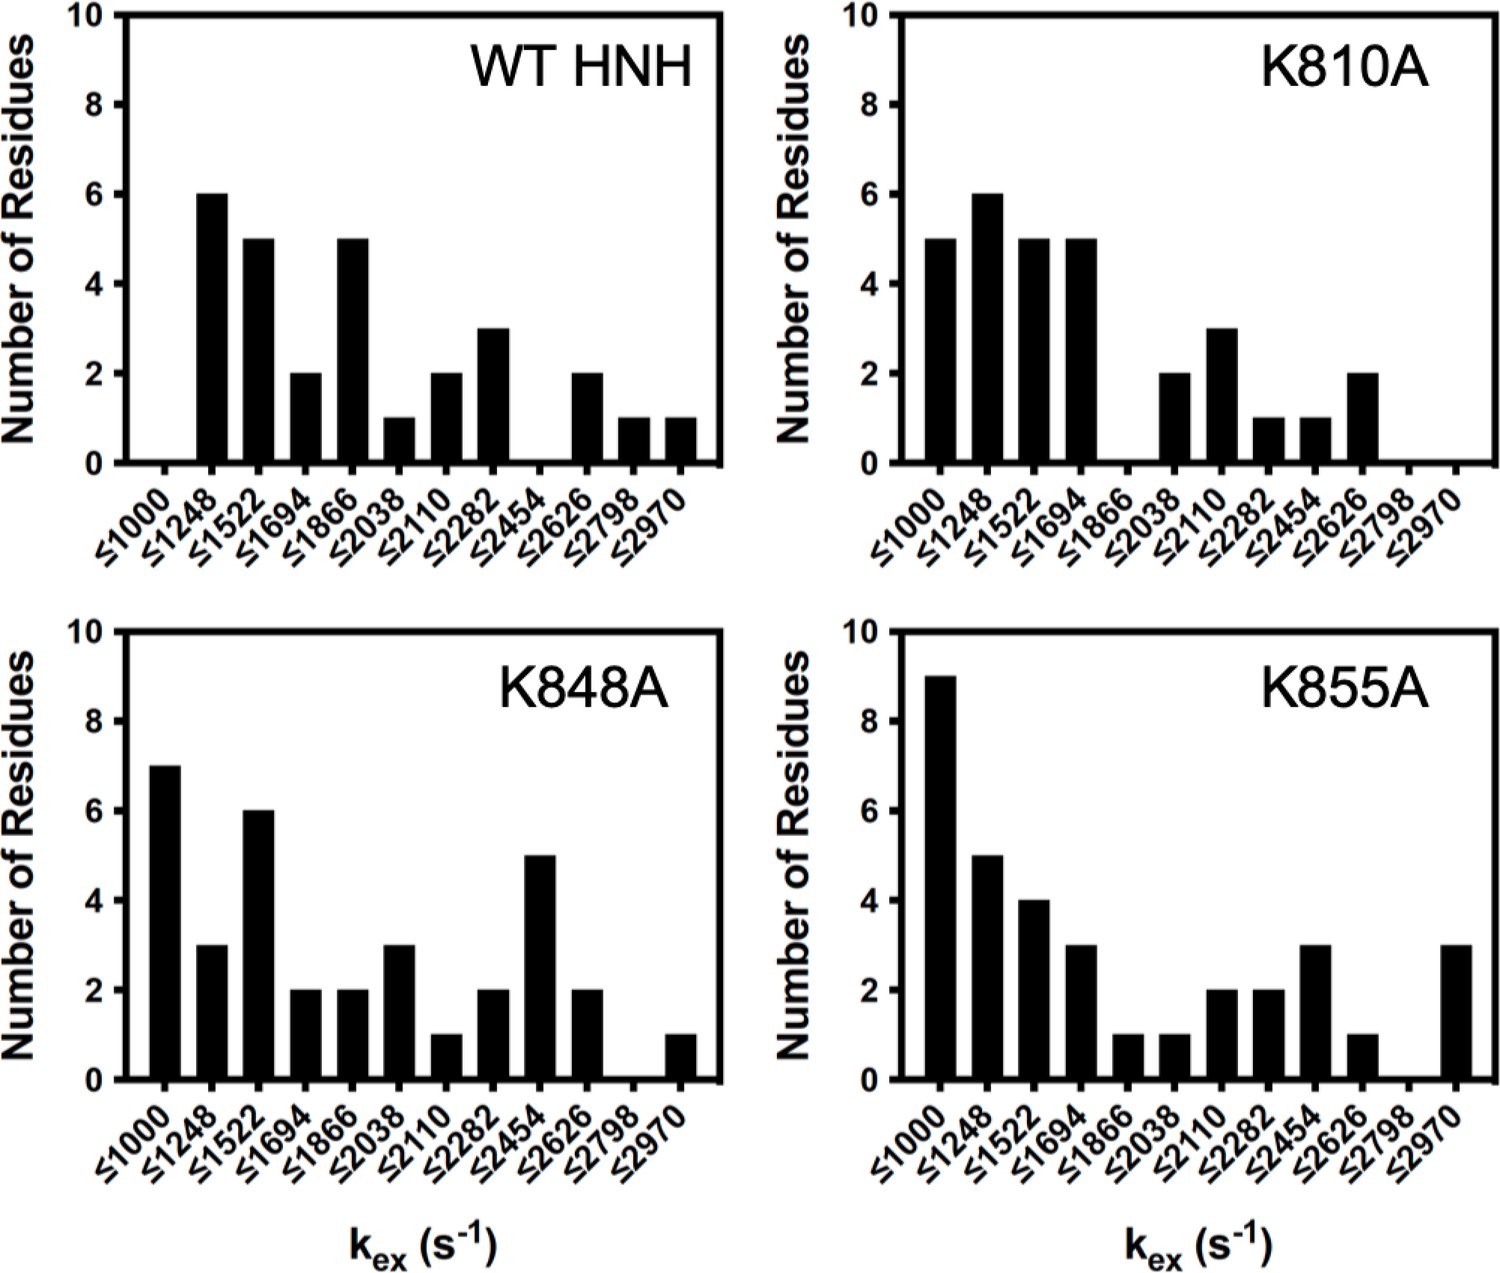
Distribution of kex values determined from Carr-Purcell-Meiboom-Gill (CPMG) relaxation dispersion for wild-type (WT) HNH and specificity-enhancing mutants.
K-to-A mutants skew the kex distribution toward slower values, with bin sizing determined with a protocol described by Scott in Biometrika, 1979, 66, 605. Data for WT HNH was previously reported in J. Am. Chem. Soc. 2020, 142, 1348–1358 (East et al., 2020a).
Figure 3—figure supplement 4
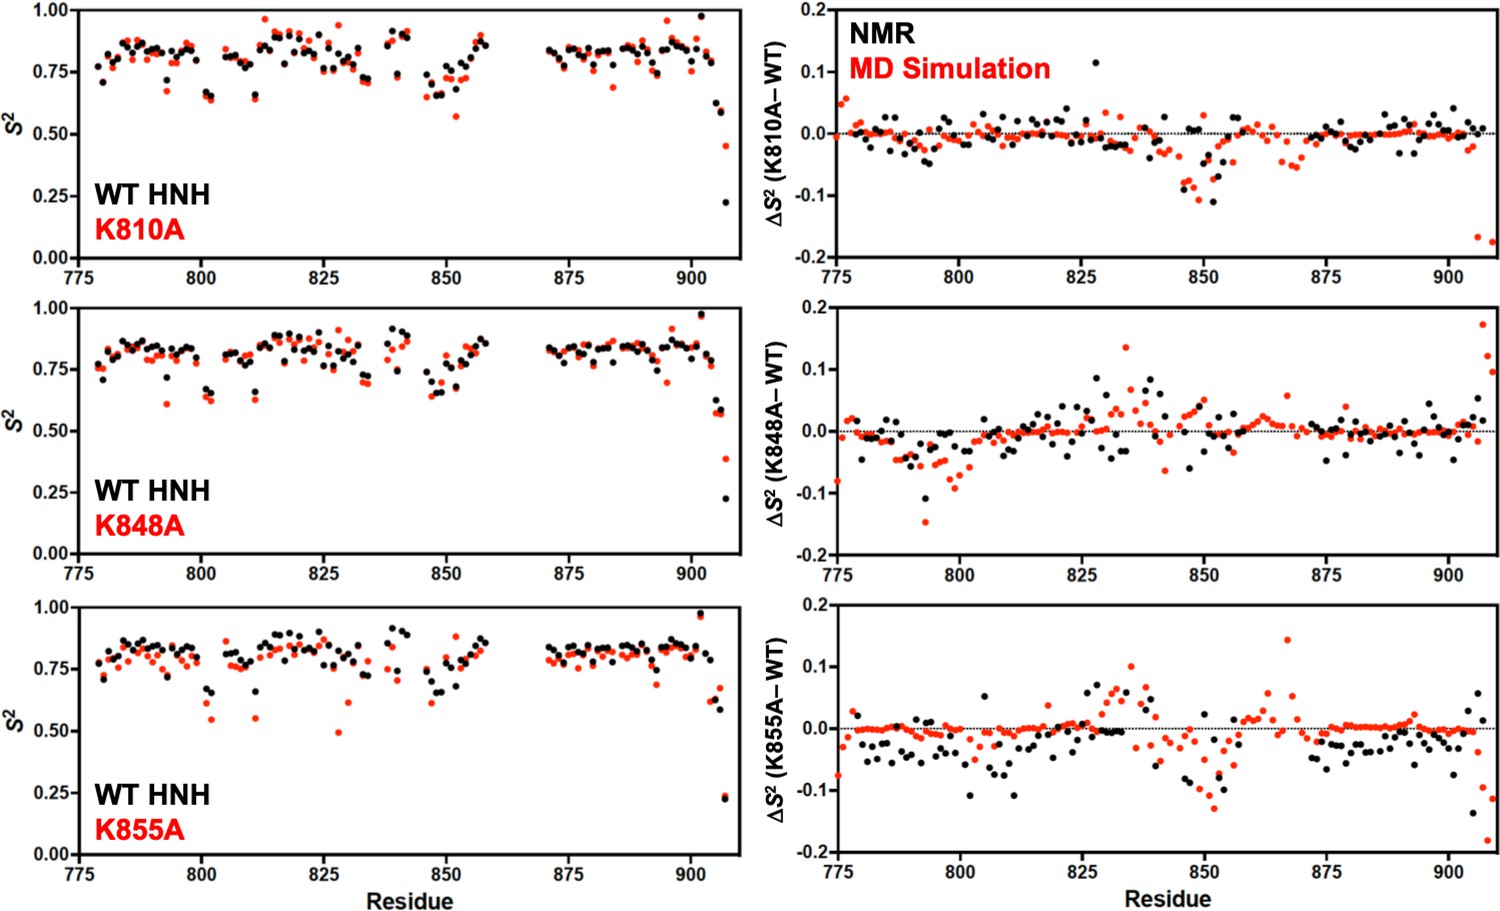
Order parameters (S2) derived from model-free analysis of T1, T2, and 1H-[15N] nuclear overhouser effect (NOE) experiments.
Panels on the left show the per-residue S2 for K-to-A mutants (red) compared to wild-type (WT) HNH (black). Panels on the right show the change in order parameter (ΔS2 ) for each K-to-A mutant relative to WT determined experimentally by NMR (black) or molecular dynamics (MD) simulations (red).
Figure 4 with 1 supplement
Alterations of the allosteric signaling in full-length CRISPR-Cas9 (clustered regularly interspaced short palindromic repeat and associated Cas9 protein) systems.
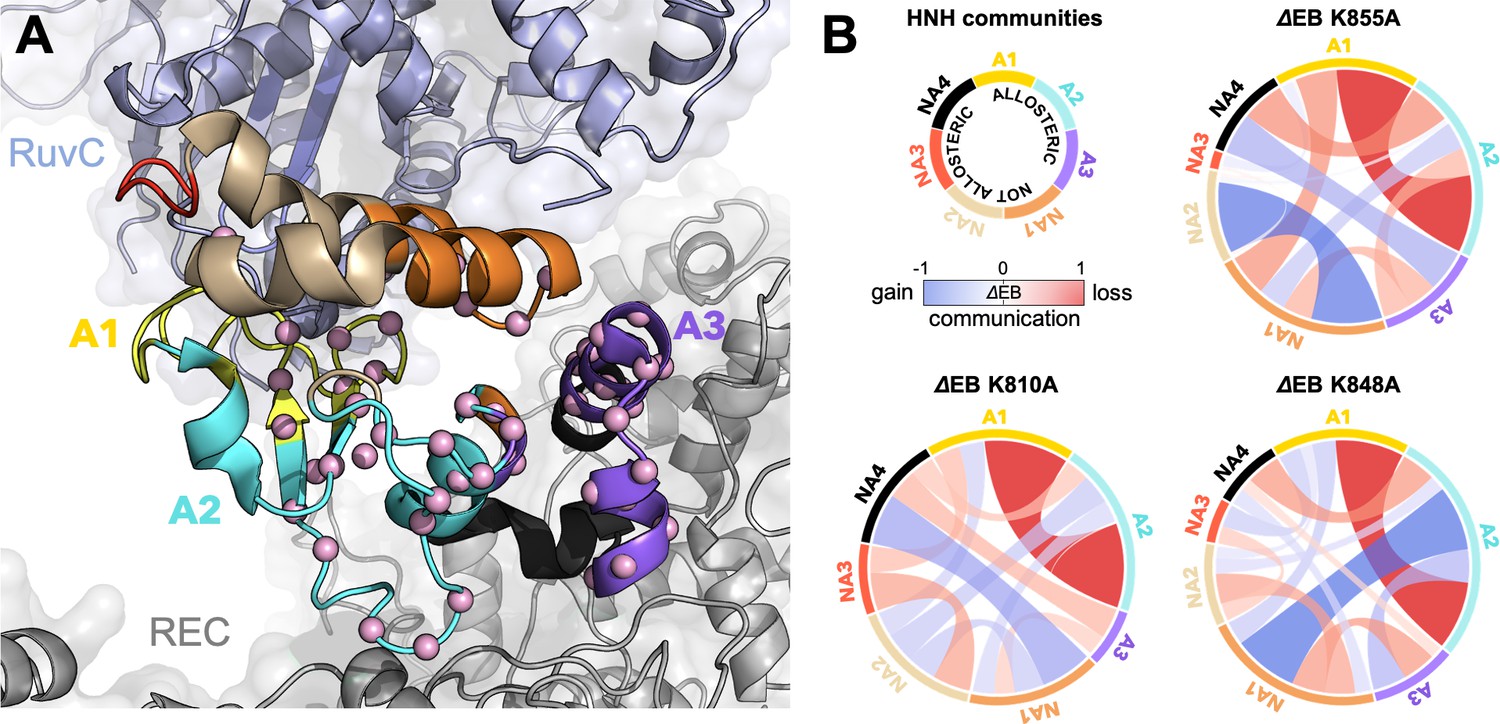
(A) Close-up view of the HNH domain within the wild-type (WT) full-length Cas9, showing seven communities of synchronized dynamics, indicated using different colors. Three communities are allosteric (A1 yellow, A2 cyan, and A3 purple), since they hold most of the residues that compose the allosteric pathway (shown as spheres). The non-allosteric communities (NA1 orange, NA2 tan, NA3 red, NA4 black) include only a few allosteric residues. (B) Circular networks reporting the mutation-induced edge betweenness change (ΔEB), a measure of communication gain or loss between couples of communities upon mutation. For each of the K855A, K810A, and K848A mutants, the HNH communities are displayed in a circle and are connected by links with thickness proportional to ΔEB (border sizes also correspond to the ΔEB of the specific community). Negative ΔEB (red) represents loss of communication, positive ΔEB (blue) indicates communication gain upon mutation (Figure 4—figure supplement 1).
Figure 4—figure supplement 1
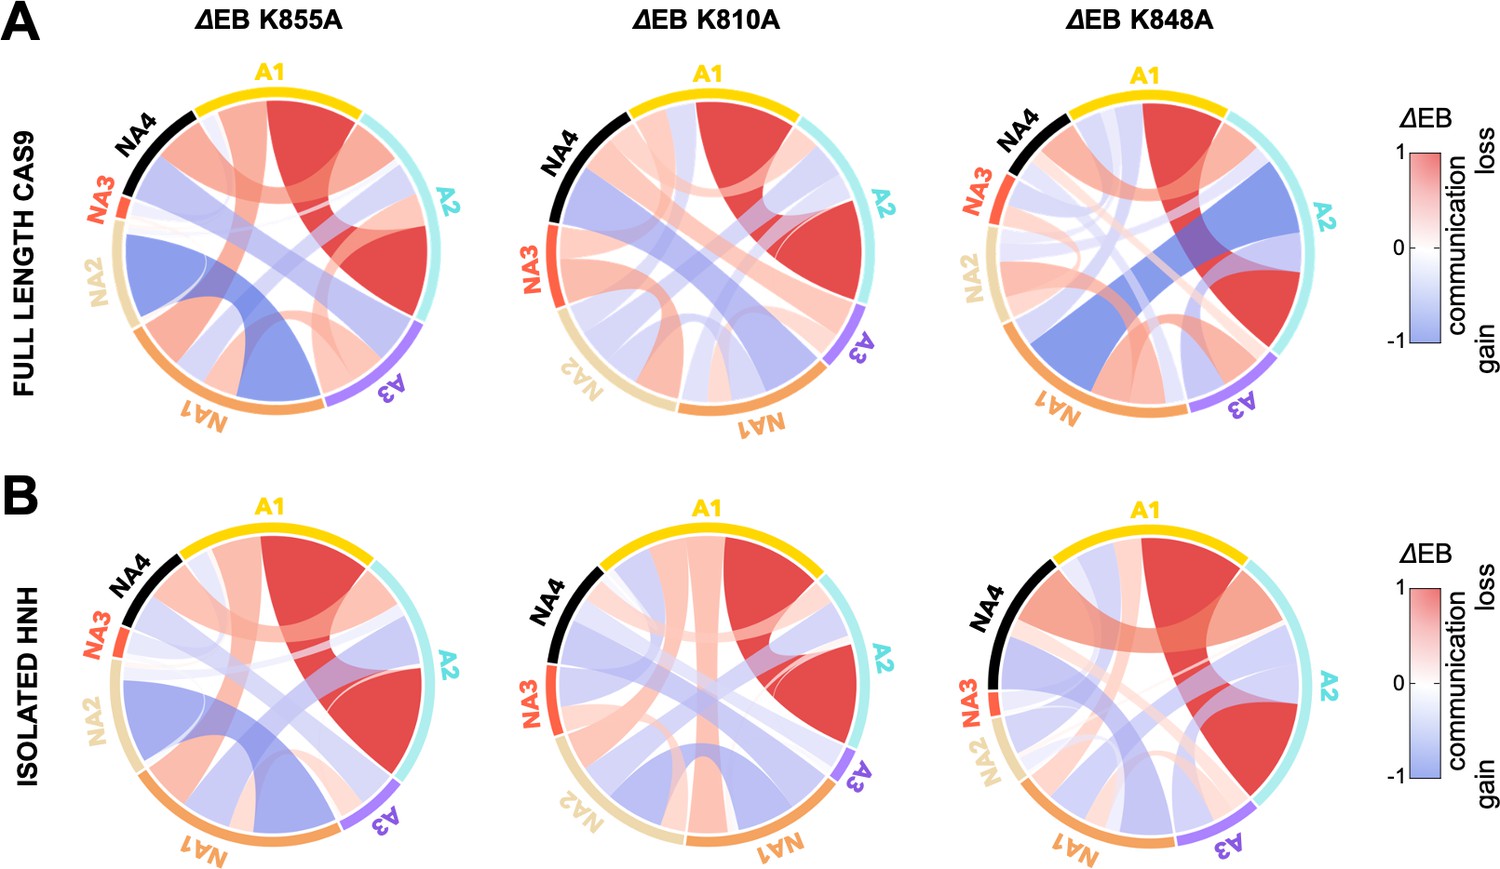
Circular graphs reporting the mutation-induced edge betweenness change (ΔEB) for the K855A, K810A, and K848A mutants in the HNH domain in the full-length Cas9 (A) and in its isolated form (B).
Data are reported upon averaging three replicas (see Appendix 1—figures 6 and 7). In these circular graphs, the HNH communities are disposed in a circle and are connected by links, whose thickness is proportional to ΔEB (border sizes also correspond to the ΔEB for the specific community). Data are normalized from –1 to 1, where negative ΔEB (red) represents loss of communication, and positive ΔEB (blue) indicates communication gain upon mutation (details on the ΔEB calculation are reported in the SI text). The ΔEB for the three mutants displays a similar trend in the full-length Cas9 and isolated HNH.
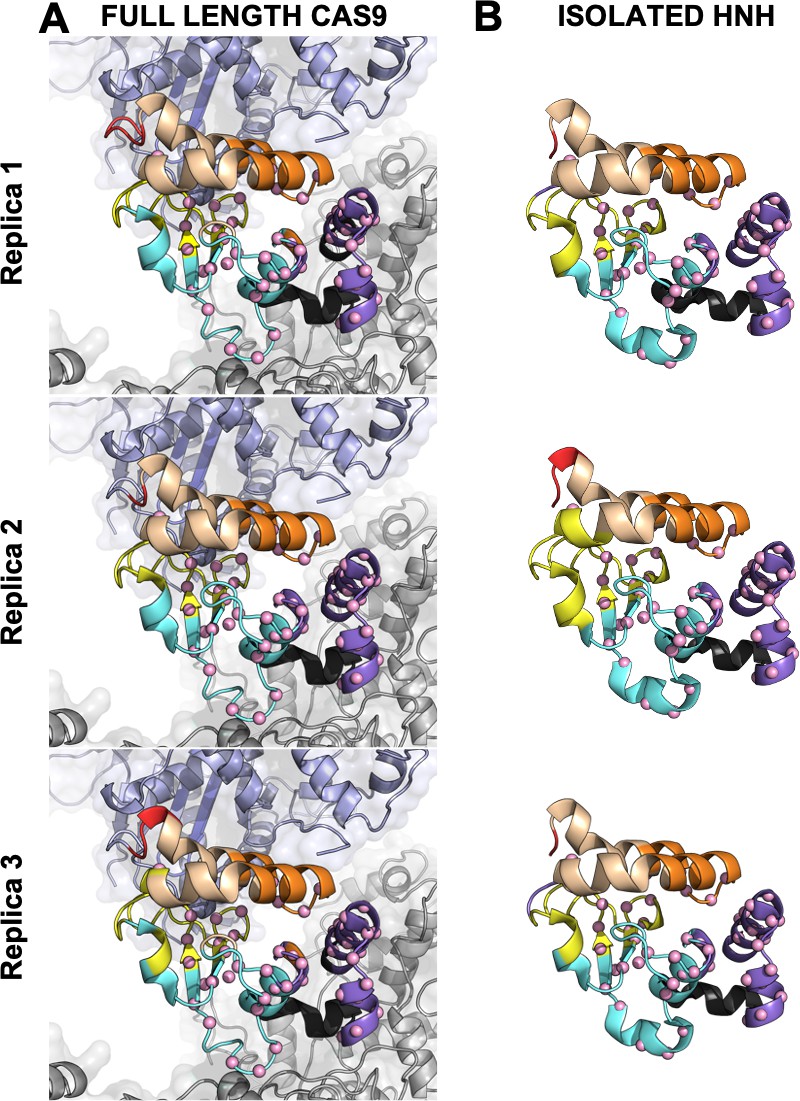
Figure 5 with 1 supplement
Residues exchanging between dynamic communities of the wild-type (WT) HNH domain and its mutants in full-length CRISPR-Cas9 (clustered regularly interspaced short palindromic repeat and associated Cas9 protein).
The HNH communities identified through computational analysis are used as a reference, while the dynamic exchange among them is based on the number of residues displaying Carr-Purcell-Meiboom-Gill (CPMG) relaxation dispersion. The allosteric communities (A1–A3) hold most of the residues that compose the WT allosteric pathway, while the non-allosteric communities (NA1–NA4) include only a few allosteric residues. Bond thickness reflects a normalized measure of residues with μs-ms motions exchanging between communities, where thicker lines indicate that a greater number of CPMG-detectable dynamics (details are in the Materials and methods section)(Figure 5—figure supplement 1).
Figure 5—figure supplement 1
Residues exchanging between dynamic communities of the wild-type (WT) HNH domain and its mutants in the full-length CRISPR-Cas9 (clustered regularly interspaced short palindromic repeat and associated Cas9 protein) system (A) and in the isolated HNH domain (B).
The HNH communities identified through computational analysis are used as a reference, while the dynamic exchange among them is based on the number of residues displaying Carr-Purcell-Meiboom-Gill (CPMG) relaxation dispersion (Supplementary file 1). The allosteric communities (A1–A3) hold most of the residues that compose the allosteric pathway, while the non-allosteric communities (NA1–NA4) include a few allosteric residues. The thickness between communities reflects a normalized measure of the number of CPMG residues exchanging between communities, where thicker lines indicate that a greater number of residues exchange between communities (details are reported in the Materials and methods section).
Figure 6

Critical allosteric hotspots of signal transmission through the HNH domain of CRISPR-Cas9 (clustered regularly interspaced short palindromic repeat and associated Cas9 protein).
(A) Circular graph showing that allosteric sites of HNH (A1–A3) display a loss in communication (red bond) upon alanine mutation of K855, K810, and K848, while the non-allosteric sites (NA1–NA4) gain communication (blue bond). The three K-to-A mutations mainly disrupt the communication between A1 and A2, suggesting that these communities could be critical allosteric hotspots for the signal transmission. (B) The A1–A2 allosteric hotspots are shown on the 3D structure of HNH in CRISPR-Cas9 and indicated using an asterisk (*). Residues comprising the allosteric communities A1–A3 are reported.
Figure 7
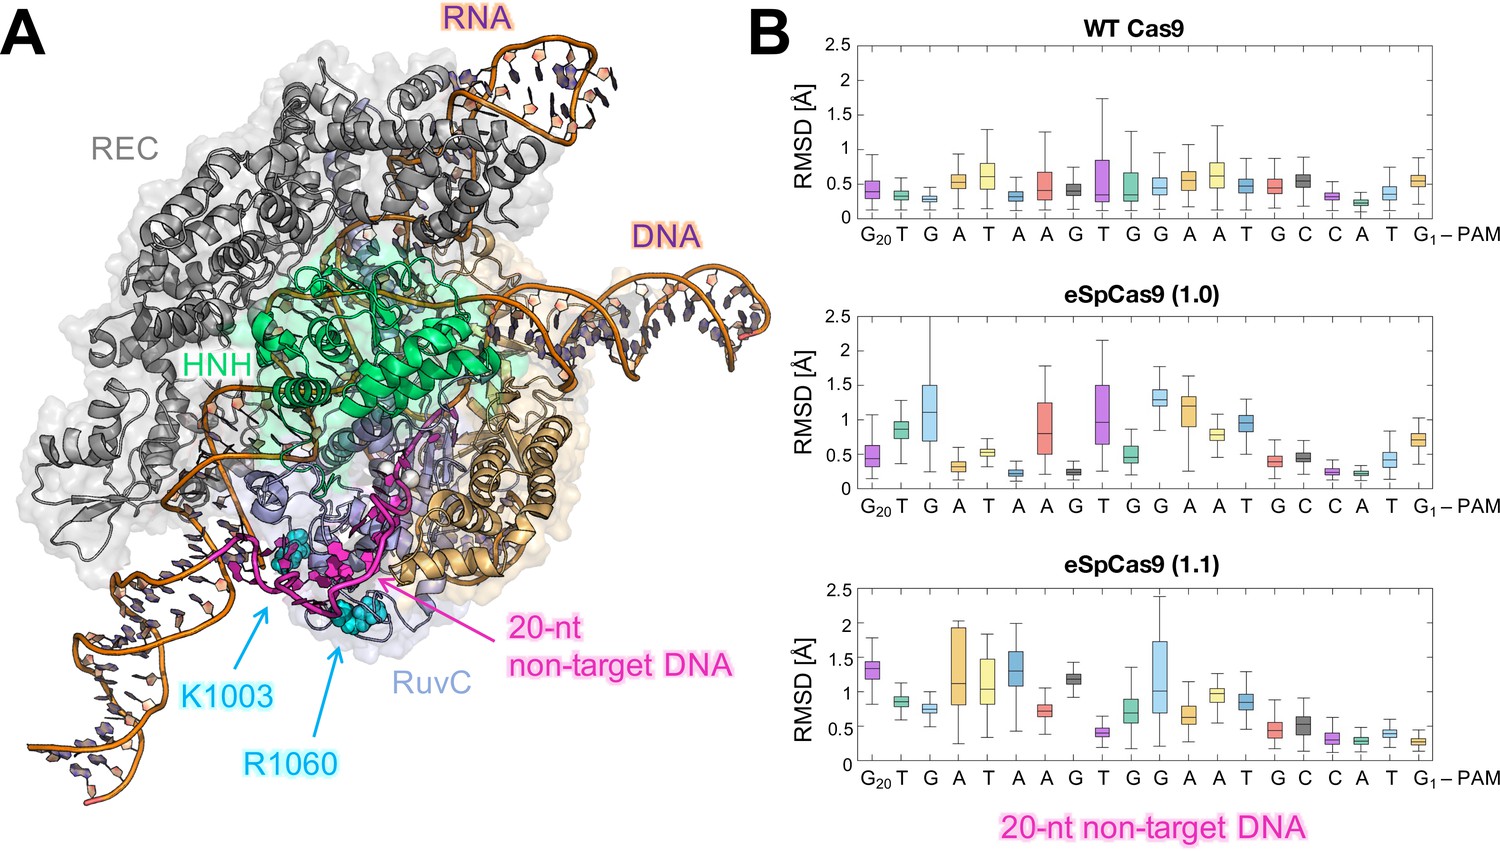
Flexibility of the DNA non-target strand.
(A) Overview of an enlarged model system of the ild-type (WT) CRISPR-Cas9, including a longer DNA non-target strand reaching the K1003 and R1060 residues (PDB: 5Y36) (Jiang and Doudna, 2017). Cas9 is color-coded as in Figure 1. The nucleic acids are shown as ribbons, highlighting in magenta the 20 nucleotides (20-nt) segment of the DNA non-target strand that locates within the RuvC domain. (B) For each nucleotide of the 20-nt segment, the root mean square deviations (RMSD) of the heavy atoms with respect to the initial positions have been computed along the simulations of the WT Cas9 (top), SpCas9 1.0 (center), and SpCas9 1.1 (bottom) systems and are plotted using box plots. All analyses performed over the last ~1 μs of MD simulations reveal a remarkable increase in the flexibiliy of the DNA non-target strand in the SpCas9 1.0 (center), and SpCas9 1.1 variants.
Appendix 1—figure 1
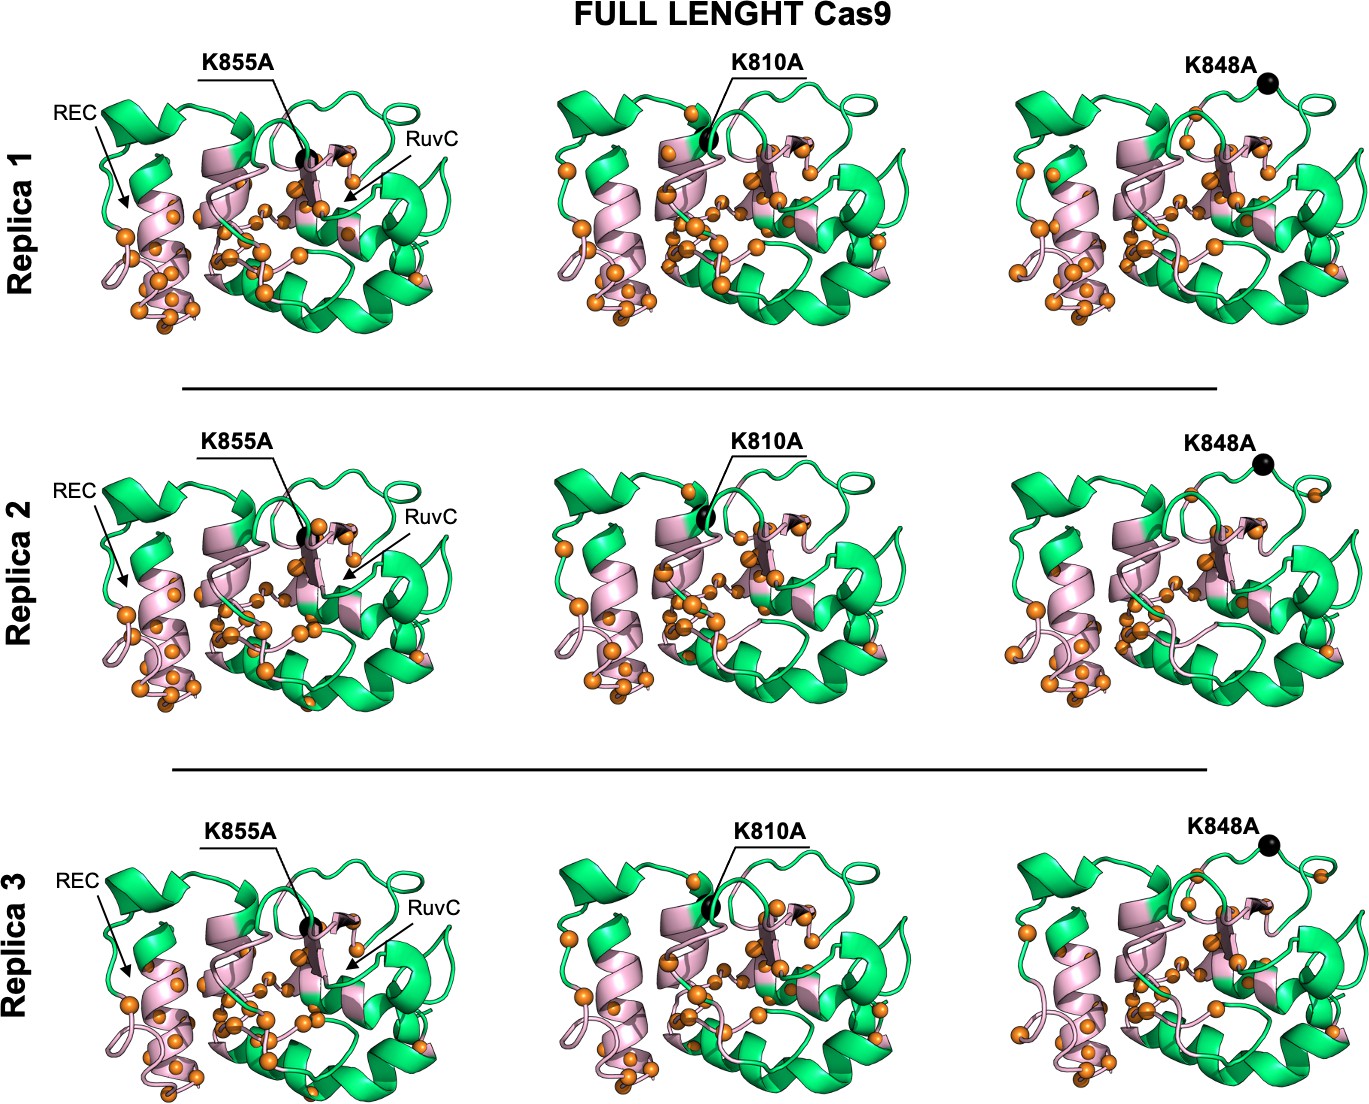
Allosteric dynamical pathways across the HNH domain for the K855A, K810A, K848A mutants, computed from μs-length molecular dynamics (MD) of the full-length Cas9 (data are shown for three simulation replicas).
The residue-to-residue dynamical pathways optimizing the momentum transport from REC to RuvC are shown using orange spheres. The HNH domain (green) is shown on side view. The wild-type (WT) allosteric pathway (pink ribbons), previously identified through μs-length MD and Carr-Purcell-Meiboom-Gill (CPMG) relaxation dispersion East et al., 2020a, is also shown for reference. The K855A, K810A, and K848A mutations are shown using black spheres.
Appendix 1—figure 2
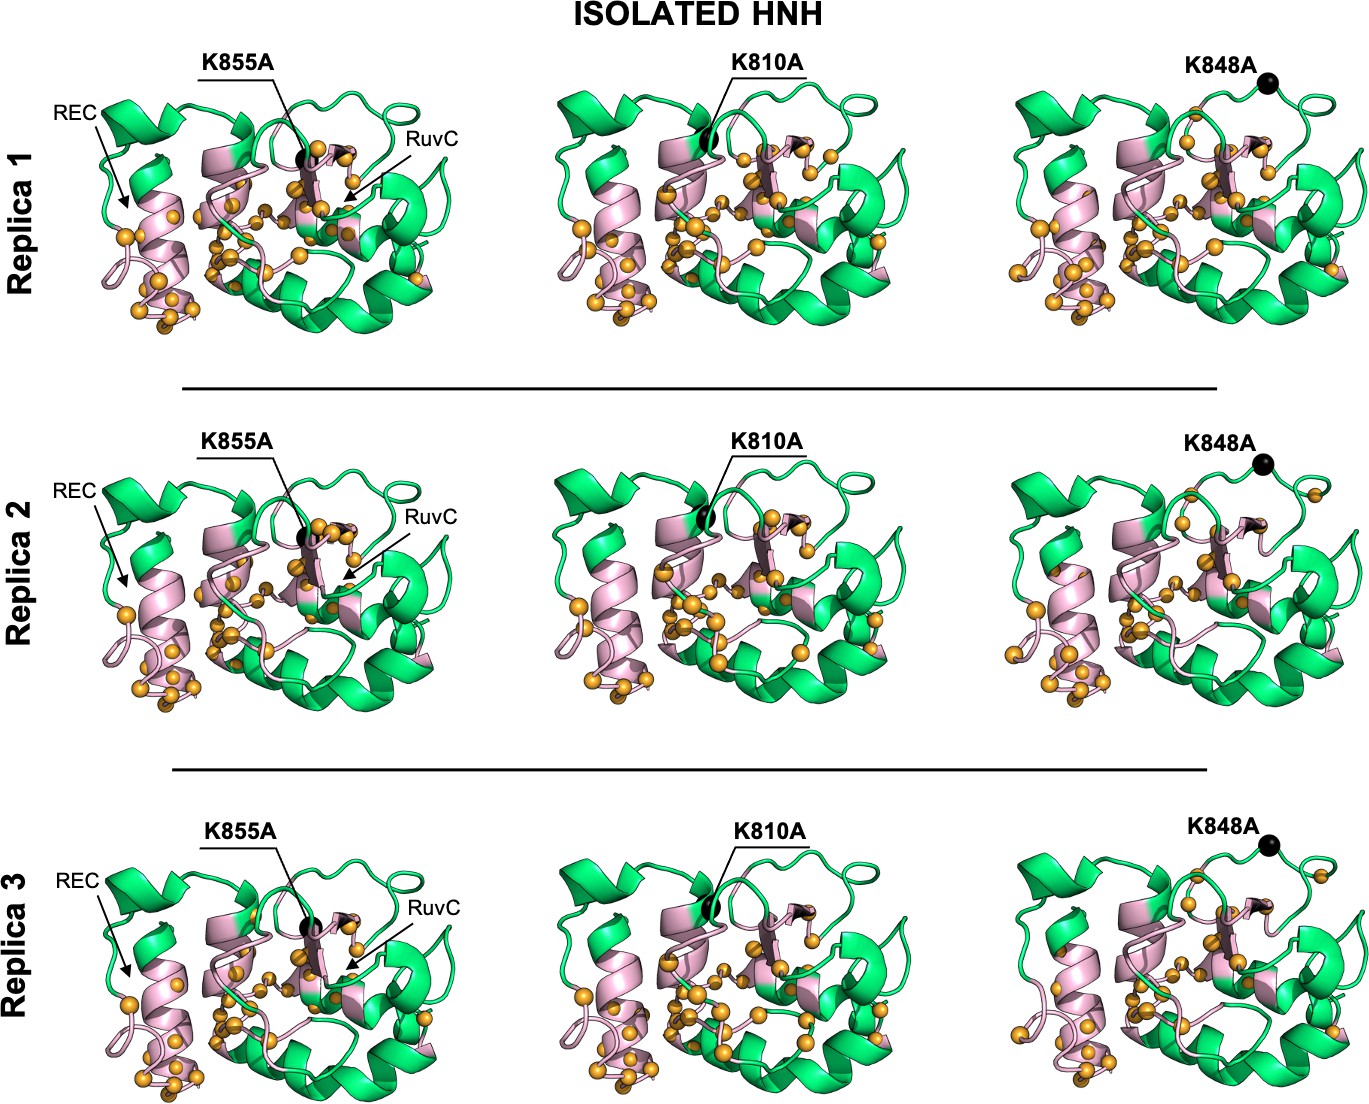
Allosteric dynamical pathways across the HNH domain for the K855A, K810A, K848A mutants, computed from μs-length molecular dynamics (MD) of the isolated HNH domain (data are shown for three simulation replicas).
The residue-to-residue dynamical pathways optimizing the momentum transport from REC to RuvC are shown using yellow spheres. The HNH domain (green) is shown on side view. The wild-type (WT) allosteric pathway (pink ribbons), previously identified through μs-length MD and Carr-Purcell-Meiboom-Gill (CPMG) relaxation dispersion (East et al., 2020a), is also shown for reference. The K855A, K810A, and K848A mutations are shown using black spheres.
Appendix 1—figure 3

Comparison of Lange and Grubmüller’s generalized correlations (GCs) and Pearson’s correlations (PCs) for allosteric pathways analysis.
Difference matrices between the GCs and PCs (ΔGC–PC), computed for the wild-type (WT) HNH and the K855A, K810A, and K848A mutants in the full-length Cas9 (A) and in the isolated HNH domain (B). The ΔGC–PC matrices have been computed considering the absolute values of PCs, and on the overall MD ensemble (i.e., three replicas of ~1 μs for each system). ΔGC–PC matrices are plotted according to the color-code of the scale on the right: from purple (GCs higher than PCs) to green (GCs lower than PCs) through white (GCs similar to PCs). This analysis shows that the GCs are higher than the absolute PCs values, indicating that the GC method can capture more correlations.
Appendix 1—figure 4

Allosteric pathways derived from Pearson’s coefficients (PCs), computed for the wild-type (WT) HNH and the K855A, K810A, and K848A mutants in the full-length Cas9 (A) and in the isolated HNH domain (B).
Residues composing the HNH allosteric pathways are shown as orange spheres. The WT allosteric pathway previously identified through molecular dynamics MD and NMR (pink ribbons) (East et al., 2020a) is also shown as a reference. For each system, the analysis of the allosteric pathways has been performed on the overall MD ensemble (i.e., three replicas of ~1 μs each), revealing a qualitative agreement with the pathways derived from GCs (Appendix 1—figures 1 and 2), and confirming that the allosteric dynamic signaling is preserved in the Cas9 mutants. This indicates that both methods convey in describing the systems’ correlations, yet the GC method is a more complete estimator of the overall coupled motions.
Appendix 1—figure 5
Close-up view of the HNH domain within the wild-type (WT) CRISPR-Cas9 (A) and in its isolated form (B).
Seven communities of synchronized dynamics are shown using different colors. Data are reported for three simulation replicas. Three communities are allosteric (A1 yellow, A2 cyan, and A3 purple), since they hold most of the residues that compose the allosteric pathway (shown as spheres). The non-allosteric communities (NA1 orange, NA2 tan, NA3 red, NA4 black) include a few allosteric residues.
Appendix 1—figure 6
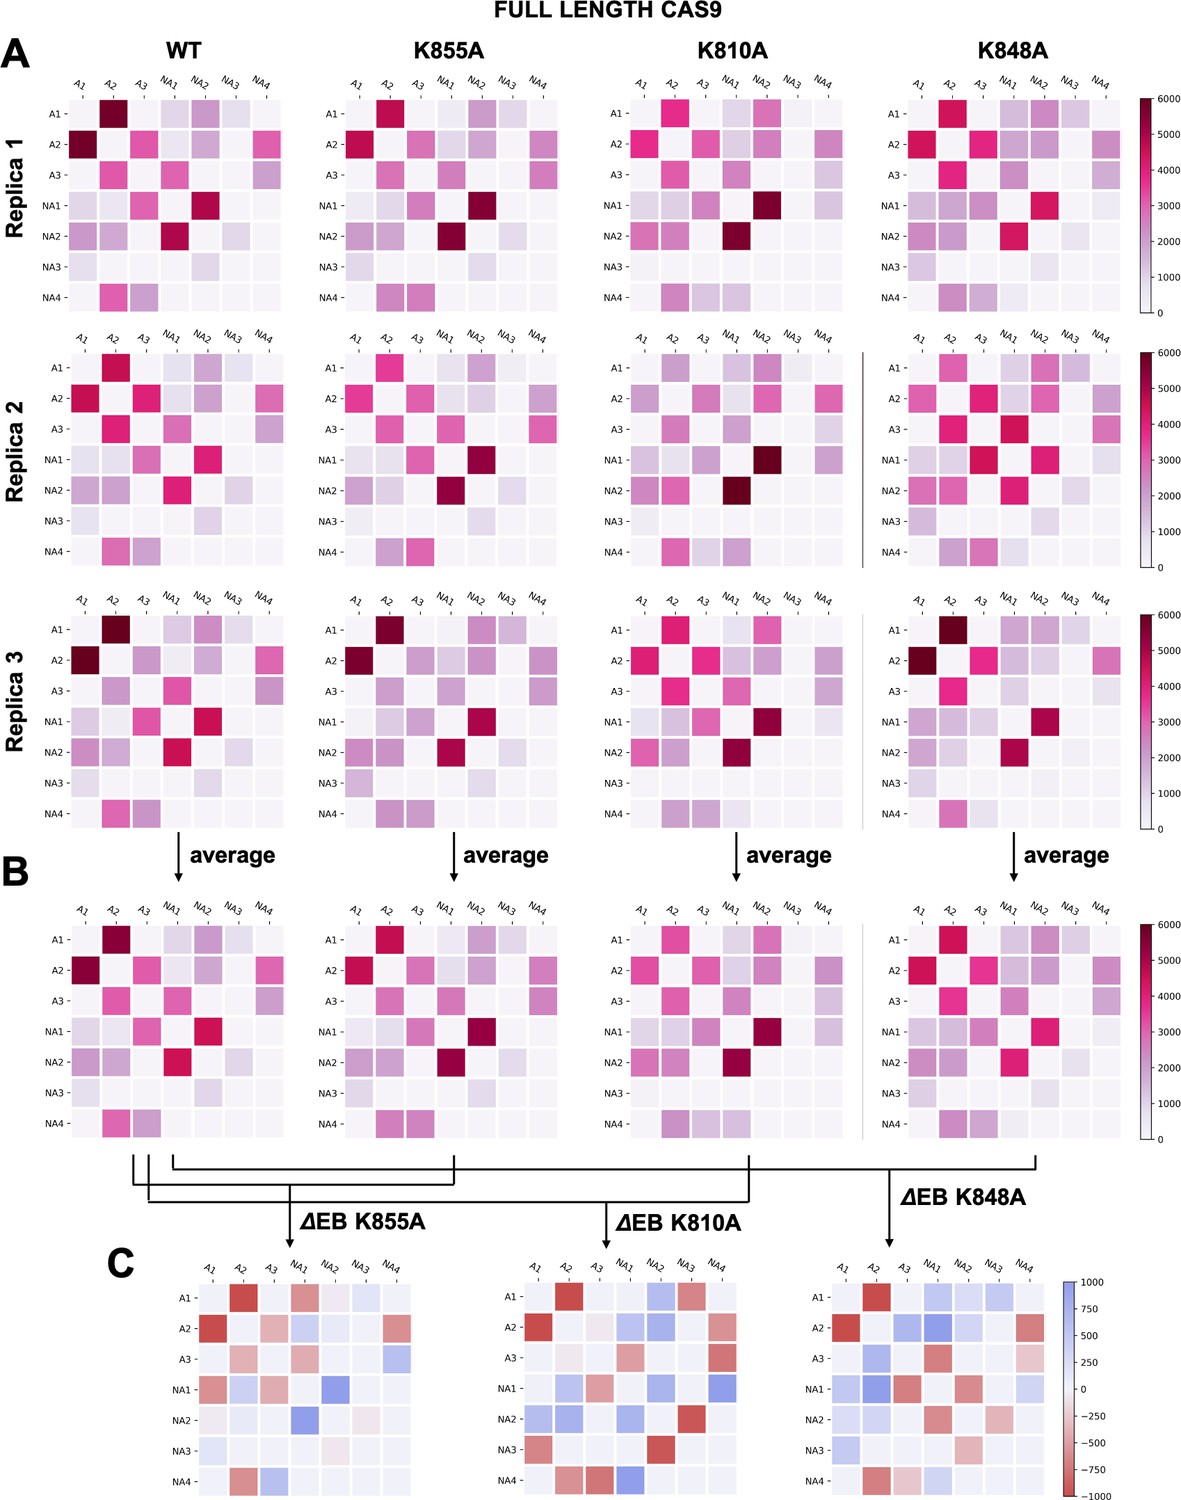
(A–B) Two-by-two matrices of the edge betweennesses (EB), computed for the wild-type (WT) system and for the K855A, K810A, and K848A mutants.
The EB are computed for each couple of communities of HNH in the full-length Cas9 and are plotted according to the scale on the right. Data are reported for three simulation replicas (A), and for the average between them (B). (C) Two-by-two matrices of the mutation-induced EB change (ΔEB), computed as a difference between the averaged EB of the mutants and of the WT system. Values of ΔEB are plotted according to the scale on the right. The ΔEBs have also been plotted as circular graphs (Appendix 1—figure 8A).
Appendix 1—figure 7
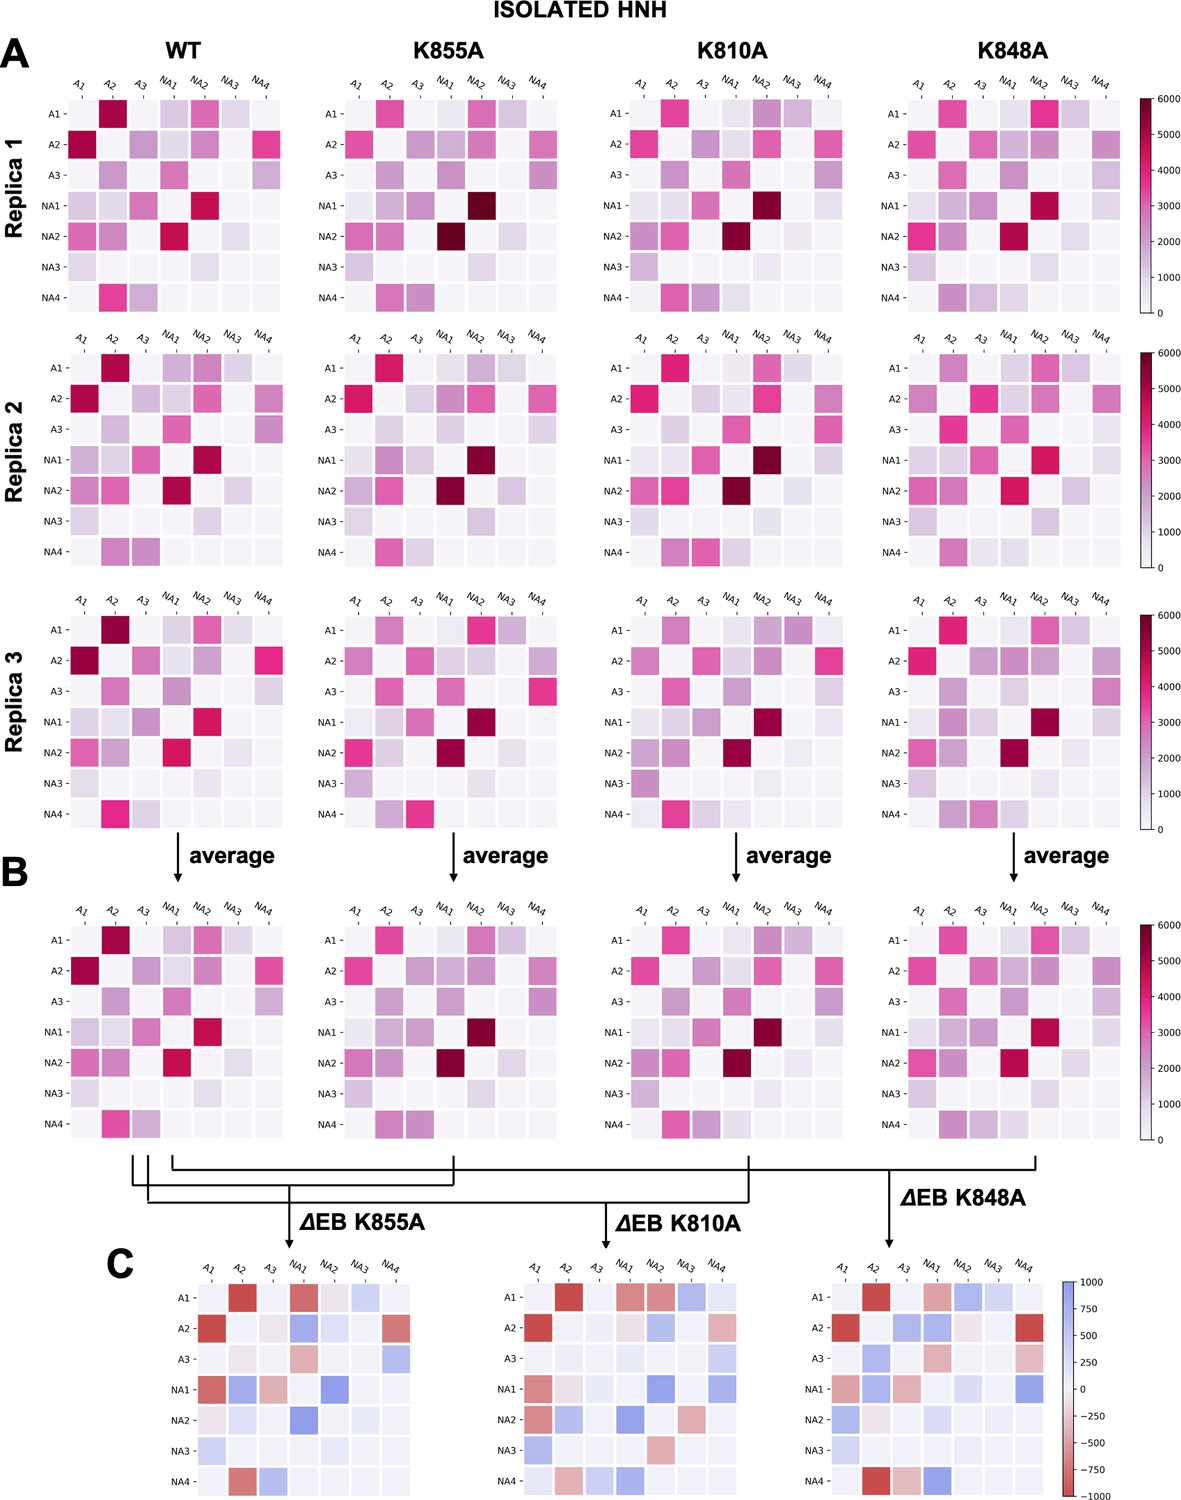
(A–B) Two-by-two matrices of the edge betweennesses (EB), computed for the wild-type (WT) system and for the K855A, K810A, and K848A mutants.
The EB are computed for each couple of communities of HNH in its isolated form and are plotted according to the scale on the right. Data are reported for three simulation replicas (A), and for the average between them (B). (C) Two-by-two matrices of the mutation-induced EB change (ΔEB), computed as a difference between the averaged EB of the mutants and of the WT system. Values of ΔEB are plotted according to the scale on the right. The ΔEBs have also been plotted as circular graphs (Appendix 1—figure 8B).
Appendix 1—figure 8
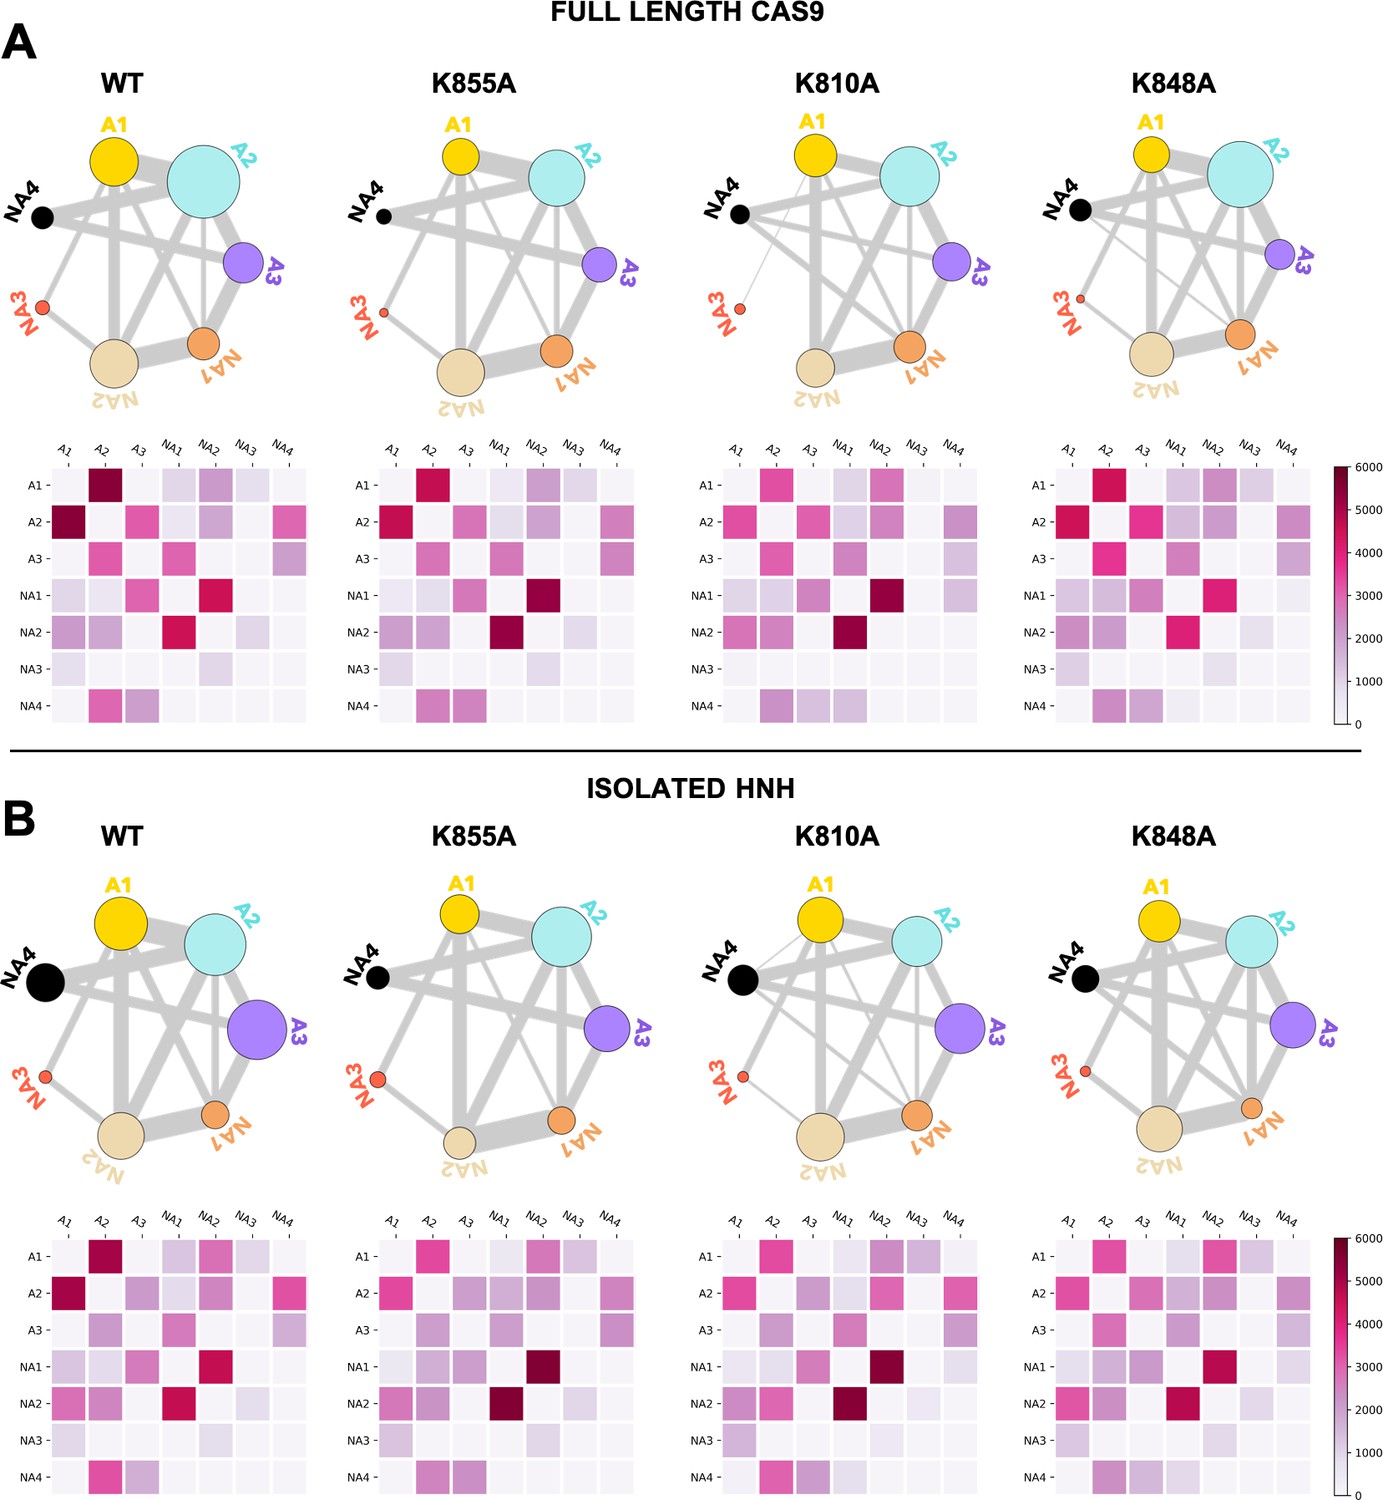
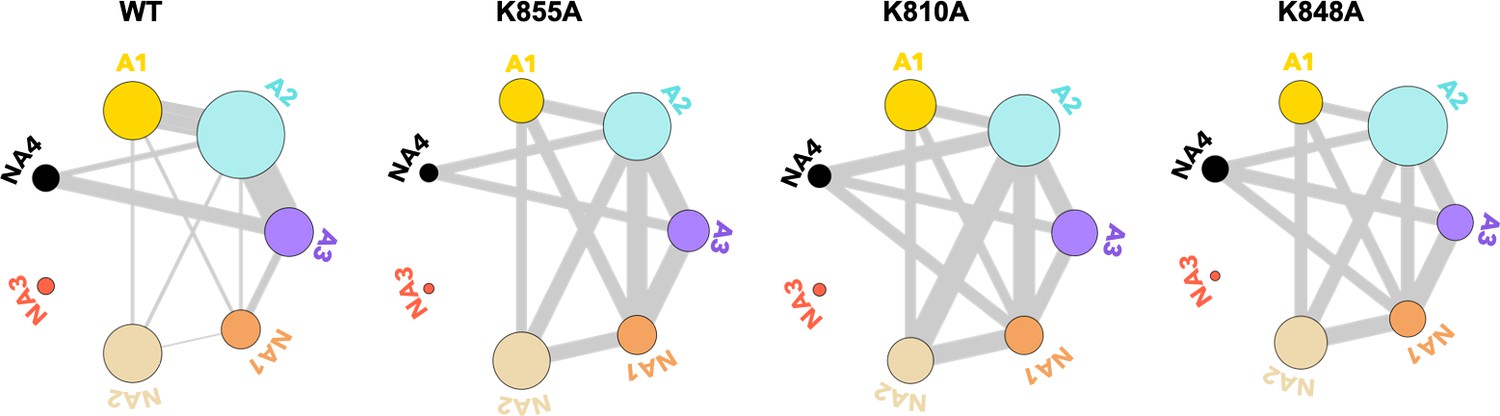
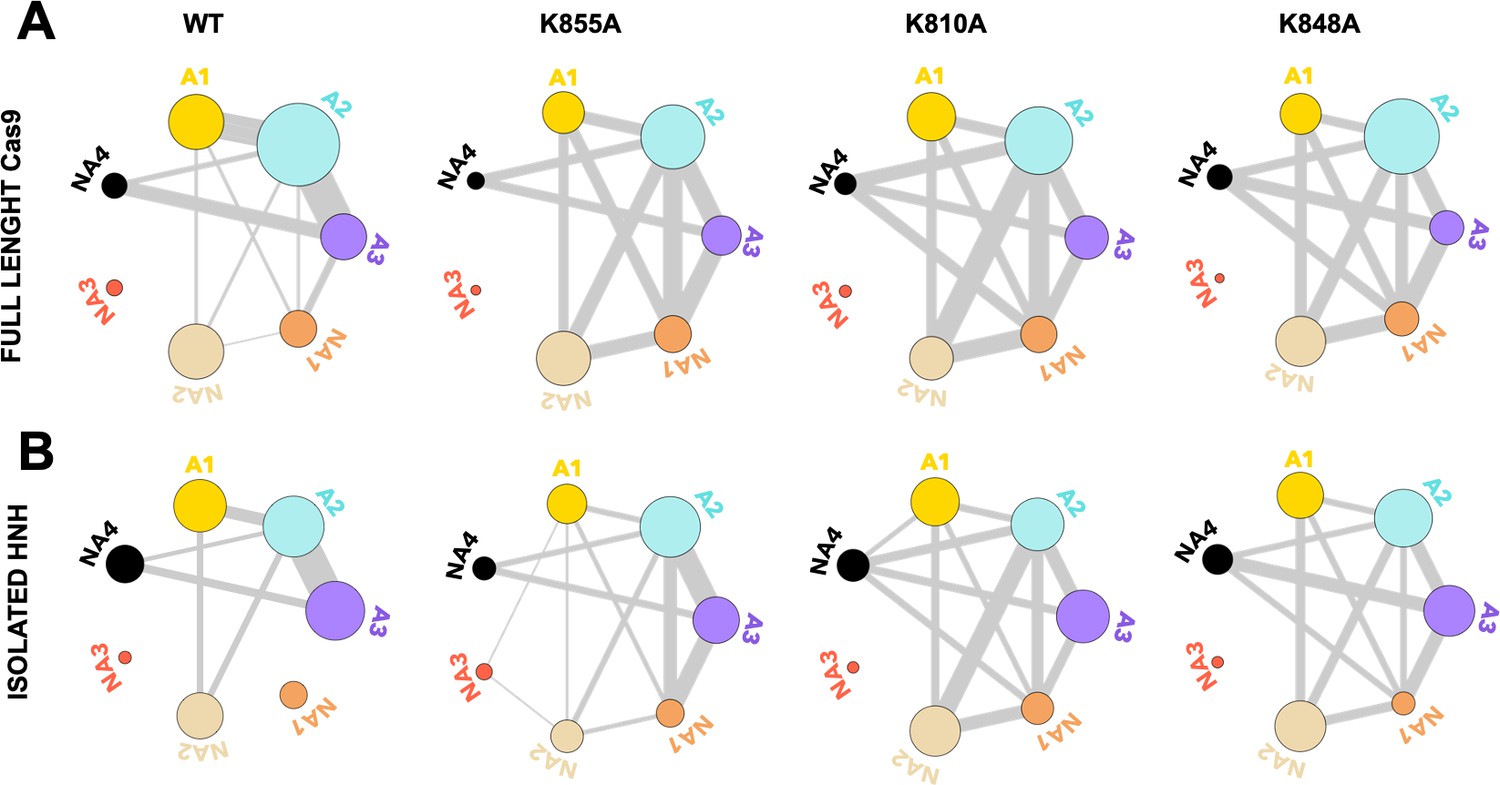
Community network plots (top) and corresponding two-by-two matrices (bottom) of the edge betweennesses (EB) computed for the wild-type (WT) HNH and for the K855A, K810A, and K848A mutants in the full-length Cas9 (A) and in the isolated HNH domain (B).
Bonds connecting communities are a representation of their EB and hence of the communities’ intercommunication strength. Data are reported for the average EB matrices in Appendix 1—figures 6 and 7. The EB matrices are plotted according to the scale on the right.
Additional files
-
Supplementary file 1
Additonal MD simulationa dn NMR data pertaining to the allosteric role of specificity enhancement mutations in HNH.
- https://cdn.elifesciences.org/articles/73601/elife-73601-supp1-v2.xlsx
-
Transparent reporting form
- https://cdn.elifesciences.org/articles/73601/elife-73601-transrepform1-v2.docx
Download links
A two-part list of links to download the article, or parts of the article, in various formats.
Downloads (link to download the article as PDF)
Open citations (links to open the citations from this article in various online reference manager services)
Cite this article (links to download the citations from this article in formats compatible with various reference manager tools)
Enhanced specificity mutations perturb allosteric signaling in CRISPR-Cas9
eLife 10:e73601.
https://doi.org/10.7554/eLife.73601


