Notch-dependent and -independent transcription are modulated by tissue movements at gastrulation
- Department of Physiology, Development and Neuroscience, University of Cambridge, United Kingdom
Figures
Figure 1 with 2 supplements
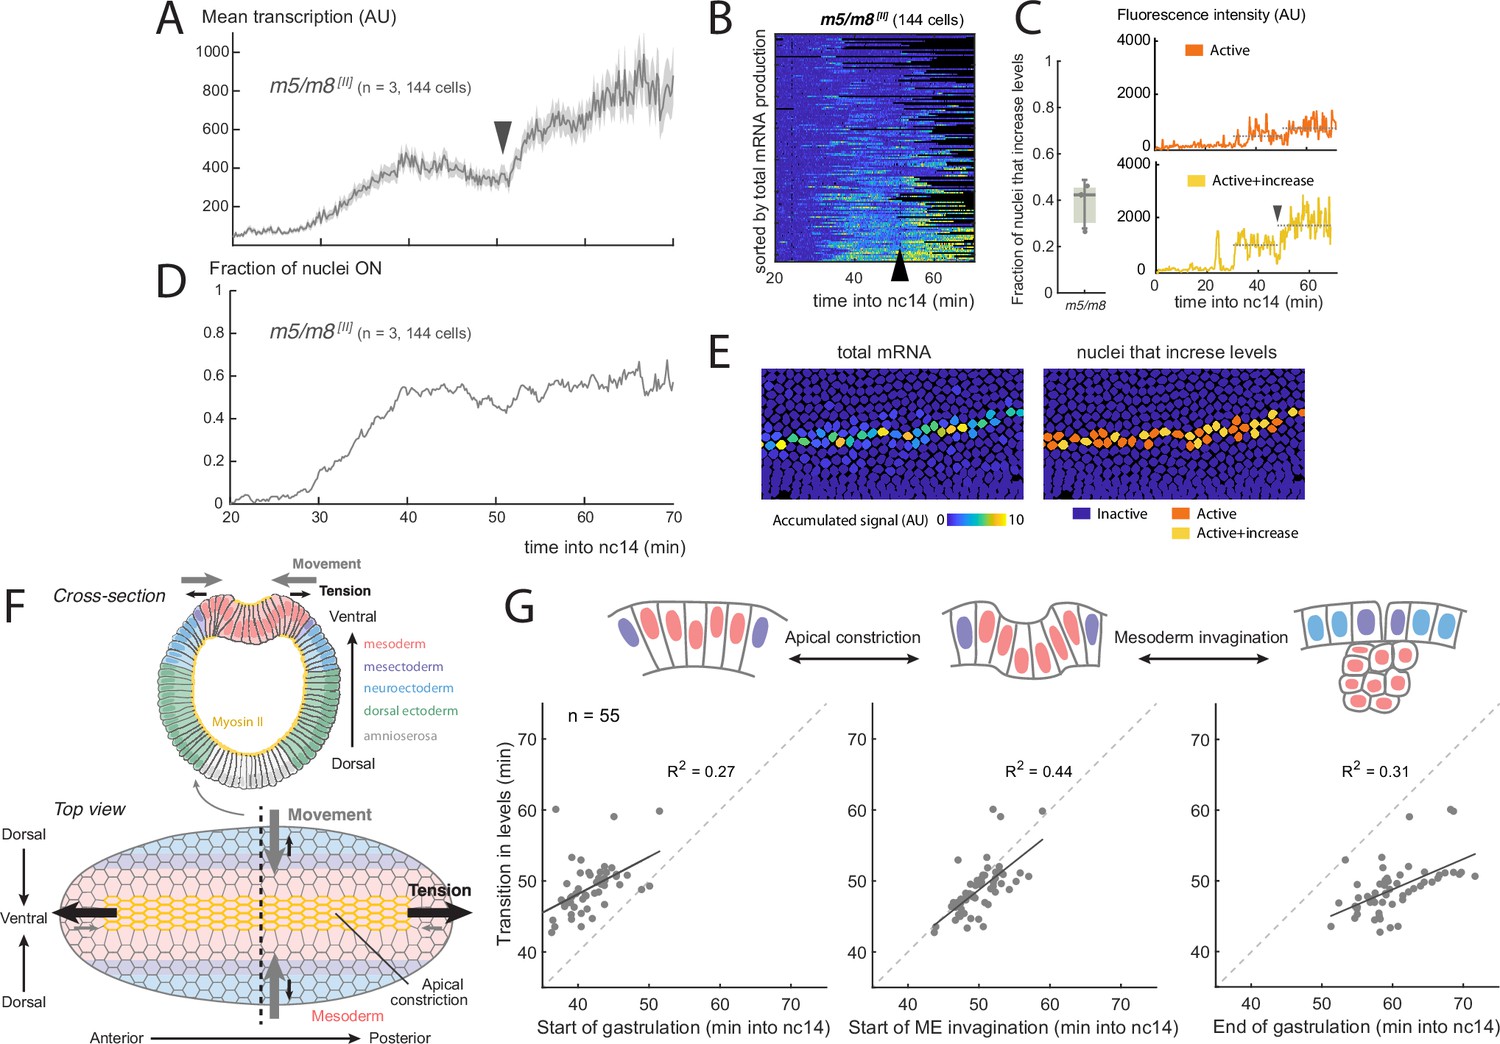
Increase in Notch-dependent transcription occurs at gastrulation.
(A) Mean profile of activity of the Notch-responsive m5/m8 [II] enhancer during nc14. (B) Heatmap showing m5/m8 [II] activity in all MSE cells over time, arrowhead indicates the transition point. (C) Proportion of active cells in each embryo that increase levels of m5/m8 [II] transcription at gastrulation (left; median, Q1/Q3 and SD shown) and examples of individual m5/m8 [II] transcription traces with ∼2x increase (yellow) or inflection only (orange). Dotted lines indicate mean transcription levels in the 15 min before and after gastrulation. (D) Fraction of tracked nuclei that are actively transcribing during nc14. (E) Still frame showing tracked nuclei color-coded for the total transcription produced by each nuclei (left) and by whether they exhibit a ∼2x increase in levels (right). (F) Schematic drawing of the forces generated during gastrulation. A cross-section with the different regions along the dorso-ventral axis (top) and top view from the ventral side (bottom) are shown. The most ventral part of the mesoderm (red-shaded) localizes Myosin II (yellow) apically, which generates apical constrictions and leads to tension generated towards the anterior and posterior ends of the embryo, producing ventral movement from the mesoderm, mesectoderm and neuroectoderm cells. (G) Correlation between the time at which mean levels of transcription increase in an embryo and the timing of three events during gastrulation. Each dot indicates an embryo from a collection of different Notch-responsive enhancers, promoters and landing sites (n=55 videos). Panels A-G were obtained by re-analyzing data from Falo-Sanjuan et al., 2019. Panel F has been adapted from Figure 6B from Martin, 2020 and Figure 1 from Leptin, 1999.
Figure 1—figure supplement 1
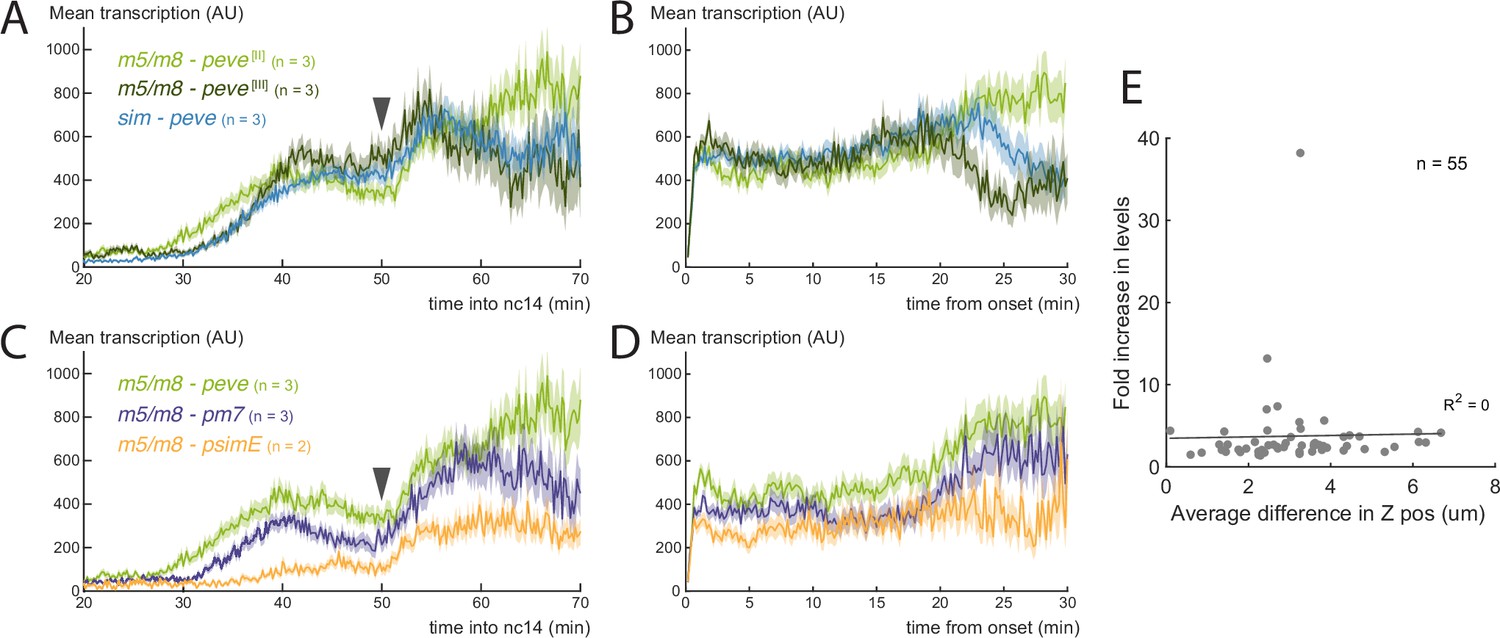
Increase in Notch-dependent transcription at the time of gastrulation.
(A) Mean profile of activity of the Notch-responsive enhancers sim and m5/m8 inserted in landing sites in the second ([II]) and third ([III]) chromosomes. (B) Mean profile of activity of the Notch-responsive enhancers sim and m5/m8 inserted in landing sites in the second ([II]) and third ([III]) chromosomes, aligned by onset times. (C) Mean profile of activity of m5/m8 [II] with different promoters (peve, pm7 and psimE). (D) Mean profile of activity of m5/m8 [II] with different promoters (peve, pm7 and psimE), aligned by onset times. Light green plots (m5/m8-peve [II]) are the same as shown in Figure 1. Mean transcription profiles show mean and SEM (shaded area) of MS2 fluorescent traces from all cells combined from multiple embryos (n embryo numbers indicated in each). (E) Correlation between the fold increase in transcription levels after gastrulation and the average difference in Z positions before and after gastrulation, which varies depending on the specific orientation each embryo was mounted. Each dot indicates an embryo from a collection of different Notch-responsive enhancers, promoters and landing sites (n=55 videos). All panels were obtained by re-analyzing data from Falo-Sanjuan et al., 2019.
Figure 1—figure supplement 2
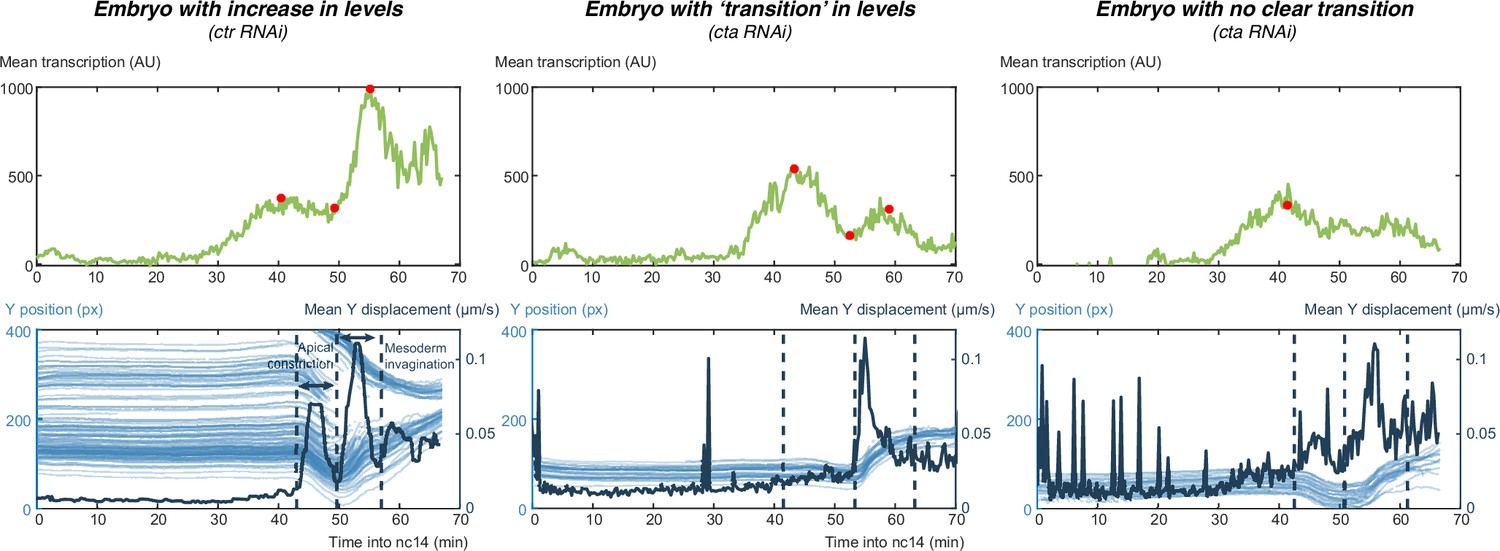
Quantification of gastrulation progression and changes in transcription levels.
Examples of three embryos in which transcription levels increase during gastrulation (left), show a transition in levels (center) or show no clear transition in levels (right). Top: mean levels of transcription from MSE nuclei with red dots indicating the manually annotated plateau and transition in levels. Bottom: plot overlaying movement of all MSE nuclei in the Y axis (left axis, light blue) with mean displacement in the Y axis, corresponding with DV movement (right axis, dark blue). The shapes of the curves in both plots were used to define the start of apical constriction, start of ME invagination and end of gastrulation (dashed lines), based on the cell movement along DV.
Figure 2 with 4 supplements

Disruption of gastrulation correlates with changes in the transition in Notch-dependent transcription.
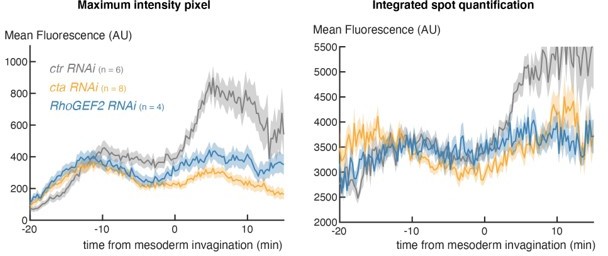
(A) Simplified scheme of the signaling cascade that controls MyoII contractility during Drosophila gastrulation. (B) Mean profile of m5/m8 [II] activity in α-Cat RNAi embryos compared to control embryos. (C) Correlation between the start of invagination and transition in levels of transcription in each embryo, in cta, RhoGEF2 and control RNAi embryos. (D) Mean profile of m5/m8 [II] activity in cta, RhoGEF2 and control RNAi embryos. (E) Correlation between the start of invagination and transition in levels of transcription in each embryo, in fog mutant embryos compared to control embryos and other non-fog hemizygous embryos obtained from the same cross. (F) Mean profile of m5/m8 activity in fog mutant embryos compared to control embryos and other non-fog hemizygous embryos obtained from the same cross. The transition in levels is delayed approximately 10 min in fog mutants (arrowheads). Mean transcription profiles show mean and SEM (shaded area) of MS2 fluorescent traces from all cells combined from multiple embryos (n embryo numbers indicated in each). coefficients are calculated after pooling all points shown in the same plot together. The transition point was only considered when a clear change in mean levels of transcription in an individual embryo could be observed, therefore the number of points in C and E could be smaller than the total number of embryos collected for each condition.
Figure 2—figure supplement 1
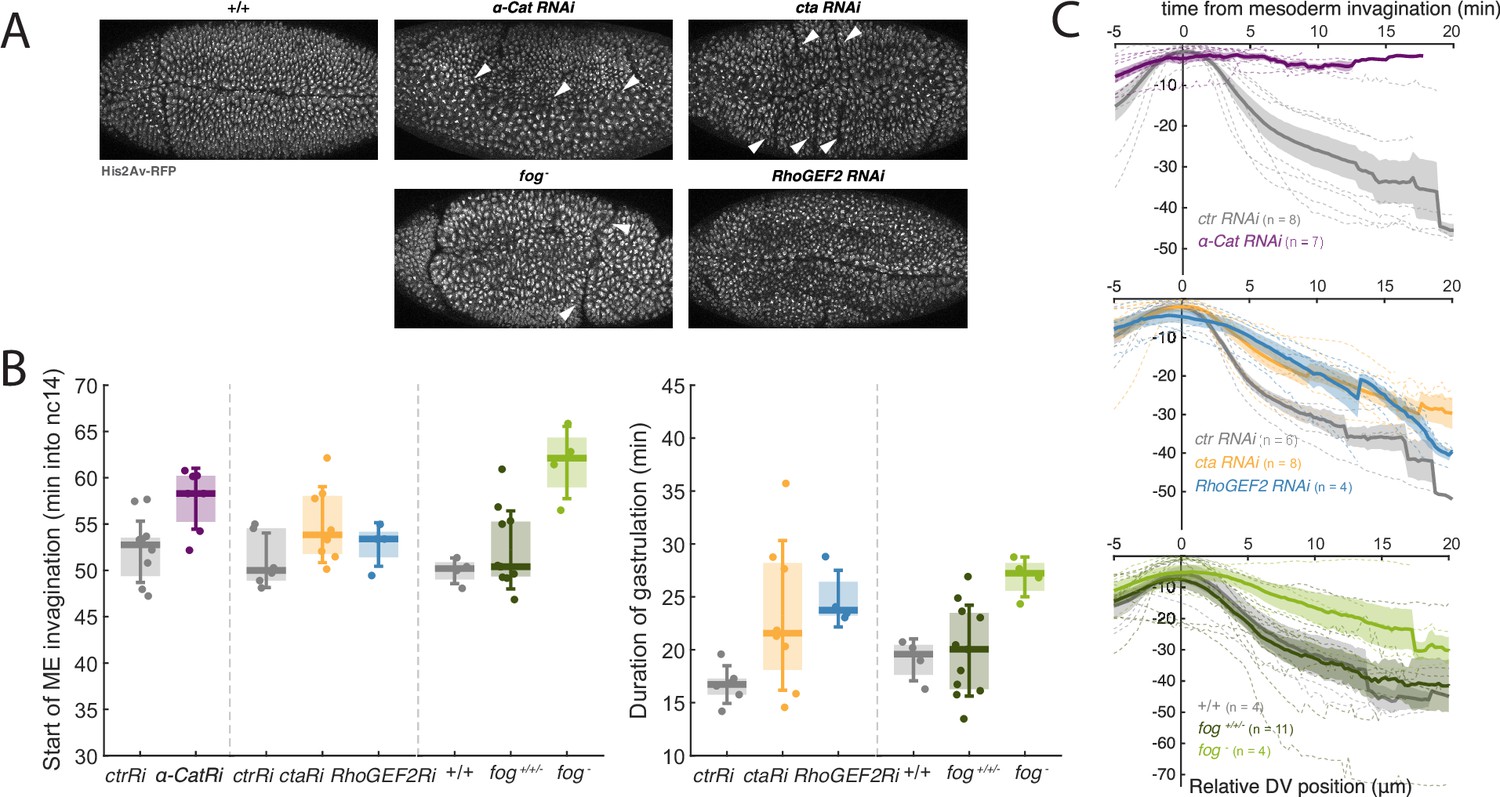
Genetic disruption of gastrulation.
(A) Still images (maximum projection of the His2Av-RFP channel) of post-gastrulation embryos from the indicated genetic conditions captured after MS2 experiments. Arrowheads indicate ectopic folds and mesoderm cells dividing externally in α-Cat RNAi embryos. (B) Start of ME invagination (left) and total gastrulation length (right) in the indicated genotypes. Boxplots show median, Q1/Q3 quartiles and SD. (C) Quantification of the movement of MSE nuclei over time in the Y axis (representing movement in the DV axis), aligned by the time of ME invagination, in the indicated genetic conditions. 0 represents the highest (most dorsal) position achieved, therefore during gastrulation MSE nuclei move towards negative positions. Mean and SEM (solid line and shaded area) of multiple embryos shown (n embryo numbers indicated in each). Dashed lines indicate mean profiles for individual embryos. Because α-Cat RNAi embryos do not gastrulate, total duration of gastrulation was not quantified, and mesoderm invagination has been defined, based on the overall changes occurring in the embryo, as the time when it would normally initiate.
Figure 2—figure supplement 2
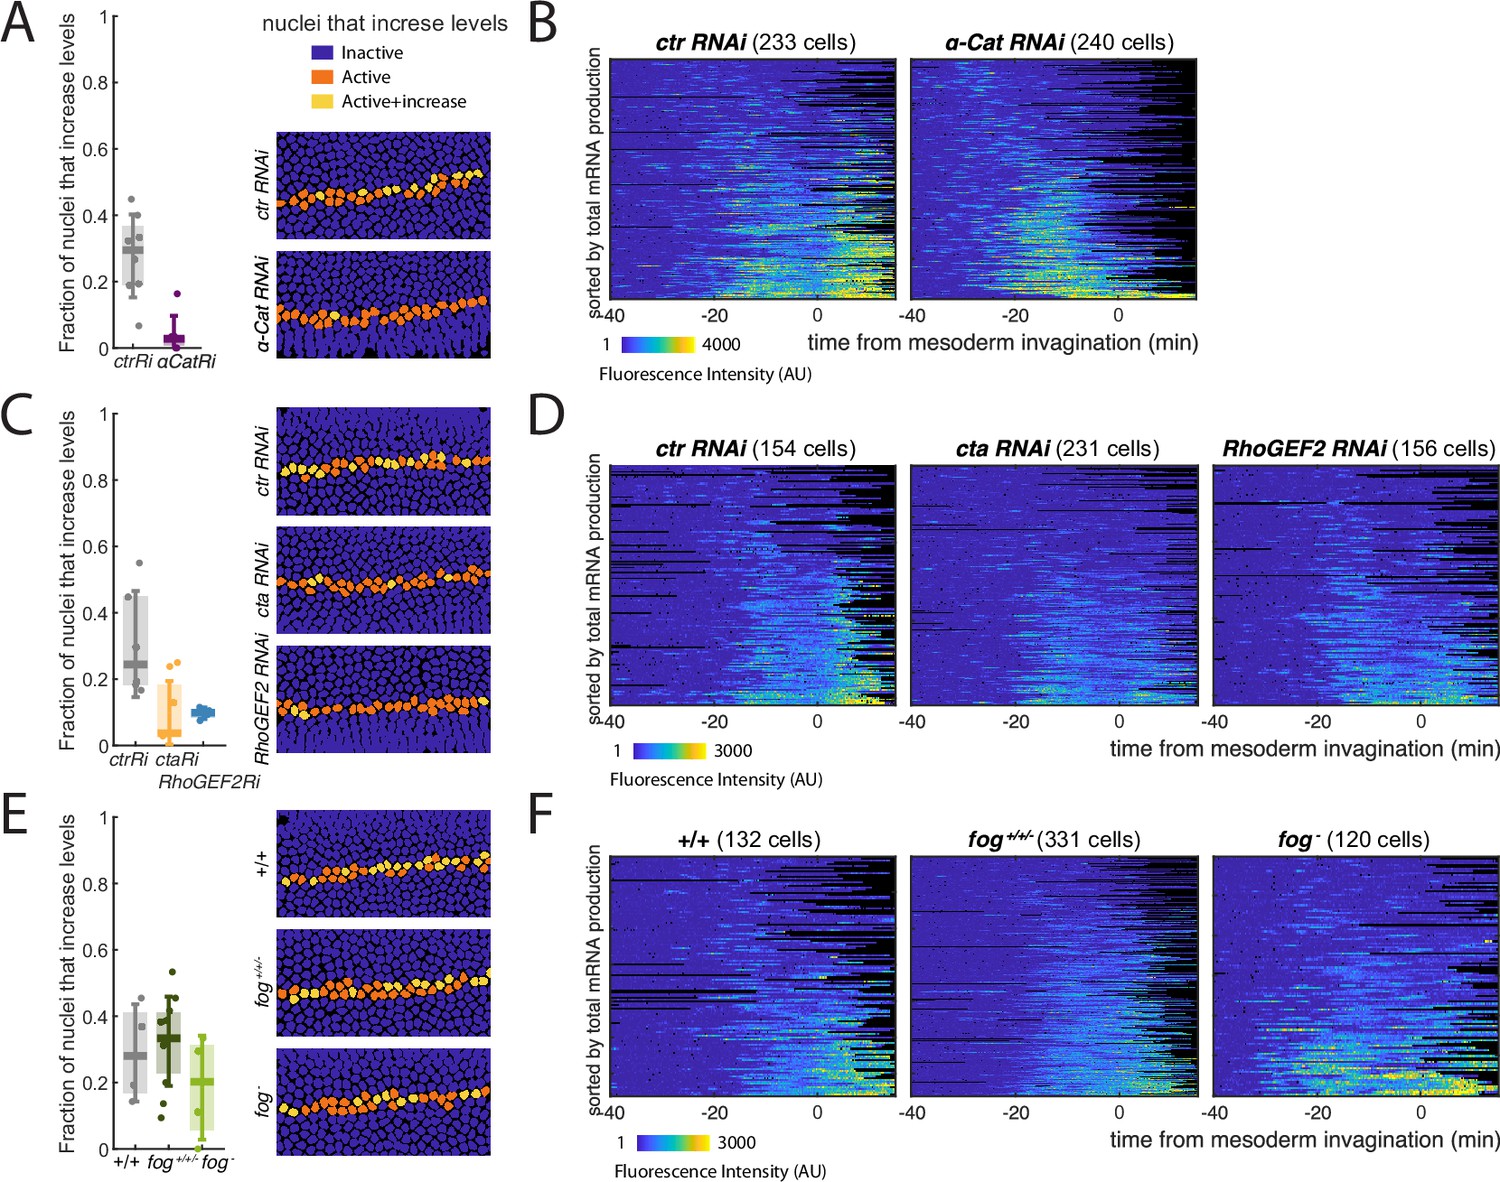
Effects of genetic manipulations to gastrulation on the increase in m5/m8 [II] transcription.
(ACE) Boxplots showing proportion of active cells in each embryo that increase levels of m5/m8 [II] transcription at the time of gastrulation (left; median, Q1/Q3 and SD shown) and still frame with tracked nuclei color-coded for whether they increase in levels during gastrulation (right), in the indicated genetic conditions: α-Cat and control RNAi (A), cta, RhoGEF2 and control RNAi (C) and fog- embryos compared to controls and other non-fog hemizygous embryos obtained from the same cross - fog+/+/- (E). (BDF) Heatmaps showing m5/m8 [II] activity in all MSE cells over time, aligned by the time of ME invagination, in the indicated genetic conditions: α-Cat and control RNAi (B), cta, RhoGEF2 and control RNAi (D) and fog- embryos compared to controls and other non-fog hemizygous embryos obtained from the same cross - fog+/+/- (F).
Figure 2—figure supplement 3
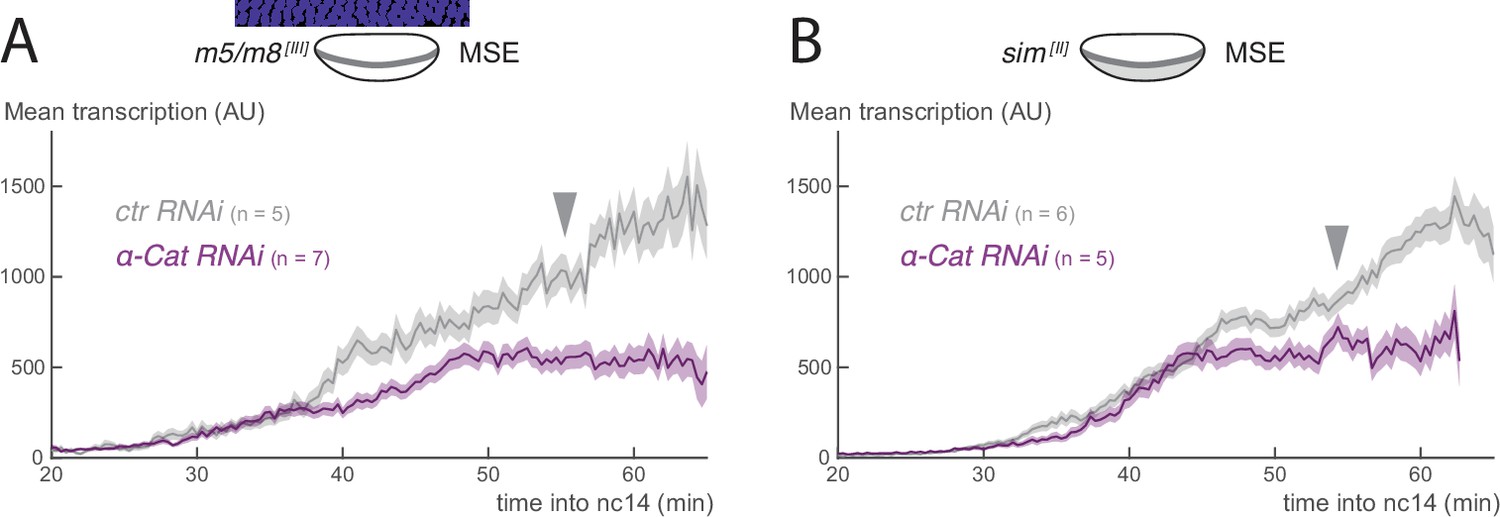
Gastrulation also influences other Notch-responsive enhancers.
(A) Mean profile of m5/m8 [III] activity in α-Cat RNAi embryos compared to control embryos. (B) Mean profile of sim [III] activity in α-Cat RNAi embryos compared to control embryos. Mean transcription profiles show mean and SEM (shaded area) of MS2 fluorescent traces from all cells combined from multiple embryos (n embryo numbers indicated in each).
Figure 2—figure supplement 4
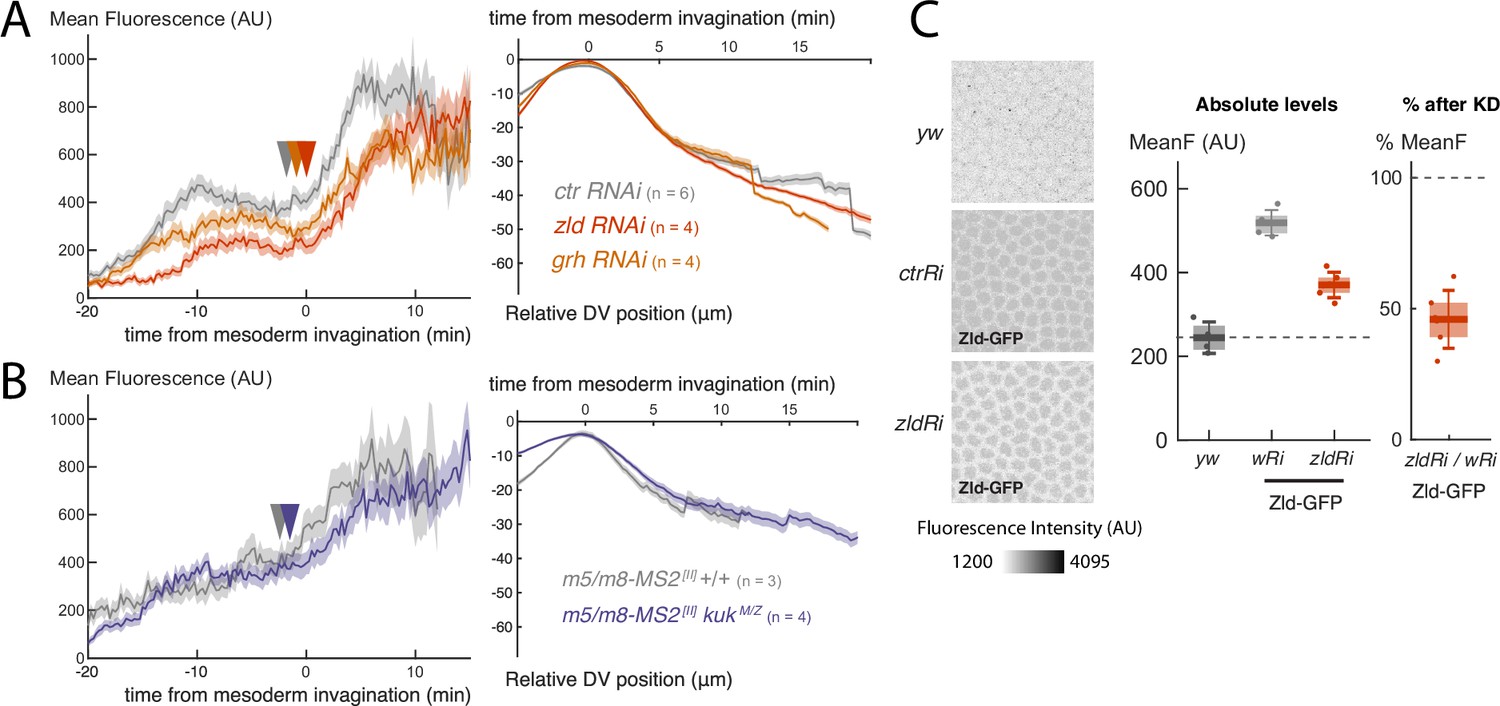
Other genetic manipulations do not alter transcription profiles during gastrulation.
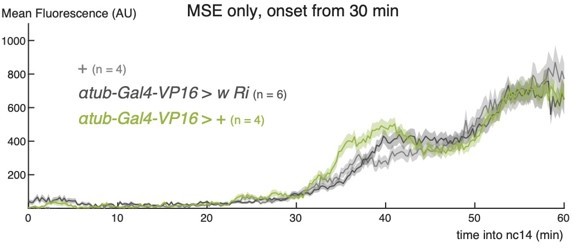
(A) Mean profile of m5/m8 [II] activity (left) and movement of MSE nuclei over time in the Y axis (representing movement in the DV axis, right) in zld and grh RNAi embryos compared to control embryos. (B) Mean profile of m5/m8 [II] activity (left) and movement of MSE nuclei over time in the Y axis (representing movement in the DV axis, right) in kuk M/Z compared to control embryos (re-analyzed from Falo-Sanjuan and Bray, 2021). (C) Quantification of the degree of maternal Zelda KD by quantifying Zld-GFP fluorescence in embryos in the presence of control and zld RNAi. Mean transcription profiles show mean and SEM (shaded area) of MS2 fluorescent traces from all cells combined from multiple embryos (n embryo numbers indicated in each).
Figure 3 with 1 supplement
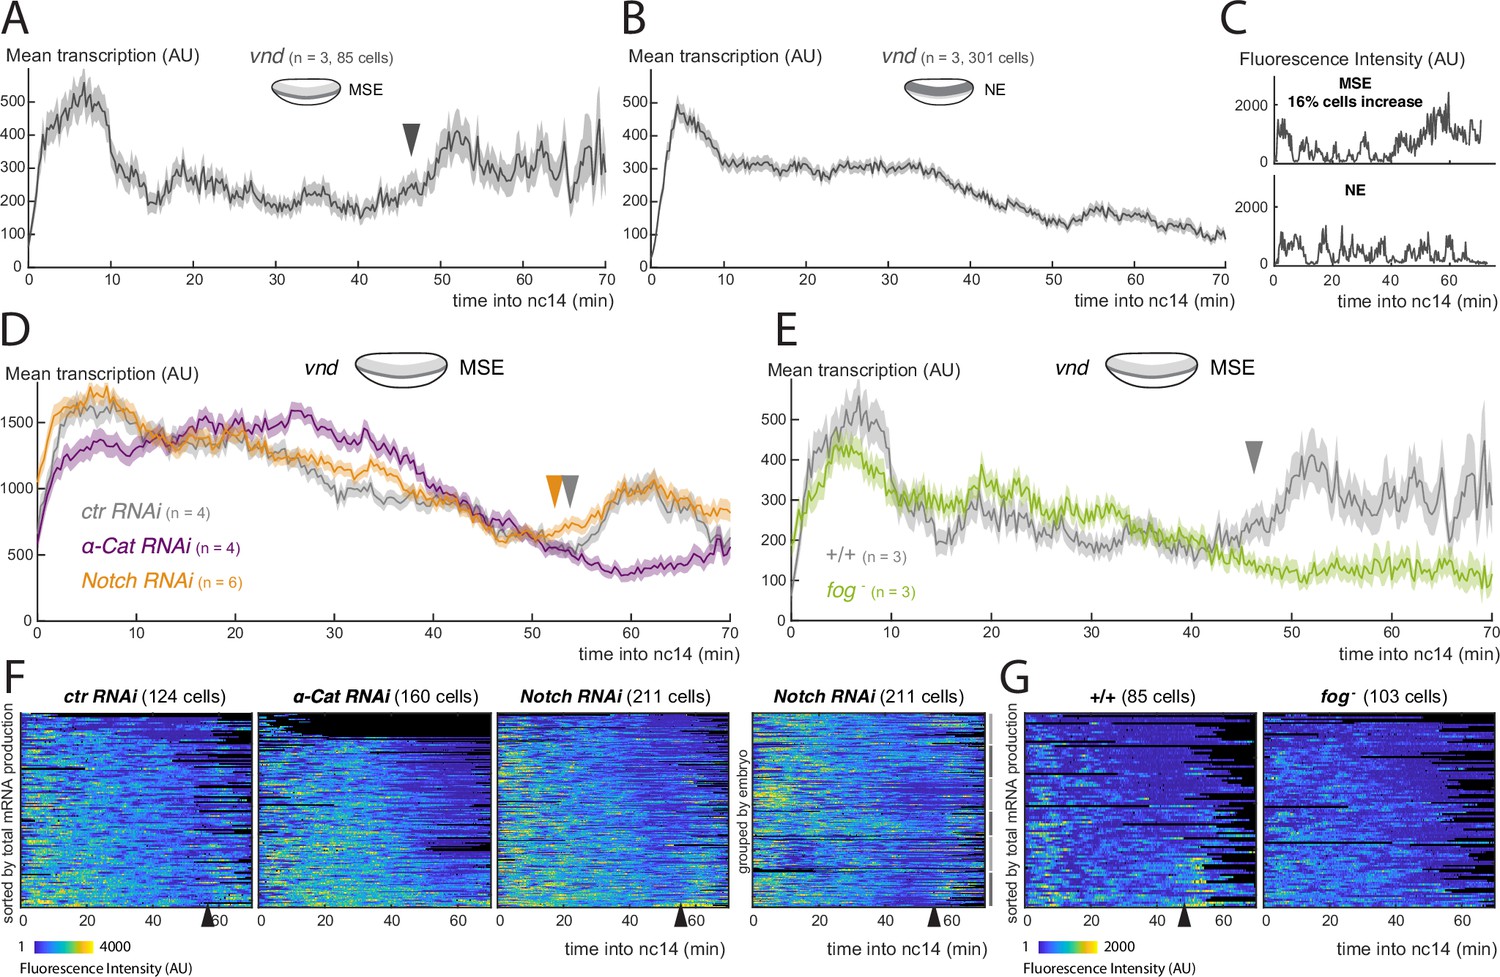
Activity of the Notch-independent vnd enhancer is modulated by gastrulation.
(A) Mean profile of transcription from vnd in MSE nuclei. (B) Mean profile of transcription of vnd in NE nuclei. (C) Examples of vnd transcription traces from MSE and NE, with (upper) and without (lower) a marked increase at the time of gastrulation. (D) Mean profile of transcription from vnd in MSE nuclei in α-Cat and Notch RNAi compared to control embryos. (E) Mean profile of transcription from vnd in MSE nuclei in fog mutant embryos compared to control embryos. (F) Heatmaps showing vnd activity in all MSE cells over time in α-Cat, Notch and control RNAi embryos, sorted by total mRNA production (first 3 plots) and Notch RNAi grouped by embryo. (G) Heatmaps showing vnd activity in all MSE cells over time in fog- embryos compared to controls, sorted by total mRNA production. Mean transcription profiles show mean and SEM (shaded area) of MS2 fluorescent traces from all cells combined from multiple embryos (n embryo numbers indicated in each). Arrowheads indicate increase in the mean levels of transcription.
Figure 3—figure supplement 1
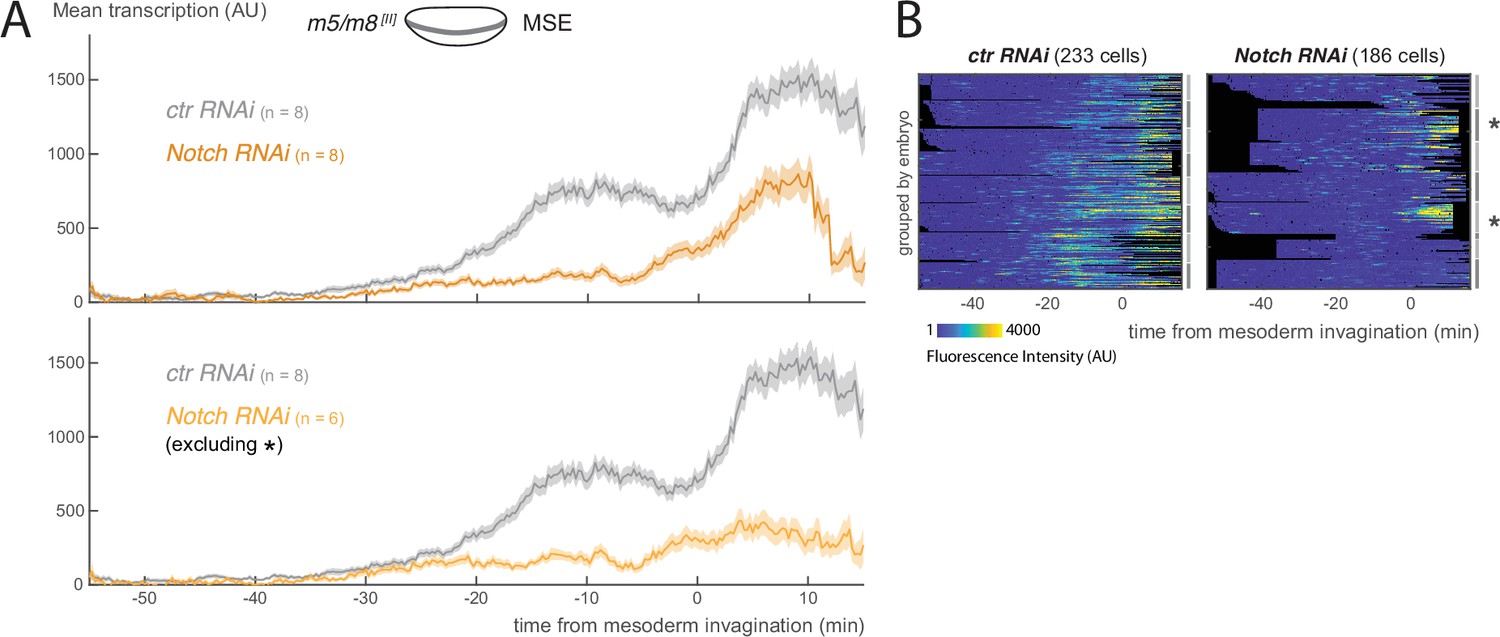
Notch RNAi strongly reduces Notch-dependent transcription.
(A) Mean profile of transcription from m5/m8 [II] in Notch RNAi compared to control RNAi embryos considering all embryos (top) and after removing two embryos in which the levels Notch KD were likely lower (bottom), indicated by the asterisks in B. (B) Heatmaps showing m5/m8 [II] activity cells over time in Notch and control RNAi embryos. Traces have been grouped by embryo (each marked by grey and black lines on the sides) to highlight the degree of embryo-to-embryo variability in transcription, likely arising from differences in the degree of Notch KD. Mean transcription profiles show mean and SEM (shaded area) of MS2 fluorescent traces from all cells combined from multiple embryos (n embryo numbers indicated in each). Control embryos are the same as shown in Figure 2B, Figure 2—figure supplement 2B.
Figure 4 with 1 supplement
Modulation of Notch-dependent transcription occurs downstream of pathway activation.
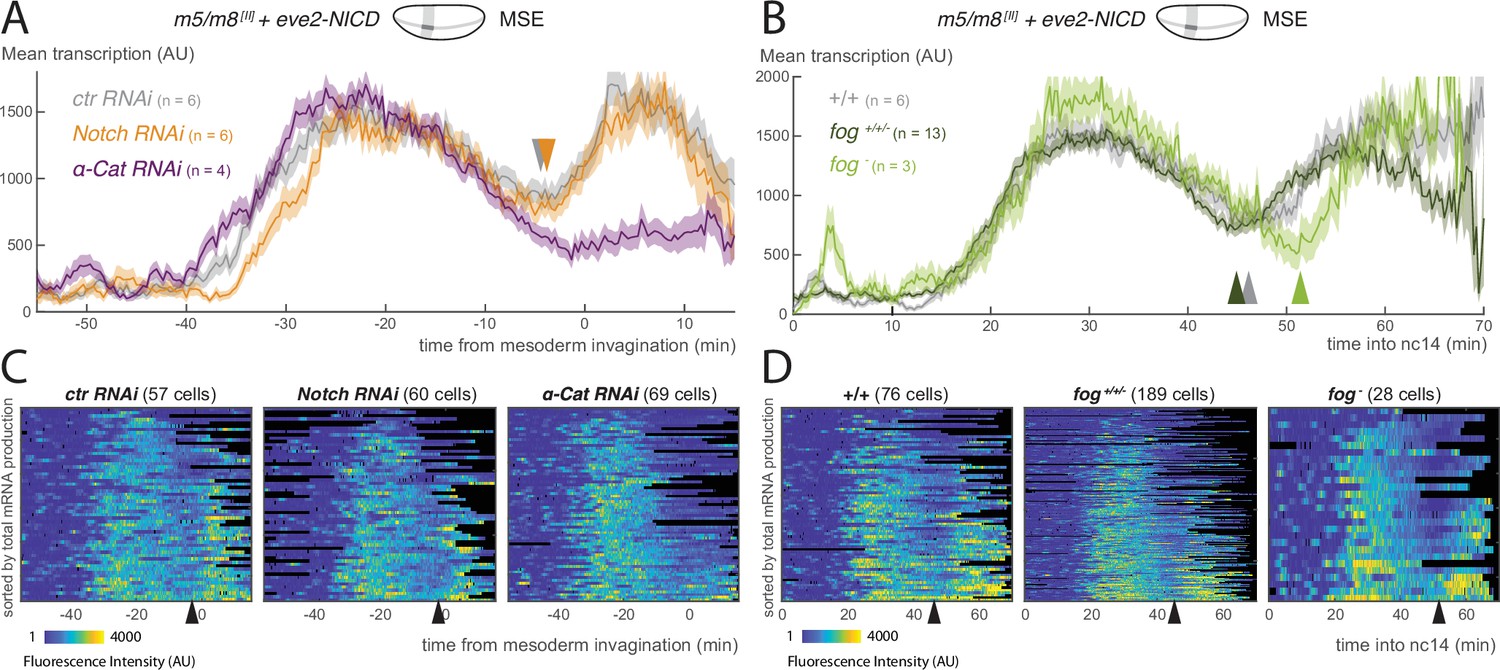
(A) Mean profile of transcription from m5/m8 [II] in MSE nuclei, aligned by the time of ME invagination, in α-Cat and Notch RNAi compared to control embryos in the presence of ectopic NICD (produced by eve2-NICD). (B) Mean profile of m5/m8 [II] transcription in MSE nuclei with ectopic NICD in homozygous fog mutants compared to control or heterozygous embryos from the same cross (fog+/+/-). (C) Heatmaps showing m5/m8 [II] activity in MSE cells within eve2-NICD domain, aligned by the time of ME invagination, in α-Cat, Notch and control RNAi embryos. (D) Heatmaps showing m5/m8 [II] activity in MSE cells within eve2-NICD domain over time in fog- embryos compared to control or heterozygous embryos obtained from the same cross (fog+/+/-). Mean transcription profiles show mean and SEM (shaded area) of MS2 fluorescent traces from all cells combined from multiple embryos (n embryo numbers indicated in each). Arrowheads indicate an increase in the mean levels of transcription.
Figure 4—figure supplement 1
Modulation of transcription occurs downstream of pathway activation.
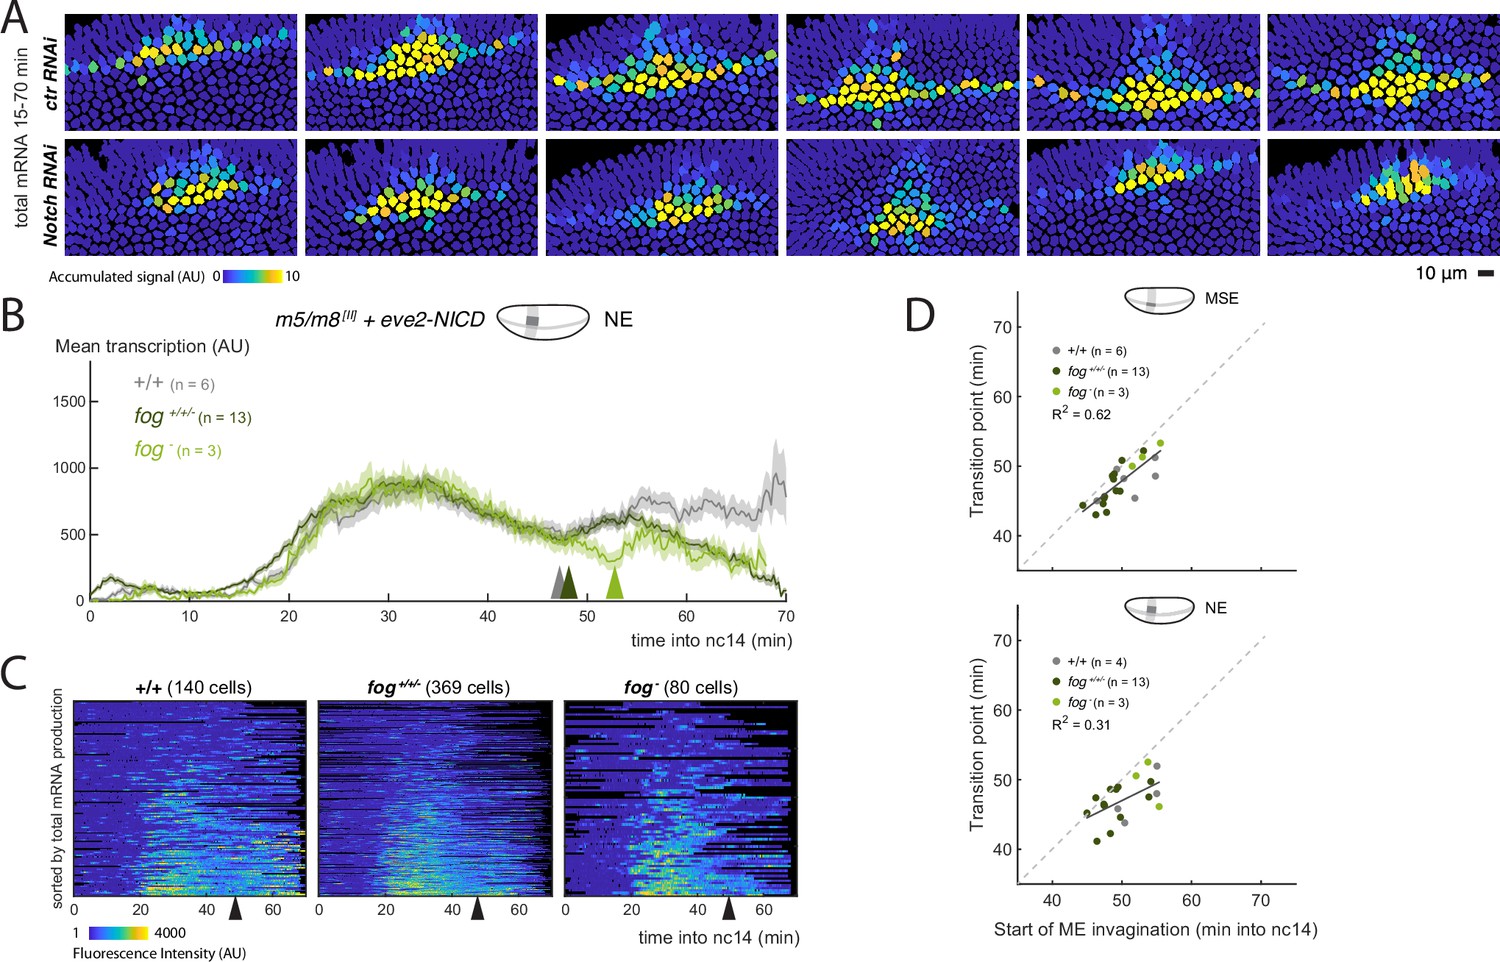
(A) Still frames showing tracked nuclei color-coded for the total transcription produced by each nuclei in all m5/m8 [II] + eve2NICD control and Notch RNAi embryos. Upon Notch KD, m5/m8 [II] transcription only occurs where eve2-NICD is expressed. (B) Mean profile of transcription from m5/m8 [II] in NE nuclei expressing ectopic NICD in fog mutant embryos compared to controls and to other embryos obtained from the same cross (fog+/+/-). (C) Heatmaps showing m5/m8 [II] activity over time in all NE cells expressing ectopic NICD in fog- embryos compared to controls and to other embryos obtained from the same cross (fog+/+/-). (D) Correlation between start of invagination and transition in m5/m8 [II] transcription levels in MSE (top) or NE (bottom) nuclei overlapping with eve2-NICD domain in each fog mutant embryo compared to control and other non-fog hemizygous embryos obtained from the same cross. Mean transcription profiles show mean and SEM (shaded area) of MS2 fluorescent traces from all cells combined from multiple embryos (n embryo numbers indicated in each). coefficients in D are calculated after pooling all points shown the same plot together. The transition point was only considered when a clear change in mean levels of transcription in an individual embryo could be observed, therefore the number of points could be smaller than the total number of embryos collected for each condition.
Figure 5 with 2 supplements
LINC complex disruption decouples gastrulation progression and changes in transcription.
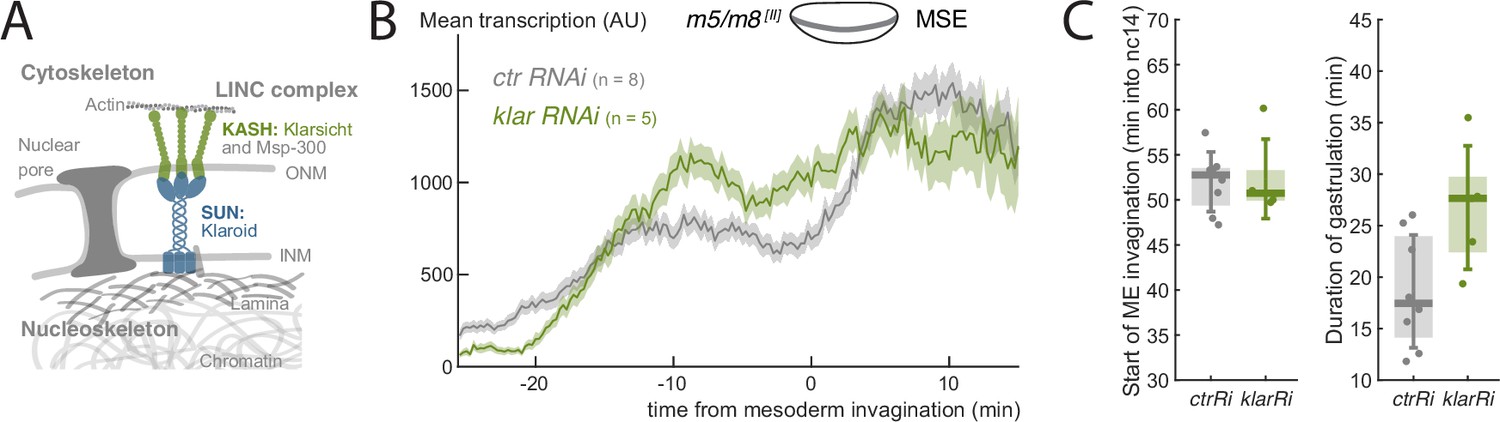
(A) Scheme depicting LINC complex that connects cytoskeleton and nucleoskeleton, Drosophila KASH and SUN proteins Klarsicht and Klaroid are highlighted. (B) Mean profile of transcription from m5/m8 [II] in klar RNAi compared to control embryos. (C) Onset of ME invagination (left) and duration of gastrulation in klar and control RNAi embryos. Boxplots show median, Q1/Q3 quartiles and SD. Control embryos are the same as shown in Figure 2 and Figure 2—figure supplement 1B.
Figure 5—figure supplement 1

Changes in cellular morphology during gastrulation do not correlate with cells that increase transcription levels or not.
(A) Still image of a video of an embryo expressing Gap43-mCherry to label cell membranes and MCP-GFP to detect m5/m8 [II] transcription. From left to right: (i) Projection of 3 µm of the Gap43-mCh channel, (ii) Projection of the whole MCP-GFP channel, (iii) overlay of i in magenta and ii in grey, (iv) tracked cell membranes and cells color coded to indicate mesoderm (purple), active mesectoderm nuclei that increase transcription levels (yellow) and active mesectoderm nuclei that do not increase transcription levels (orange). (B) Quantification of cellular properties of mesectoderm cells over time grouped by whether they increase transcription levels at the time of gastrulation or not. From left to right: (i) transcription detected in the MCP channel, (ii) cell area, (iii) eccentricity from 0 - fully circular - to 1 - straight line, (iv) length of contact of each mesectoderm cell with mesoderm cells around them. DN: dimensionless number. n=3 embryos.
Figure 5—figure supplement 2
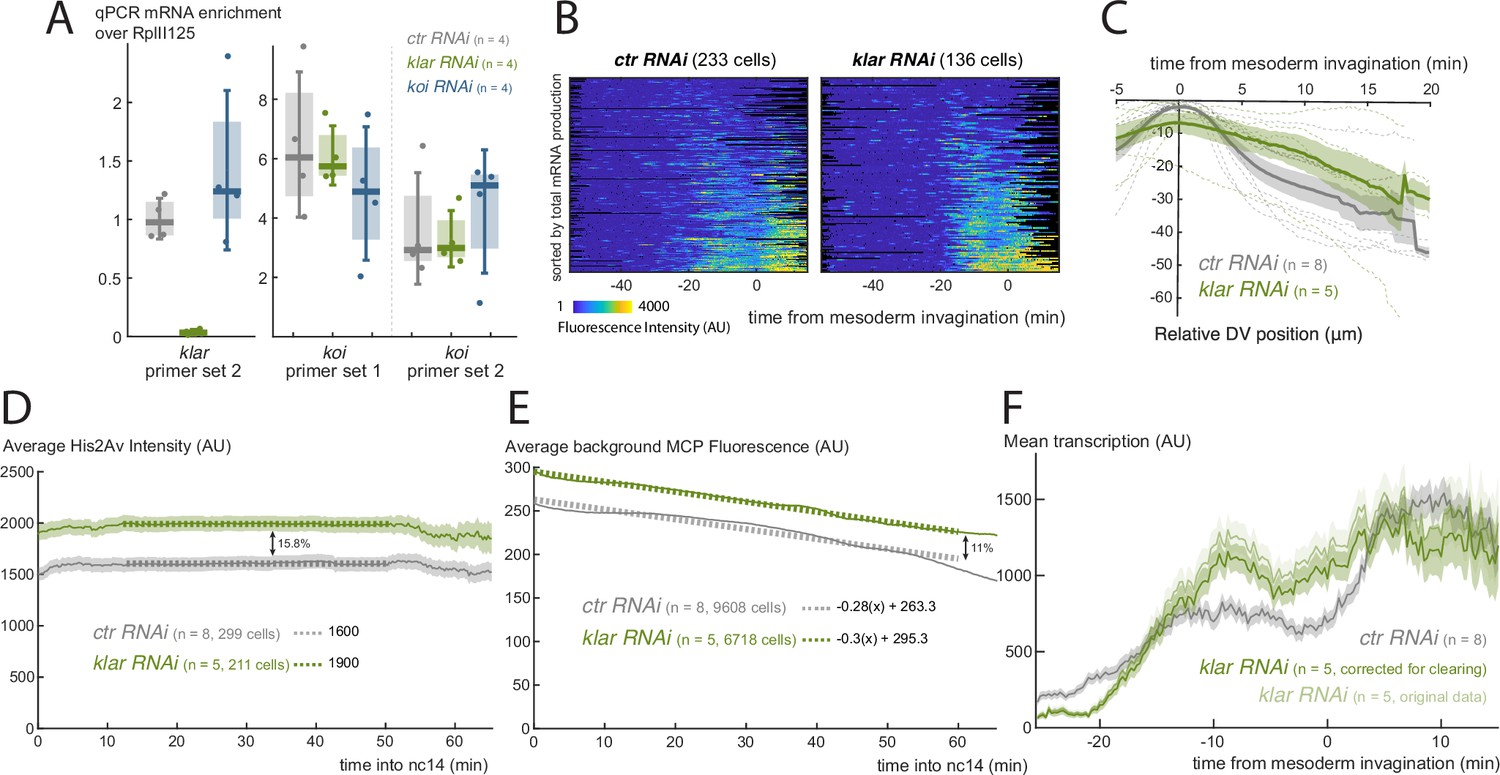
LINC complex disruption decouples gastrulation progression and changes in transcription.
(A) Quantification of klar and koi mRNA levels by RT-qPCR in pools of 15–20 eggs and/or pre nc13 embryos following control, klar or koi germline RNAi expression. n=4 biological replicates for each. (B) Heatmaps with m5/m8 [II] activity, aligned by the time of ME invagination, in klar and control RNAi embryos. (C) Movement of MSE nuclei over time in the Y axis (representing movement in the DV axis), aligned by the time of ME invagination, in klar and control RNAi embryos. Mean and SEM (solid line and shaded area) of multiple embryos shown (n embryo numbers indicated in each). Dashed lines indicate mean profiles for individual embryos. (D) Average His2Av-RFP intensity over time in control and klar RNAi embryos. (E) Average MCP-GFP intensity in nuclei without any MS2 signal over time in control and klar RNAi embryos. (F) Mean profile of transcription from m5/m8 [II] in control and klar RNAi embryos, before and after correction for increased clearing. Control embryos are the same as shown in (Figure 2—figure supplement 2) and Figure 2—figure supplement 3C.
Figure 6 with 3 supplements

Nuclear levels of Twist and chromatin properties during gastrulation.
(A) Still images from a video of an embryo expressing endogenous Twist fused to LlamaTag, which binds mCherry and allows to visualize nuclear levels of zygotically produced Twist (see C). Arrowhead indicates the position of the mesectoderm, note that Twist levels remain lower in these nuclei than in the central mesoderm. (B) Quantification of nuclear levels of Twist in mesoderm and mesectoderm during gastrulation. (C) LlamaTag approach: Twist is fused to an anti-mCherry nanobody (LlamaTag) that binds free and already fluorescent mCherry that has been maternally loaded in the embryo. (D) Still of the start of mesoderm invagination from a video of an embryo expressing the nuclear membrane marker Nup107-RFP (cyan) and MCP-GFP (grey) to quantify m5/m8 [II] transcription and mark mesectoderm nuclei (left) and segmented nuclei color-coded based on the different cell populations defined from MS2 signal (ME: mesoderm, MSE: mesectoderm, NE: neuroectoderm). Center panel shows view from the top and right panel shows lateral view. (E) Quantification of average His2Av-RFP intensity around the MS2 spot, as a proxy of chromatin compaction, over time in control and α-Cat RNAi embryos. (F) Quantification of the average MS2 spot movement (distance moved relative to the nucleus centroid / time) over time in control and α-Cat RNAi embryos. B, E and F show mean and SEM (shaded area) from all cells combined from multiple embryos (n embryo numbers indicated in each). In F, values were smoothed over time using a median filter of 8 frames (2 min).
Figure 6—figure supplement 1
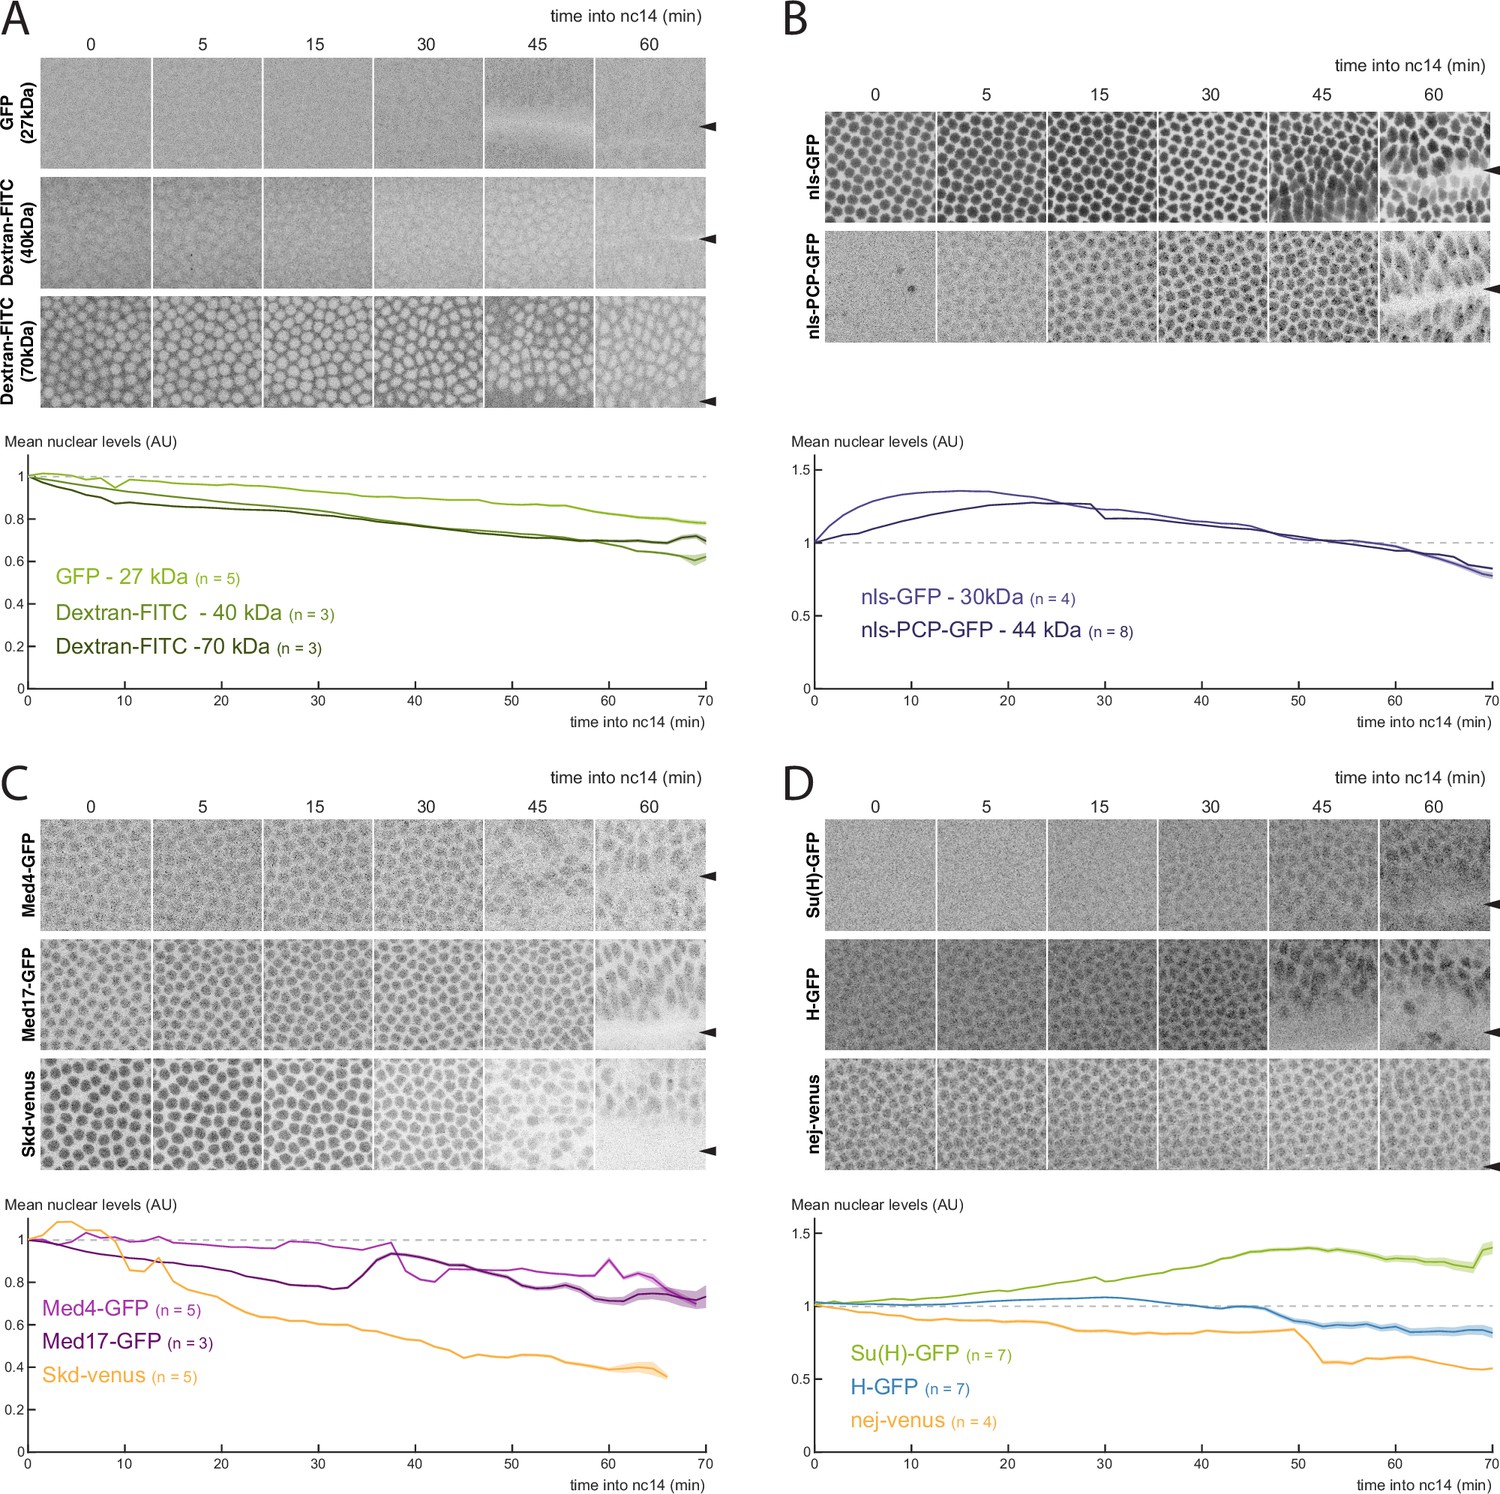
Nuclear import does not change during gastrulation.
Nuclear levels of GFP and fluorescently-tagged dextrans (A), nls-containing proteins (B), members of the mediator complex (C) and regulators of Notch signaling (D) during gastrulation. In each panel, top half shows still from videos of the fluorescent factor quantified in each condition (inverted maximum intensity projection). Arrowheads indicate position of the mesoderm invagination furrow. Bottom half shows quantification of the nuclear levels over time, showing mean and SEM (shaded area) of all cells combined from multiple embryos (n numbers shown in each).
Figure 6—figure supplement 2
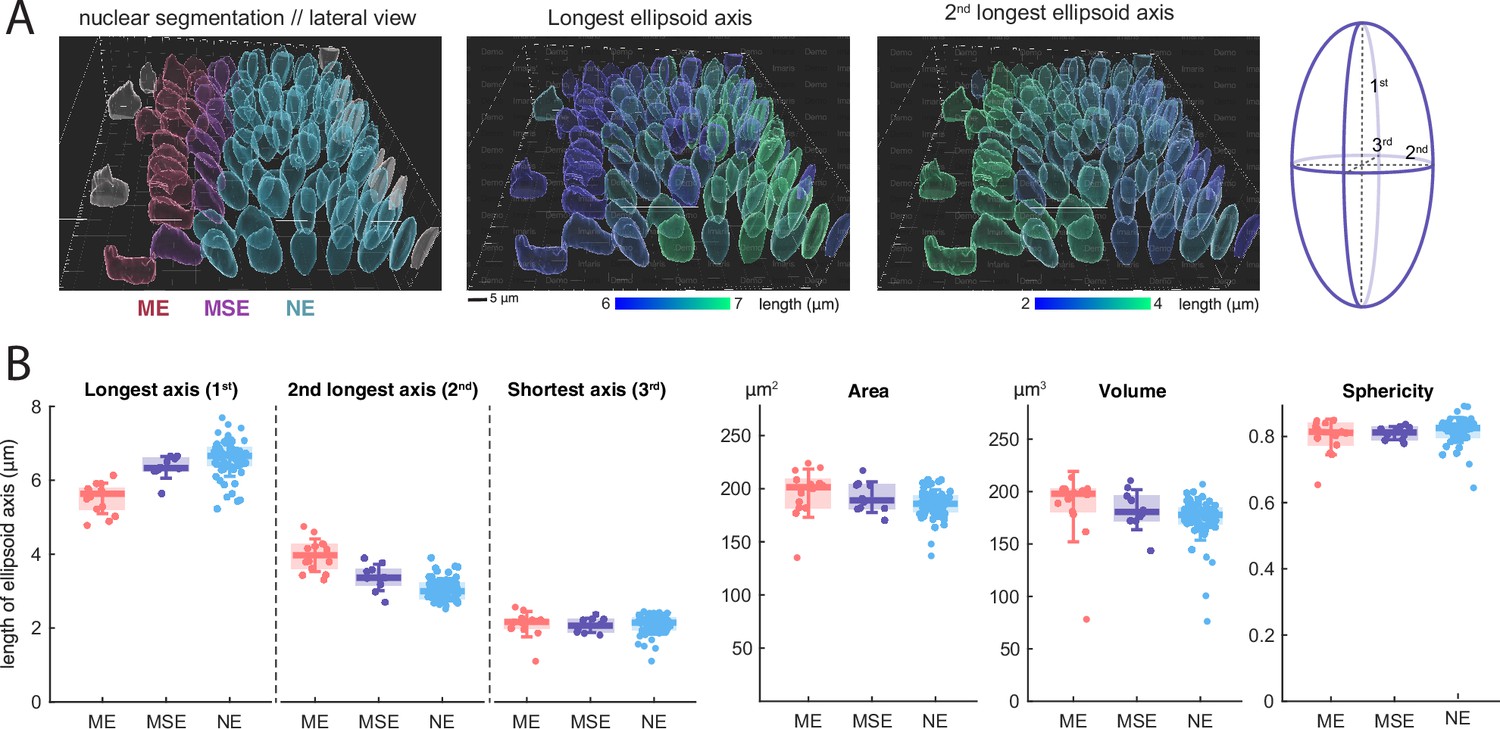
Quantification of nuclear size and shape during gastrulation.
(A) Lateral view of segmented nuclei color-coded based on the different cell populations defined from MS2 signal (ME: mesoderm, MSE: mesectoderm, NE: neuroectoderm, left) and color-coded by length of the longest ellipsoid axis (middle) and 2nd longest axis (right). (B) Quantification of morphological properties of ME, MSE, and NE nuclei at the start of mesoderm invagination. Boxplots show median, Q1/Q3 quartiles and SD.
Figure 6—figure supplement 3
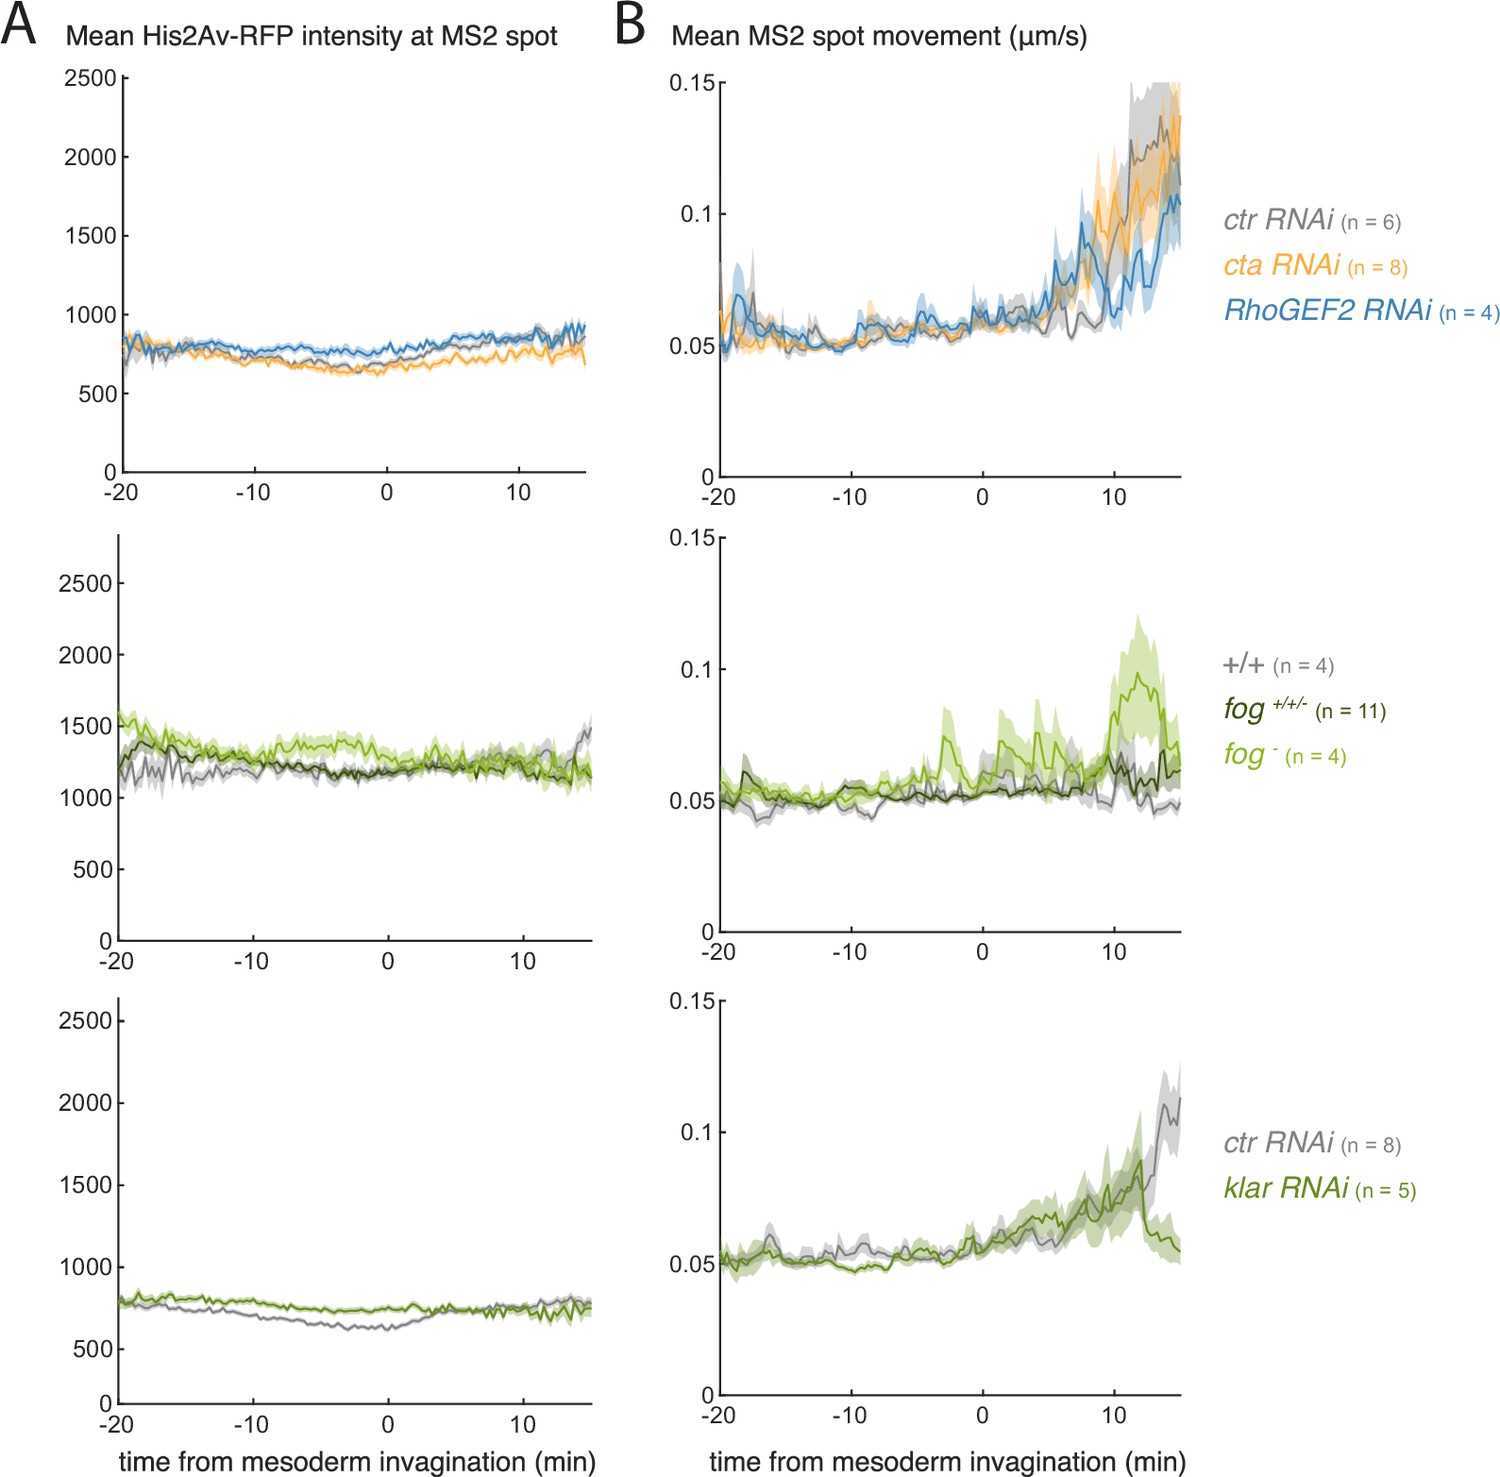
Quantification of chromatin properties during gastrulation.
(A) Quantification of average His2Av-RFP intensity around the MS2 spot, as a proxy of chromatin compaction, over time in the indicated genetic conditions. (B) Quantification of the average MS2 spot movement (distance moved relative to the nucleus centroid / time) over time in in the indicated genetic conditions. Mean and SEM (solid line and shaded area) of multiple embryos shown (n embryo numbers indicated in each). In B, values were smoothed over time using a median filter of 8 frames (2 minutes).
Author response image 1
Author response image 2
Author response image 3

Videos
Video 1
Activity of m5/m8 during gastrulation.
Video showing His2Av-RFP channel (orthogonal view, left ; and maximum intensity projection, center) and MCP-GFP channel with transcription directed by m5/m8 [II] (maximum intensity projection, right) in control embryos. The top row shows orthogonal view in the His2Av-RFP channel and maximum Y projection in the MCP-GFP channel. 0.36 µm/px XY resolution, 29x1µm slices and time resolution of 15s/frame. Anterior to the left; embryo imaged from the ventral side. Time indicates minutes from the beginning of nc14. Bottom plot shows mean transcription produced by m5/m8 [II] in this embryo, synchronized with the video to show the increase in activity occurs as the embryo undergoes gastrulation.
Video 2
Effects on gastrulation of α-Cat RNAi and fog mutant background.
Videos showing His2Av-RFP channel (orthogonal view, left; and maximum intensity projection, center) and MCP-GFP channel with transcription directed by m5/m8 [II] (maximum intensity projection, right) in α-Cat RNAi (top) and fog- (bottom) embryos. 0.36 µm/px XY resolution, 27x1µm (α-Cat RNAi) and 29 × 1µm (fog-) slices and time resolution of 15 s/frame. Anterior to the left; embryo imaged from the ventral side. Time indicates minutes from the beginning of nc14.
Video 3
Effects on gastrulation of cta and RhoGEF2 RNAi.
Videos showing His2Av-RFP channel (orthogonal view, left ; and maximum intensity projection, center) and MCP-GFP channel with transcription directed by m5/m8 [II] (maximum intensity projection, right) in cta (top) and RhoGEF2 RNAi (bottom) embryos. 0.36 µm/px XY resolution, 29x1µm slices and time resolution of 15s/frame. Anterior to the left; embryo imaged from the ventral side. Time indicates minutes from the beginning of nc14.
Video 4
Expression of vnd in control embryos.
Videos showing His2Av-RFP channel (orthogonal view, left ; and maximum intensity projection, center) and MCP-GFP channel with transcription directed by vnd (maximum intensity projection, right) in control embryos. 0.36 µm/px XY resolution, 29x1µm slices and time resolution of 15s/frame. Anterior to the left; embryo imaged from the ventral side. Time indicates minutes from the beginning of nc14.
Video 5
Expression of m5/m8 [II] upon eve2-NICD expression in control, Notch and α-Cat RNAi embryos.
Videos showing His2Av-RFP channel (orthogonal view, left ; and maximum intensity projection, center) and MCP-GFP channel with transcription directed by m5/m8 [II] (maximum intensity projection, right) in control (top), Notch (middle) and α-Cat RNAi (bottom) embryos. 0.36 µm/px XY resolution, 32x1µm slices and time resolution of 20s/frame. Anterior to the left; embryo imaged from the ventral side. Time indicates minutes from the beginning of nc14.
Video 6
Analysis of cellular shape in relation to m5/m8 activity.
From left to right, video showing: (i) membranes using the marker Gap43-mCherry (maximum intensity projection of 3 µm after surface correction), (ii) transcription from m5/m8-MS2 [II] (maximum intensity projection of the whole stack after surface correction), (iii) overlaid Gap43-mCherry (magenta) and MCP-GFP (grey) signal, (iv) tracked video showing cell boundaries (grey), cells classified as mesoderm (purple), mesectoderm cells that increase MS2 signal during gastrulation (yellow) and mesectoderm cells that do not increase (orange). 0.36 µm/px XY resolution, 36x1µm slices and time resolution of 20 s/frame. Anterior to the left; embryo imaged from the ventral side. Time indicates minutes from the beginning of nc14.
Video 7
Levels of nuclear Twist during nc14.
Video of an embryo expressing endogenous Twist fused to a LlamaTag (anti-mCherry nanobody) that binds maternally provided and fluorescenty matured mCherry. Inverted maximum intensity projection shown. 0.36 µm/px XY resolution, 34x1µm slices and time resolution of 45s/frame. Anterior to the left; embryo imaged from the ventral side. Time indicates minutes from the beginning of nc14.
Tables
Table 1
Full genotypes and sources of used Drosophila lines.
| Name (Chr) | Full genotype | Source |
|---|---|---|
| His2Av::RFP (III) | w[*];P{w[+mC]=His2Av-mRFP1}III.1 | BDSC #23650 |
| His2Av::RFP; nos-MCP::GFP | y[1] w[*]; P{w[+mC]=His2Av-mRFP1}II.2; P{w[+mC]=nos MCP.EGFP}2 | BDSC #60340 |
| His2Av::iRFP, nos-MCP::mCherry (II) | yw; nos-MCP-NoNLS-mCherry, Histone-iRFP | Eck et al., 2020; Liu et al., 2021 |
| nos-MCP::mCherry (III) | yw;; nos-MCP-NoNLS-mCherry | Liu et al., 2021 |
| vasa-mCherry (III) | yw; pCasper-vasa-mCherry | YJ. Kim, J. Zhao, HG. Garcia, unpublished results |
| Gap43::mCherry (I) | Pw[+mC]=sqhp-Gap43::mCherry | Izquierdo et al., 2018 |
| Nup107::RFP (III) | w[*]; wg[Sp-1]/CyO; P{w[+mC]=mRFP-Nup107.K}7.1 | BDSC #35517 |
| αTub-Gal4::VP16 (II) | w[*]; P{w[+mC]=matalpha4-GAL-VP16}V2H | BDSC #7062 |
| ovo-FLP (I) | P{w[+mC]=ovo FLP.R}M1A, w[*] | BDSC #8727 |
| betaTub85D-FLP (I) | P{ry[+t7.2]=betaTub85D-FLP}1; ry[506] | BDSC #7196 |
| m5/m8-MS2 (II) | w; P{w[+mC]=m5/m8-peve-24xMS2-lacZ-SV40}attP40 | Falo-Sanjuan et al., 2019 |
| vnd-MS2 (II) | w; P{w[+mC]=vndEEE-peve-24xMS2-lacZ-SV40}attP40 | This study |
| eve2-NICD (II) | w; P{w[+mC]=2xeve2*-FRT-STOP-FRT-NICD-eve3’UTR}attP51D | Falo-Sanjuan et al., 2019 |
| Twi-RedLlamaTag (II) | y[1] w[1,118]; Twi-JB10 /CyO; | Bothma et al., 2018 |
| fog[S4] (I) | y[1]() fog[S4]/FM7c | BDSC #2100 |
| w RNAi Valium22 (III) | y[1] sc[*] v[1]; P{y[+t7.7] v[+t1.8]=TRiP .GL00094}attP2 | BDSC #35573 |
| α-Cat RNAi Valium20 (III) | y[1] sc[*] v[1] sev[21](); P{y[+t7.7] v[+t1.8]=TRiP.HMS00317}attP2 | BDSC #33430 |
| cta RNAi Valium20 (II) | y[1]() sc[*] v[1]; P{y[+t7.7] v[+t1.8]=TRiP.HMC03421}attP40 | BDSC #51848 |
| RhoGEF2 RNAi Valium20 (III) | y[1] sc[*] v[1]; P{y[+t7.7] v[+t1.8]=TRiP.HMS01118}attP2 | BDSC #34643 |
| Notch RNAi Valium20 (III) | y[1] v[1]; P{y[+t7.7] v[+t1.8]=TRiP.HMS00009}attP2 | BDSC #33616 |
| zld RNAi Valium20 (II) | y[1] sc[*] v[1]; P{y[+t7.7] v[+t1.8]=TRiP.HMS02441}attP40 | BDSC #42016 |
| grh RNAi Valium22 (III) | y[1] sc[*] v[1]; P{y[+t7.7] v[+t1.8]=TRiP .GL01069}attP2 | BDSC #36890 |
| klar RNAi Valium20 (III) | y[1] sc[*] v[1] sev[21]; P{y[+t7.7] v[+t1.8]=TRiP.HMS01612}attP2 | BDSC #36721 |
| koi RNAi Valium20 (II) | y[1] sc[*] v[1] sev[21]; P{y[+t7.7] v[+t1.8]=TRiP.HMS02172}attP40 | BDSC #40924 |
| lamC RNAi Valium20 (II) | y[1] sc[*] v[1] sev[21]; P{y[+t7.7] v[+t1.8]=TRiP.HMC04816}attP40 | BDSC #57501 |
| zld::GFP (III) | w[1,118]; PBac{y[+mDint2] w[+mC]=zld GFP.FPTB}VK00033 /TM3, Sb[1] | BDSC #51350 |
| Su(H)::GFP (III) | M{Su(H).WT.EGFP}attP86F | Gomez-Lamarca et al., 2018 |
| H::GFP (II) | M{H.WT.EGFP}51D | Gomez-Lamarca et al., 2018 |
| nej::venus | w[1,118] PBac{602 .P.SVS-1}nejCPTI000727 | Kyoto #115119 |
| Med4::GFP | PBac{fTRG00975.sfGFP-TVPTBF}VK00002 | VDRC #v318702 |
| Med17:GFP | PBac{fTRG00979.sfGFP-TVPTBF}VK00002 | VDRC #v318704 |
| skd::venus | w[1,118]; PBac{681 .P.FSVS-1}skdCPTI001170 | Kyoto #115130 |
| vasa-eGFP (III) | yw; pCasper-vasa-eGFP | Kim et al., 2021 |
| hs-FLP;; ubi-nls::GFP, FRT80E | Pry[+t7.2]=hsFLP22, y[1] w[*]; Kr[If-1]/CyO; Pw[+mC]=Ubi-GFP(S65T)nls3L PBacw[+mC]=WHND-MLRQ[f00651] | BDSC #76329 |
| nos-nls::PCP::GFP | Courtesy from Tim Weil and Liz Gavis |
Table 2
Crosses to obtain embryos used in each experiment.
| Cross | Figure |
|---|---|
| ♀ His2Av::RFP; nos-MCP::GFP x ♂ m5/m8-peve-MS2-lacZ-SV40[attP40,II] Falo-Sanjuan et al., 2019 | (Figure 1, Figure 1—figure supplement 1) |
| ♀ His2Av::RFP; nos-MCP::GFP x ♂ m5/m8-peve-MS2-lacZ-SV40[attP2,III] Falo-Sanjuan et al., 2019 | Figure 1—figure supplement 1 |
| ♀ His2Av::RFP; nos-MCP::GFP x ♂ sim-peve-MS2-lacZ-SV40[attP40,II] Falo-Sanjuan et al., 2019 | Figure 1—figure supplement 1 |
| ♀ His2Av::RFP; nos-MCP::GFP x ♂ m5/m8-pm7-MS2-lacZ-SV40[attP40,II] Falo-Sanjuan et al., 2019 | Figure 1—figure supplement 1 |
| ♀ His2Av::RFP; nos-MCP::GFP x ♂ m5/m8-psimE-MS2-lacZ-SV40[attP40,II] Falo-Sanjuan et al., 2019 | Figure 1—figure supplement 1 |
| ♀ αTub-Gal4::VP16 / +; His2Av::RFP, nos-MCP::GFP / UASp-w RNAi ♂ m5/m8-peve-MS2-lacZ-SV40[attP40,II] | Figures 2; 5; 6, Figure 2—figure supplements 1; 2; 4, Figure 3—figure supplement 1, Figure 5—figure supplement 2, Figure 6—figure supplement 3 |
| ♀ αTub-Gal4::VP16 / +; His2Av::RFP, nos-MCP::GFP / UASp-α-Cat RNAi ♂ m5/m8-peve-MS2-lacZ-SV40[attP40,II] | Figures 2; 6, Figure 2—figure supplements 1; 2 |
| ♀ His2Av::RFP, nos-MCP::GFP (III) x ♂ m5/m8-peve-MS2-lacZ-SV40[attP40,II] | Figure 2, Figure 2—figure supplements 1; 2, Figure 6—figure supplement 3 |
| ♀ fog[S4] / FM6;; His2Av::RFP, nos-MCP::GFP x ♂ m5/m8-peve-MS2-lacZ-SV40[attP40,II] | Figure 2, Figure 2—figure supplements 1; 2, Figure 6—figure supplement 3 |
| ♀ αTub-Gal4::VP16 / UASpcta RNAi; His2Av::RFP, nos-MCP::GFP / + ♂ m5/m8-peve-MS2-lacZ-SV40[attP40,II] | Figure 2, (Figure 2—figure supplements 1; 2) , Figure 6—figure supplement 3 |
| ♀ αTub-Gal4::VP16 / +; His2Av::RFP, nos-MCP::GFP / UASp-RhoGEF2 RNAi ♂ m5/m8-peve-MS2-lacZ-SV40[attP40,II] | Figure 2, (Figure 2—figure supplements 1; 2) , Figure 6—figure supplement 3 |
| ♀ αTub-Gal4::VP16 / +; His2Av::RFP, nos-MCP::GFP / UASp-w RNAi ♂ m5/m8-peve-MS2-lacZ-SV40[attP2,III] Falo-Sanjuan and Bray, 2021 | Figure 2—figure supplement 3 |
| ♀ αTub-Gal4::VP16 / +; His2Av::RFP, nos-MCP::GFP / UASp-α-Cat RNAi ♂ m5/m8-peve-MS2-lacZ-SV40[attP2,III] Falo-Sanjuan and Bray, 2021 | Figure 2—figure supplement 3 |
| ♀ αTub-Gal4::VP16 / +; His2Av::RFP, nos-MCP::GFP / UASp-w RNAi ♂ sim-peve-MS2-lacZ-SV40[attP40,II] | Figure 2—figure supplement 3 |
| ♀ αTub-Gal4::VP16 / +; His2Av::RFP, nos-MCP::GFP / UASp-α-Cat RNAi ♂ sim-peve-MS2-lacZ-SV40[attP40,II] | Figure 2—figure supplement 3 |
| ♀ αTub-Gal4::VP16 / UASpzld RNAi; His2Av::RFP, nos-MCP::GFP / + ♂ m5/m8-peve-MS2-lacZ-SV40[attP40,II] | Figure 2—figure supplement 4 |
| ♀ αTub-Gal4::VP16 / +; His2Av::RFP, nos-MCP::GFP / UASp-grh RNAi ♂ m5/m8-peve-MS2-lacZ-SV40[attP40,II] | Figure 2—figure supplement 4 |
| ♀ x ♂ αTub-Gal4::VP16 / +; zld::GFP / UASp-w RNAi | Figure 2—figure supplement 4 |
| ♀ x ♂ αTub-Gal4::VP16 / UASpzld RNAi; zld::GFP / + | Figure 2—figure supplement 4 |
| ♀ His2Av::RFP, nos-MCP::GFP (III) x ♂ vndEEE-peve-MS2-lacZ-SV40[attP40,II] | Figure 3, Figure 3—figure supplement 1 |
| ♀ αTub-Gal4::VP16 /+; His2Av::RFP, nos-MCP::GFP / UASp-w RNAi ♂ vndEEE-peve-MS2-lacZ-SV40[attP40,II] | Figure 3, Figure 3—figure supplement 1 |
| ♀ αTub-Gal4::VP16 / +; His2Av::RFP, nos-MCP::GFP / UASp-α-Cat RNAi ♂ vndEEE-peve-MS2-lacZ-SV40[attP40,II] | Figure 3, Figure 3—figure supplement 1 |
| ♀ αTub-Gal4::VP16 / +; His2Av::RFP, nos-MCP::GFP / UASp-Notch RNAi ♂ m5/m8-peve-MS2-lacZ-SV40[attP40,II] | Figure 3—figure supplement 1 |
| ♀ αTub-Gal4::VP16 / +; His2Av::RFP, nos-MCP::GFP / UASp-Notch RNAi ♂ vndEEE-peve-MS2-lacZ-SV40[attP40,II] | Figure 3, Figure 3—figure supplement 1 |
| ♀ fog[S4] / FM6 ;; His2Av::RFP, nos-MCP::GFP x ♂ vndEEE-peve-MS2-lacZ-SV40[attP40,II] | Figure 3, Figure 3—figure supplement 1 |
| ♀ ovo-FLP / +; eve2-FRT-STOP-FRT-NICD / +; His2Av::RFP, nos-MCP::GFP / + ♂ m5/m8-peve-MS2-lacZ-SV40[attP40,II] | Figure 4, Figure 4—figure supplement 1 |
| ♀ ovo-FLP / fog[S4]; eve2-FRT-STOP-FRT-NICD / +; His2Av::RFP, nos-MCP::GFP / + ♂ m5/m8-peve-MS2-lacZ-SV40[attP40,II] | Figure 4, Figure 4—figure supplement 1 |
| ♀ αTub-Gal4::VP16 / +; His2Av::RFP, nos-MCP::GFP / UASp-w RNAi ♂ βTub85D-FLP; m5/m8-peve-MS2-lacZ-SV40, eve2-FRT-STOP-FRT-NICD / + | Figure 4, Figure 4—figure supplement 1 |
| ♀ αTub-Gal4::VP16 / +; His2Av::RFP, nos-MCP::GFP / UASp-Notch RNAi ♂ βTub85D-FLP; m5/m8-peve-MS2-lacZ-SV40, eve2-FRT-STOP-FRT-NICD / + | Figure 4, Figure 4—figure supplement 1 |
| ♀ αTub-Gal4::VP16 / +; His2Av::RFP, nos-MCP::GFP / UASp-α-Cat RNAi ♂ βTub85D-FLP; m5/m8-peve-MS2-lacZ-SV40, eve2-FRT-STOP-FRT-NICD / + | Figure 4, Figure 4—figure supplement 1 |
| ♀ αTub-Gal4::VP16 / +; His2Av::RFP, nos-MCP::GFP / UASp-klar RNAi ♂ m5/m8-peve-MS2-lacZ-SV40[attP40,II] | Figure 5 |
| ♀ x ♂ αTub-Gal4::VP16 / +; UASp-w RNAi / + (for qPCR) | Figure 5—figure supplement 2 |
| ♀ x ♂ αTub-Gal4::VP16 / UASpkoi RNAi; +/+ (for qPCR) | Figure 5—figure supplement 2 |
| ♀ x ♂ αTub-Gal4::VP16 / +; UASp-klar RNAi / + (for qPCR) | Figure 5—figure supplement 2 |
| ♀ Gap43::mCherry; nos-MCP::GFP x ♂ m5/m8-peve-MS2-lacZ-SV40[attP40,II] Falo-Sanjuan and Bray, 2021 | Figure 5—figure supplement 1 |
| ♀ x ♂ His2Av::iRFP, nos-MCP::mCherry / CyO; nos-MCP::mCherry, vasa-eGFP | Figure 6—figure supplement 1 |
| ♀ x ♂ ubi-nls::GFP, FRT80E | Figure 6—figure supplement 1 |
| ♀ x ♂ nos-nls::PCP::GFP | Figure 6—figure supplement 1 |
| ♀ x ♂ His2Av::RFP / + (dextran injected) | Figure 6—figure supplement 1 |
| ♀ x ♂ med4-GFP | Figure 6—figure supplement 1 |
| ♀ x ♂ med30-GFP | Figure 6—figure supplement 1 |
| ♀ x ♂ skd-venus | Figure 6—figure supplement 1 |
| ♀ His2Av::iRFP, nos-MCP::mCherry / CyO; nos-MCP::mCherry, Su(H)::GFP ♂ m5/m8-peve-MS2-lacZ-SV40[attP40,II] | Figure 6—figure supplement 1 |
| ♀ x ♂ H::GFP; His2Av::RFP | Figure 6—figure supplement 1 |
| ♀ x ♂ nej-venus | Figure 6—figure supplement 1 |
| ♀ Vasa-mCherry (III) x ♂ Twi-JB10/CyO | Figure 6 |
| ♀ Nup107::RFP, nos-MCP::GFP x ♂ m5/m8-peve-MS2-lacZ-SV40[attP40,II] | Figure 6, Figure 6—figure supplement 2 |
Table 3
Primers used for qPCR.
| Primer | Sequence |
|---|---|
| klar FWD 1 | GTCTTGCCAAGACATGGATG |
| klar REV 1 | GGCTGGTCGACTGAATCTTG |
| koi FWD 1 | AGCTGGAGACCACACAAAAC |
| koi REV 1 | CGTCTTGGGAGTTTTGTTCC |
| koi FWD 2 | GGAACAAAACTCCCAAGACG |
| koi REV 2 | TCTGCTGGACCATGTAGTTG |
| RpII215 FWD | GACTCGACTGGAATTGCACC |
| RpII215 FWD | TCTTCATCGGGATACTCGCC |
Additional files
-
Transparent reporting form
- https://cdn.elifesciences.org/articles/73656/elife-73656-transrepform1-v2.docx
-
Source data 1
Numerical data plotted in all figures shown in the paper (fluorescence plots, heatmaps, boxplots and correlation plots). Figure, genotypes and axis indicated in each text file.
- https://cdn.elifesciences.org/articles/73656/elife-73656-data1-v2.zip
Download links
A two-part list of links to download the article, or parts of the article, in various formats.
Downloads (link to download the article as PDF)
Open citations (links to open the citations from this article in various online reference manager services)
Cite this article (links to download the citations from this article in formats compatible with various reference manager tools)
Notch-dependent and -independent transcription are modulated by tissue movements at gastrulation
eLife 11:e73656.
https://doi.org/10.7554/eLife.73656


