Parallel evolution of Pseudomonas aeruginosa phage resistance and virulence loss in response to phage treatment in vivo and in vitro
- College of Life and Environmental Sciences, Environment and Sustainability Institute, University of Exeter, United Kingdom
- Department of Biology, University of York, United Kingdom
- Laboratory for Molecular and Cellular Technology, Queen Astrid Military Hospital, Belgium
Figures
Figure 1
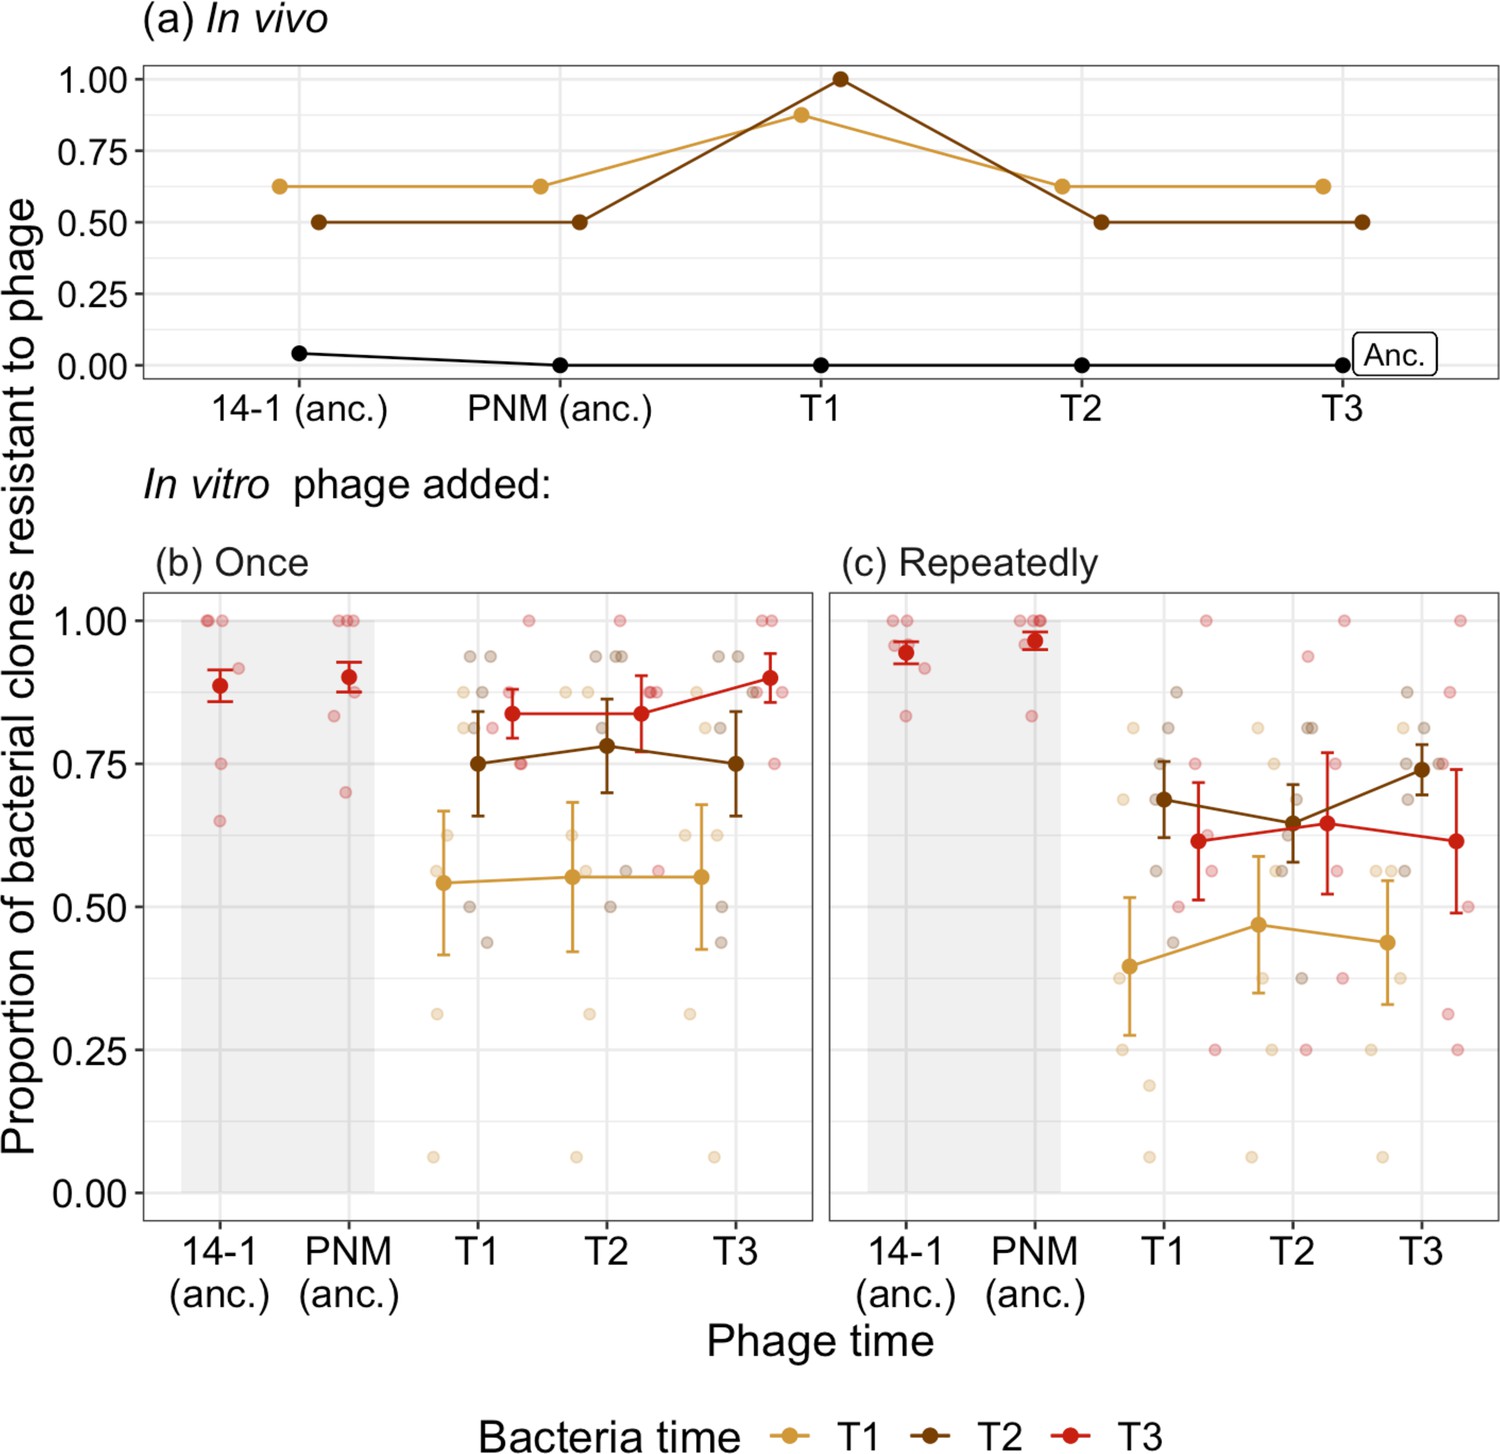
Time-shift assays of bacterial evolution and phage during phage therapy.
The proportion of phage resistant bacterial isolates from (a) ancestral (pre-phage therapy, “Anc.”), and days 2 (T1) and 4 (T2) of in vivo (clinical) phage therapy (n=8) tested against ancestral phage (‘anc.’: 14–1 and PNM) and phage isolates from days 2 (T1), 4 (T2), and 7 (T3). The same ancestral bacterial isolates are evolved in vitro with phage added either (b) once, at the start of the experiment for comparison to (c) in which phage is added repeatedly, emulating clinical treatment. For (b) and (c), the proportion of bacterial isolates susceptible to phage at three time points (T1–T3: days 4, 8, and 12 of coevolution) is presented with small points as independent treatment replicates. Resistance of bacteria isolated at T3 to ancestral phage (anc.: 14–1 and PNM) is indicated within the shaded region, note that these isolates are distinct from those tested against phage from T1–T3. Filled points are the mean proportion of resistant isolates across replicates. Bars=±SE.
Figure 2
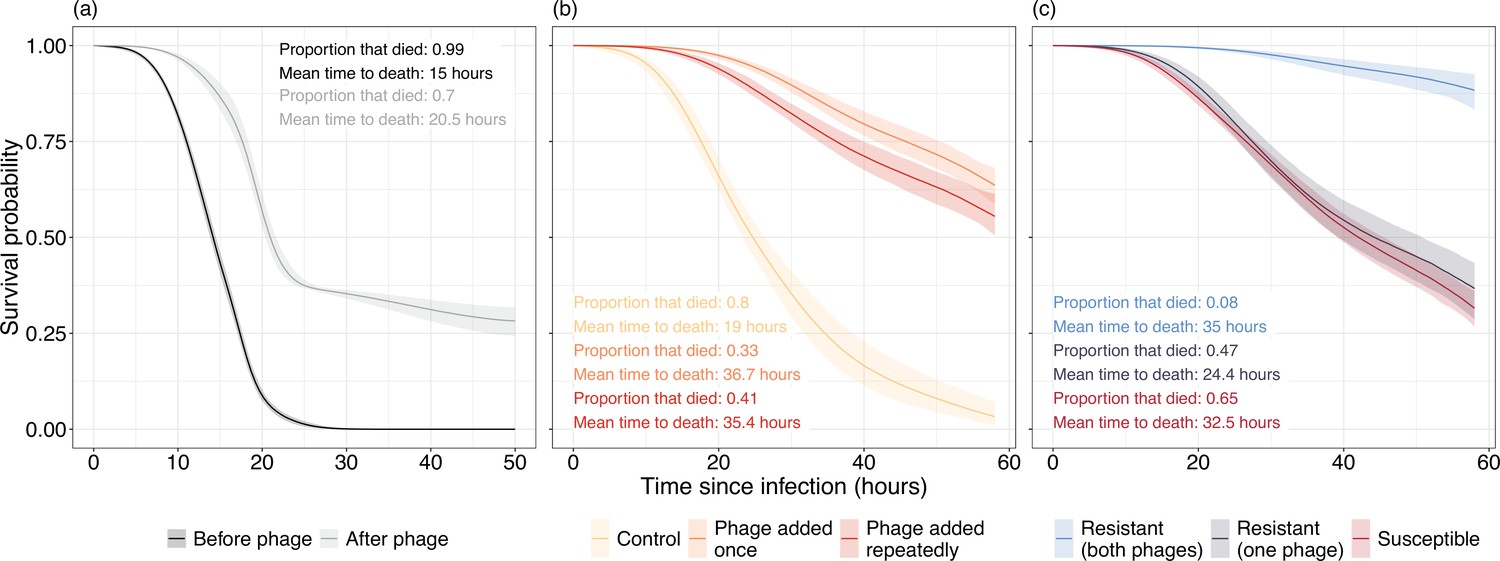
Survival curves of Galleria mellonella inoculated with Pseudomonas aeruginosa isolates isolated (a) in vivo and (b, c) in vitro.
(a) Virulence of bacterial isolates isolated from before (black) and after (gray) phage therapy. (b) Virulence of bacteria in control populations where no phage is present (yellow) is much greater than populations that were exposed to either a single (orange) or repeated (red) phage applications. (c) Virulence is significantly reduced in bacterial isolates resistant to both phages while bacteria resistant to one phage are nonsignificantly different in virulence to phage susceptible isolates. Lines represent the average prediction and shaded bands represent the 95% credible intervals of those predictions. Proportion and mean time to death of G. mellonella that died are presented as summary statistics for each treatment.
Figure 3 with 1 supplement

Phenotypic changes underpinning the resistance—virulence trade-off of bacterial populations.
Populations were evolved (a, c) in vivo and (b, d) in vitro. (a, b) Changes in bacterial growth were estimated for populations isolated (a) before and after phage treatment, and (b) between control and the phage treatment groups. Single points represent individual bacterial isolates of differing phage resistance levels: resistant to both phages (light blue), resistant to 14–1 or PNM (dark blue), or phage susceptible (red). Tops and bottoms of the bars represent the 75th and 25th percentiles of the data, the middle lines are the medians, and the whiskers extend from their respective hinge to the smallest or largest value no further than 1.5* interquartile range.
Figure 3—figure supplement 1
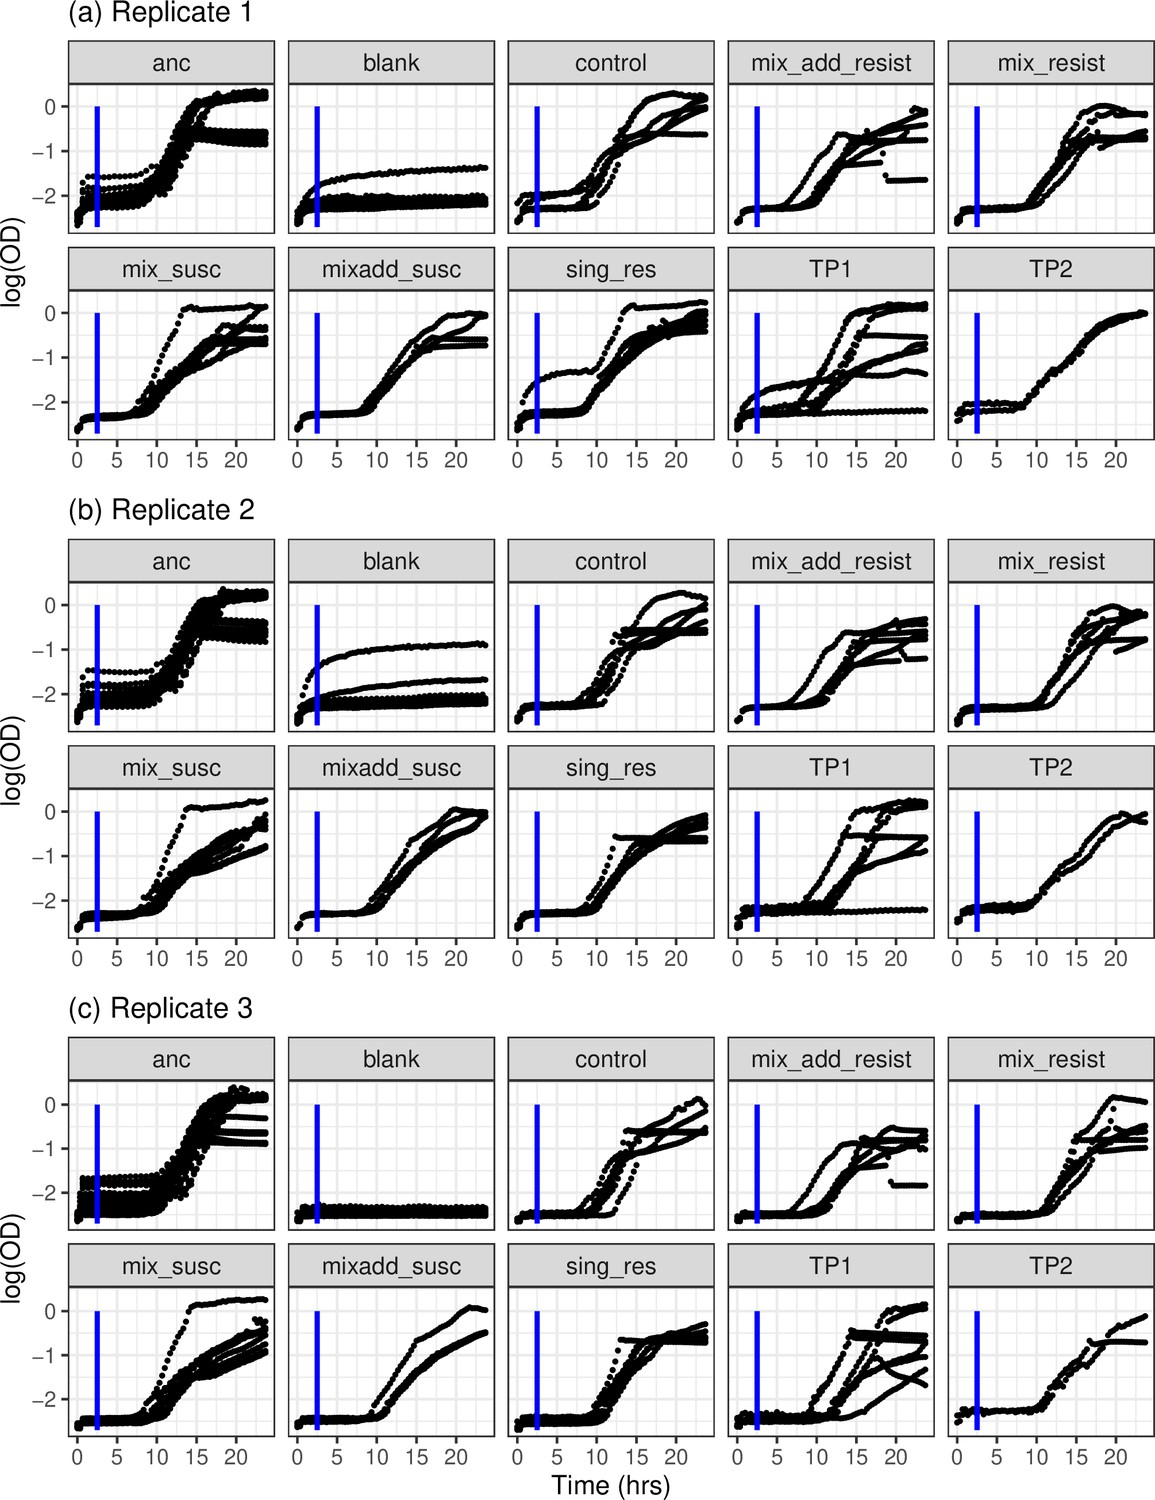
Growth curves of bacterial clones as measured by change in log-transformed ocular density (OD600) over time (hr).
Measures from the first 2.5 hr were excluded (blue line) as a rise in OD was observed independent of bacterial logistic growth which may skew the rolling regression process. Growth curves were independently replicated a total of three times (a–c) owing to cellular clumping which may have skewed OD measures. (‘anc’=ancestral clones; ‘blank’=uninoculated wells; ‘control’=control clones; ‘mix add’=clones from repeated phage treatment; ‘mix’=clones from treatment where phage were added once; ‘resist’=phage resistant clones; ‘susc’=susceptible clones; ‘sing_res’=in vitro clones resistant to one phage; ‘TP1’=in vivo clones from day 2; ‘TP2’=in vivo clones from day 4).
Figure 4
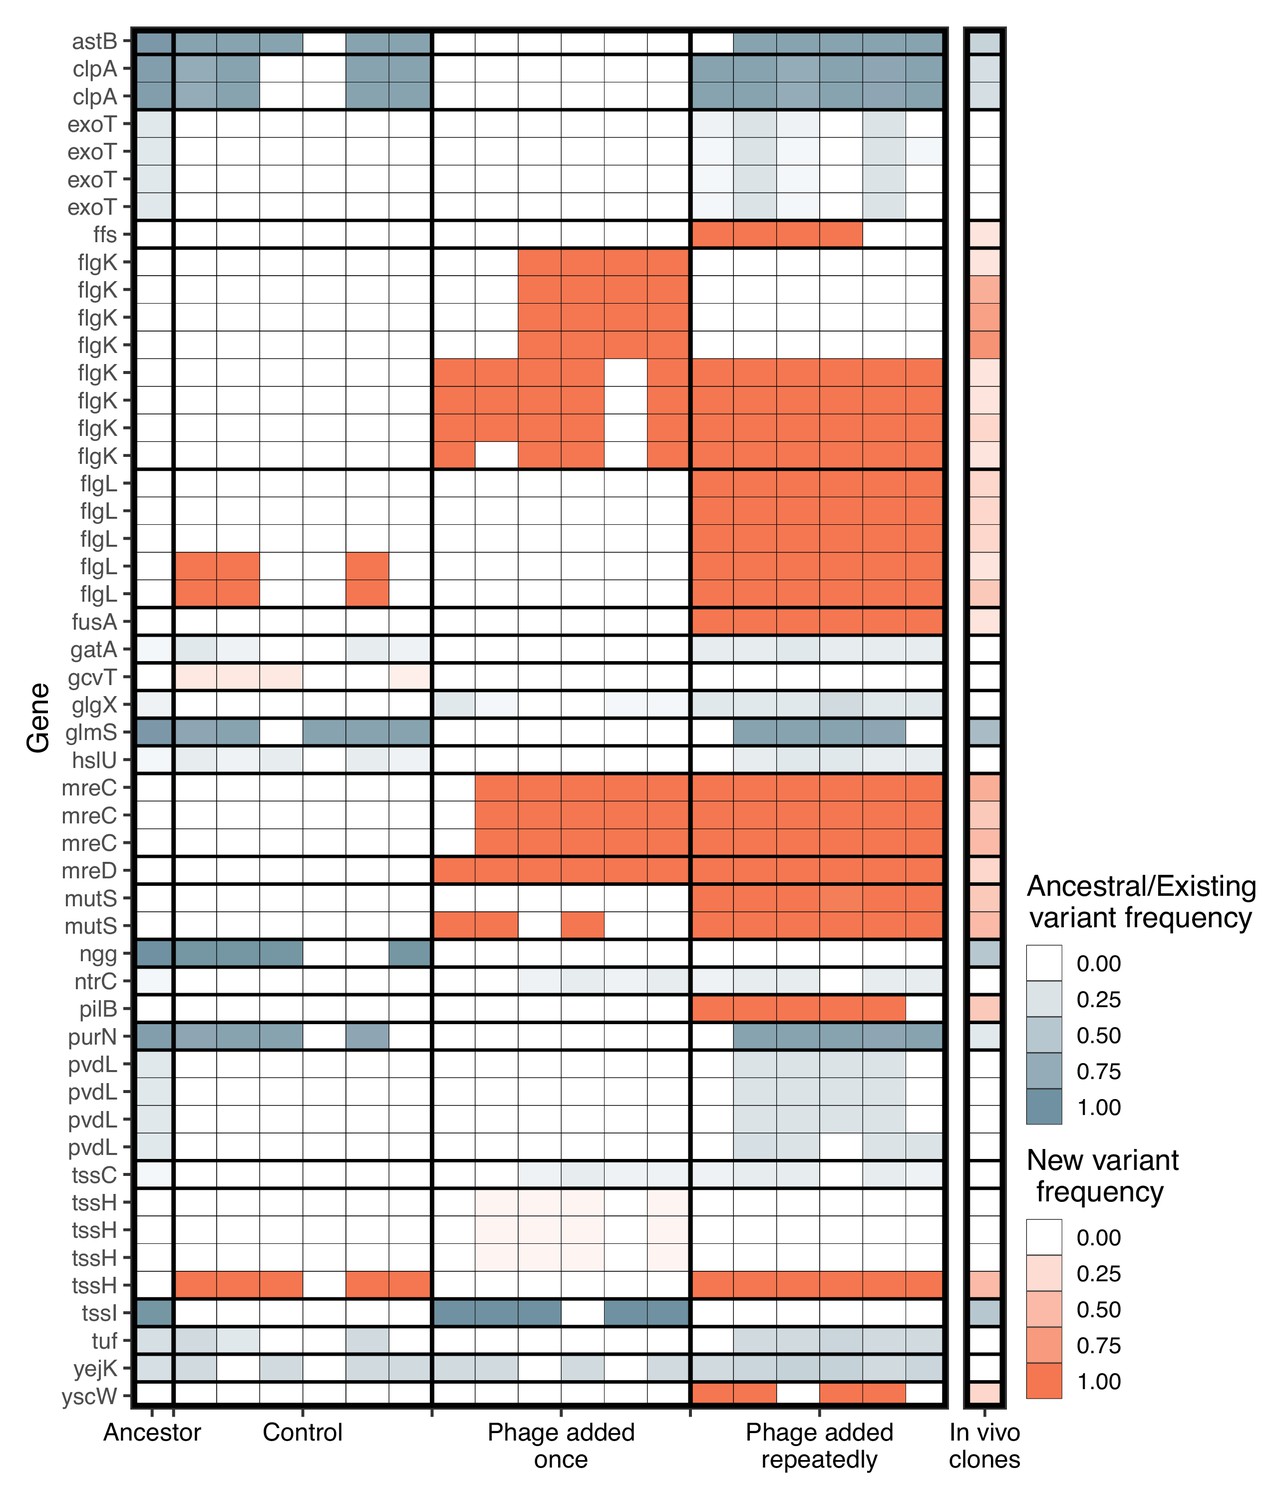
Significant genetic changes identified in vitro and in vivo.
The frequency of genes that differed significantly between treatments in vitro is shown. Genetic changes that were already present in the ancestral population (first column) are shown in blue, while de novo mutations are in orange. Only genes whose function was identified are included. Multiple rows of the same gene indicate different genomic variants of the same gene. Colour intensity shows how frequent the genetic change is in the population. For in vitro treatments, each column is an independent replicate representing the results of the pooled sequencing. For the in vivo isolates (final column), all isolates were pooled to visualize the frequency of each genetic change in vivo.
Figure 5 with 2 supplements
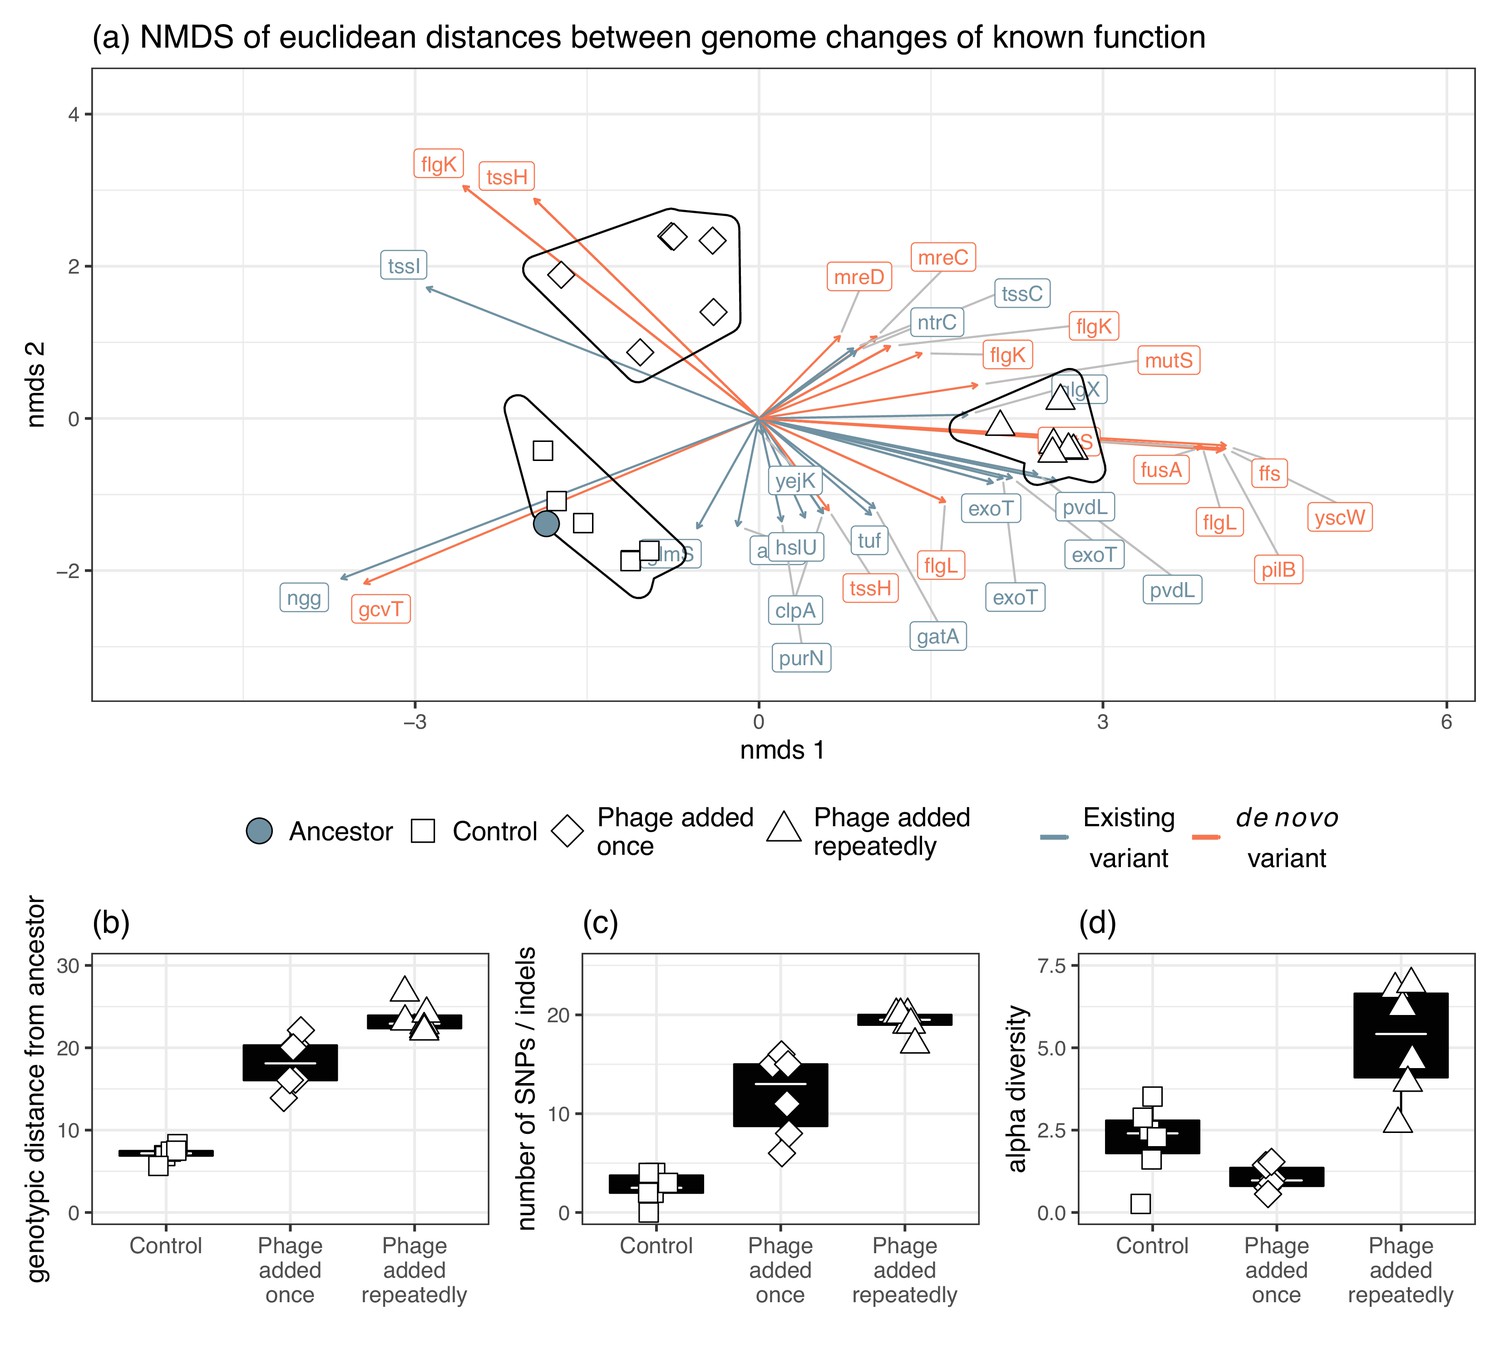
Genomic changes for populations evolved in vitro.
(a) The divergence of each treatment group as indicated by Euclidean distances of each gene from the ancestral isolates. Genetic changes were characterized as a change in frequency of an existing gene in the ancestor or selection on a mutation that was gained during experimental evolution. The presence of phage significantly affected (b) genotypic distance from the ancestor, (c) the number of new SNPs, and (d) alpha diversity.
Figure 5—figure supplement 1
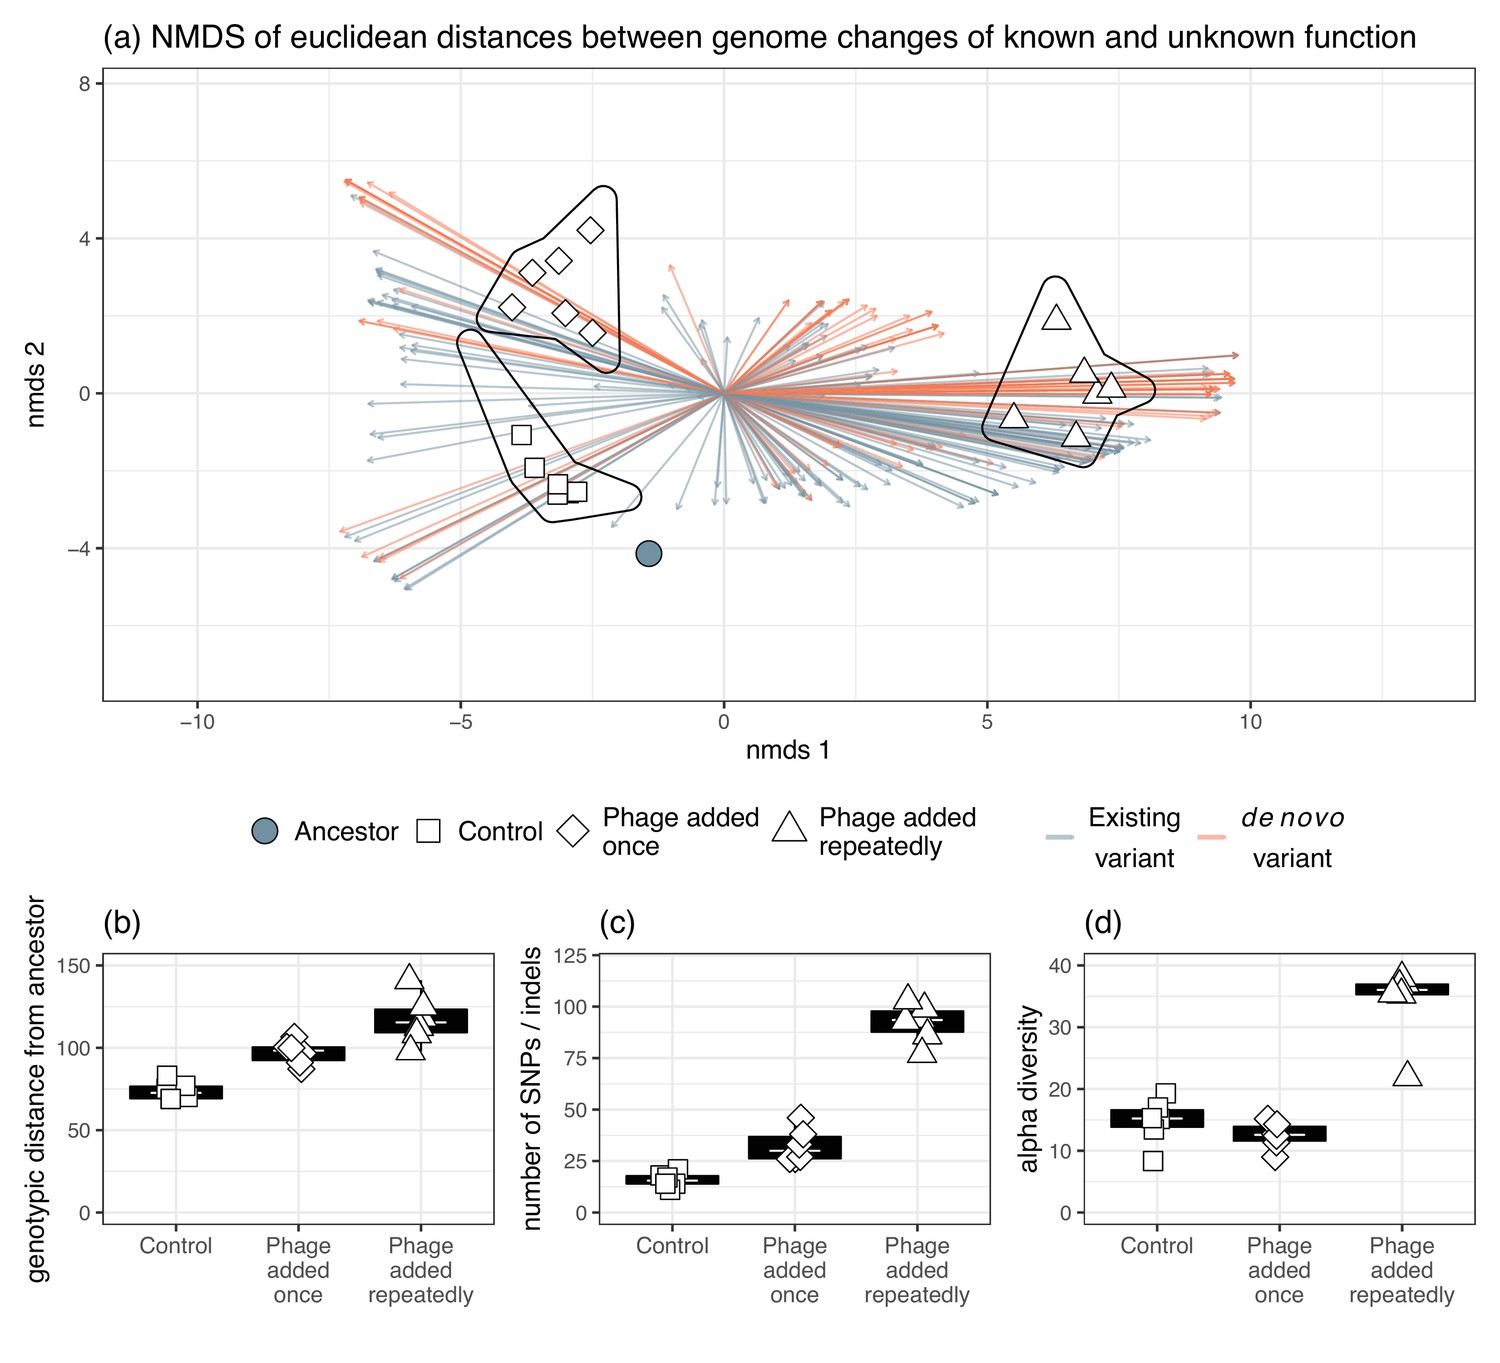
Genomic changes for populations evolved in vitro, including genetic variants occurring in genes of known and unknown function.
(a) The divergence of each treatment group as indicated by Euclidean distances of each gene from the ancestral isolates. Genetic changes were characterized as a change in frequency of an existing gene in the ancestor or selection on a mutation that was gained during experimental evolution. The presence of phage significantly affected (b) genotypic distance from the ancestor, (c) the number of new SNPs, and (d) alpha diversity.
Figure 5—figure supplement 2
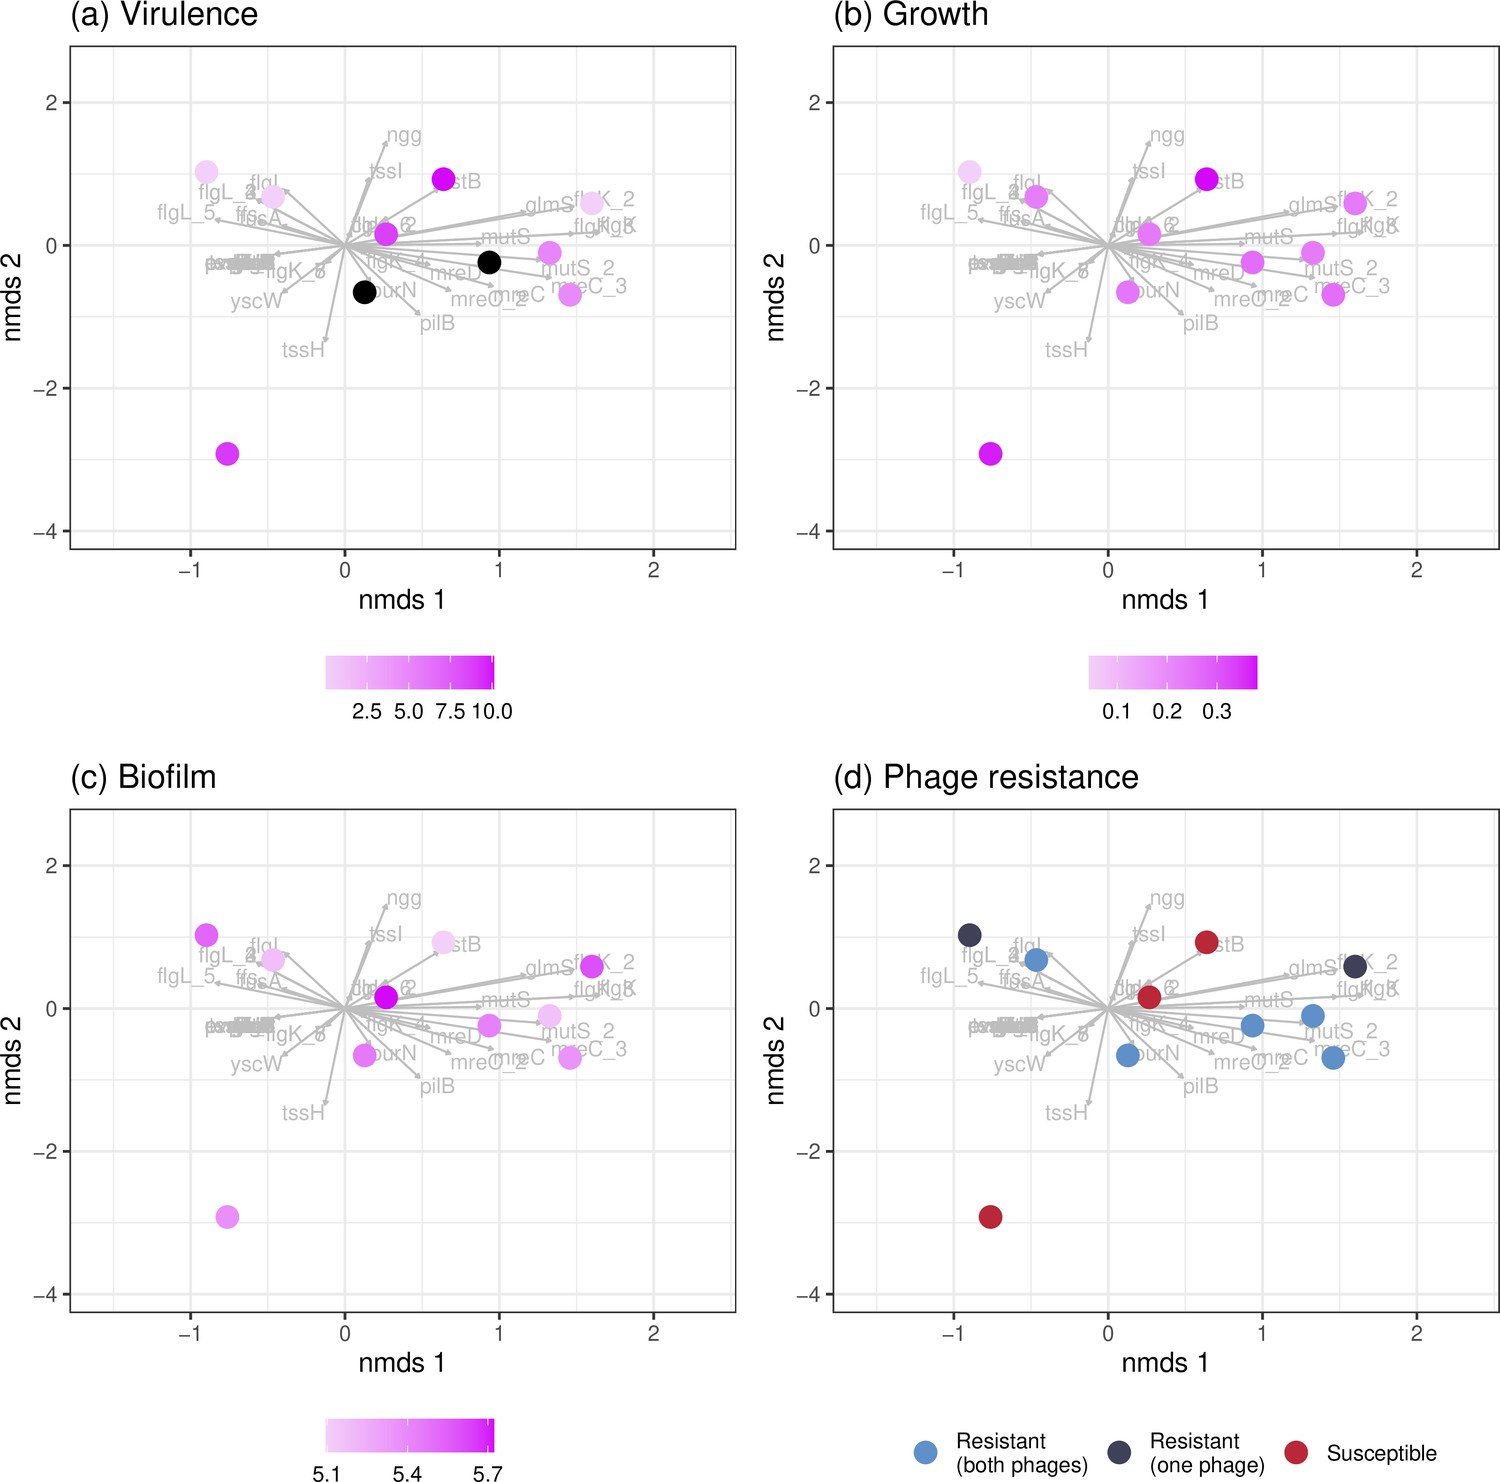
Associations between genetic similarity and phenotypic traits for in vivo clones.
Individual points represent individual clones isolated at day 2 (n=8) and day 4 (n=2) of phage treatment. Genes that diverged in frequency in vitro from the ancestor are indicated in gray while in vivo clones are overlayed according to their individual genetic make-up. Across quantitative (a–c) and qualitative (d) phenotypic traits, no clustering in genotypes and clones of particular phenotypes is observed.
Figure 6
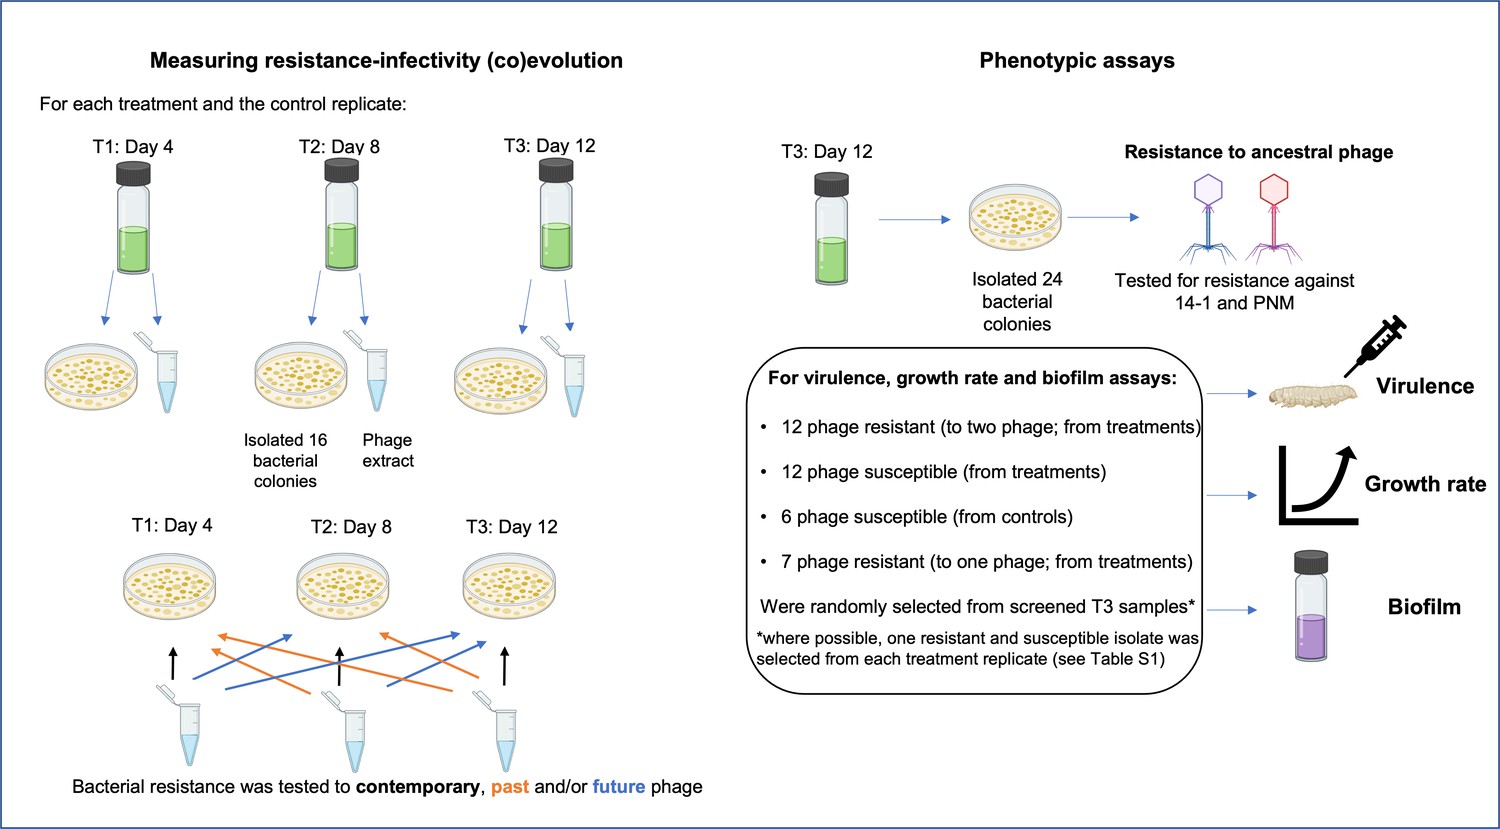
Selection process of colonies used for time-series assays measuring resistance-infectivity (co)evolution and phenotypic assays (end-point resistance, virulence, growth rate, and biofilm) for isolates evolved in vitro.
For time-series assays, 16 bacterial colonies were randomly selected from each treatment replicate (phage added once or repeatedly, n=6 each) and time point (T1–T3), alongside a phage extract that contains a pool of phage genotypes and species (14–1 and PNM). Each colony was then tested for resistance to the pooled isolated across each time point. For phenotypic assays, 24 colonies from T3 replicates of each treatment were screened for resistance to each phage. From these 24 colonies, bacterial colonies of each resistance type were randomly selected for further phenotypic assays. Created with icons from BioRender.com.
Additional files
-
Supplementary file 1
Pairwise comparisons of resistance of in vivo clones from day two against phage from contemporary (day 2) and two future time points (days 4 and 7).
P-values adjusted using the Tukey method of comparing a family of three estimates. “SE” = standard error.
- https://cdn.elifesciences.org/articles/73679/elife-73679-supp1-v2.docx
-
Supplementary file 2
Susceptible colonies picked from in vitro phage treatments for phenotypic assays and sequencing.
- https://cdn.elifesciences.org/articles/73679/elife-73679-supp2-v2.docx
-
Supplementary file 3
The effect of outlier removal on the significance of model terms (treatment and phage resistance).
Outlier removed states in which treatment each outlier was identified and subsequently removed. Significant p-values in bold.
- https://cdn.elifesciences.org/articles/73679/elife-73679-supp3-v2.docx
-
Supplementary file 4
The effect of outlier removal on Tukey HSD contrasts comparing biofilm productivity between phage resistance groups.
Significant p-values highlighted in bold.
- https://cdn.elifesciences.org/articles/73679/elife-73679-supp4-v2.docx
-
Transparent reporting form
- https://cdn.elifesciences.org/articles/73679/elife-73679-transrepform1-v2.docx
Download links
A two-part list of links to download the article, or parts of the article, in various formats.
Downloads (link to download the article as PDF)
Open citations (links to open the citations from this article in various online reference manager services)
Cite this article (links to download the citations from this article in formats compatible with various reference manager tools)
Parallel evolution of Pseudomonas aeruginosa phage resistance and virulence loss in response to phage treatment in vivo and in vitro
eLife 11:e73679.
https://doi.org/10.7554/eLife.73679


