Engineered natural killer cells impede the immunometabolic CD73-adenosine axis in solid tumors
- Department of Industrial and Physical Pharmacy, Purdue University West Lafayette, United States
- Center for Cancer Research, Purdue University West Lafayette, United States
- Department of Comparative Pathobiology, Purdue University, United States
- Histology Research Laboratory, Center for Comparative Translational Research, College of Veterinary Medicine, Purdue University, United States
- Department of Medicine, Division of Hematology/Oncology, Indiana University School of Medicine, United States
- Rutgers Cancer Institute of New Jersey, Rutgers, The State University of New Jersey, United States
- Department of Pharmacology, Robert Wood Johnson Medical School, Rutgers, The State University of New Jersey, United States
- Department of Medicine, Robert Wood Johnson Medical School, Rutgers, The State University of New Jersey, United States
Figures
Figure 1 with 4 supplements
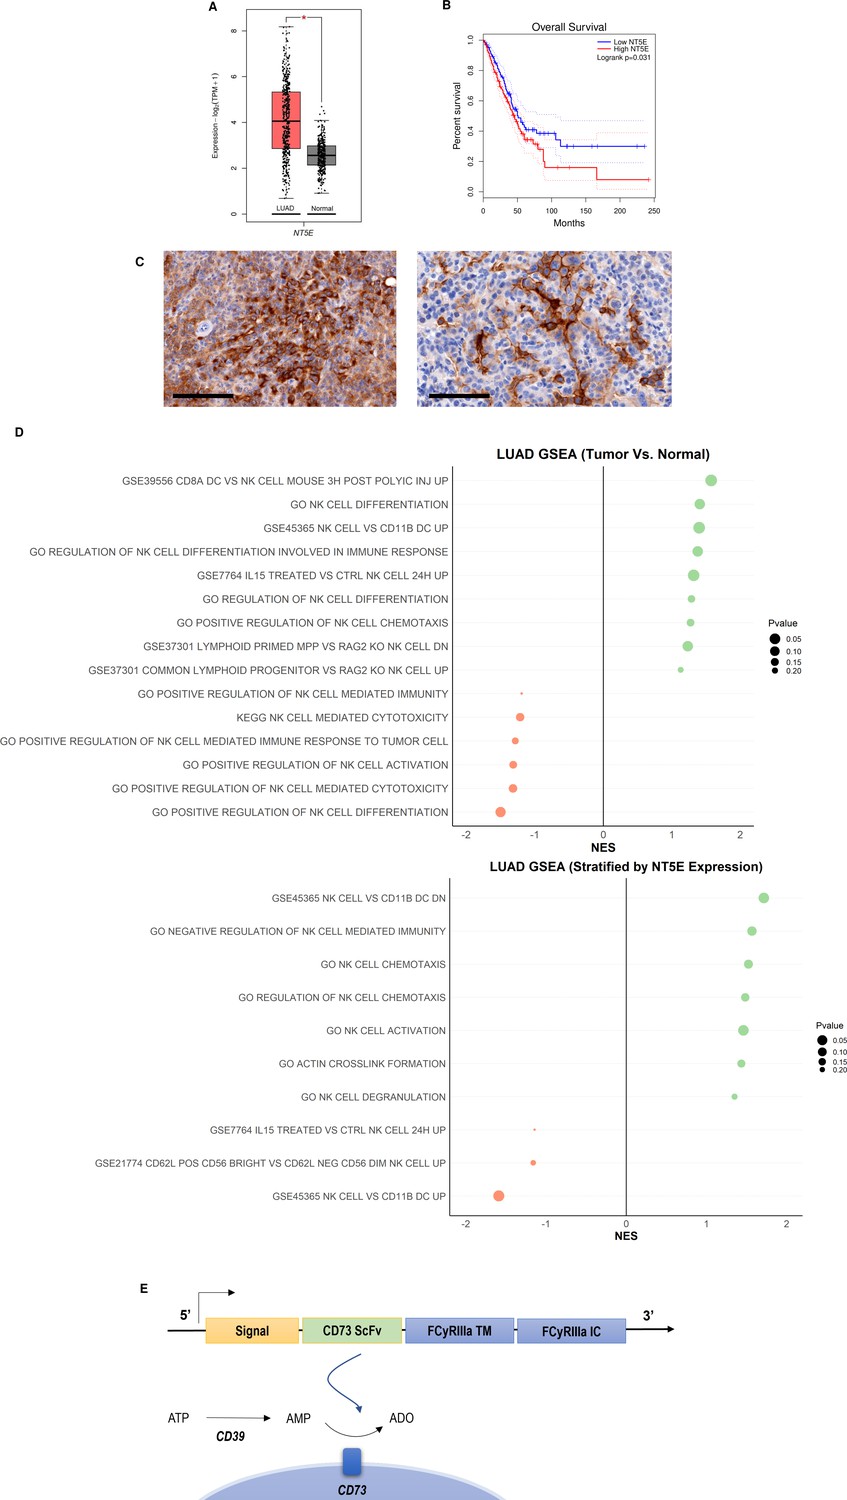
CD73 is overexpressed in lung cancer and is associated with poor overall survival and impairment of NK cell functions.
(A) Expression of NT5E (CD73) in lung adenocarcinoma (N=483) and normal lung (N=387) based on analysis of TCGA patient data. (B) Kaplan-Meier plots of overall survival of lung adenocarcinoma patients (N=478) patients from TCGA dataset via GEPIA2 based on expression of NT5E as a prognostic marker for overall survival. Hazards ratio = 1.4; 95% confidence interval. (C) (Left) IHC staining for CD73 of intratracheal K-rasLSL-G12D/+;p53fl/fl (KP) tumor in LSL-KrasG12D/Tp53flox/flox mice on day 22 (20×); scale bar = 100 μm; (Right) CD73 IHC staining for CD73 on subcutaneous KP tumors in on day 31 (20×). (D) GSEA chart of significant pathways (pvalue <0.25) related to natural killer cells in TCGA-LUAD patients (top) comparison between tumor and normal samples (bottom) comparison between high and low groups stratified by NT5E gene expression. (E) Structure of the CD73.CAR construct consisting of a CD73 scFv, and transmembrane and intracellular domains of FCyRIIa. The CD73 scFv recognizes CD73 to block its enzymatic activity and reduce the accumulation of extracellular adenosine. Volcano plots and GSEA data for LUAD TCGA RNASeq analyses are shown in Figures S2-S5 (Figure 1—figure supplements 1–4). Raw NES and pvalues for TCGA analyses are provided in Tables S1 and S2 (Figure 1—source data 1, Figure 1—source data 2).
-
Figure 1—source data 1
Raw NES and p values for TCGA analyses.
- https://cdn.elifesciences.org/articles/73699/elife-73699-fig1-data1-v2.docx
-
Figure 1—source data 2
Raw NES and p values for significant pathways stratified for NT5E.
- https://cdn.elifesciences.org/articles/73699/elife-73699-fig1-data2-v2.docx
Figure 1—figure supplement 1
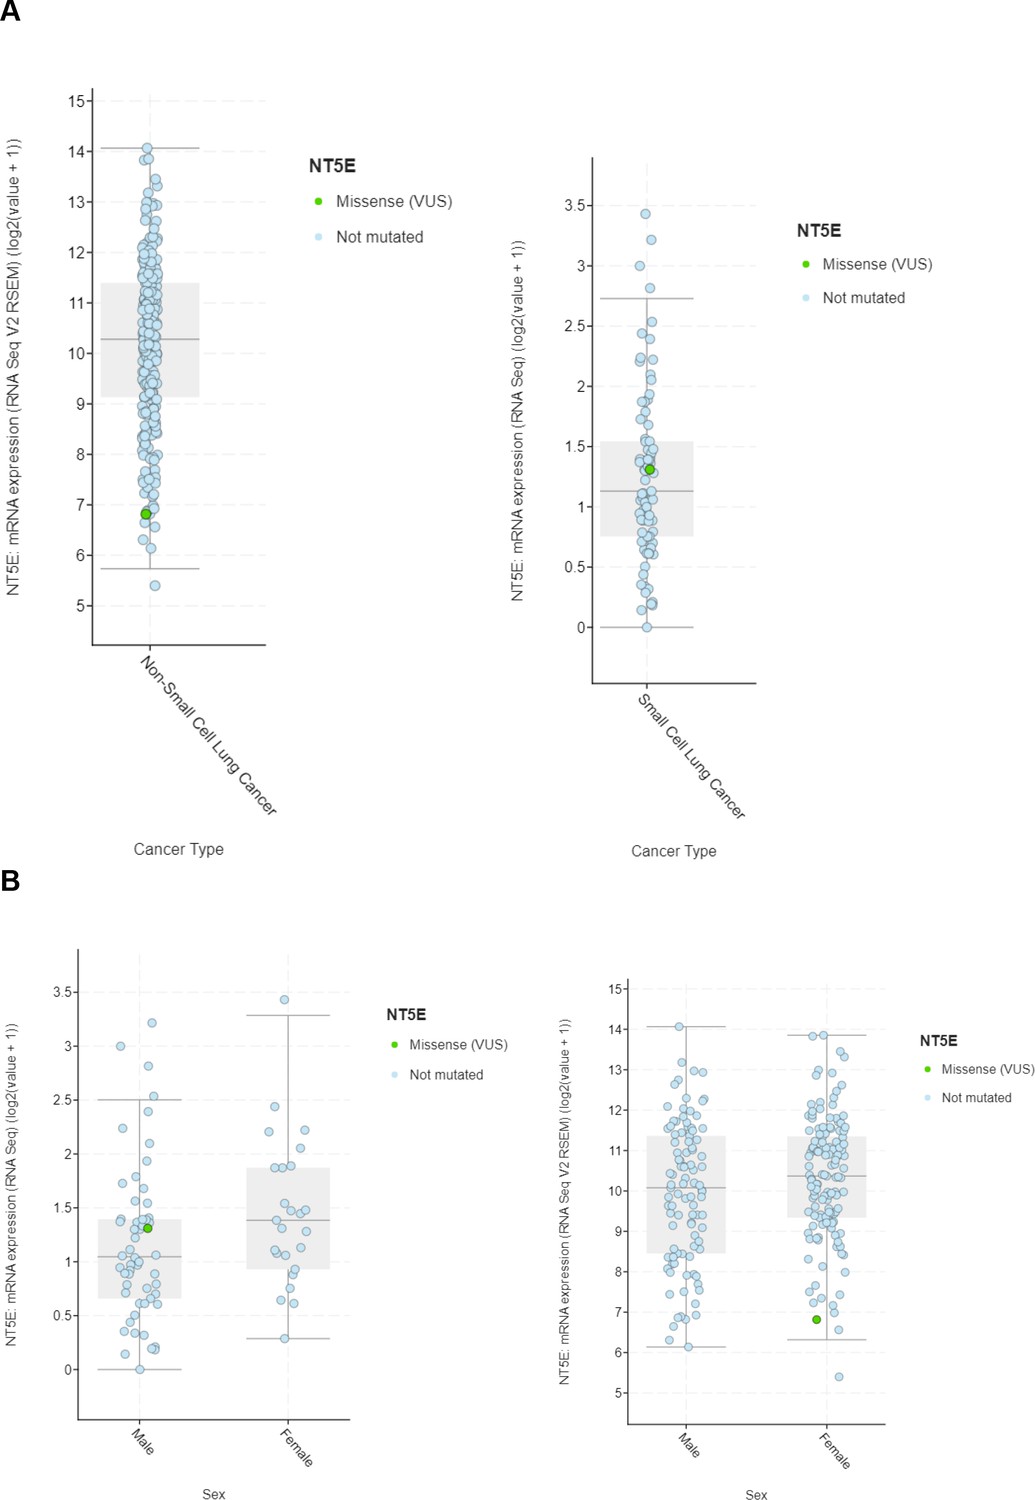
Bioinformatic analysis of expression of CD73 (NT5E) in NSCLC and SCLC.
(A) NT5E expression in (left) NSCLC Sidney et al., 2019 and (right) SCLC Howlader et al., 2014 TCGA databases. (B) NT5E expression in (left) NSCLC Sidney et al., 2019 and (right) SCLC Howlader et al., 2014 TCGA databases stratified by sex.
Figure 1—figure supplement 2
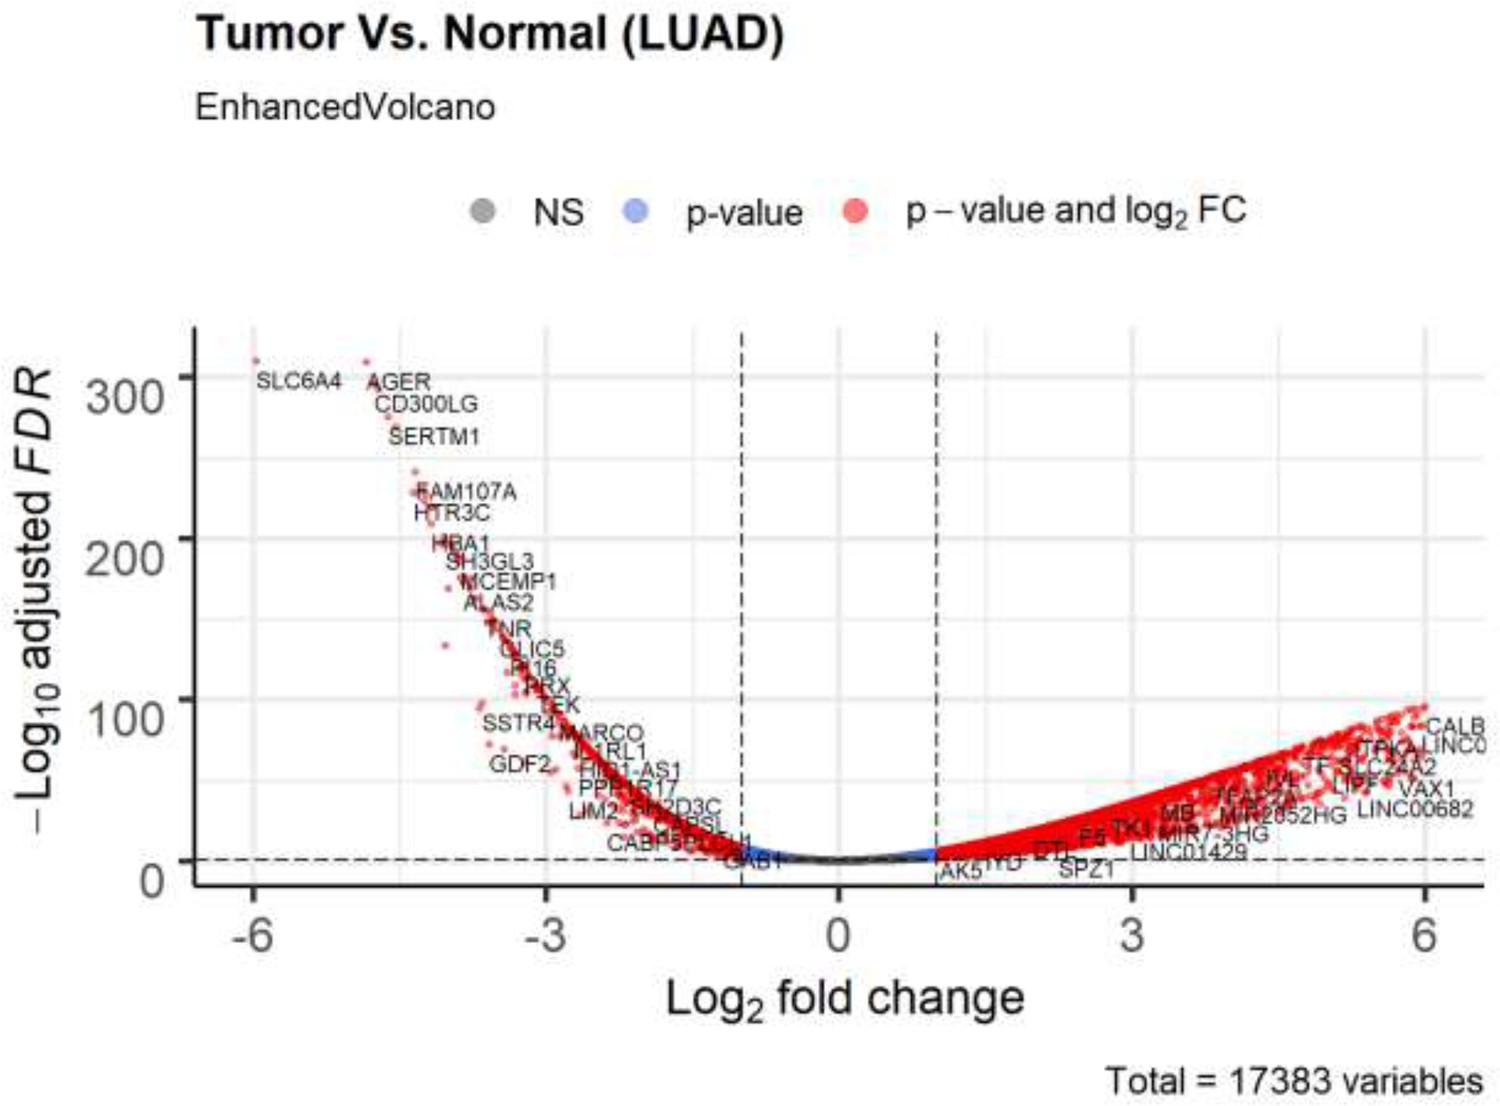
Volcano plot of differential expression genes (tumor vs normal) in lung adenocarcinoma based on bioinformatics analysis of TCGA patient data.
Non-significant (NS) genes are shown in gray. Significant genes (FDR < 0.05 and log2FC cutoff 2) are shown in red. Genes passing only FDR cutoff are shown in blue and genes passing only the log2FC cutoff (if any) are shown in green.
Figure 1—figure supplement 3
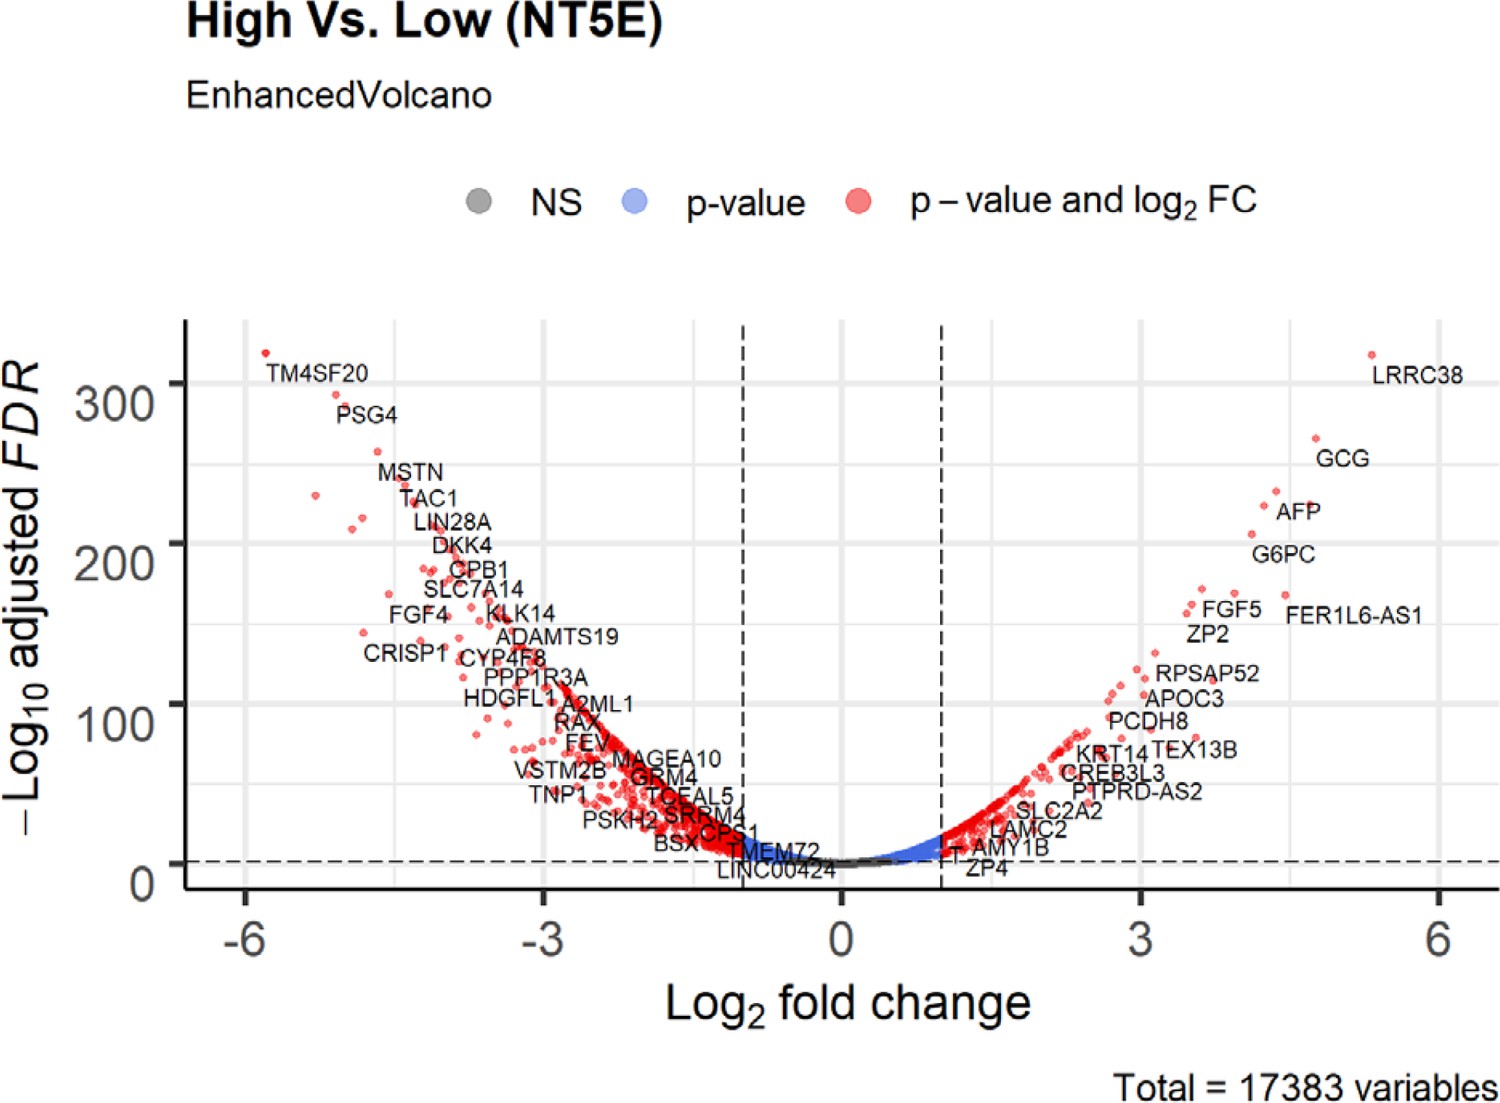
Volcano plot of differential expression genes (tumor vs normal) in NT5E-expressing lung adenocarcinoma based on bioinformatics analysis of TCGA patient data.
Lung adenocarcinoma data was stratified based on high or low expression of NT5E. Non-significant (NS) genes are shown in gray. Significant genes (FDR < 0.05 and log2FC cutoff 2) are shown in red. Genes passing only FDR cutoff are shown in blue and genes passing only the log2FC cutoff (if any) are shown in green.
Figure 1—figure supplement 4
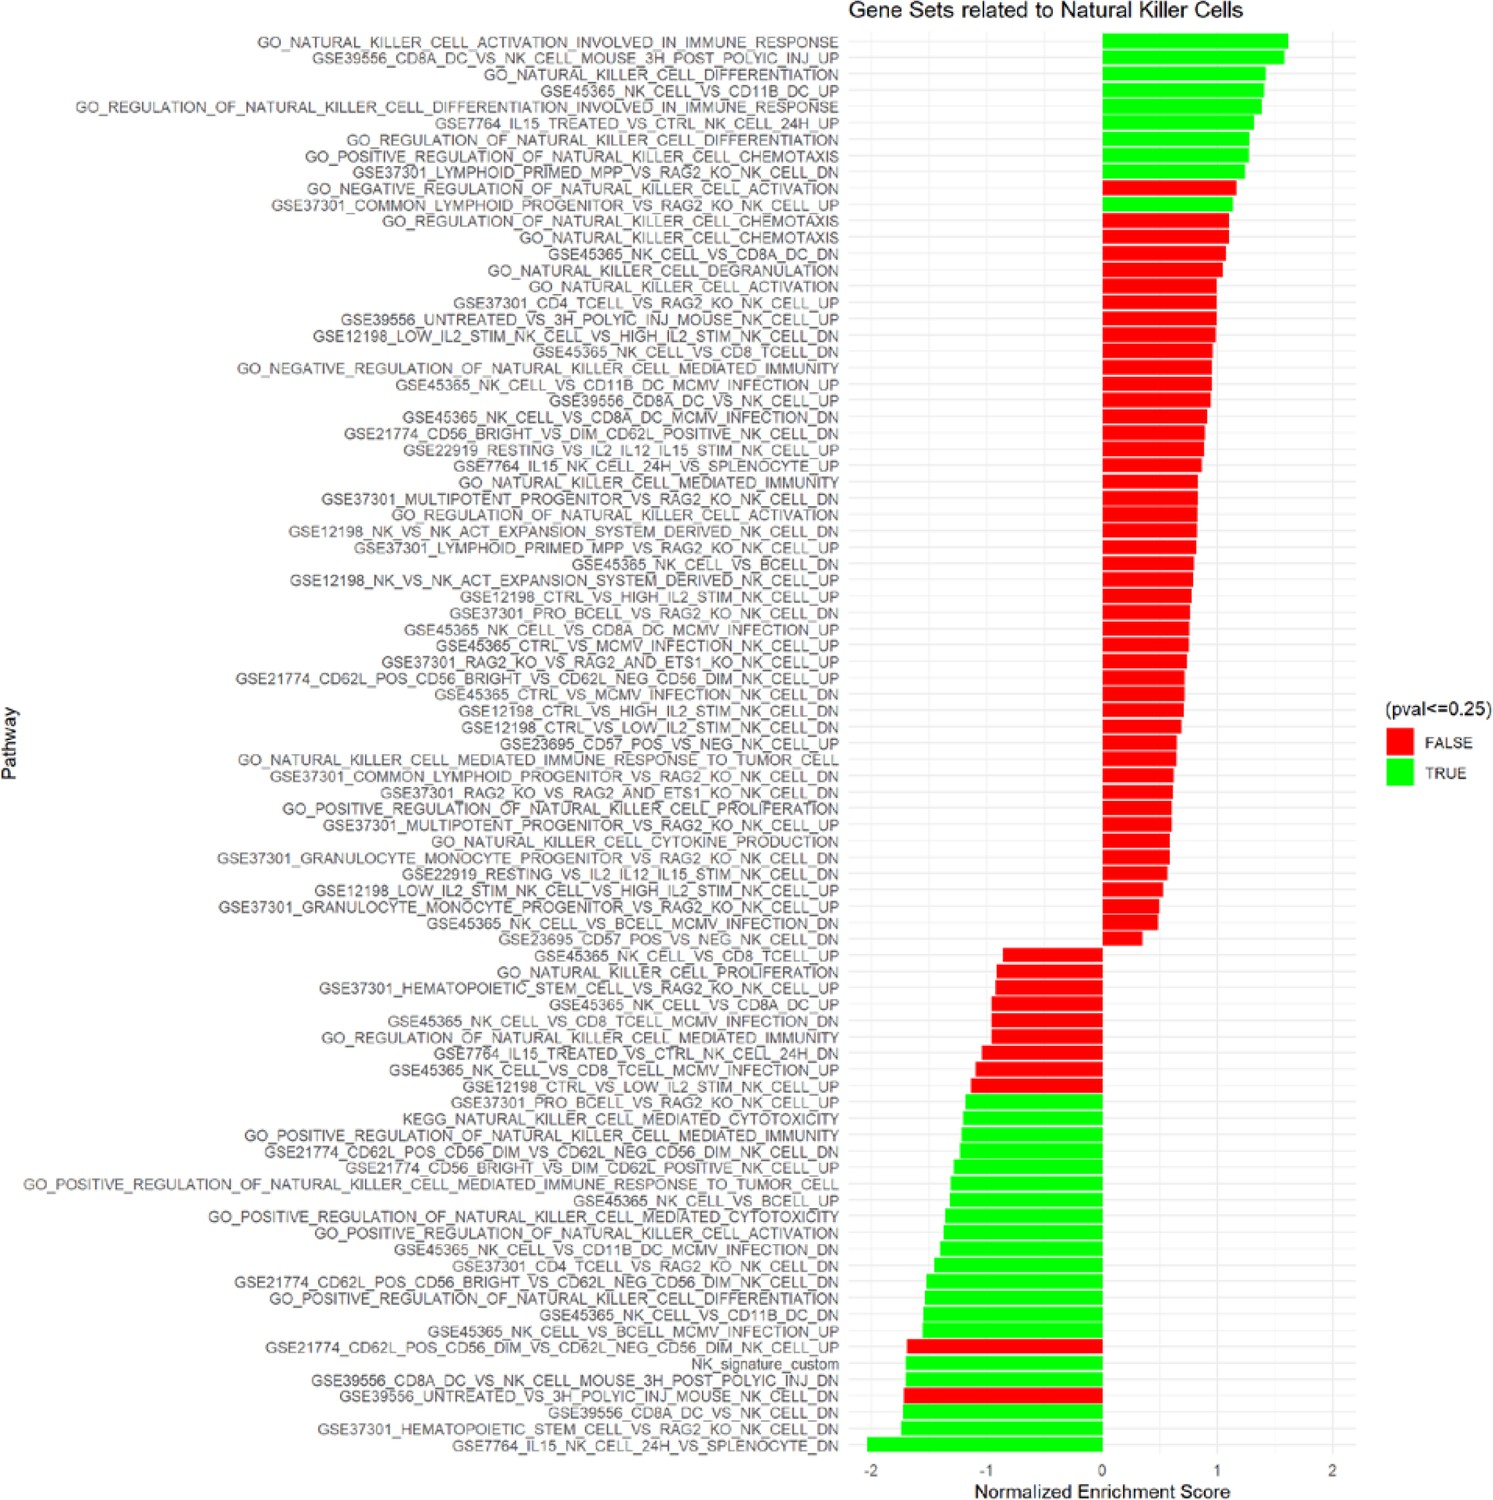
Gene set enrichment analysis of lung adenocarcinoma TCGA data related to natural killer cells.
KEGG, GO Biological Processes and Immunological Signature databases were used. Significant and non-significant pathways shown.
Figure 2 with 3 supplements
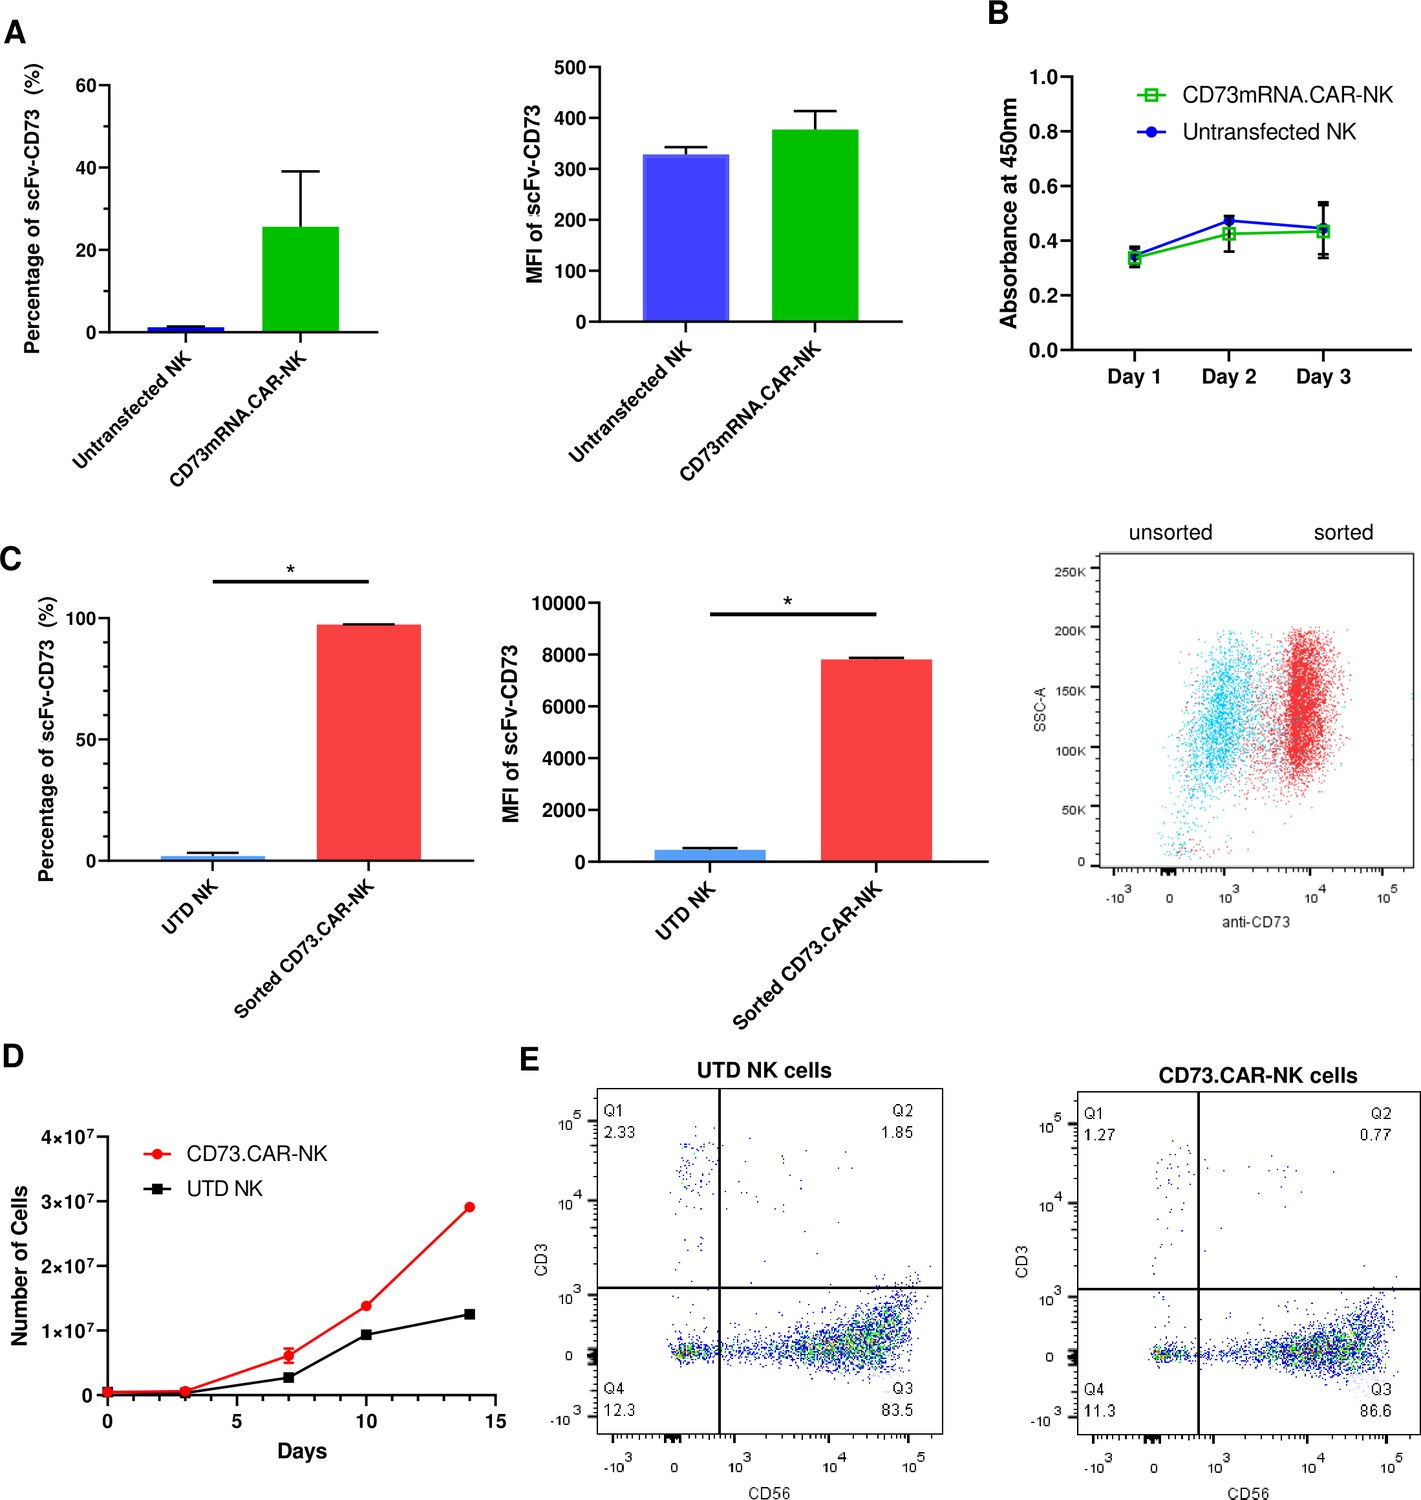
Engineering of CD73.CAR NK cells.
(A) Transfection efficiency of CD73-mRNACAR construct in terms of (left) percentage and (right) MFI of the CD73-mRNACAR expressed by primary human NK cells following mRNA electroporation (n=3 samples from 3 individual donors). (B) Viability of CD73.mRNACAR-NK cells and non-transduced NK cells (NK) in culture following mRNA electroporation (n=3 samples). (C) Enrichment of lentivirally transduced CD73.CAR-NK cells following sorting in terms of (left) percentage and (middle) MFI of the CD73.CAR expressed by primary human NK cells following lentiviral transduction; (right) Dot plot of sorted populations of CD73.CAR+ and CD73.CAR− transduced human NK cells (n=3 samples) (D) Expansion of CD73.CAR-NK cells and untransduced NK cells following lentiviral transduction (n=3 samples) (E) Proportion of CD56+CD3− untransduced human NK cells and CD73.CAR-NK cells following lentiviral transduction. *p<0.05, UTD = untransduced. See Figure S1 (Figure 2—figure supplement 1) for gating strategy for human NK cell isolation. See Figure S6 (Figure 2—figure supplement 2) for data for transfection optimization studies. See Figure S7 (Figure 2—figure supplement 3) for data for lentiviral transduction optimization studies.
Figure 2—figure supplement 1
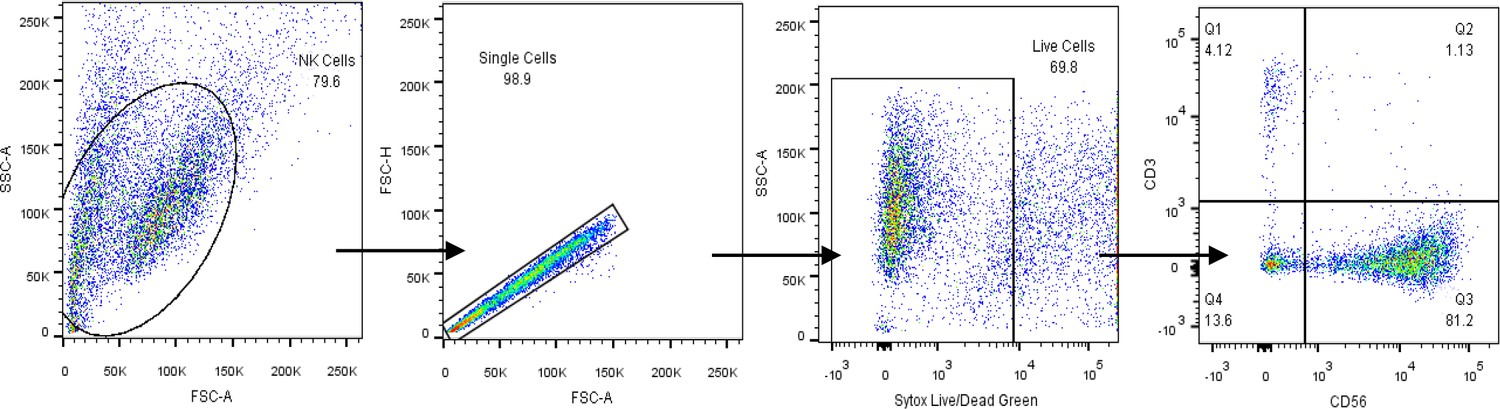
Gating strategy for human NK cell identification by flow cytometry.
Identification of CD56+CD3− human NK cells from peripheral blood.
Figure 2—figure supplement 2
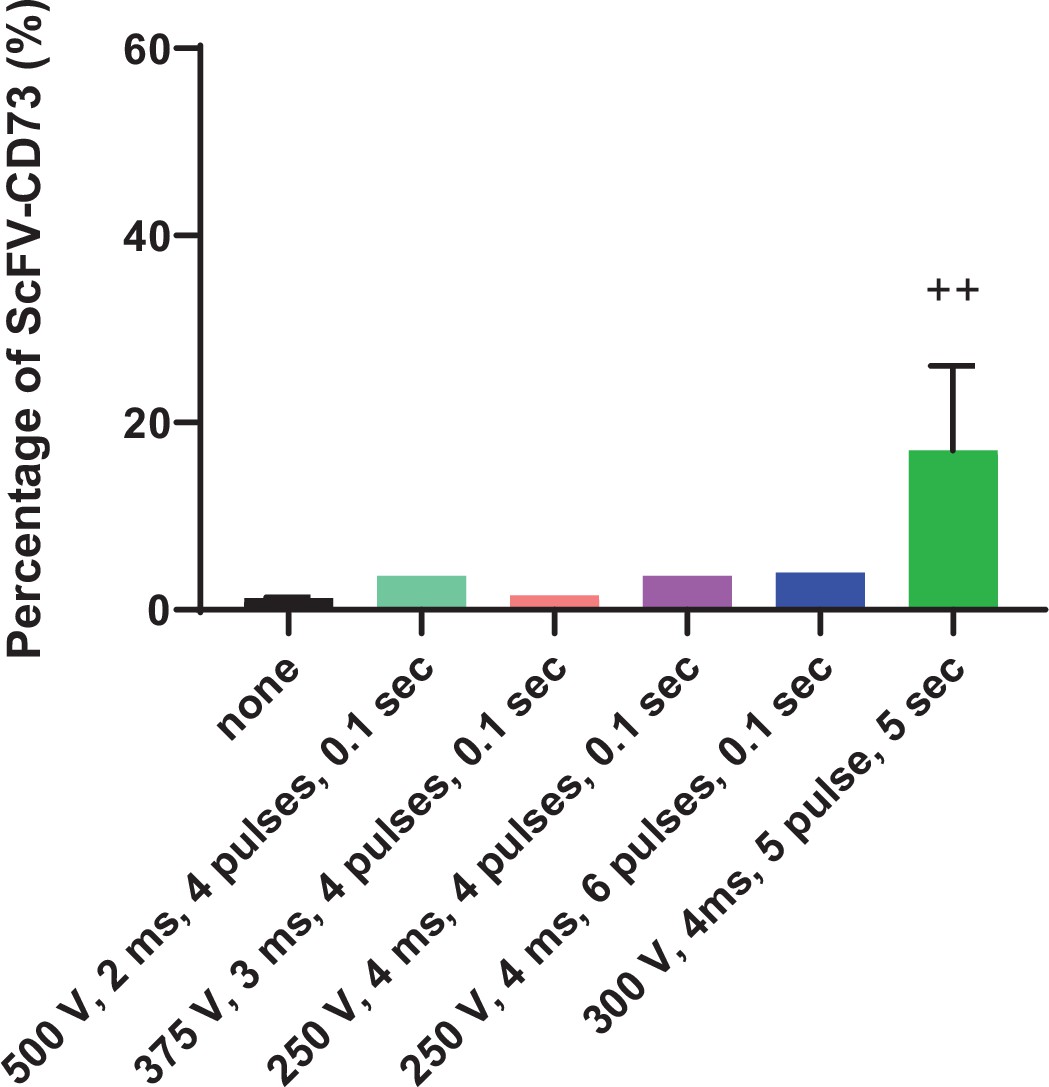
Optimization of mRNA electroporation of human NK cells.
Electroporation conditions tested for expression of the CD73.CAR construct on primary NK cells.++ indicates highest and most optimal condition for CAR expression.
Figure 2—figure supplement 3
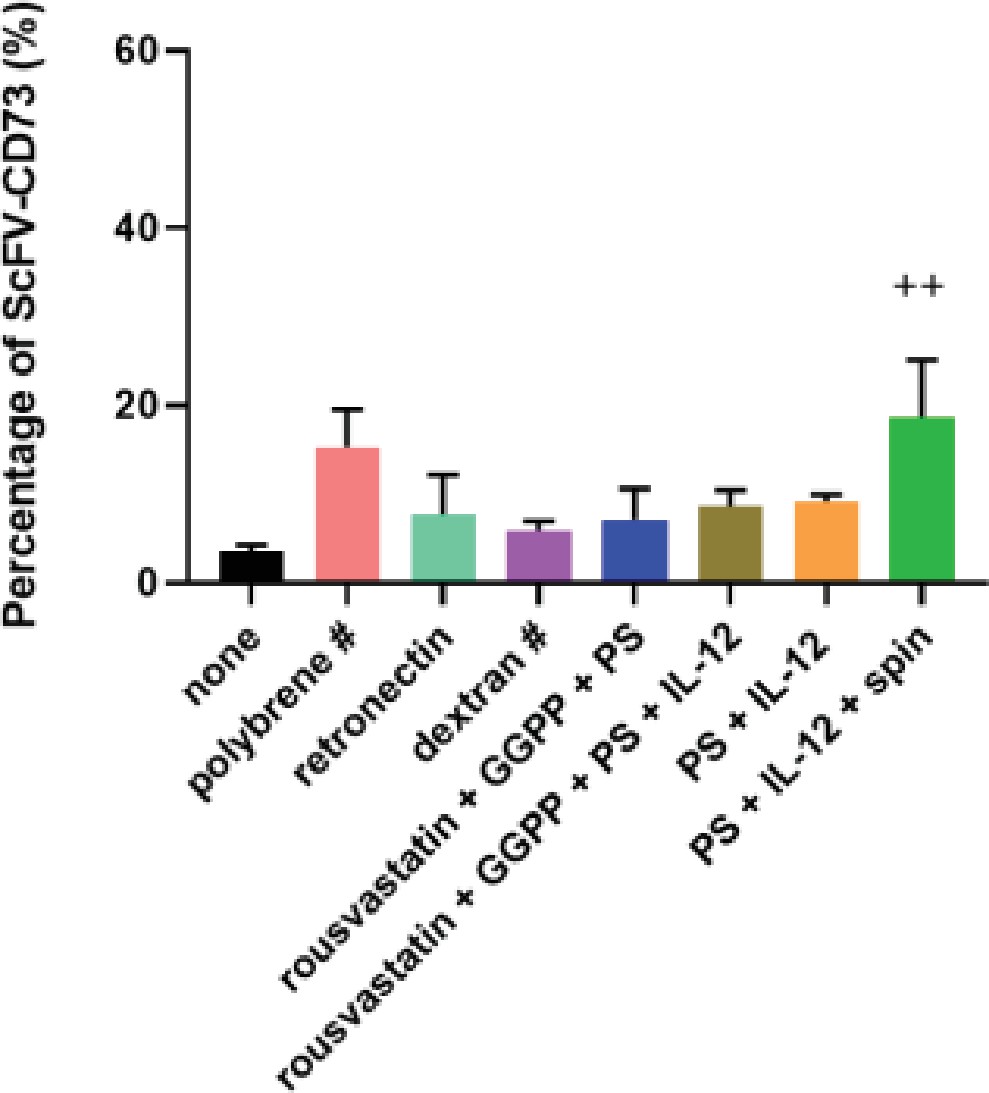
Optimization of lentiviral transduction of human NK cells to express the CD73.CAR construct.
Transduction condition tested. ++indicates most optimal, # indicates all the cells did not survive transduction conditions and eventually died. PS = protamine sulfate, GGPP = Geranylgeranyl pyrophosphate.
Figure 3 with 1 supplement
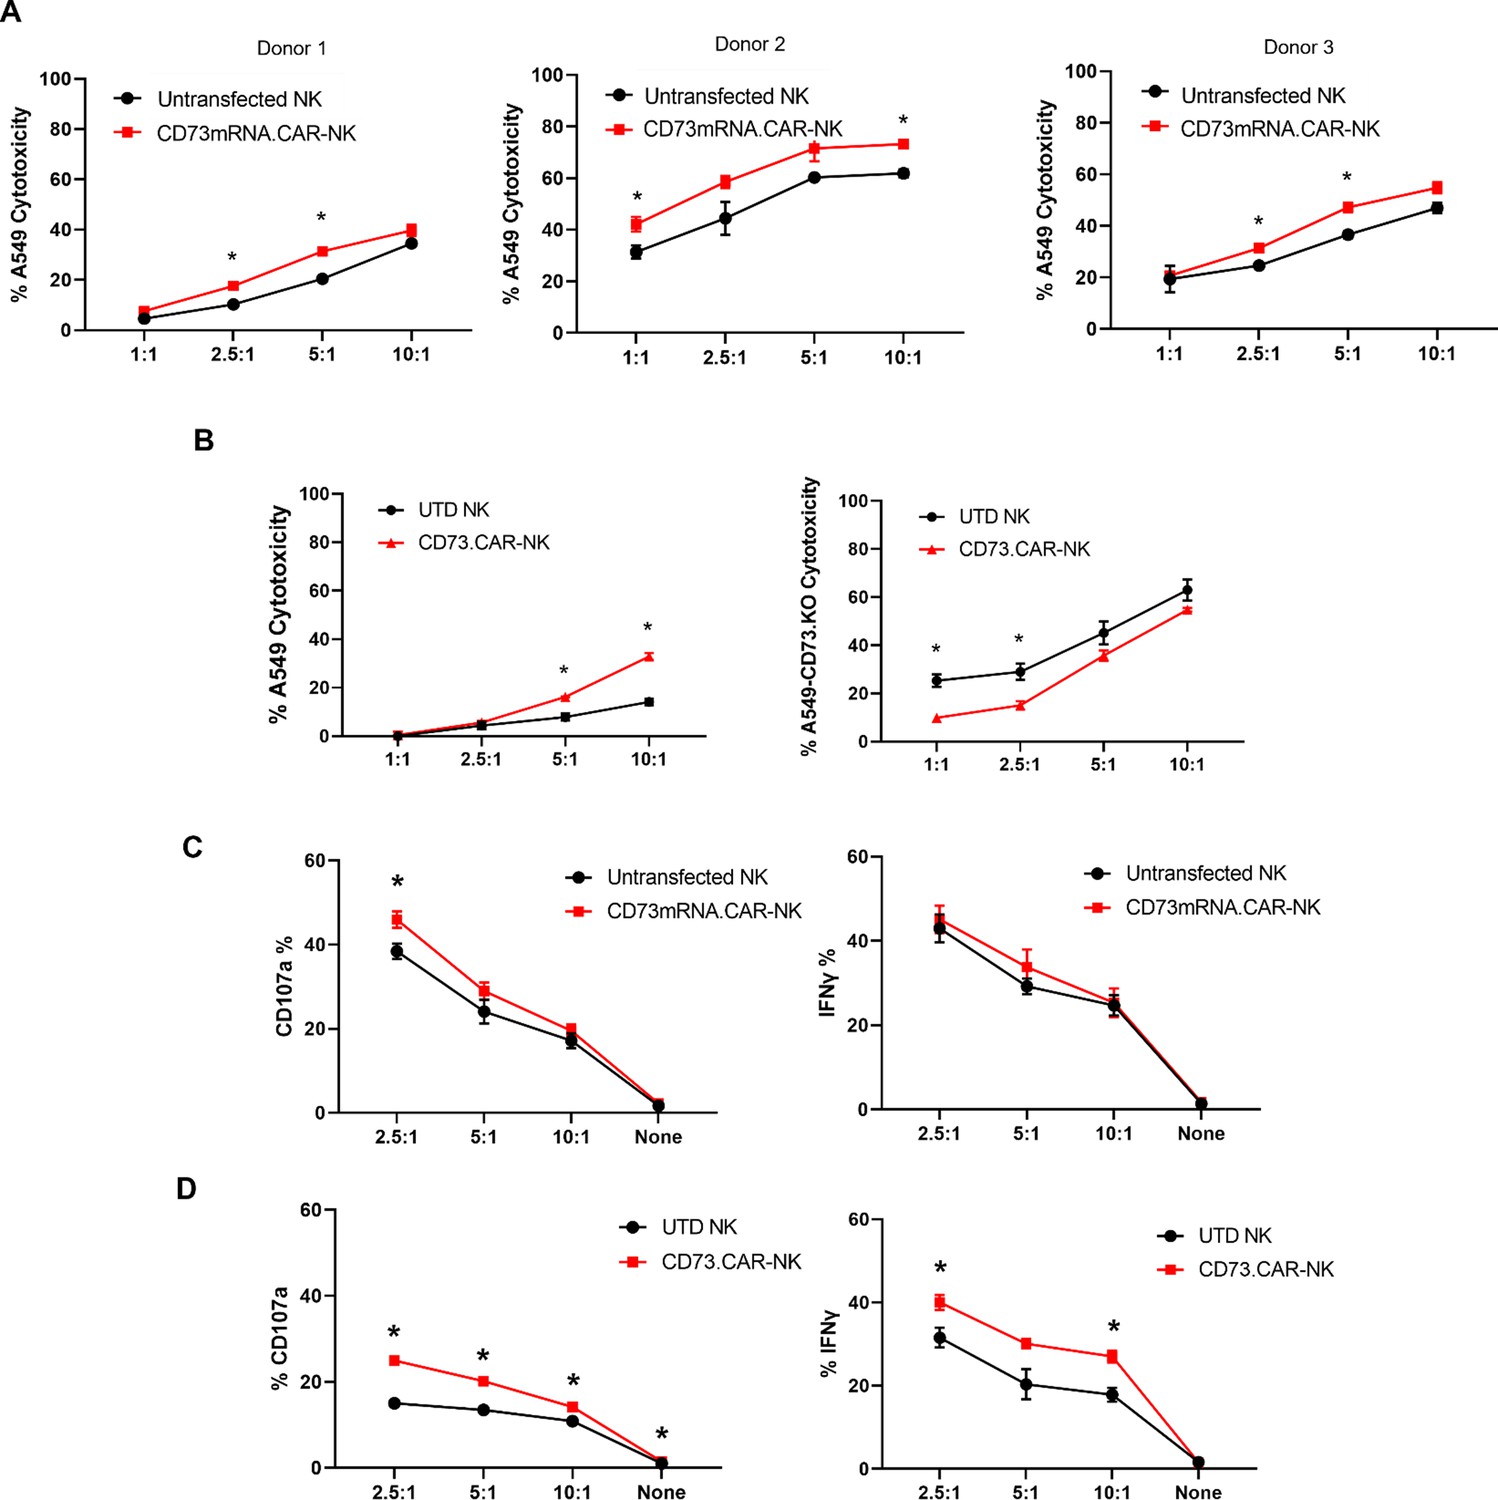
Functionality of CD73.
CAR NK cells. (A) Donor-specific cytotoxicity of CD73.mRNACAR-NK cells and untransduced primary human NK cells against lung adenocarcinoma targets for three individual donors. (B) Cytotoxicity of CD73.CAR-NK cells and human NK cells against (left) WT lung adenocarcinoma targets (right) CRISPR/Cas9 CD73 KO lung adenocarcinoma cells (C) Degranulation, measured through CD107a expression, of CD73.mRNACAR-NK cells and human NK cells in response to lung adenocarcinoma targets. and IFN-γ production by CD73.mRNACAR-NK cells and human NK cells in response to lung adenocarcinoma targets. (D) CD107a and IFN-γ production by CD73.CAR-NK cells and human NK cells in response to lung adenocarcinoma targets. Data are shown representative of three donors, unless otherwise indicated. *p<0.05, UTD = untransduced. See Figure S8 (Figure 3—figure supplement 1) for expression histograms of NT5E on WT and CD73KO A549 cells.
Figure 3—figure supplement 1
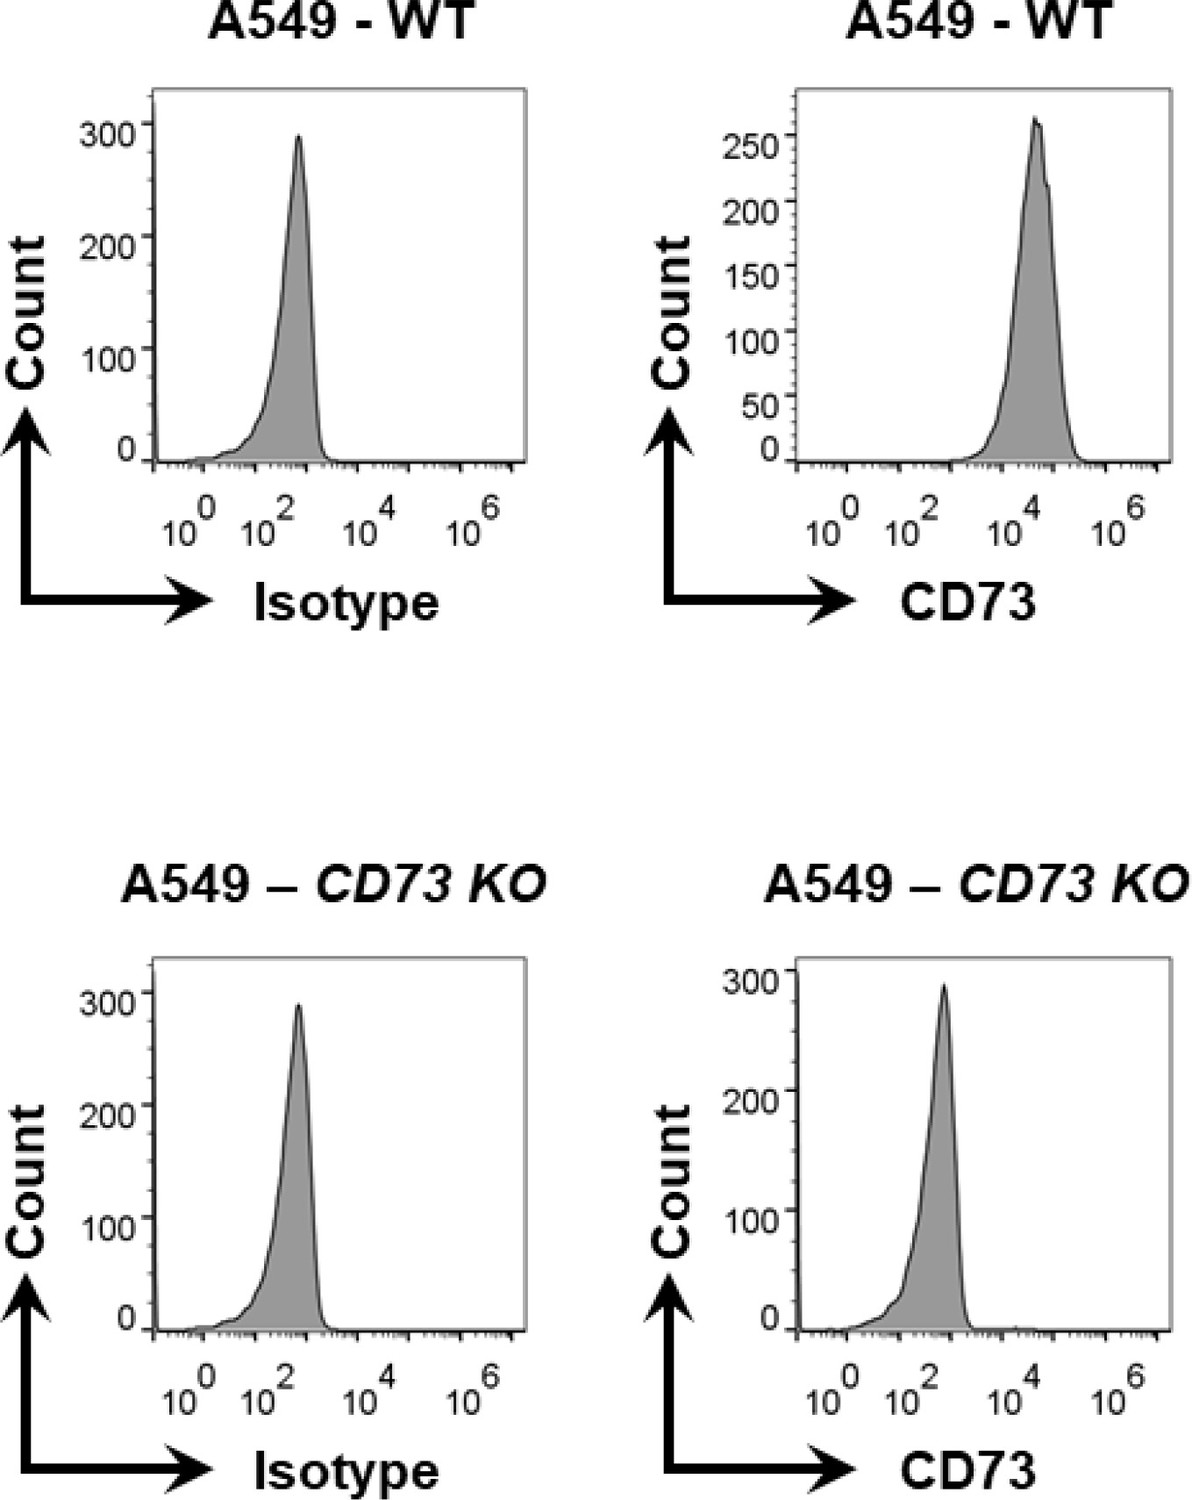
Histograms for expression of CD73 on (top) WT and (bottom row) CD73KO A549 cells.
CD739KO A549 cells were generated via CRISPR/Cas9 gene editing as described in the Materials and methods section.
Figure 4
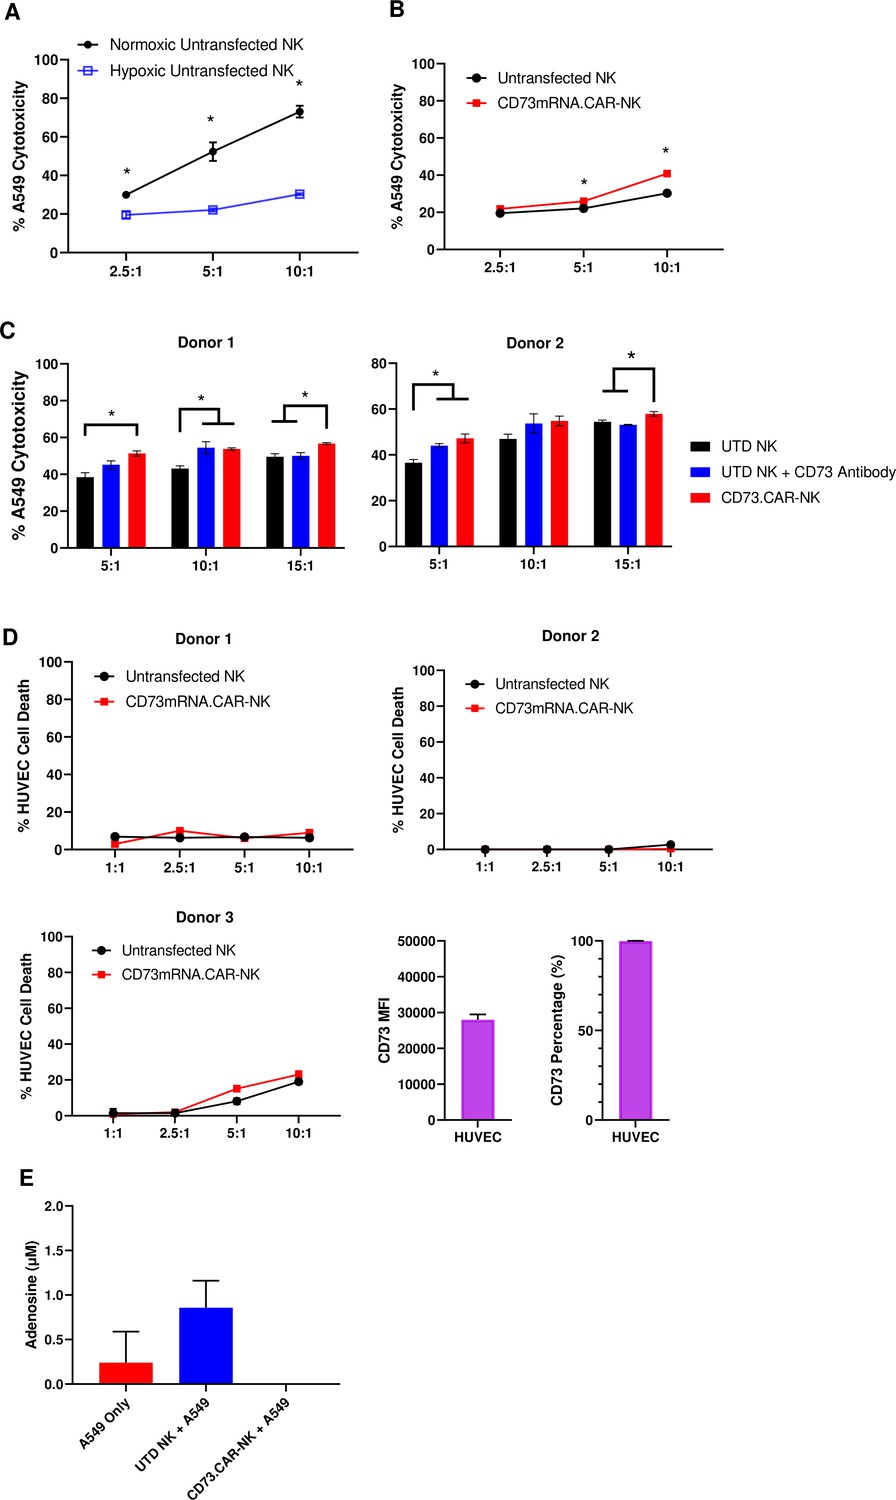
CD73.CAR NK cells rescue NK cell dysfunction under hypoxia.
(A) Cytotoxicity of human primary NK cells against lung adenocarcinoma targets under normoxic and chemically-induced hypoxic conditions. (B) Cytotoxicity of CD73.mRNACAR-NK cells and untransfected primary human NK cells against lung adenocarcinoma targets under chemically-induced hypoxic conditions. (C) Killing of lung adenocarcinoma cells by CD73.mRNACAR-NK cells and anti-CD73 antibody (7G2) for two individual donors. (D) Killing of HUVEC cells by CD73.mRNACAR-NK cells and primary human NK cells for three individual donors. (E) Production of adenosine by lung adenocarcinoma cells after treatment with CD73.CAR-NK cells and untransduced primary human NK cells for three individual donors. Unless otherwise stated, data are representative of three donors. *p<0.05.
Figure 5
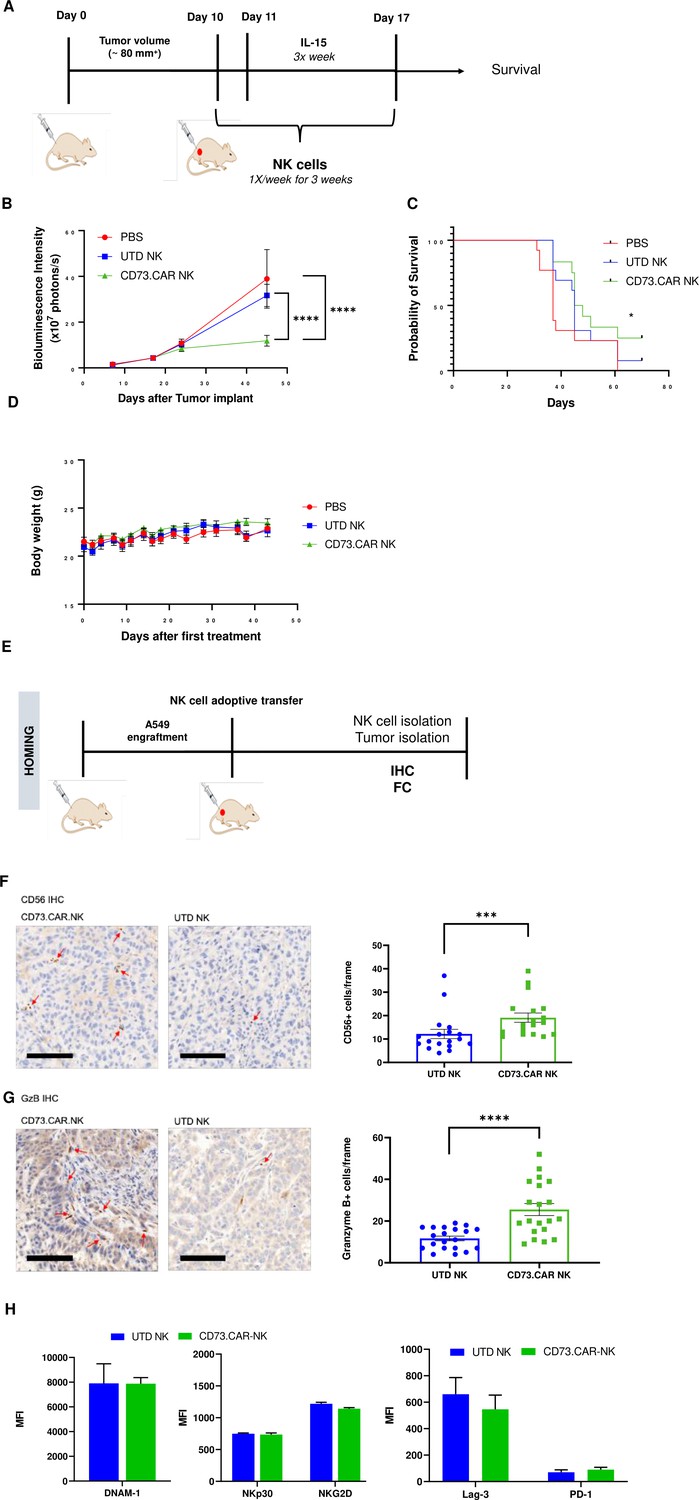
In vivo efficacy of CD73CAR NK cells in lung cancer xenografts.
(A) Treatment schedule of A549 NSG xenografts with CD73.CAR-NK cells or experimental controls (n=6/group). (B) Tumor growth curve of A549 xenografts treated with CD73.CAR-NK cells, human NK cells or untreated control over 48 days. Statistical significance shown between CD73.CAR-NK cells and controls. (n=16) (C) Kaplan-Meier survival curve for A549 tumors treated with CD73.CAR-NK cells, human NK cells or untreated controls. Statistics shown between CD73.CAR-NK cells and untransduced controls. (D) Body weights of mice treated with CD73.CAR NK cells, human NK cells or untreated controls (n=16 mice per group). (E) General diagram for homing studies. (F) Immunohistochemical staining of treated A549 tumors for presence of NK cells (NKp46), and (G) immunohistochemical detection of granzyme B production in the same tumors. Scale bar = 100 μm; ×20 magnification. (H) Phenotyping of circulating NK cells isolated from treated A549-bearing NSG mice for activating markers DNAM-1, NKp30, and NKG2 and inhibitory markers LAG-3 and PD-1. UTD = untransduced, *p<0.05; ***p<0.001, ****p<0.0001.
Additional files
Download links
A two-part list of links to download the article, or parts of the article, in various formats.
Downloads (link to download the article as PDF)
Open citations (links to open the citations from this article in various online reference manager services)
Cite this article (links to download the citations from this article in formats compatible with various reference manager tools)
Engineered natural killer cells impede the immunometabolic CD73-adenosine axis in solid tumors
eLife 11:e73699.
https://doi.org/10.7554/eLife.73699


