A genome-wide functional genomics approach uncovers genetic determinants of immune phenotypes in type 1 diabetes
- Department of Genetics, University of Groningen, University Medical Center Groningen, Netherlands
- Centre for Individualised Infection Medicine, CiiM, a joint venture between the Hannover Medical School and the Helmholtz Centre for Infection Research, Germany
- TWINCORE, Centre for Experimental and Clinical Infection Research, a joint venture between the Hannover Medical School and the Helmholtz Centre for Infection Research, Germany
- Department of Internal Medicine, Radboud University Medical Center, Netherlands
- Department of Laboratory Medicine, Laboratory Medical Immunology, Radboud University Medical Center, Netherlands
- Division of Human Nutrition and Health, Wageningen University, Netherlands
- Department for Genomics & Immunoregulation, Life and Medical Sciences Institute (LIMES), University of Bonn, Germany
Figures
Figure 1 with 3 supplements

Overview of data and experimental design.
(A) Schematic study design. (B,C) Cell-type (B) and cytokine-type (C) relationship visualized by nonmetric multidimensional scale (NMDS) analysis in 300DM. (B) Cell traits (red) cluster separately from T cell and monocyte traits (B) and cytokines with the same cellular origins cluster together (C). In panel (B), small dots indicate the proportion of subpopulations and large dots indicate counts of their parental cell types. Circles represent the calculated centroid of the grouped cell and cytokine types at confidence level 0.95. (D) Heatmap of correlation coefficients between immune-cell counts (y-axis) and cytokine production in response to stimulations (x-axis) in T1D patients. Significant correlations (FDR < 0.05) are labeled by dots, with color indicating correlation coefficients. Positive correlations (red) are observed between monocyte traits and monocyte-derived cytokines (top left), and between adaptive immune-cell counts and T cell-derived cytokines (bottom right). Negative correlations (blue) are observed between adaptive immune-cell counts and monocyte-derived cytokines.
Figure 1—figure supplement 1
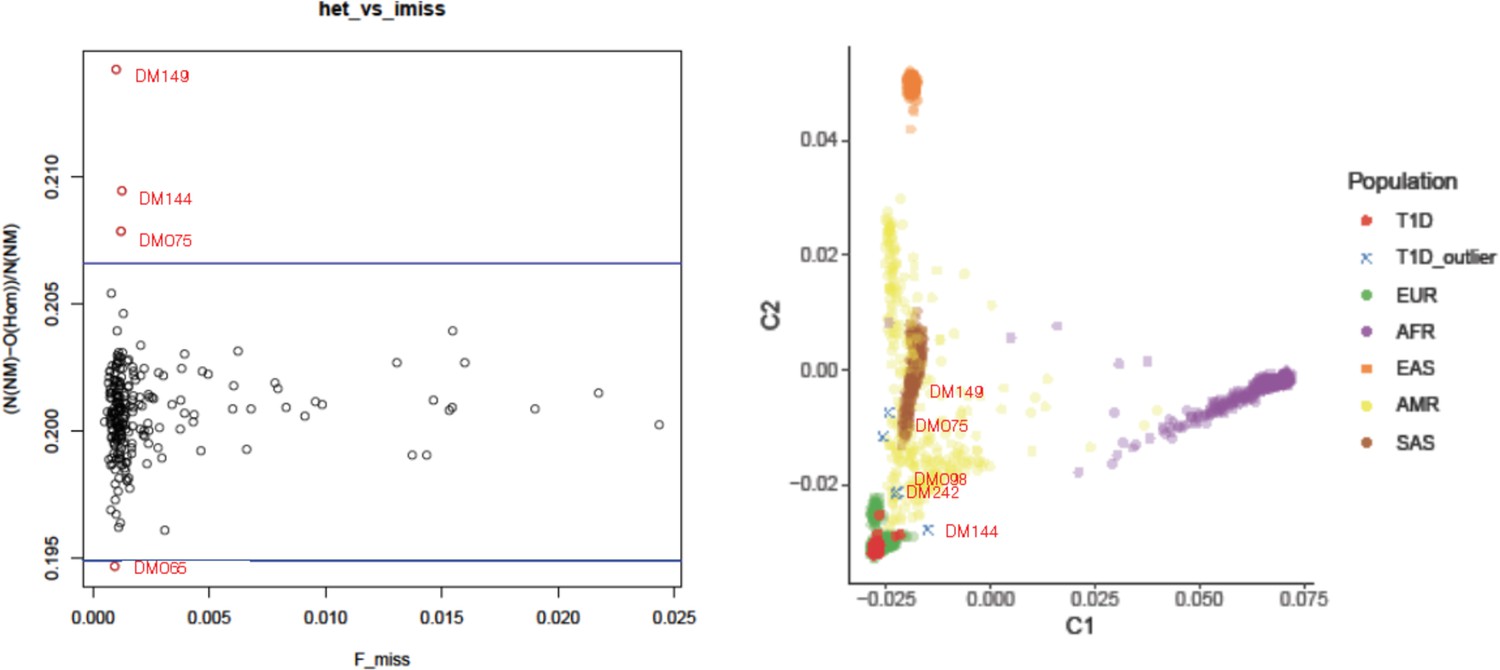
Heterozygosity check (left, x-axis: Proportion of missing genotypes, y-axis: Heterozygosity rate) and ancestry clustering (right, C1: component 1, C2: component 2 in multiple dimensional scaling plot).
Outliers (red symbols) were removed in further analysis.
Figure 1—figure supplement 2
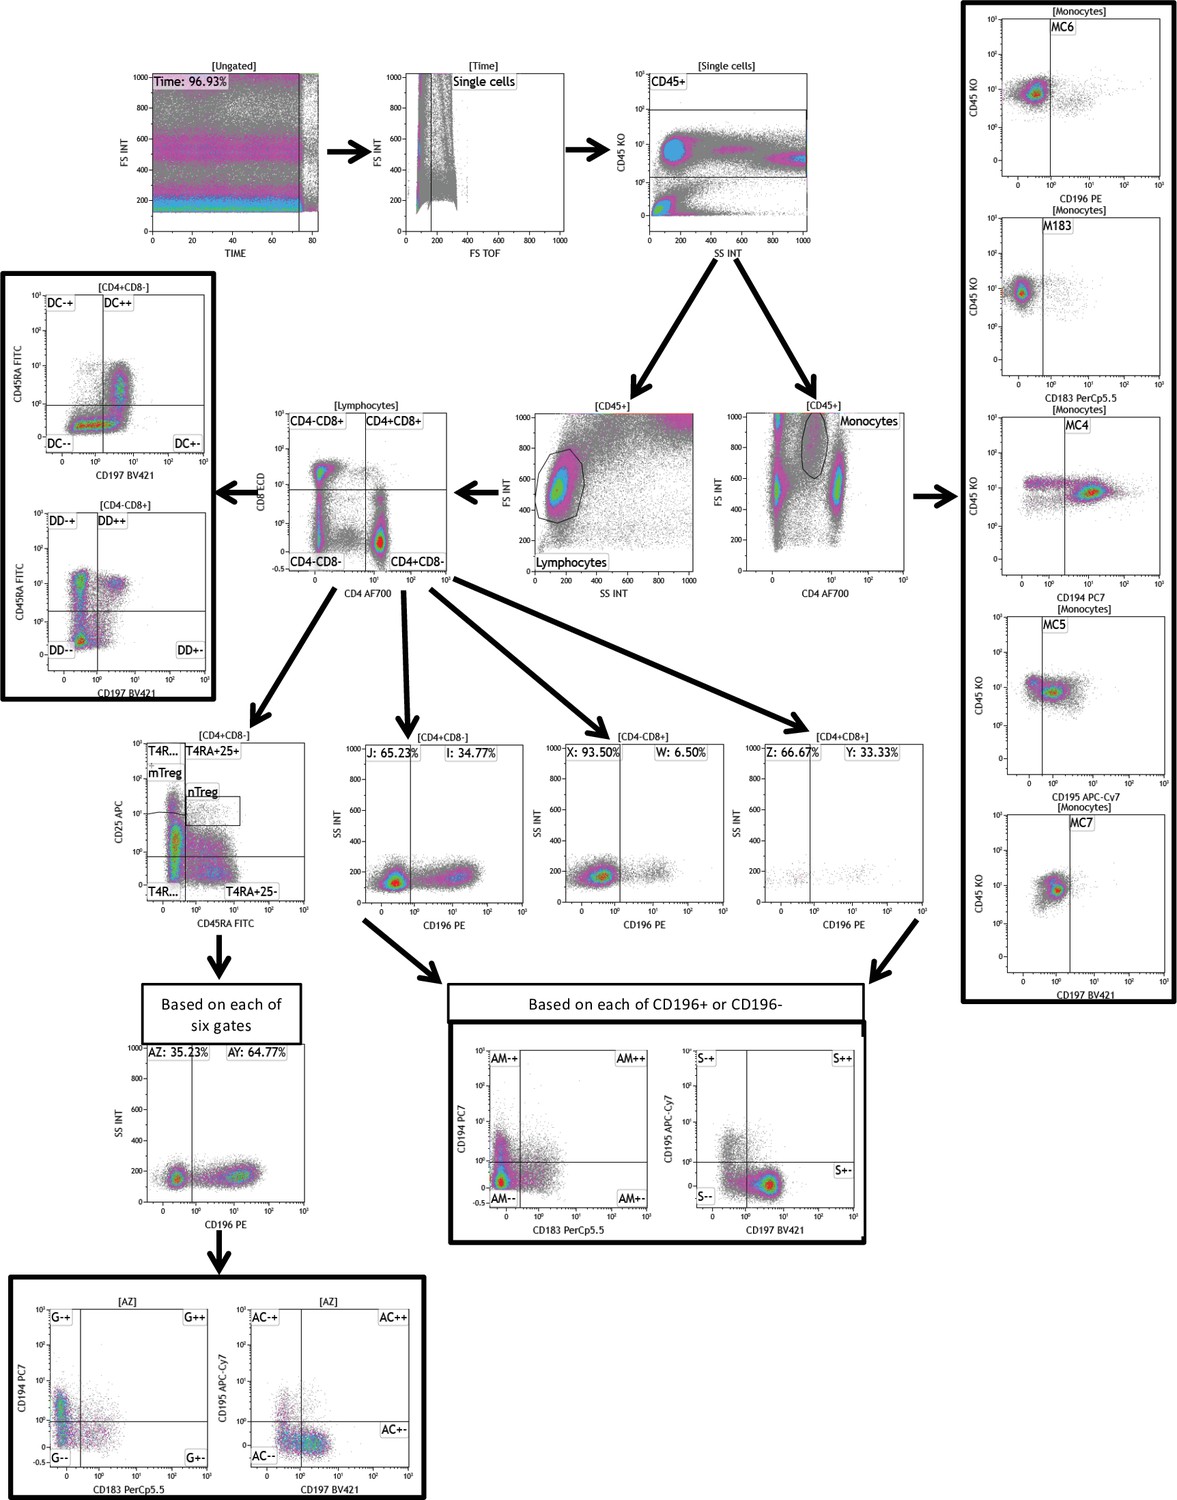
Flow cytometry gating strategy of the chemokine receptor panel.
Figure 1—figure supplement 3
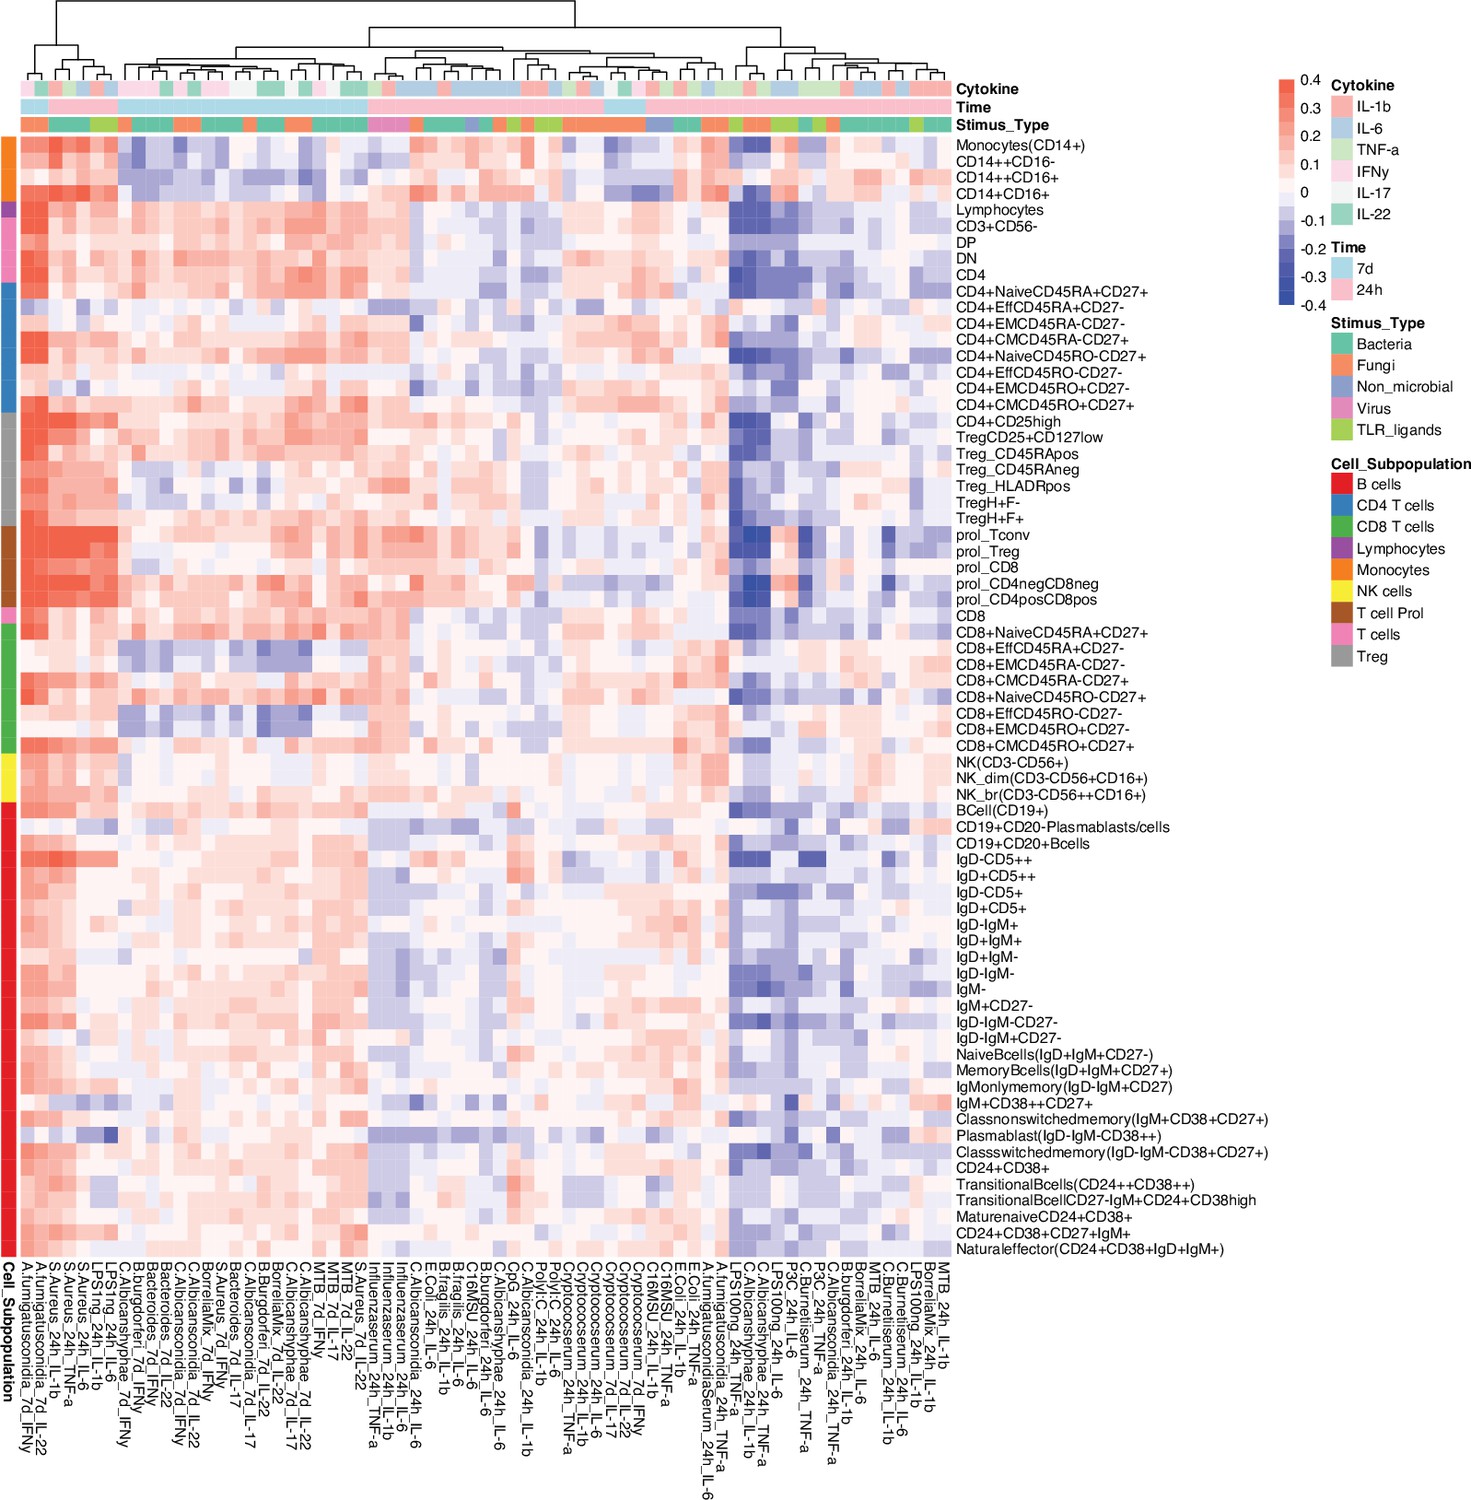
Correlation between cell counts and cytokine production in healthy individuals.
Heatmap of correlation coefficients (indicated by colors) between immune cell counts (y-axis) and cytokine production in response to stimulations (x-axis) in healthy individuals (500FG), which is consistent with 300DM.
Figure 2 with 2 supplements
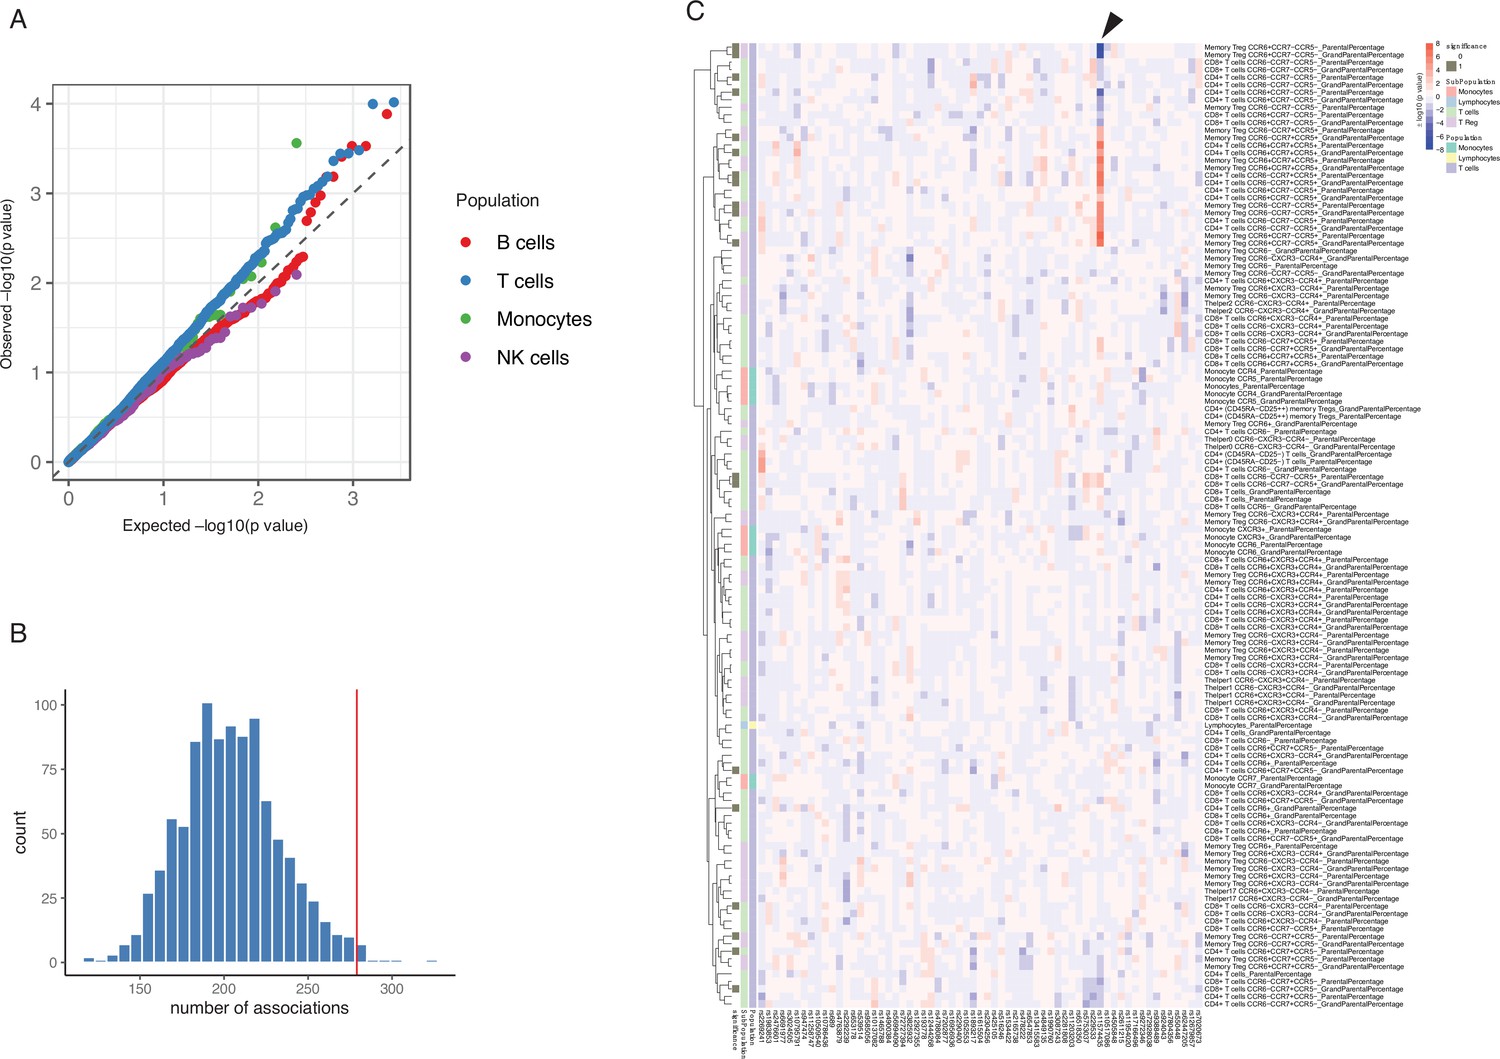
Impact of type 1 diabetes (T1D) genome-wide association studies (GWAS) single-nucleotide polymorphisms (SNPs) on immune phenotypes.
(A) Quantile-quantile (Q-Q) plots of quantitative trait locus (QTL) profiles of 62 T1D GWAS loci grouped by cell populations. The distribution of p-values of associations with T cells traits (blue) shows a significant deviation from an expected uniform distribution (dashed line). (B) Histogram showing number of associations observed (red line) and those in permutations (blue bars). (C) Heatmap of QTL profiles of cell proportion carrying certain chemokine receptors across 62 T1D GWAS loci, colored by −log10(p-values) and effect direction of the T1D risk allele. Arrowhead indicates a T1D risk allele rs11574435-T.
Figure 2—figure supplement 1
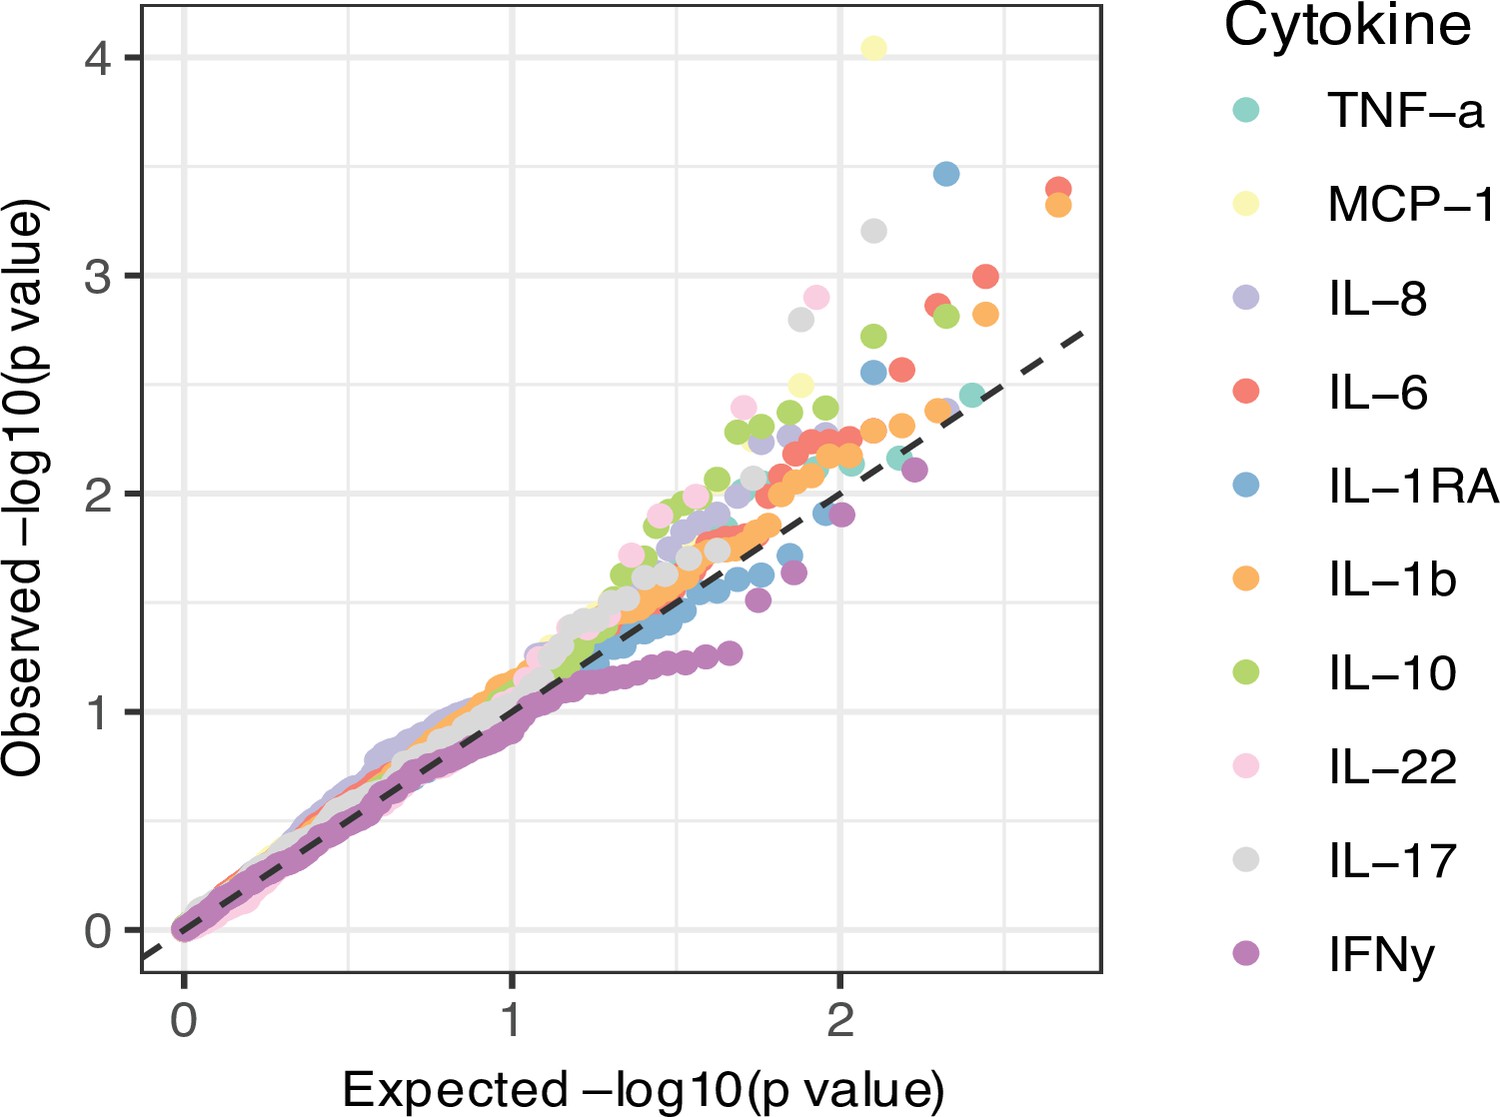
Qqplots of QTL profiles of 62 T1D GWAS loci grouped by cytokine types.
Figure 2—figure supplement 2
Impact of T1D GWAS SNPs on immune phenotypes.
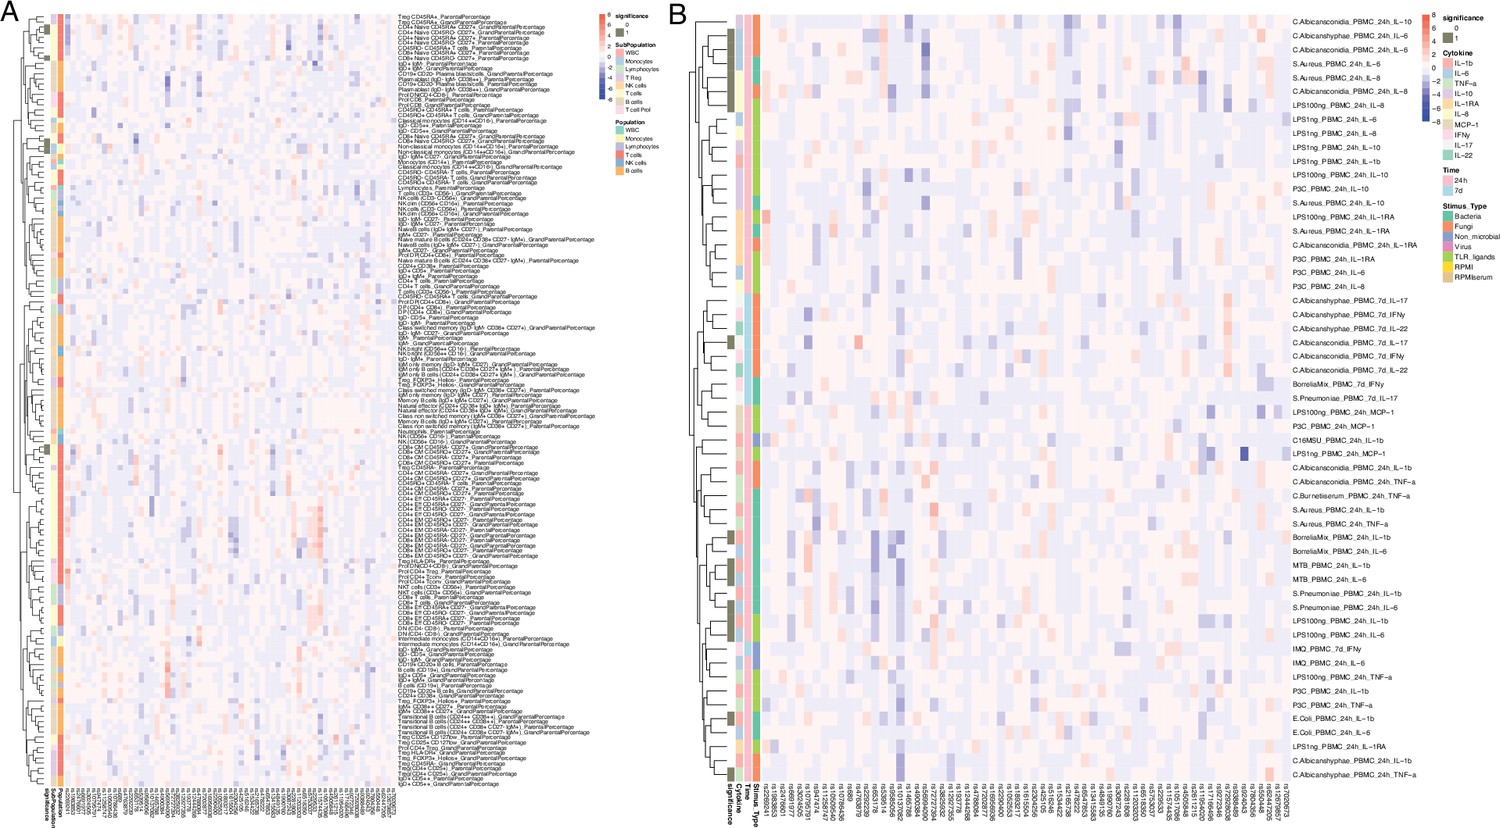
(A,B) Heatmap of QTL profiles of immune phenotypes across 62 T1D GWAS loci, colored by -log10(p values) and effect direction of T1D risk allele (A: immune cell proportion traits; B: cytokine production upon stimulations).
Figure 3
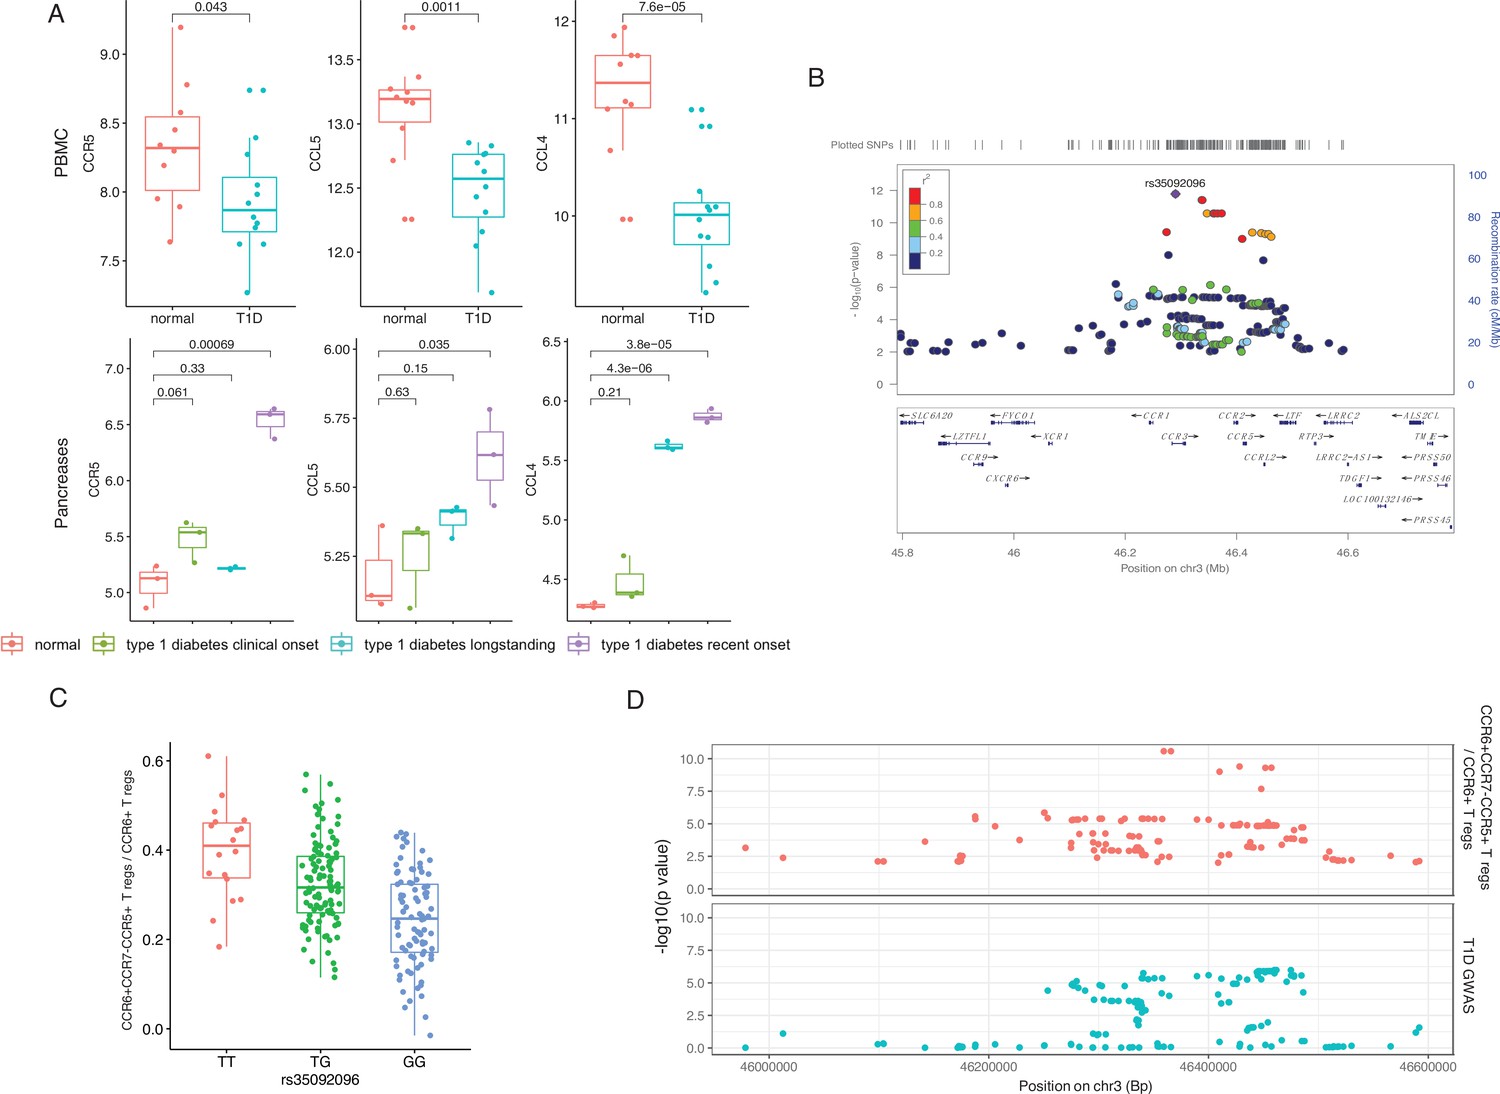
Genetic impact on CCR5-mediated chemokine signaling in type 1 diabetes (T1D).
(A) Expression of CCR5, CCL5, and CCL4 in peripheral blood mononuclear cells (PBMCs) (top) and pancreas (bottom) is altered in T1D patients (blue, green, and purple) compared to healthy controls (red). (B) Locus zoom plot showing that single-nucleotide polymorphisms (SNPs) around rs35092096 located in the CCR region are associated with CCR6+ CCR7− CCR5+ Treg proportion. (C) Boxplot showing that CCR6+ CCR7− CCR5+ Treg proportion differs in different rs35092096 genotypes (TT: red, TG: green, and GG: blue). (D) Two locus zoom plots showing colocalization between CCR6+ CCR7− CCR5+ Treg proportion quantitative trait locus (QTL) profiles (top, red) and T1D genome-wide association studies (GWAS) profile (bottom, blue) within CCR regions.
Figure 4 with 3 supplements
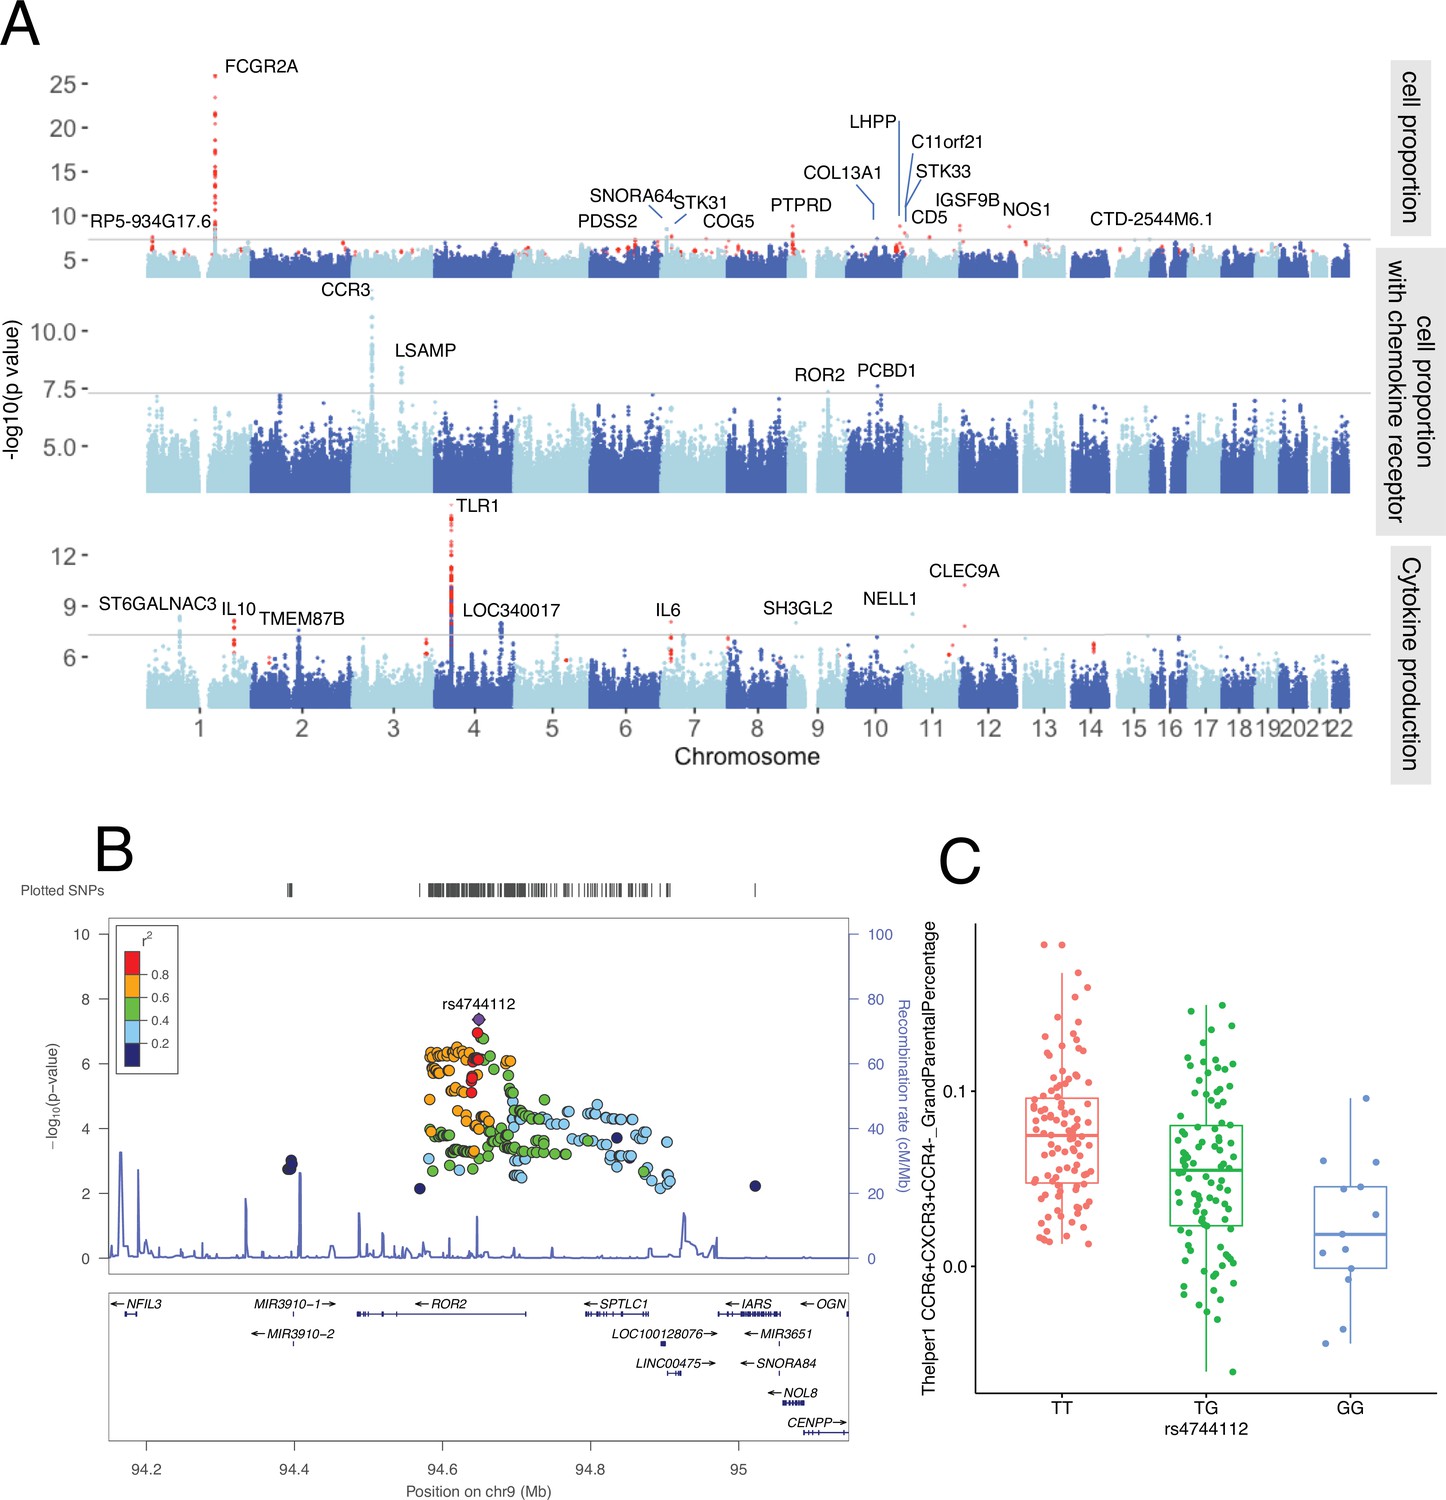
Genetic regulators of immune phenotypes.
(A) Three Manhattan plots showing genetic regulators of immune-cell proportion (top), proportion of immune cells expressing CCR (middle) and cytokines production in response to stimulations (bottom). p-Values of single-nucleotide polymorphisms (SNPs) identified in meta-analysis are colored red. (B) Locus zoom plot showing a type 1 diabetes (T1D)-specific regulatory locus around rs4744112 that effects CCR6+ CXCR3+ CCR4 T helper1 proportion. (C) Boxplot showing how CCR6+ CXCR3+ CCR4 T helper1 proportion varies in different rs4744112 genotypes (TT: red, TG: green, and GG: blue).
Figure 4—figure supplement 1
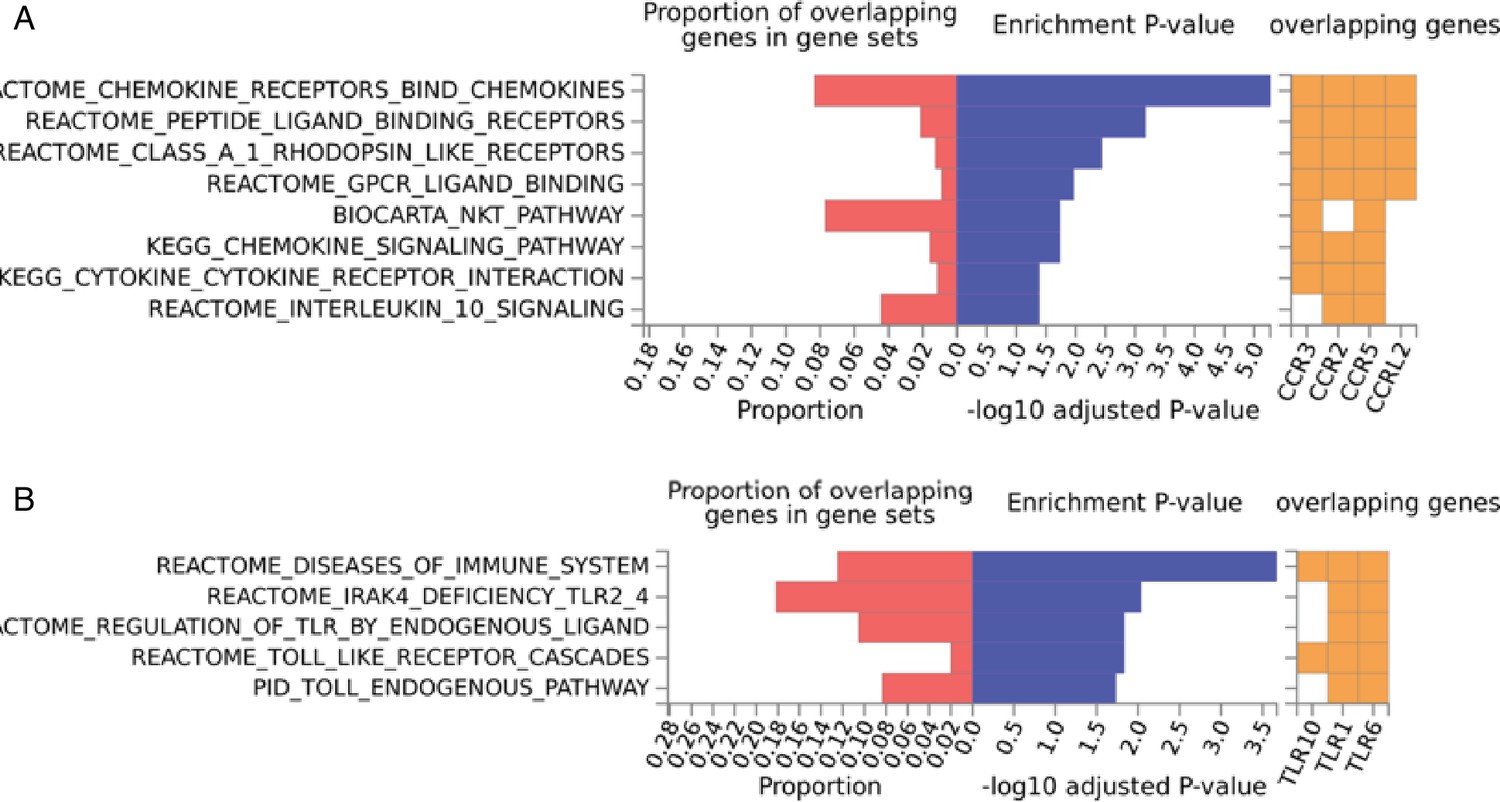
Enriched pathways of QTLs found for immune phenotypes.
Pathway enrichment analysis using genes located within immune cell proportion QTLs (A) and cytokine production QTLs (B).
Figure 4—figure supplement 2
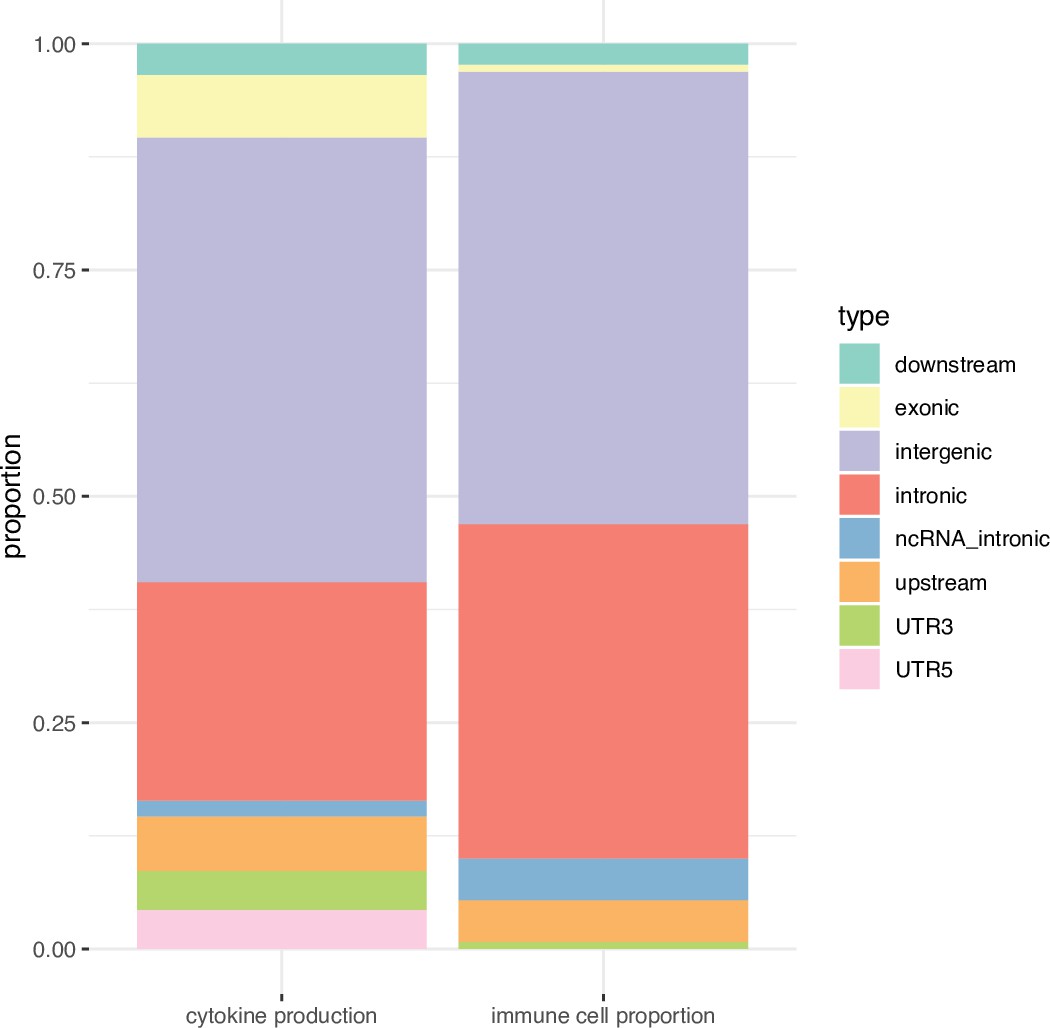
Functional annotation of the immune phenotypes associated SNPs (P < 5 × 10⁻⁸).
Stacked boxplots showing the percentage of genomic elements where the immune phenotypes associated SNPs located.
Figure 4—figure supplement 3
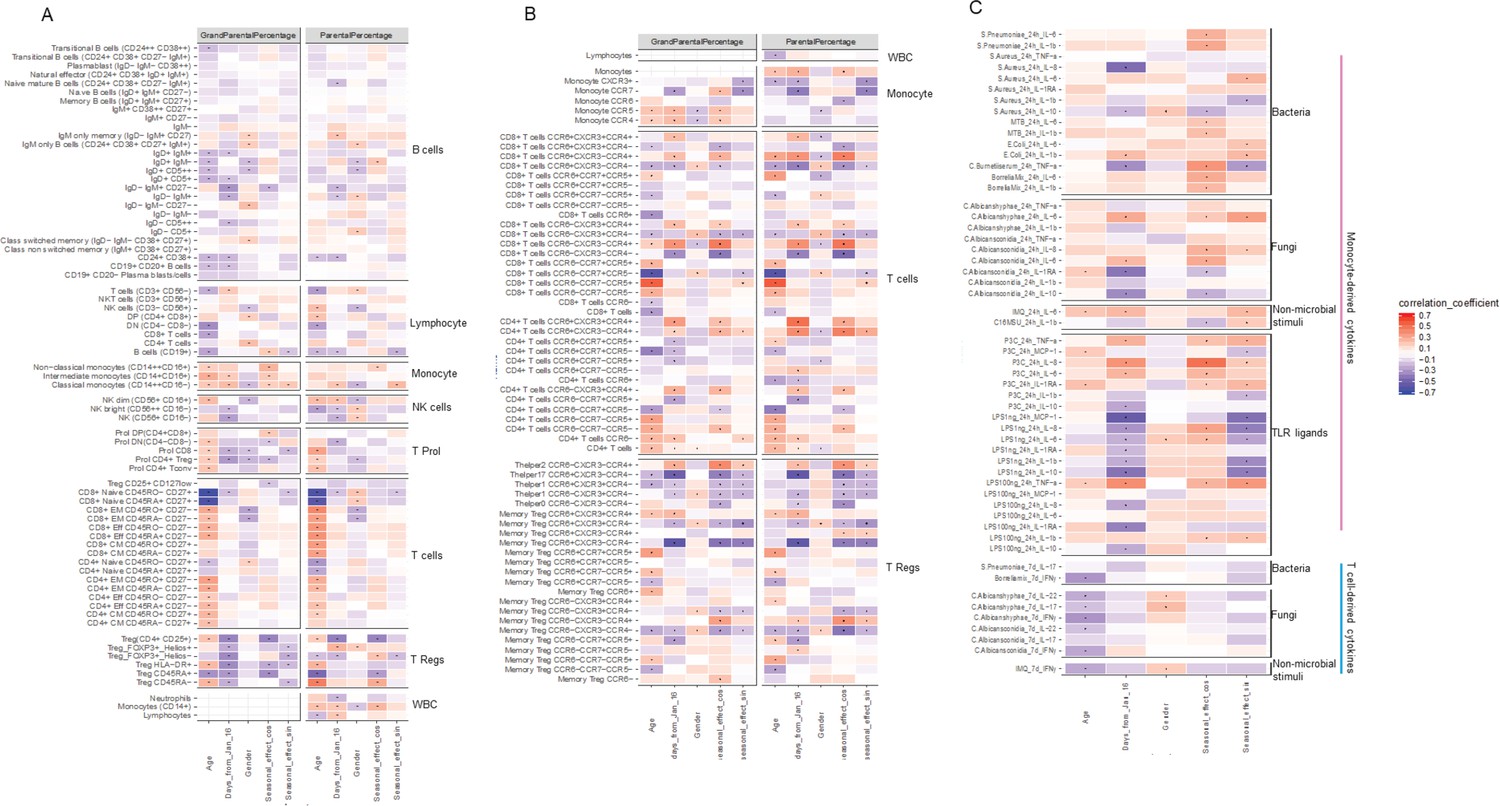
Impact of age, gender and seasons on immune phenotypes.
(A, B) Heatmaps of correlation between immune cell counts (y-axis) and age, gender, seasons (x-axis). Correlation coefficients were indicated by colors, and significant correlations (FDR <0.05) are labeled by dots. (C) Heatmap of correlation between cytokines levels upon stimulations and age, gender, seasons. Correlation coefficients were indicated by colors, and significant correlations (FDR <0.05) are labeled by dots.
Additional files
-
Supplementary file 1
Genetic mapping and summary statistics of immune phenotypes in type 1 diabetes (T1D).
(A) Definition of parental and grandparental cell types. (B) Numbers and basic characteristics of participants included in the study. (C) Summary statistics of reported T1D genome-wide association studies (GWAS) single-nucleotide polymorphisms (SNPs) in 300DM and 500FG. (D) Summary statistics of GWAS loci in cell proportion quantitative trait loci (QTLs) profile. (E) Summary statistics of GWAS loci in cytokine QTLs profile. (F) Genomic loci identified in T1D and meta-analysis.
- https://cdn.elifesciences.org/articles/73709/elife-73709-supp1-v2.xlsx
-
Transparent reporting form
- https://cdn.elifesciences.org/articles/73709/elife-73709-transrepform1-v2.docx
Download links
A two-part list of links to download the article, or parts of the article, in various formats.
Downloads (link to download the article as PDF)
Open citations (links to open the citations from this article in various online reference manager services)
Cite this article (links to download the citations from this article in formats compatible with various reference manager tools)
A genome-wide functional genomics approach uncovers genetic determinants of immune phenotypes in type 1 diabetes
eLife 11:e73709.
https://doi.org/10.7554/eLife.73709


