Improvement of muscle strength in a mouse model for congenital myopathy treated with HDAC and DNA methyltransferase inhibitors
- Neuromuscular Research Group, Departments of Neurology and Biomedicine, Basel University Hospital, Switzerland
- Division of Clinical Pharmacology & Toxicology, Department of Biomedicine, University and University Hospital Basel, Switzerland
- Genome plasticity group, Department of Biomedicine, University of Basel, Switzerland
- CAST, Center for Advanced Studies and Technology & DMSI, Dept. of Neuroscience, Imaging and Clinical Sciences, Univ. G. d’Annunzio, Italy
- Department of Life Science and Biotechnology, University of Ferrara, Italy
Figures
Figure 1 with 1 supplement
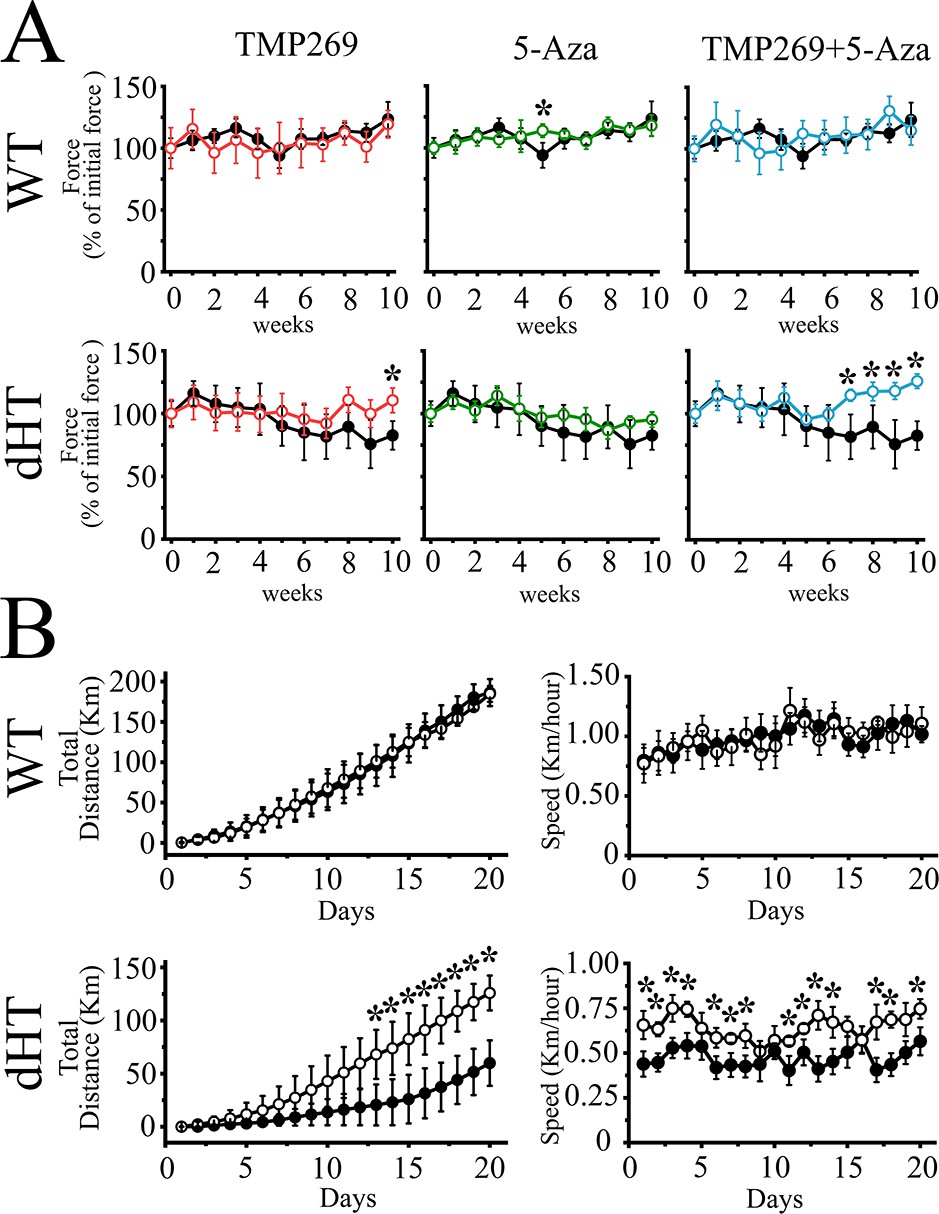
Treatment of double heterozygous (dHT) mice with TMP269 + 5-aza-2-deoxycytidine (5-Aza) improves in vivo muscle function as assessed using the grip strength test and voluntary running wheel.
(A) Forelimb (two paws) grip force measurement of wild type (WT) (upper panels) and dHT (lower panels) mice treated with vehicle (WT, n = 9; dHT, n = 10), TMP269 (WT, n = 11; dHT, n = 6), 5-Aza (WT, n = 5, dHT, n = 10), and TMP269 + 5-Aza (WT, n = 10, dHT, n = 13). Grip strength was performed once per week during a period of 10 weeks. Each symbol represents the average (± SD) grip force obtained in the indicated number (n) of mice. Grip force (Force) values obtained on the first week were considered 100%. Black symbols, vehicle-treated mice, colored symbols, drug-treated mice. Statistical analysis was conducted using the Mann-Whitney test. *p < 0.05. (B) Spontaneous locomotor (dark phase) activity (left panel) and total running speed (right panel) measured over 20 days in 21-week-old dHT and WT littermates mice treated with vehicle or TMP269 + 5-Aza. Data points are expressed as mean (± SD; n = 4–5 individual mice). *p < 0.05 (Mann-Whitney test). The exact p value for day 20 is given in the text.
-
Figure 1—source data 1
Grip strength in double heterozygous (dHT) mice is improved after 10 weeks of treatment with TMP269 + 5-aza-2-deoxycytidine (5-Aza).
Each line represents the average grip strength (in grams) per mouse, calculated by averaging five measurements obtained from the same mouse. The graphs show raw data of grip strength before treatment (t = 0; gray symbols) and 10 weeks after treatment (red symbols). N = 7 for vehicle-treated dHT mice and N = 12 TMP289 + 5-Aza-treated dHT mice.
- https://cdn.elifesciences.org/articles/73718/elife-73718-fig1-data1-v2.zip
Figure 1—figure supplement 1
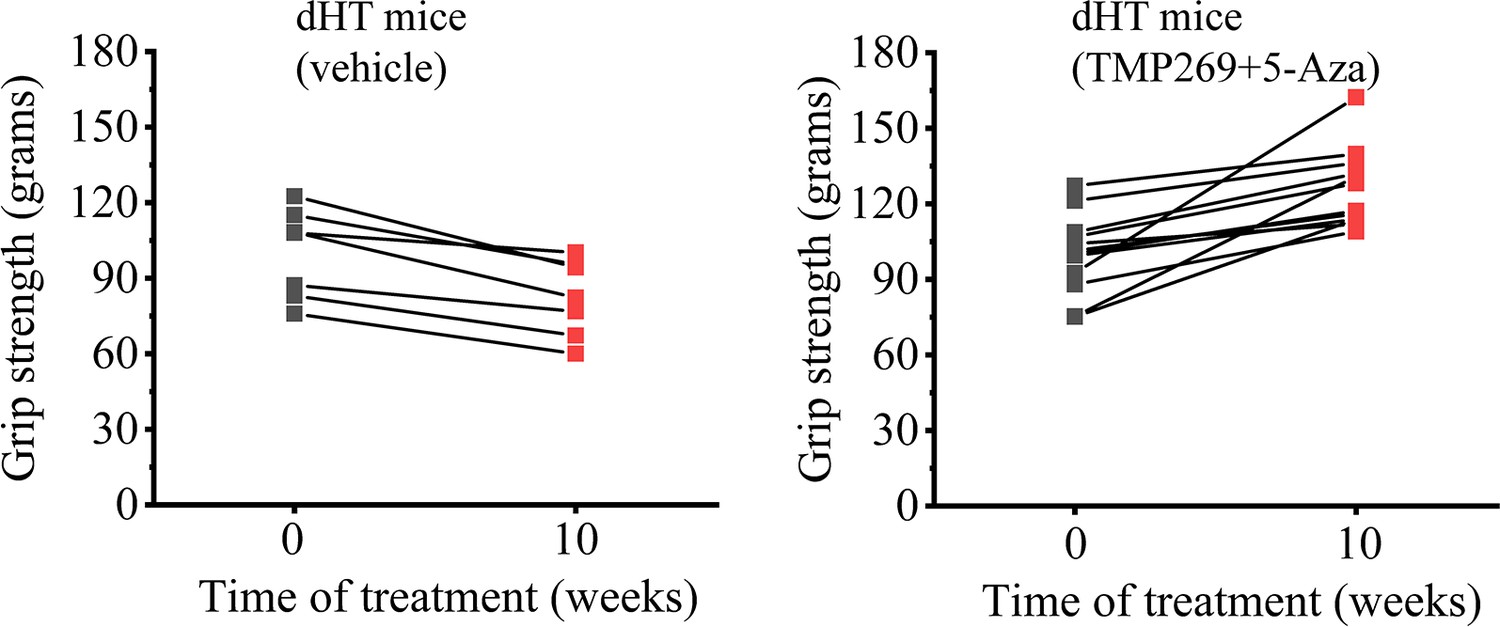
Grip strength in double heterozygous (dHT) mice is improved after 10 weeks of treatment with TMP269 + 5-aza-2-deoxicytidine (5-Aza).
Figure 2
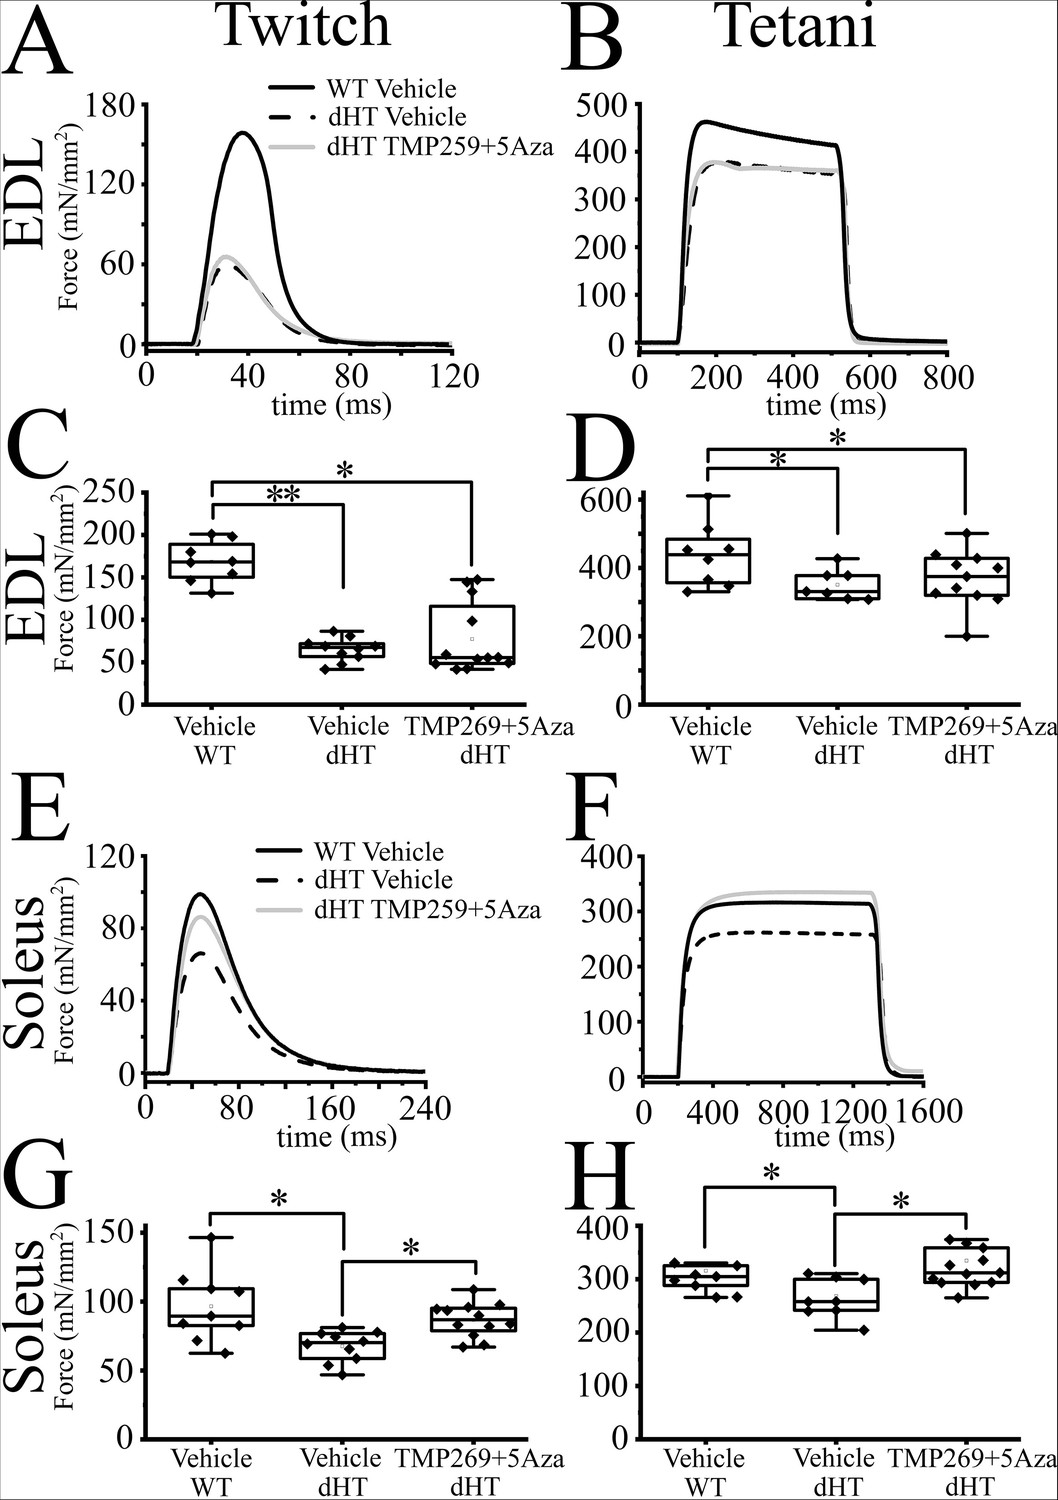
The mechanical properties of double heterozygous (dHT) treated with TMP269 + 5-aza-2-deoxycytidine (5-Aza) improve after 15 weeks of treatment.
Mechanical properties of extensor digitorum longus (EDL) and soleus muscle from wild type (WT) and dHT mice treated with vehicle (WT, n = 8; dHT, n = 10) and dHT treated with TMP269 + 5-Aza, n = 13. (A) Representative traces of twitch and (B) maximal tetanic force in EDL (150 Hz) muscle from WT and dHT. Force is expressed as specific force, mN/mm2. (C) Statistical analysis of force generated after twitch and (D) tetanic stimulation of isolated EDL muscle. Data points are expressed as Whisker plots (n = 8–13 mice). Each symbol represents the value from a muscle from a single mouse. (E) Representative traces of twitch and (F) maximal tetanic force (120 Hz) of soleus muscle from WT and dHT mice. (G) Whisker plots of force generated after twitch and (H) tetanic stimulation of isolated soleus muscles. Each symbol represents the value from a muscle from a single mouse (n = 8–13 mice). *p < 0.05; **p < 0.01 (ANOVA followed by the Bonferroni post hoc test). The exact p values are given in Supplementary file 2.
Figure 3
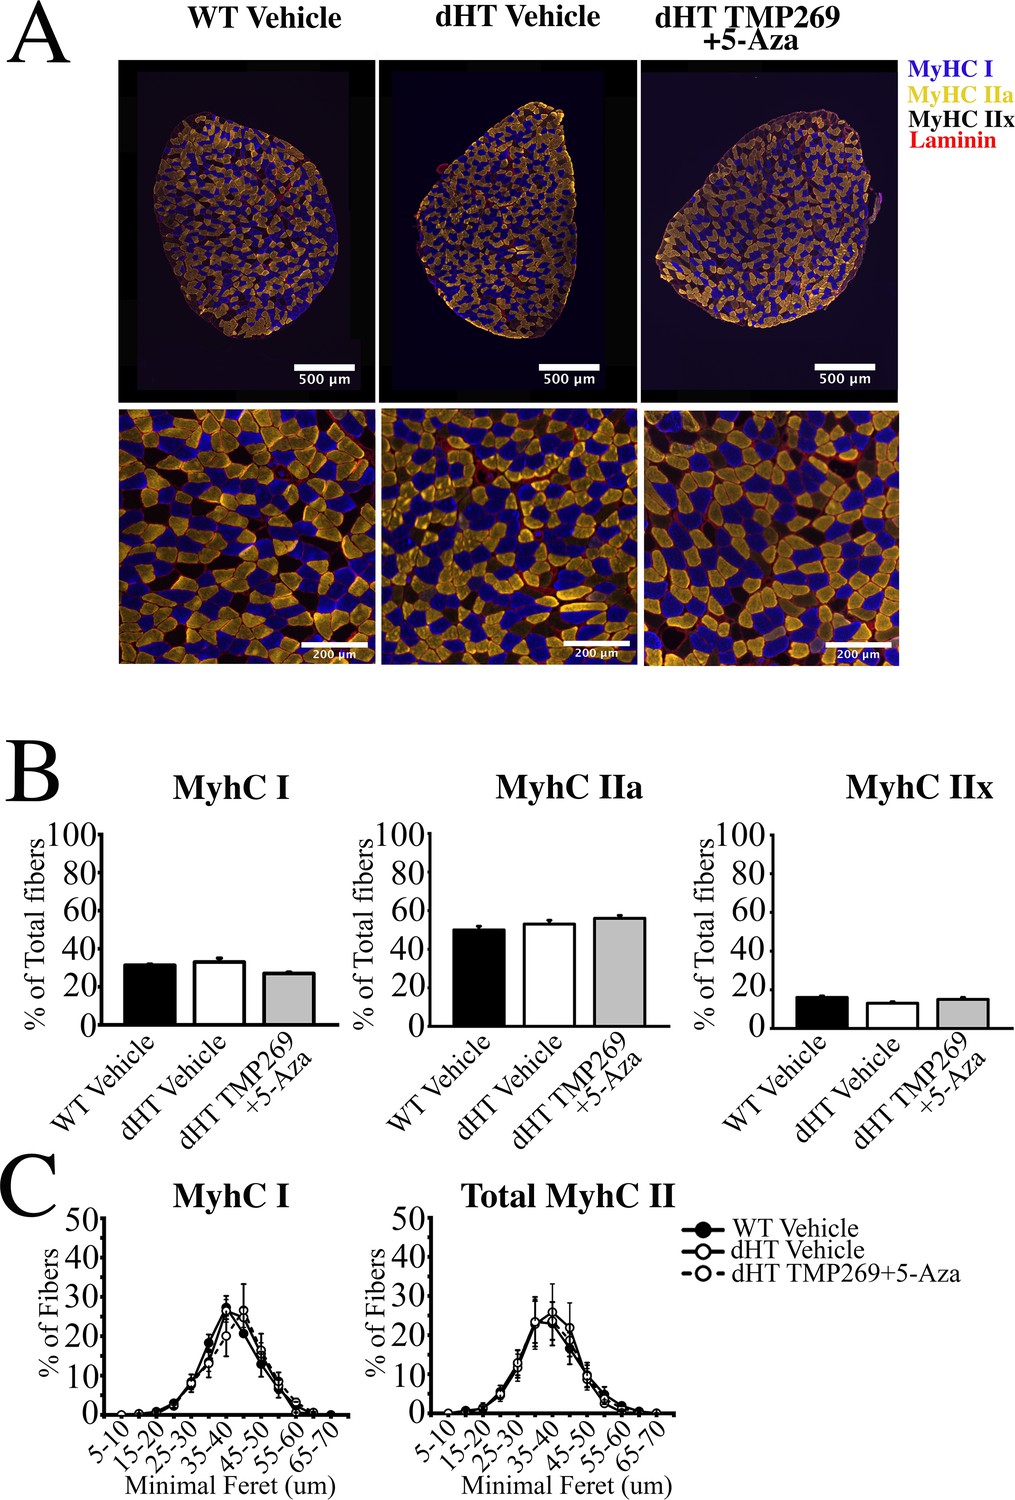
Histology of soleus muscles from TMP269 + 5-aza-2-deoxycytidine (5-Aza) and vehicle-treated double heterozygous (dHT) mice.
(A) Analysis of soleus muscles from wild type (WT) (vehicle-treated) and dHT (vehicle and TMP269 + 5-Aza-treated) mice using monoclonal antibodies specific for myosin heavy chain (MyHC) isoforms. Frozen muscle sections were stained with anti-MyHC I antibodies (slow fibers, blue), anti-MyHC IIa antibodies (fast fibers, yellow), and counterstained with anti-laminin antibodies (red). MyHCIIx (fast fibers) are unstained. (B) Bar plots of fiber type composition of soleus muscles. Left, mean (%, ± SEM) MyHC I fibers, middle, mean (%, ± SEM) MyHC IIa fibers, right mean (%, ± SEM) MyHC IIx fibers. (C) Minimal Feret’s distribution of type I and type II fibers. Data points are expressed as mean (± SEM). For WT vehicle treated a total of 2881 fibers from 3 mice were counted, for dHT vehicle treated a total of 2642 fibers from 3 mice were counted, for dHT TMP269 + 5-Aza a total of 2983 fibers from 3 mice were counted.
Figure 4

Electrically evoked peak Ca2+ transients in muscle fibers from treated double heterozygous (dHT) compound heterozygous (dHT) mice was rescued by TMP269 + 5-aza-2-deoxycytidine (5-Aza) administration.
Enzymatically dissociated flexor digitorum brevis (FDB) fibers dissected from 4 to 6 mice per group, were loaded with Mag-Fluo-4 and electrically stimulated by field stimulation. Black line, vehicle-treated wild type (WT), gray line, vehicle-treated dHT, red line, TMP269 + 5-Aza-treated dHT. (A) Representative Ca2+ transient evoked by a single pulse (twitch) of 50 V with a duration of 1 ms. (B) Whisker plots of peak twitch. Each symbol represents results obtained from a single FDB fiber. (C) Representative Ca2+ transient evoked by tetanic stimulation by a train of pulses delivered at 100 Hz for 300 ms. (D) Whisker plots of peak transient induced by tetanic stimulation. Each symbol represents results obtained from a single FDB fiber. *p < 0.05 (ANOVA followed by the Bonferroni post hoc test). The exact p values are given in Supplementary file 4.
Figure 5
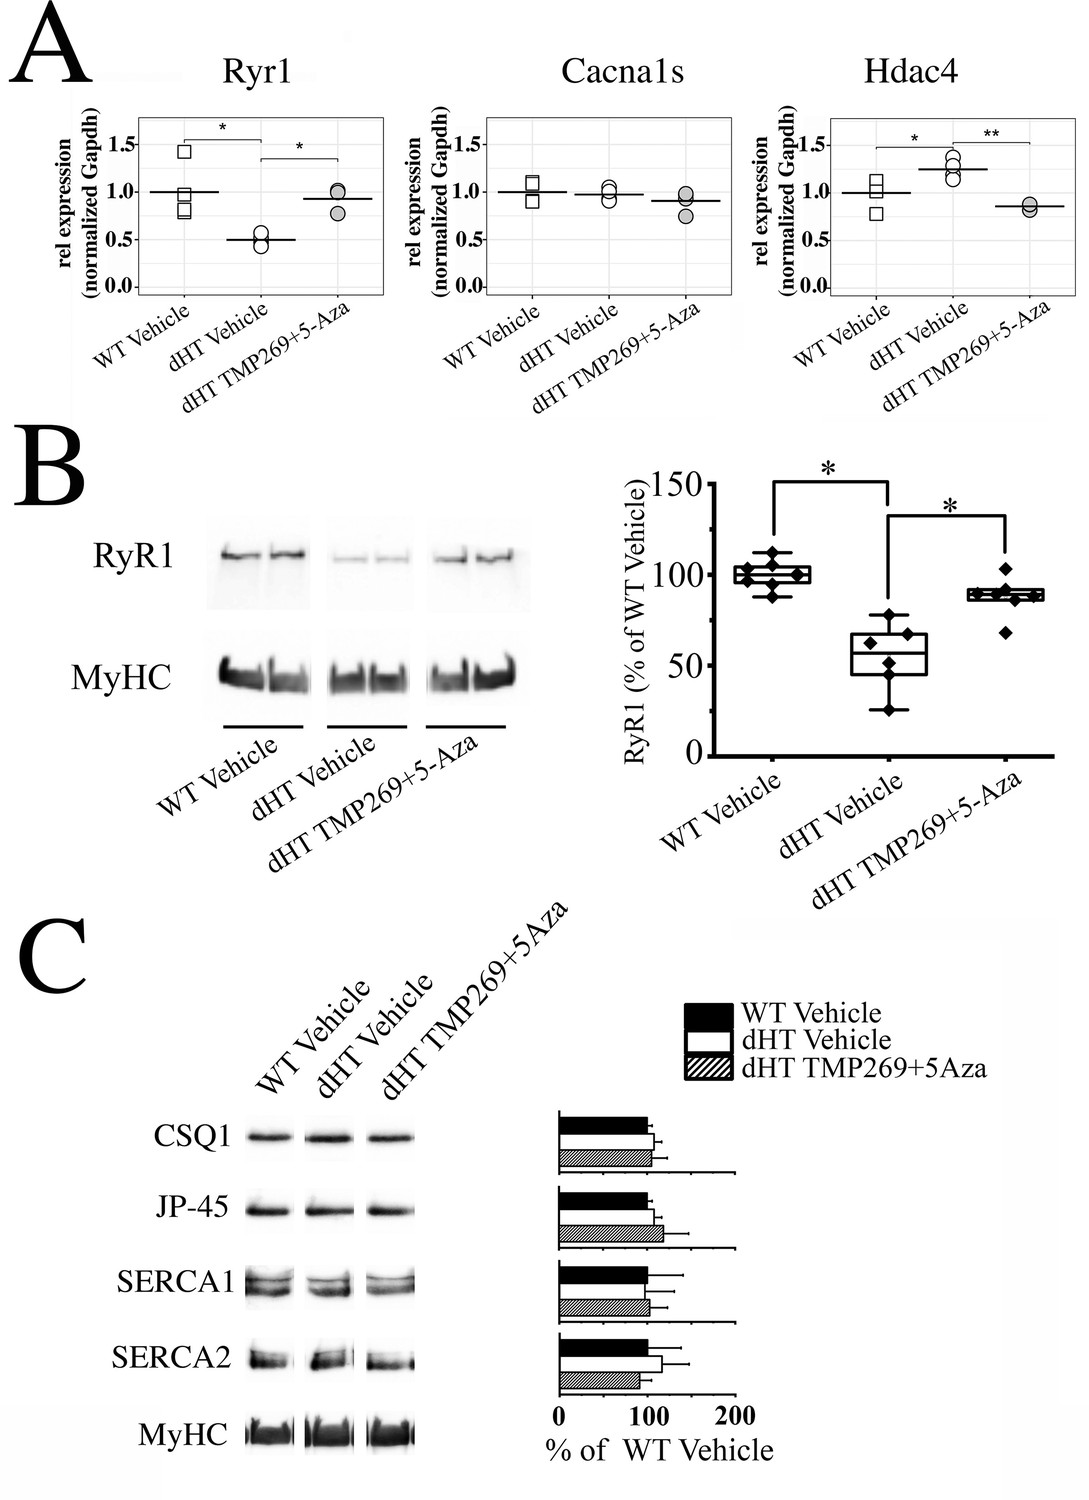
Treatment with TMP269 + 5-aza-2-deoxycytidine (5-Aza) reverses ryanodine receptor 1 (RyR1) loss in soleus muscles from double heterozygous (dHT) mice.
(A) Real-time quantitative polymerase chain reaction (qPCR) on RNA isolated from soleus muscles isolated from vehicle-treated wild type (WT) and vehicle-treated and TMP269 + 5-Aza-treated dHT mice. Experiments were carried out on muscles isolated from 4 mice per group. RNA isolation and amplification conditions as described in the Materials and methods section. *p < 0.05; **p < 0.01 ANOVA followed by the Bonferroni post hoc test. (B) Western blot analysis of RyR1 content in total homogenates of soleus muscle from WT and dHT mice treated with vehicle or TMP269 + 5-Aza. Proteins were separated on a 6% SDS-PAGE, blotted overnight onto nitrocellulose. Left panel: representative images of blot probed with anti-RyR1 Ab followed by anti-MyHC Ab for normalization. Right panel: data points are expressed as Whisker plots *p < 0.05 (ANOVA followed by the Bonferroni post hoc test). (C) (Left panel) representative immunoblots of total homogenates soleus muscles from WT (vehicle) and dHT (vehicle and TMP269 + 5-Aza) mice probed with the indicated antibodies. (Right panel) bar histograms showing the mean ± SD (n = 4 mice per group) intensity of the immunopositive band, expressed as % of the intensity of the band in WT (vehicle-treated) mice. MyHC was used for loading protein normalization. Forty µg of protein were loaded per lane and proteins were separated on 7.5% or 10% SDS-PAG. Exact p values are given in the text.
-
Figure 5—source data 1
Treatment with TMP269 + 5-aza-2-deoxycytidine (5-Aza) reverses ryanodine receptor 1 (RyR1) loss in soleus muscles from double heterozygous (dHT) mice.
Western blot analysis of RyR1 content in total homogenates of soleus muscle from wild type (WT) and dHT mice treated with vehicle or TMP269 + 5-Aza. Proteins were separated on a 6% SDS-PAGE, blotted overnight onto nitrocellulose. Left panel: images of blot probed with anti-RyR1 Ab used in Figure 5B. Right panel: images of blot probed with anti-MyHC Ab for normalization. WT Vehicle: wild type mouse treated with vehicle; dHT Vehicle: dHT mouse treated with vehicle; dHT TMP + Aza; dHT mouse treated with TMP269 + 5-Aza; unrel sampl: unrelated sample (sample belonging to a mouse line of a different project).
- https://cdn.elifesciences.org/articles/73718/elife-73718-fig5-data1-v2.zip
-
Figure 5—source data 2
Treatment with TMP269 + 5-aza-2-deoxycytidine (5-Aza) reverses ryanodine receptor 1 (RyR1) loss in soleus muscles from double heterozygous (dHT) mice.
Western blot analysis of RyR1 content in total homogenates of soleus muscle from wild type (WT) and dHT mice treated with vehicle or TMP269 + 5-Aza. Proteins were separated on a 6% SDS-PAGE, blotted overnight onto nitrocellulose. Left panel: images of blot probed with anti-RyR1 Ab used for the quantification analysis shown in the boxplot. Right panel: images of blot probed with anti-MyHC Ab for normalization. WT Vehicle: wild type mouse treated with vehicle; dHT Vehicle: dHT mouse treated with vehicle; dHT TMP + Aza; dHT mouse treated with TMP269 + 5-Aza; unrel sampl: unrelated sample (sample belonging to a mouse line of a different project).
- https://cdn.elifesciences.org/articles/73718/elife-73718-fig5-data2-v2.zip
-
Figure 5—source data 3
Treatment with TMP269 + 5-aza-2-deoxycytidine (5-Aza) reverses ryanodine receptor 1 (RyR1) loss in soleus muscles from double heterozygous (dHT) mice.
Western blot analysis of RyR1 content in total homogenates of soleus muscle from wild type (WT) and dHT mice treated with vehicle or TMP269 + 5-Aza. Proteins were separated on a 6% SDS-PAGE, blotted overnight onto nitrocellulose. Left panel: images of blot probed with anti-RyR1 Ab used for the quantification analysis shown in the boxplot. Right panel: images of blot probed with anti-MyHC Ab for normalization.
- https://cdn.elifesciences.org/articles/73718/elife-73718-fig5-data3-v2.zip
-
Figure 5—source data 4
Treatment with TMP269 + 5-aza-2-deoxycytidine (5-Aza) does not affect CSQ1 content in soleus muscles from double heterozygous (dHT) mice.
Western blot analysis of CSQ1 content in total homogenates of soleus muscle from wild type (WT) and dHT mice treated with vehicle or TMP269 + 5-Aza. Proteins were separated on a 7.5% SDS-PAGE, blotted overnight onto nitrocellulose. Left panel: images of blot probed with anti-CSQ1 Ab used for the quantification analysis shown in the bar graph. Right panel: images of blot probed with anti-MyHC Ab for normalization. WT Vehicle: wild type mouse treated with vehicle; dHT Vehicle: dHT mouse treated with vehicle; dHT TMP + Aza; dHT mouse treated with TMP269 + 5-Aza; unrel sampl: unrelated sample (sample belonging to a mouse line of a different project).
- https://cdn.elifesciences.org/articles/73718/elife-73718-fig5-data4-v2.zip
-
Figure 5—source data 5
Treatment with TMP269 + 5-aza-2-deoxycytidine (5-Aza) does not affect CSQ1 content in soleus muscles from double heterozygous (dHT) mice.
Western blot analysis of CSQ1 content in total homogenates of soleus muscle from wild type (WT) and dHT mice treated with vehicle or TMP269 + 5-Aza. Proteins were separated on a 7.5% SDS-PAGE, blotted overnight onto nitrocellulose. Left panel: images of blot probed with anti-CSQ1 Ab used for the quantification analysis shown in the bar graph. Right panel: images of blot probed with anti-MyHC Ab for normalization. WT Vehicle: wild type mouse treated with vehicle; dHT Vehicle: dHT mouse treated with vehicle; dHT TMP + Aza; dHT mouse treated with TMP269 + 5-Aza; unrel sampl: unrelated sample (sample belonging to a mouse line of a different project).
- https://cdn.elifesciences.org/articles/73718/elife-73718-fig5-data5-v2.zip
-
Figure 5—source data 6
Treatment with TMP269 + 5-aza-2-deoxycytidine (5-Aza) does not affect JP-45 content in soleus muscles from double heterozygous (dHT) mice.
Western blot analysis of JP-45 content in total homogenates of soleus muscle from wild type (WT) and dHT mice treated with vehicle or TMP269 + 5-Aza. Proteins were separated on a 10% SDS-PAGE, blotted overnight onto nitrocellulose. Left panel: images of blot probed with anti-JP-45 Ab used for the quantification analysis shown in the bar graph. Right panel: images of blot probed with anti-MyHC Ab for normalization. WT Vehicle: wild type mouse treated with vehicle; dHT Vehicle: dHT mouse treated with vehicle; dHT TMP + Aza; dHT mouse treated with TMP269 + 5-Aza; unrel sampl: unrelated sample (sample belonging to a mouse line of a different project).
- https://cdn.elifesciences.org/articles/73718/elife-73718-fig5-data6-v2.zip
-
Figure 5—source data 7
Treatment with TMP269 + 5-aza-2-deoxycytidine (5-Aza) does not affect JP-45 content in soleus muscles from double heterozygous (dHT) mice.
Western blot analysis of JP-45 content in total homogenates of soleus muscle from wild type (WT) and dHT mice treated with vehicle or TMP269 + 5-Aza. Proteins were separated on a 10% SDS-PAGE, blotted overnight onto nitrocellulose. Left panel: images of blot probed with anti-JP-45 Ab used for the quantification analysis shown in the bar graph. Right panel: images of blot probed with anti-MyHC Ab for normalization. WT Vehicle: wild type mouse treated with vehicle; dHT Vehicle: dHT mouse treated with vehicle; dHT TMP + Aza; dHT mouse treated with TMP269 + 5-Aza; unrel sampl: unrelated sample (sample belonging to a mouse line of a different project).
- https://cdn.elifesciences.org/articles/73718/elife-73718-fig5-data7-v2.zip
-
Figure 5—source data 8
Treatment with TMP269 + 5-aza-2-deoxycytidine (5-Aza) does not affect sarco(endo)plasmic reticulum CaATPAse 1 (SERCA1) content in soleus muscles from double heterozygous (dHT) mice.
Western blot analysis of SERCA1 content in total homogenates of soleus muscle from wild type (WT) and dHT mice treated with vehicle or TMP269 + 5-Aza. Proteins were separated on a 7.5% SDS-PAGE, blotted overnight onto nitrocellulose. Left panel: images of blot probed with anti-SERCA1 Ab used for the quantification analysis shown in the bar graph. Right panel: images of blot probed with anti-MyHC Ab for normalization. WT Vehicle: wild type mouse treated with vehicle; dHT Vehicle: dHT mouse treated with vehicle; dHT TMP + Aza; dHT mouse treated with TMP269 + 5-Aza; unrel sampl: unrelated sample (sample belonging to a mouse line of a different project).
- https://cdn.elifesciences.org/articles/73718/elife-73718-fig5-data8-v2.zip
-
Figure 5—source data 9
Treatment with TMP269 + 5-aza-2-deoxycytidine (5-Aza) does not affect sarco(endo)plasmic reticulum CaATPAse 1 (SERCA1) content in soleus muscles from double heterozygous (dHT) mice.
Western blot analysis of SERCA1 content in total homogenates of soleus muscle from wild type (WT) and dHT mice treated with vehicle or TMP269 + 5-Aza. Proteins were separated on a 7.5% SDS-PAGE, blotted overnight onto nitrocellulose. Left panel: images of blot probed with anti-SERCA1 Ab used for the quantification analysis shown in the bar graph. Right panel: images of blot probed with anti-MyHC Ab for normalization. WT Vehicle: wild type mouse treated with vehicle; dHT Vehicle: dHT mouse treated with vehicle; dHT TMP + Aza; dHT mouse treated with TMP269 + 5-Aza; unrel sampl: unrelated sample (sample belonging to a mouse line of a different project).
- https://cdn.elifesciences.org/articles/73718/elife-73718-fig5-data9-v2.zip
-
Figure 5—source data 10
Treatment with TMP269 + 5-aza-2-deoxycytidine (5-Aza) does not affect sarco(endo)plasmic reticulum CaATPAse 2 (SERCA2) content in soleus muscles from double heterozygous (dHT) mice.
Western blot analysis of SERCA2 content in total homogenates of soleus muscle from wild type (WT) and dHT mice treated with vehicle or TMP269 + 5-Aza. Proteins were separated on a 7.5% SDS-PAGE, blotted overnight onto nitrocellulose. Left panel: images of blot probed with anti-SERCA1 Ab used for the quantification analysis shown in the bar graph. Right panel: images of blot probed with anti-MyHC Ab for normalization. WT Vehicle: wild type mouse treated with vehicle; dHT Vehicle: dHT mouse treated with vehicle; dHT TMP + Aza; dHT mouse treated with TMP269 + 5-Aza; unrel sampl: unrelated sample (sample belonging to a mouse line of a different project).
- https://cdn.elifesciences.org/articles/73718/elife-73718-fig5-data10-v2.zip
-
Figure 5—source data 11
Treatment with TMP269+ 5-aza-2-deoxycytidine (5-AZa) does not affect sarco(endo)plasmic reticulum CaATPAse 2 (SERCA2) content in soleus muscles from double heterozygous (dHT) mice.
Western blot analysis of SERCA2 content in total homogenates of soleus muscle from wild type (WT) and dHT mice treated with vehicle or TMP269 + 5-Aza. Proteins were separated on a 7.5% SDS-PAGE, blotted overnight onto nitrocellulose. Left panel: images of blot probed with anti-SERCA1 Ab used for the quantification analysis shown in the bar graph. Right panel: images of blot probed with anti-MyHC Ab for normalization. WT Vehicle: wild type mouse treated with vehicle; dHT Vehicle: dHT mouse treated with vehicle; dHT TMP + Aza; dHT mouse treated with TMP269 + 5-Aza; unrel sampl: unrelated sample (sample belonging to a mouse line of a different project).
- https://cdn.elifesciences.org/articles/73718/elife-73718-fig5-data11-v2.zip
Figure 6
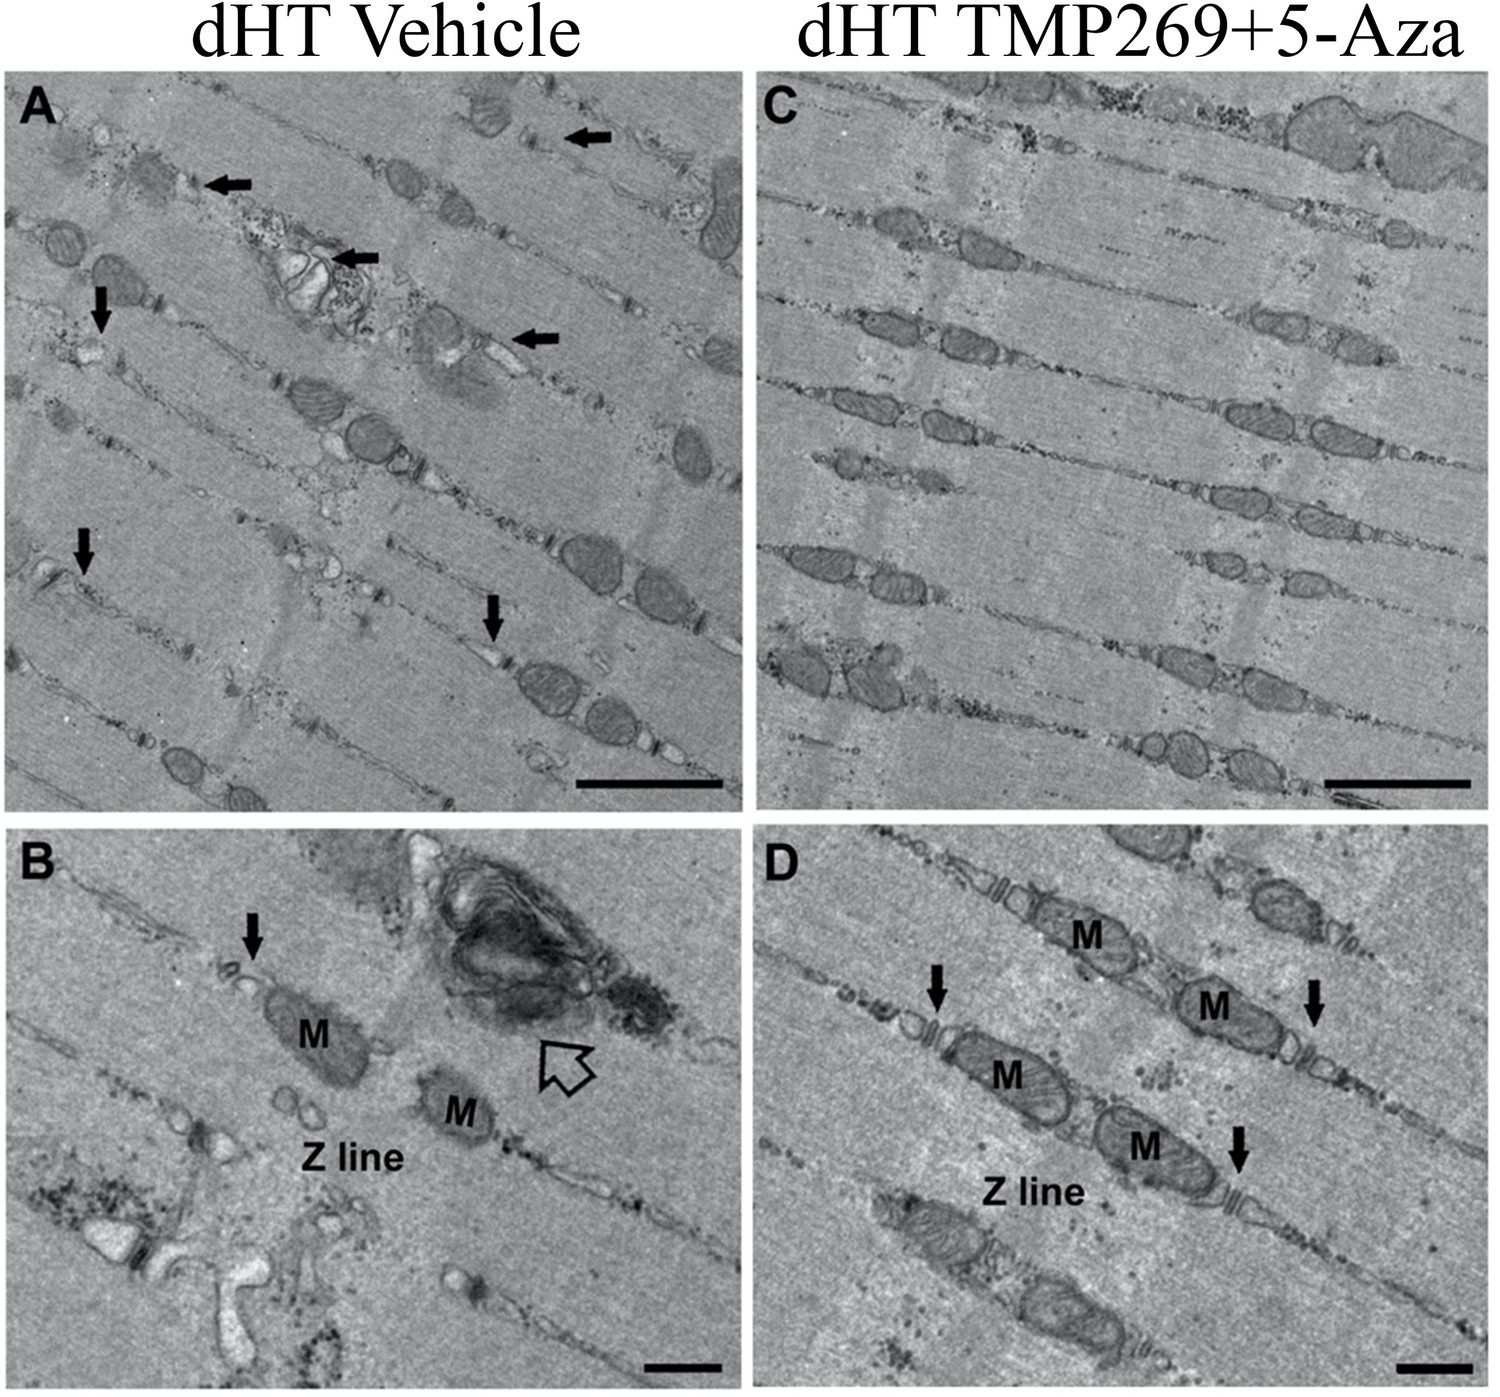
Representative electron microscopy (EM) images of soleus fibers from vehicle-treated (A and B) and TMP269 + 5-aza-2-deoxycytidine (5-Aza)-treated (C and D) double heterozygous (dHT) mice.
(A) Representative EM images at low magnification of soleus fibers from vehicle-treated and (C) TMP269 + 5-Aza-treaded dHT mice: small arrows point to dilated sarcoplasmic reticulum (SR). (B and D) Higher magnification images showing calcium release units (CRUs, black arrow) and autophagic material (empty arrow, panel B) from vehicle-treated and drug-treated (D) dHT mice. M = mitochondria. Scale bars: A and C, 1 μm; B and D, 500 nm.
Appendix 1—figure 1
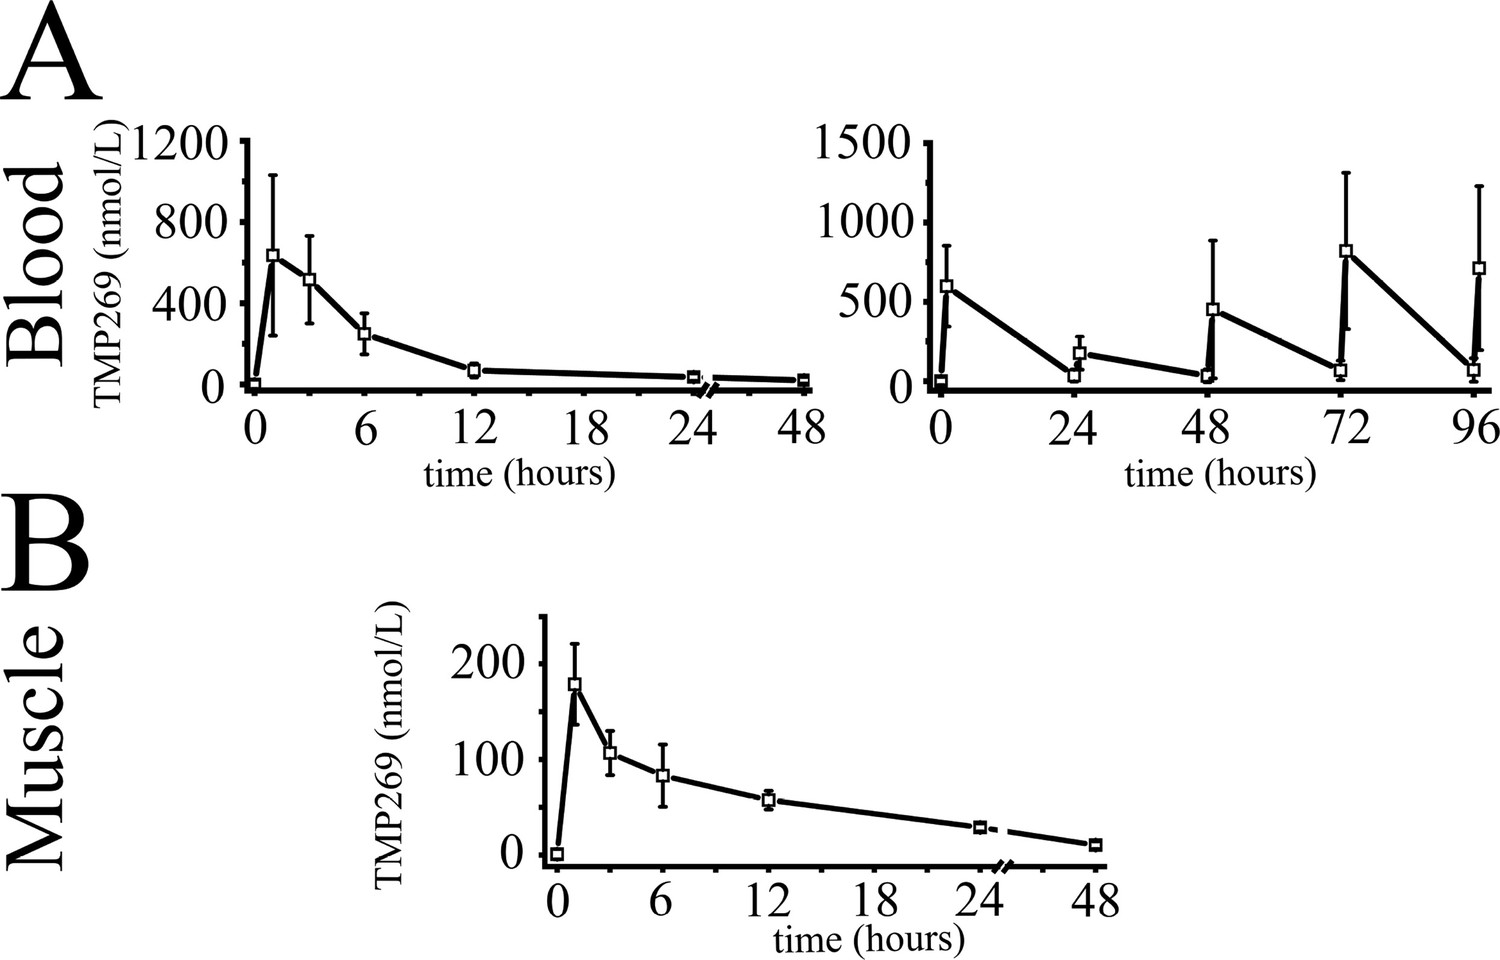
Pharmacokinetic profile of TMP269 following intraperitoneal injection in wild type (WT) mice.
(A) Concentration-time course of TMP269 in blood. Left panel: mean (± SD, n = 4 mice) plasma concentration in mice receiving a single dose of 25 mg/kg of TMP269. Right panel: mean (± SD, n = 4 mice) blood concentration of TMP269 in mice after receiving consecutive doses of 25 mg/kg of TMP269 at t = 0, 24, 48, 72, and 96 hr. Blood samples were taken 10 min before and 1 hr after each intraperitoneal injection. (B) Mean (± SD; n = 4) TMP269 concentration in skeletal muscle after a single intraperitoneal injection of 25 mg/kg TMP269, during 48 hr.
Appendix 2—figure 1

Gene Ontology (GO) analysis of hypomethylated genes in soleus muscles from double heterozygous (dHT) mice treated for 15 weeks with TMP269 + 5-Aza drug vs. vehicle-treated dHT mice.
Genes showing a ≥2.0-fold decrease in methylation (p ≤ 0.05) were analyzed by DAVID functional annotation to produce gene clusters (≥2 genes/cluster) corresponding to 51 GO annotation terms. GO terms corresponding to biological process (GOTERM_BP_FAT and KEGG_PATHWAY) were extracted and are plotted with the numbers of genes (as a percentage of the total) for each term. GO terms with <2% of the total genes were not plotted unless significantly enriched (Benjamini ≤0.05).
Appendix 2—figure 2
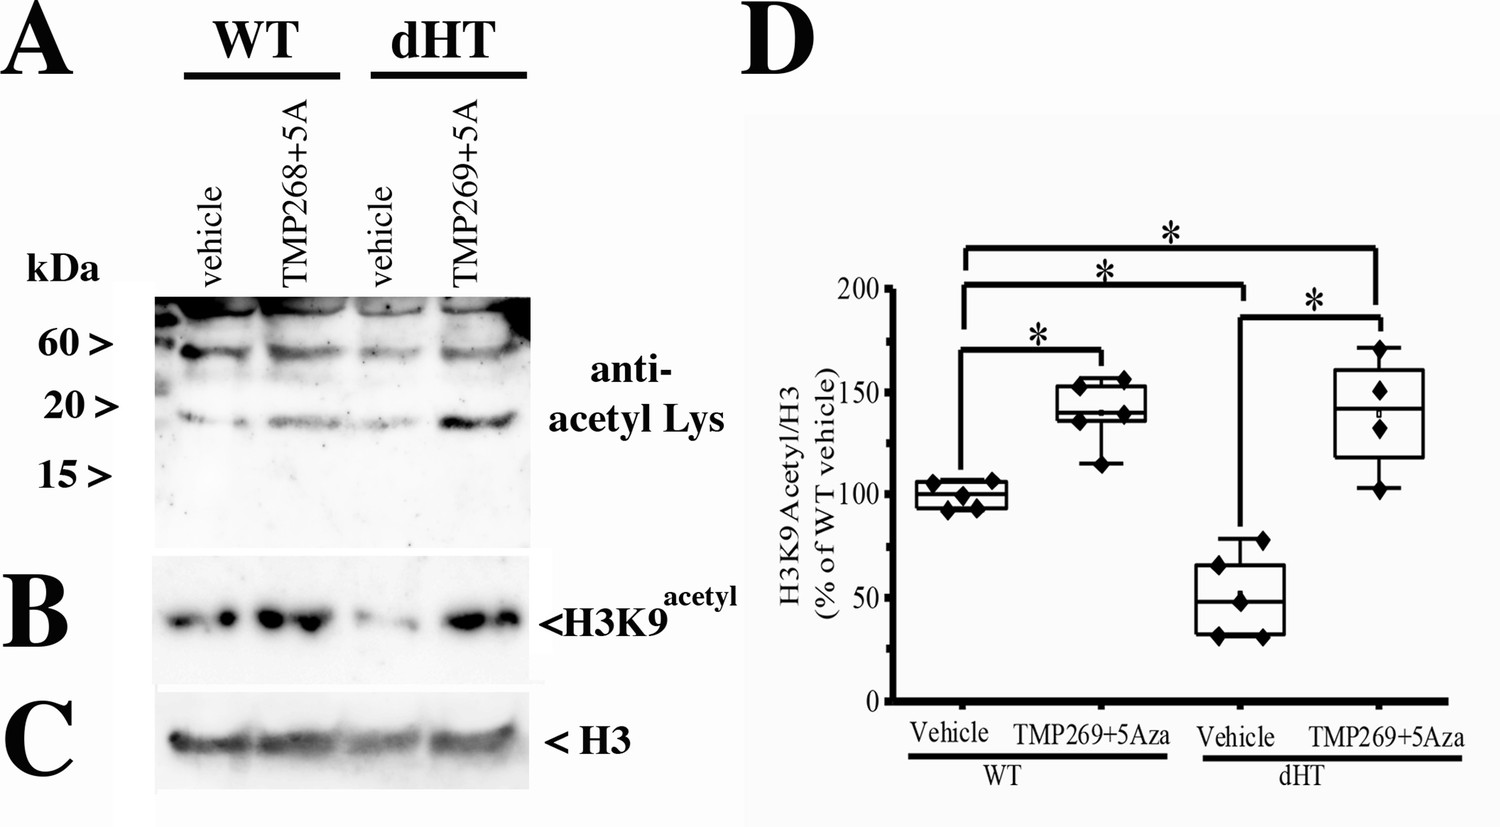
Daily intraperitoneal (i.p.) injections with TMP269 + 5-aza-2-deoxycytidine (5-Aza) increase acetylation of Lys residues and of H3K9 in muscles from double heterozygous (dHT) mice.
Wild type (WT) and dHT mice received a daily injection vehicle or 25 mg/kg TMP269 + 0.05 mg/kg 5-Aza. After 15 weeks of treatment, approximately 200 flexor digitorum brevis (FDBs) fibers per mouse were isolated and resuspended in cracking buffer (10% glycerol, 5% β-mercaptoethanol, 2.5% SDS, 62.5 mM Tris pH 6.8, 6 M urea). Protein extracts were loaded on a Tris-Tricine gel, blotted onto nitrocellulose and probed with (A) anti-acetyl-Lys and (B) anti-H3K9acetyl antibodies. (C) Shows the immunoreactivity of anti-H3 (histone 3) for loading control. (D) Boxplot analysis of Western blots using anti-H3K9acetyl antibodies. The immunoreactivity of the H3K9acetyl positive band obtained in muscles from vehicle-treated WT mice was set to 100%. Each symbol represents the result obtained from a single mouse. *p < 0.05 (ANOVA followed by the Bonferroni post hoc test). WT vehicle vs. WT TMP269 + 5-Aza, p = 0.041; WT vehicle vs. dHT vehicle, p = 0.037; WT vehicle vs. dHT TMP269 + 5-Aza, p = 0.042; dHT vehicle vs. dHT TMP269 + 5-Aza, p = 0.021.
-
Appendix 2—figure 2—source data 1
Daily intraperitoneal (i.p.) injections with TMP269 + 5-aza-2-deoxycytidine (5-Aza) increase acetylation of Lys residues and of H3K9 in muscles from double heterozygous (dHT) mice.
- https://cdn.elifesciences.org/articles/73718/elife-73718-app2-fig2-data1-v2.tiff
-
Appendix 2—figure 2—source data 2
Daily intraperitoneal (i.p.) injections with TMP269 + 5-aza-2-deoxycytidine (5-Aza) increase acetylation of Lys residues and of H3K9 in muscles from double heterozygous (dHT) mice.
Wild type (WT) and dHT mice received a daily injection vehicle or 25 mg/kg TMP269+0.05 mg/kg 5-Aza. After 15 weeks of treatment, approximately 200 flexor digitorum brevis (FDBs) fibers per mouse were isolated and resuspended in cracking buffer. Protein extracts were loaded onto a Tris-Tricine gel, blotted onto nitrocellulose, and probed as indicated, with anti-acetyl-Lys antibodies, anti-H3K9acetyl antibodies, and anti-H3 antibodies (loading control). The three panels show the immunoreactive bands (arrows) that were used for the Boxplot analysis of Appendix 2—figure 2. The immunoreactivity of the H3K9acetyl positive band obtained in muscles from vehicle-treated WT mice was set to 100%.
- https://cdn.elifesciences.org/articles/73718/elife-73718-app2-fig2-data2-v2.zip
-
Appendix 2—figure 2—source data 3
Daily intraperitoneal (i.p.) injections with TMP269 + 5-aza-2-deoxycytidine (5-Aza) increase acetylation of Lys residues and of H3K9 in muscles from double heterozygous (dHT) mice.
Wild type (WT) and dHT mice received a daily injection vehicle or 25 mg/kg TMP269+0.05 mg/kg 5-Aza. After 15 weeks of treatment, approximately 200 flexor digitorum brevis (FDBs) fibers per mouse were isolated and resuspended in cracking buffer. Protein extracts were loaded onto a Tris-Tricine gel, blotted onto nitrocellulose, and probed as indicated, with anti-acetyl-Lys antibodies, anti-H3K9acetyl antibodies, and anti-H3 antibodies (loading control). The three panels show the immunoreactive bands (arrows) that were used for the Boxplot analysis of Appendix 2—figure 2. The immunoreactivity of the H3K9acetyl positive band obtained in muscles from vehicle-treated WT mice was set to 100%.
- https://cdn.elifesciences.org/articles/73718/elife-73718-app2-fig2-data3-v2.zip
-
Appendix 2—figure 2—source data 4
Daily intraperitoneal (i.p.) injections with TMP269 + 5-aza-2-deoxycytidine (5-Aza) increase acetylation of Lys residues and of H3K9 in muscles from double heterozygous (dHT) mice.
Wild type (WT) and dHT mice received a daily injection vehicle or 25 mg/kg TMP269+0.05 mg/kg 5-Aza. After 15 weeks of treatment, approximately 200 flexor digitorum brevis (FDBs) fibers per mouse were isolated and resuspended in cracking buffer. Protein extracts were loaded onto a Tris-Tricine gel, blotted onto nitrocellulose, and probed as indicated, with anti-acetyl-Lys antibodies, anti-H3K9acetyl antibodies, and anti-H3 antibodies (loading control). The three panels show the immunoreactive bands (arrows) that were used for the Boxplot analysis of Appendix 2—figure 2. The immunoreactivity of the H3K9acetyl positive band obtained in muscles from vehicle-treated WT mice was set to 100%.
- https://cdn.elifesciences.org/articles/73718/elife-73718-app2-fig2-data4-v2.zip
-
Appendix 2—figure 2—source data 5
Daily intraperitoneal (i.p.) injections with TMP269 + 5-aza-2-deoxycytidine (5-Aza) increase acetylation of Lys residues and of H3K9 in muscles from double heterozygous (dHT) mice.
Wild type (WT) and dHT mice received a daily injection vehicle or 25 mg/kg TMP269+0.05 mg/kg 5-Aza. After 15 weeks of treatment, approximately 200 flexor digitorum brevis (FDBs) fibers per mouse were isolated and resuspended in cracking buffer. Protein extracts were loaded onto a Tris-Tricine gel, blotted onto nitrocellulose, and probed as indicated, with anti-acetyl-Lys antibodies, anti-H3K9acetyl antibodies, and anti-H3 antibodies (loading control). The three panels show the immunoreactive bands (arrows) that were used for the Boxplot analysis of Appendix 2—figure 2. The immunoreactivity of the H3K9acetyl positive band obtained in muscles from vehicle-treated WT mice was set to 100%.
- https://cdn.elifesciences.org/articles/73718/elife-73718-app2-fig2-data5-v2.zip
Appendix 3—figure 1
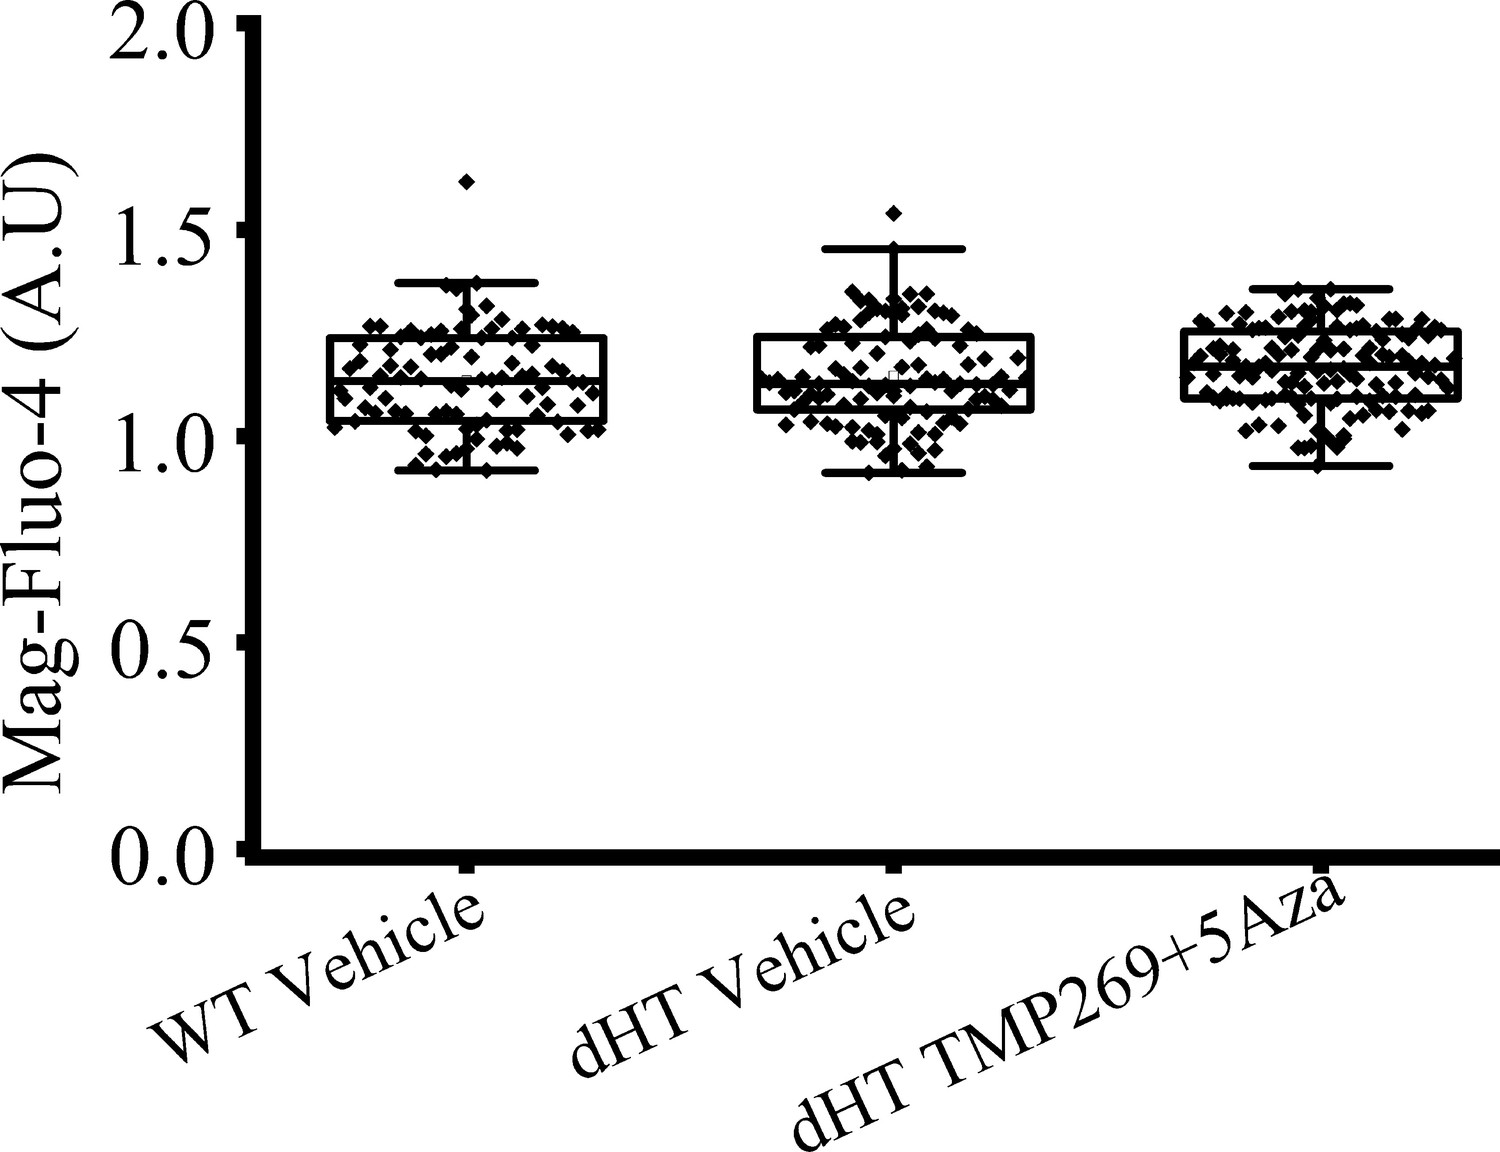
Resting fluorescence values in flexor digitorum brevis (FDB) fibers loaded with 10 µM Mag-Fluo-4.
Raw resting fluorescence values (arbitrary units, AU) were obtained from the light signal originating from a spot of 1 mm diameter of the magnified image of the FDB fiber. The light was converted into an electrical signal by a photomultiplier connected to a Nikon Eclipse TL200-E Fluorescent microscope (Nikon Instruments Inc, Amsterdam, The Netherlands) with a 20× Plan Apo VC Nikon Objective (1.4 NA). Fluorescent signals were acquired using PowerLab Chart7. Each symbol represents the fluorescence value from one FDB fiber.
Author response image 1

qPCR of Ryr1 and Slc2a4 expression levels in soleus muscles isolated from WT and dHT mice treated for 15 weeks with vehicle or TMP269+5-Aza.
Each symbol represents the value (mean of duplicate) from a single mouse.
Tables
Table 1
Quantitative analysis of calcium release units (CRUs).
In soleus fibers from TMP269 + 5-aza-2-deoxycytidine (5-Aza)-treated double heterozygous (dHT) mice, frequency of total CRUs and dyads (incomplete CRUs) are significantly rescued (columns A and B), suggesting a better preservation of CRUs and improved structure of triads.
| A | B | C | |
|---|---|---|---|
| No. of CRUs/100 µm2 | % of dyads | % of oblique longitudinal CRUs | |
| SoleusVehicle treated | 40.3 ± 2.4 | 14.2 ± 3.6 | 10.7 ± 2.0 |
| SoleusTMP269 + 5-Aza treated | *46.9 ± 2.3 | †6.5 ± 0.6 | 10.6 ± 2.6 |
-
Data are shown as mean ± SEM; n = 2 vehicle-treated soleus muscles; n=3 drug-treated soleus muscle.
-
*
p = 0.0248.
-
†
p = 0.0001.
Table 2
Quantitative analysis of mitochondria.
Soleus fibers from TMP269 + 5-aza-2-deoxycytidine (5-Aza)-treated double heterozygous (dHT) mice show a significant improvement in frequency, disposition, and morphology of mitochondria.
| A | B | C | |
|---|---|---|---|
| No. of mitochondria in 100 µm2 | No. of severely altered mitochondria in 100 µm2 (%) | No. of mitochondrion/CRU pairs in 100 µm2 | |
| SoleusVehicle treated | 59.7 ± 2.9 | 3.2 ± 0.5 (6.2) | 26.9 ± 2.2 |
| SoleusDrug treated | *71.0 ± 3.5 | †2.9 ± 0.6 (3.7) | ‡34.5 ± 2.3 |
-
Data are shown as mean ± SEM; n = 2 vehicle-treated soleus muscles; n=3 drug-treated soleus muscles.
-
*
p = 0.0175.
-
†
p = 0.0475.
-
‡
p=0.0201.
Additional files
-
Supplementary file 1
List of hypomethylated protein-encoding genes in soleus muscles from double heterozygous (dHT) mice treated for 16 weeks with TMP269 + 5-aza-2-deoxycytidine (5-Aza) drug vs. vehicle-treated dHT mice.
- https://cdn.elifesciences.org/articles/73718/elife-73718-supp1-v2.docx
-
Supplementary file 2
Specific force of extensor digitorum longus (EDL) and soleus muscle from wild type (WT) and double heterozygous (dHT) mice treated with vehicle or TMP269 + 5-aza-2-deoxycytidine (5-Aza) for 16 weeks.
- https://cdn.elifesciences.org/articles/73718/elife-73718-supp2-v2.docx
-
Supplementary file 3
Fiber type composition of soleus muscles from mice treated for 16 weeks with vehicle or TMP269 + 5-aza-2-deoxycytidine (5-Aza).
- https://cdn.elifesciences.org/articles/73718/elife-73718-supp3-v2.docx
-
Supplementary file 4
Analysis of electrically evoked calcium transients in single flexor digitorum brevis (FDB) muscle fibers isolated from wild type (WT) and double heterozygous (dHT) littermates, treated with vehicle or TMP269 + 5-aza-2-deoxycytidine (5-Aza) (25 mg/kg) for 16 weeks.
- https://cdn.elifesciences.org/articles/73718/elife-73718-supp4-v2.docx
-
Supplementary file 5
Sequence of primers used and targets.
- https://cdn.elifesciences.org/articles/73718/elife-73718-supp5-v2.docx
-
Supplementary file 6
List of antibodies and suppliers, see Zorzato et al., 2000 for JP-45.
- https://cdn.elifesciences.org/articles/73718/elife-73718-supp6-v2.docx
-
Transparent reporting form
- https://cdn.elifesciences.org/articles/73718/elife-73718-transrepform1-v2.pdf
-
Appendix 2—figure 2—source data 1
Daily intraperitoneal (i.p.) injections with TMP269 + 5-aza-2-deoxycytidine (5-Aza) increase acetylation of Lys residues and of H3K9 in muscles from double heterozygous (dHT) mice.
- https://cdn.elifesciences.org/articles/73718/elife-73718-app2-fig2-data1-v2.tiff
-
Appendix 2—figure 2—source data 2
Daily intraperitoneal (i.p.) injections with TMP269 + 5-aza-2-deoxycytidine (5-Aza) increase acetylation of Lys residues and of H3K9 in muscles from double heterozygous (dHT) mice.
Wild type (WT) and dHT mice received a daily injection vehicle or 25 mg/kg TMP269+0.05 mg/kg 5-Aza. After 15 weeks of treatment, approximately 200 flexor digitorum brevis (FDBs) fibers per mouse were isolated and resuspended in cracking buffer. Protein extracts were loaded onto a Tris-Tricine gel, blotted onto nitrocellulose, and probed as indicated, with anti-acetyl-Lys antibodies, anti-H3K9acetyl antibodies, and anti-H3 antibodies (loading control). The three panels show the immunoreactive bands (arrows) that were used for the Boxplot analysis of Appendix 2—figure 2. The immunoreactivity of the H3K9acetyl positive band obtained in muscles from vehicle-treated WT mice was set to 100%.
- https://cdn.elifesciences.org/articles/73718/elife-73718-app2-fig2-data2-v2.zip
-
Appendix 2—figure 2—source data 3
Daily intraperitoneal (i.p.) injections with TMP269 + 5-aza-2-deoxycytidine (5-Aza) increase acetylation of Lys residues and of H3K9 in muscles from double heterozygous (dHT) mice.
Wild type (WT) and dHT mice received a daily injection vehicle or 25 mg/kg TMP269+0.05 mg/kg 5-Aza. After 15 weeks of treatment, approximately 200 flexor digitorum brevis (FDBs) fibers per mouse were isolated and resuspended in cracking buffer. Protein extracts were loaded onto a Tris-Tricine gel, blotted onto nitrocellulose, and probed as indicated, with anti-acetyl-Lys antibodies, anti-H3K9acetyl antibodies, and anti-H3 antibodies (loading control). The three panels show the immunoreactive bands (arrows) that were used for the Boxplot analysis of Appendix 2—figure 2. The immunoreactivity of the H3K9acetyl positive band obtained in muscles from vehicle-treated WT mice was set to 100%.
- https://cdn.elifesciences.org/articles/73718/elife-73718-app2-fig2-data3-v2.zip
-
Appendix 2—figure 2—source data 4
Daily intraperitoneal (i.p.) injections with TMP269 + 5-aza-2-deoxycytidine (5-Aza) increase acetylation of Lys residues and of H3K9 in muscles from double heterozygous (dHT) mice.
Wild type (WT) and dHT mice received a daily injection vehicle or 25 mg/kg TMP269+0.05 mg/kg 5-Aza. After 15 weeks of treatment, approximately 200 flexor digitorum brevis (FDBs) fibers per mouse were isolated and resuspended in cracking buffer. Protein extracts were loaded onto a Tris-Tricine gel, blotted onto nitrocellulose, and probed as indicated, with anti-acetyl-Lys antibodies, anti-H3K9acetyl antibodies, and anti-H3 antibodies (loading control). The three panels show the immunoreactive bands (arrows) that were used for the Boxplot analysis of Appendix 2—figure 2. The immunoreactivity of the H3K9acetyl positive band obtained in muscles from vehicle-treated WT mice was set to 100%.
- https://cdn.elifesciences.org/articles/73718/elife-73718-app2-fig2-data4-v2.zip
-
Appendix 2—figure 2—source data 5
Daily intraperitoneal (i.p.) injections with TMP269 + 5-aza-2-deoxycytidine (5-Aza) increase acetylation of Lys residues and of H3K9 in muscles from double heterozygous (dHT) mice.
Wild type (WT) and dHT mice received a daily injection vehicle or 25 mg/kg TMP269+0.05 mg/kg 5-Aza. After 15 weeks of treatment, approximately 200 flexor digitorum brevis (FDBs) fibers per mouse were isolated and resuspended in cracking buffer. Protein extracts were loaded onto a Tris-Tricine gel, blotted onto nitrocellulose, and probed as indicated, with anti-acetyl-Lys antibodies, anti-H3K9acetyl antibodies, and anti-H3 antibodies (loading control). The three panels show the immunoreactive bands (arrows) that were used for the Boxplot analysis of Appendix 2—figure 2. The immunoreactivity of the H3K9acetyl positive band obtained in muscles from vehicle-treated WT mice was set to 100%.
- https://cdn.elifesciences.org/articles/73718/elife-73718-app2-fig2-data5-v2.zip
Download links
A two-part list of links to download the article, or parts of the article, in various formats.
Downloads (link to download the article as PDF)
Open citations (links to open the citations from this article in various online reference manager services)
Cite this article (links to download the citations from this article in formats compatible with various reference manager tools)
Improvement of muscle strength in a mouse model for congenital myopathy treated with HDAC and DNA methyltransferase inhibitors
eLife 11:e73718.
https://doi.org/10.7554/eLife.73718


