Membrane-mediated dimerization potentiates PIP5K lipid kinase activity
- Department of Chemistry and Biochemistry, University of Oregon, United States
- Institute of Molecular Biology, University of Oregon, United States
- Department of Chemistry, University of California, Berkeley, United States
- California Institute for Quantitative Biosciences, United States
- Department of Molecular and Cell Biology, United States
Figures
Figure 1 with 6 supplements
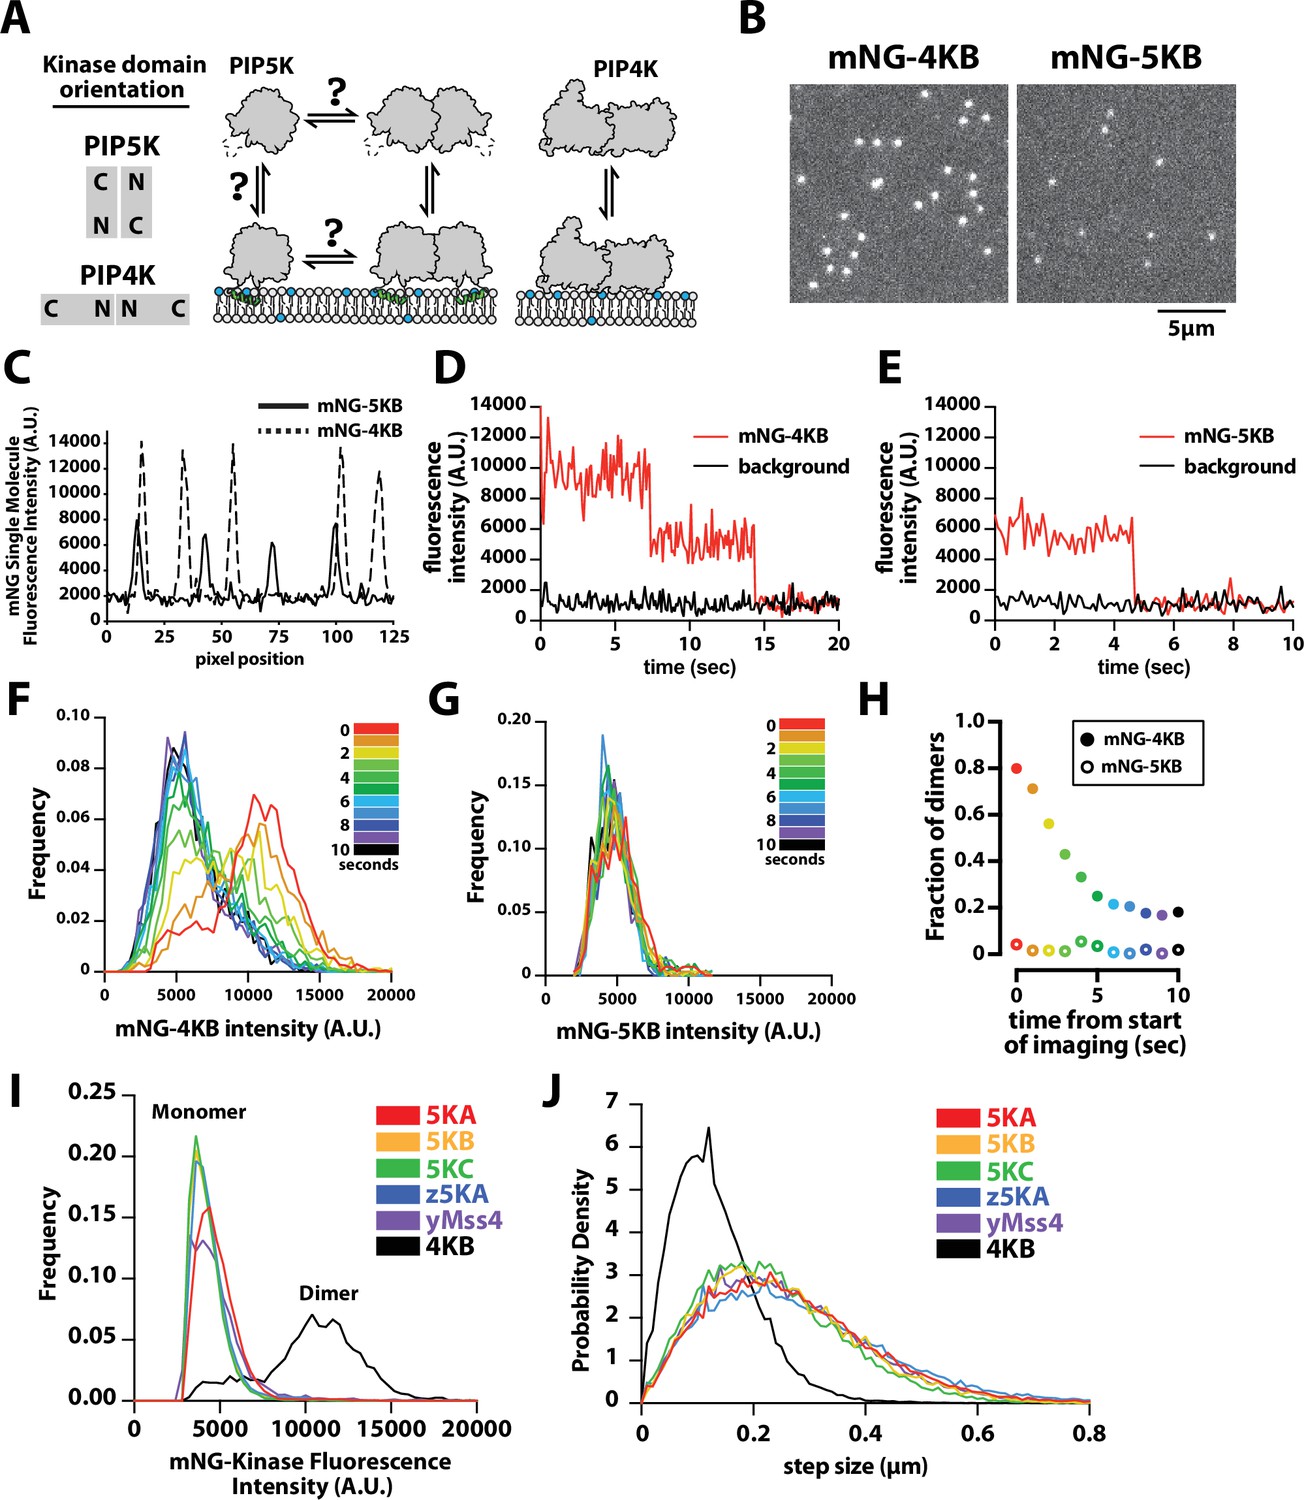
PIP4K and PIP5K can bind to PI(4,5)P2 membranes with distinct oligomeric states.
(A) Cartoon showing the kinase domain orientation and proposed oligomerization states of PIP4K and PIP5K homodimers. PIP5K potentially exists in a monomer–dimer equilibrium, while PIP4K is a constitutive dimer. (B) Single-molecule total internal reflection fluorescence (TIRF) microscopy images of supported lipid bilayers (SLBs) incubated with either 1 pM mNG-PIP4KB and 5 pM mNG-PIP5KB. (C) Intensity line scans through single mNG-PIP4KB and mNG-PIP5KB molecules bound to membranes in (B). (D, E) Single-molecule photobleaching dynamics of mNG-PIP4KB (red line) and mNG-PIP5KB (red line) compared to background fluorescence (black line). (F, G) Dynamic of change in molecular brightness frequency distribution of mNG-PIP4KB and mNG-PIP5KB during photobleaching. Each histogram represents the population distribution measured during a 1 s window over the course of a 10 s photobleaching experiment. N = 1300–1500 mNG-PIP4KB particles per second (F and Figure 1—video 1), N = 200–300 mNG-PIP5KB particles per second (G and Figure 1—video 1). (H) Probability of observing mNG-PIP4KB and mNG-PIP5KB dimers at different times during the photobleaching experiment shown in (F, G). The threshold particle intensity was ≥8200 (A.U.) to be considered a dimer from data in (F, G). Note that the fraction of mNG-PIP4KB dimers does not approach 0% because there are new membrane-binding events during the image acquisition. (I) Molecular brightness distributions measured in the presence of mNG-tagged mouse PIP5KA (5KA), human PIP5KB (5KB), human PIP5KC (5KC), zebrafish PIP5KA (z5KA), yeast Mss4 (yMss4), and human PIP4KB (4KB) (N = 3911–23304 particles per distribution). (J) Step-size distribution plots generated from single-molecule tracking in the presence of mNG-tagged 5KA (D = 0.214 µm2/s), 5KB (D = 0.191 µm2/s), 5KC (D = 0.165 µm2/s), z5KA (D = 0.234 µm2/s), yMss4 (D = 0.199 µm2/s), and 4KB (D = 0.051 µm2/s) (N > 10,000 total steps [or displacements in µm] per distribution derived from 2 to 3 technical replicates). (B–J) Membrane composition: 96% DOPC, 4% PI(4,5)P2. Note that the percentage of mature and fluorescent mNG fusions is ~80% for each labeled kinase.
-
Figure 1—source data 1
Related to Figure 1C.
- https://cdn.elifesciences.org/articles/73747/elife-73747-fig1-data1-v2.xlsx
-
Figure 1—source data 2
Rlated to Figure 1D.
- https://cdn.elifesciences.org/articles/73747/elife-73747-fig1-data2-v2.xlsx
-
Figure 1—source data 3
Related to Figure 1E.
- https://cdn.elifesciences.org/articles/73747/elife-73747-fig1-data3-v2.xlsx
-
Figure 1—source data 4
Related to Figure 1F.
- https://cdn.elifesciences.org/articles/73747/elife-73747-fig1-data4-v2.xlsx
-
Figure 1—source data 5
Related to Figure 1G.
- https://cdn.elifesciences.org/articles/73747/elife-73747-fig1-data5-v2.xlsx
-
Figure 1—source data 6
Related to Figure 1H.
- https://cdn.elifesciences.org/articles/73747/elife-73747-fig1-data6-v2.xlsx
-
Figure 1—source data 7
Related to Figure 1I.
- https://cdn.elifesciences.org/articles/73747/elife-73747-fig1-data7-v2.xlsx
-
Figure 1—source data 8
Related to Figure 1J.
- https://cdn.elifesciences.org/articles/73747/elife-73747-fig1-data8-v2.xlsx
Figure 1—figure supplement 1
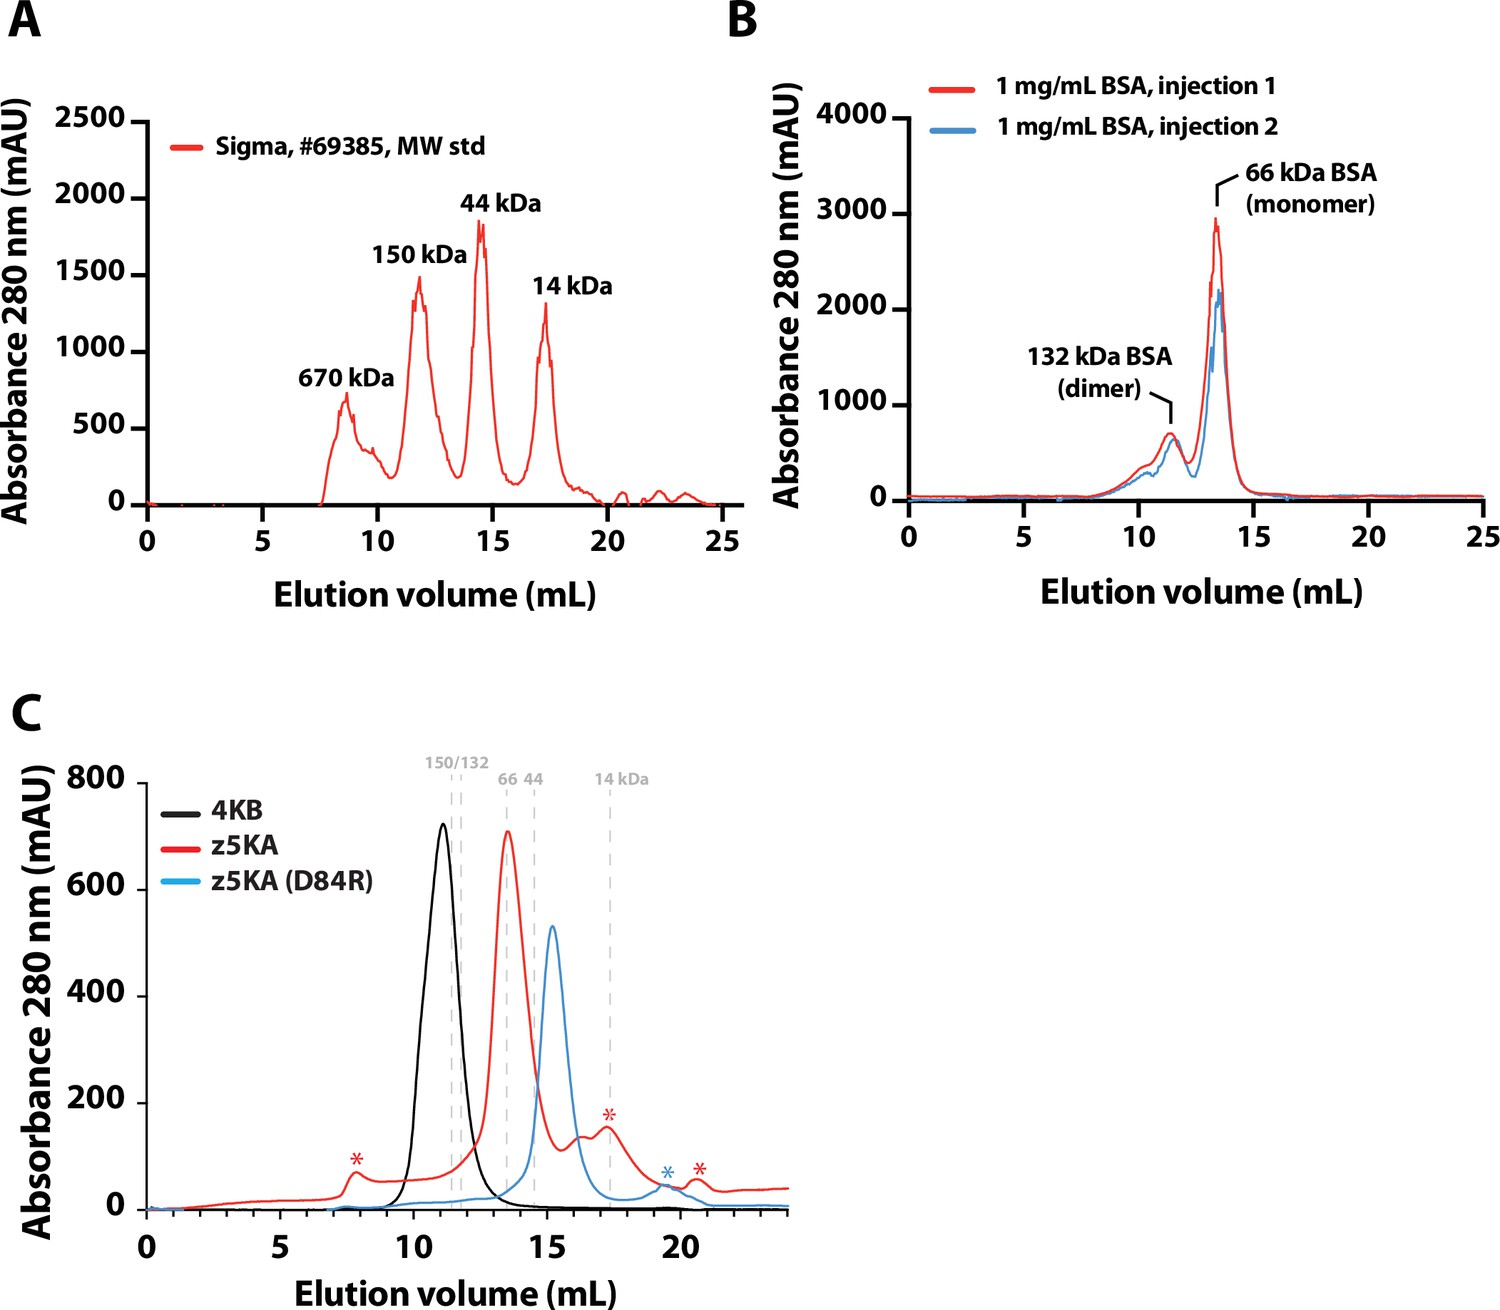
Size-exclusion chromatography (SEC) analysis of purified proteins.
(A) SEC elution profile of Sigma molecular weight standards (Cat# 69385) containing thyroglobulin bovine (~670 kDa), γ-globulins from bovine blood (~150 kDa), albumin chicken egg grade VI (~44.3 kDa), and ribonuclease A type I-A from bovine pancreas (~13.7 kDa). Sample load equals 10 mg total. (B) SEC elution profile of bovine serum albumin (BSA, Sigma Cat# A7030). Sample load equals 0.7 mg total. (C) SEC elution profile of human PIP4KB (3.3 mg total loaded; 80 µM solution concentration), zebrafish PIP5KA (2.5 mg total loaded; 70 µM solution concentration), zebrafish PIP5KA (D84R) (2 mg total loaded; 52 µM solution concentration). Asterisks represent peaks containing small molecular weight impurities that were separated during this final step in the purification protocol. (A–C) All chromatography was performed using a 24 mL Superdex 200 column (GE Healthcare, Cat# 17-5175-01) with buffer containing 20 mM HEPES (pH 7.5), 150 mM NaCl, 1 mM TCEP.
-
Figure 1—figure supplement 1—source data 1
Related to Figure 1—figure supplement 1.
- https://cdn.elifesciences.org/articles/73747/elife-73747-fig1-figsupp1-data1-v2.xlsx
Figure 1—figure supplement 2
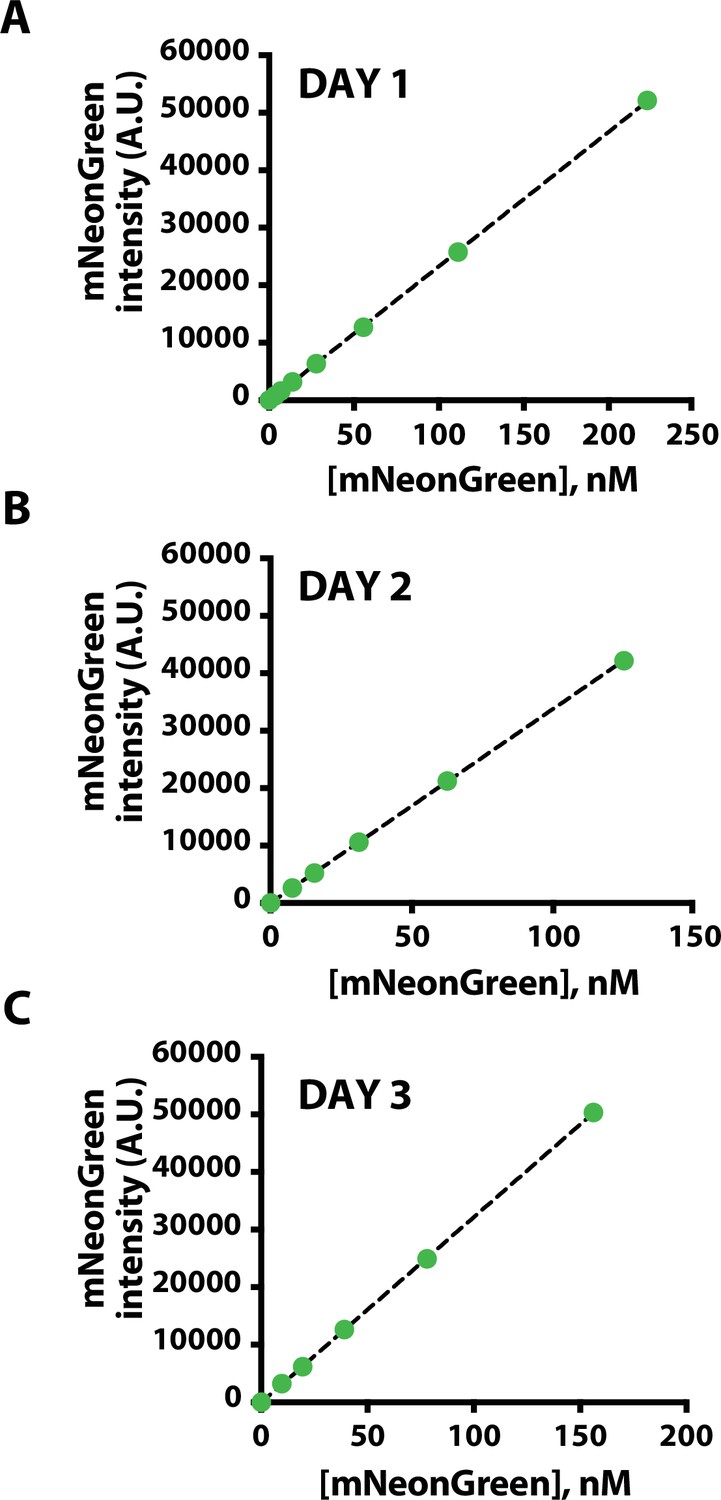
mNeonGreen calibration curve for measuring the solution concentration in cell lysate.
(A–C) Plot showing the linear relationship between the concentration of purified mNeonGreen and fluorescence emission intensity of the solution measured using a BioTek 96-well plate reader. Curves were fit using standard linear regression.
-
Figure 1—figure supplement 2—source data 1
related to Figure 1—figure supplement 2.
- https://cdn.elifesciences.org/articles/73747/elife-73747-fig1-figsupp2-data1-v2.xlsx
Figure 1—figure supplement 3
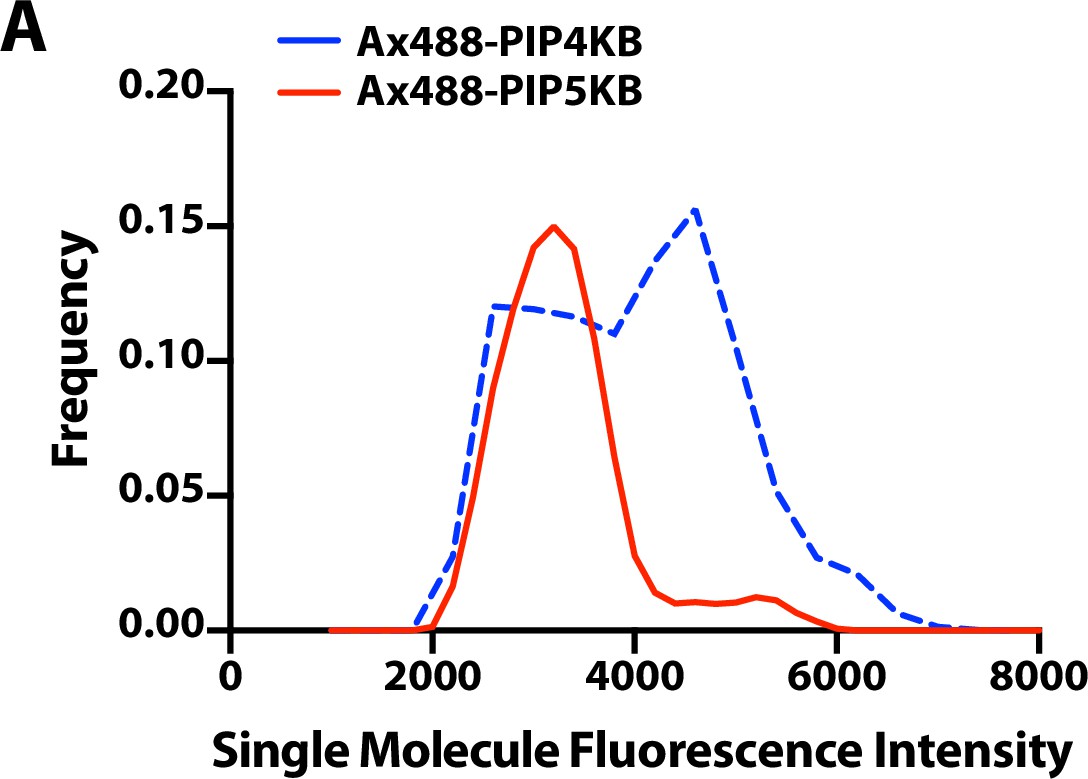
Molecular brightness distribution of Ax488-PIP4KB and Ax488-PIP5KB.
(A) Single-molecule brightness distributions for Sortase-labeled Alexa488-PIP4K and Alexa488-PIP5K bound to supported membranes containing 96% DOPC and 4% PI(4,5)P2.
-
Figure 1—figure supplement 3—source data 1
Related to Figure 1—figure supplement 3.
- https://cdn.elifesciences.org/articles/73747/elife-73747-fig1-figsupp3-data1-v2.xlsx
Figure 1—figure supplement 4
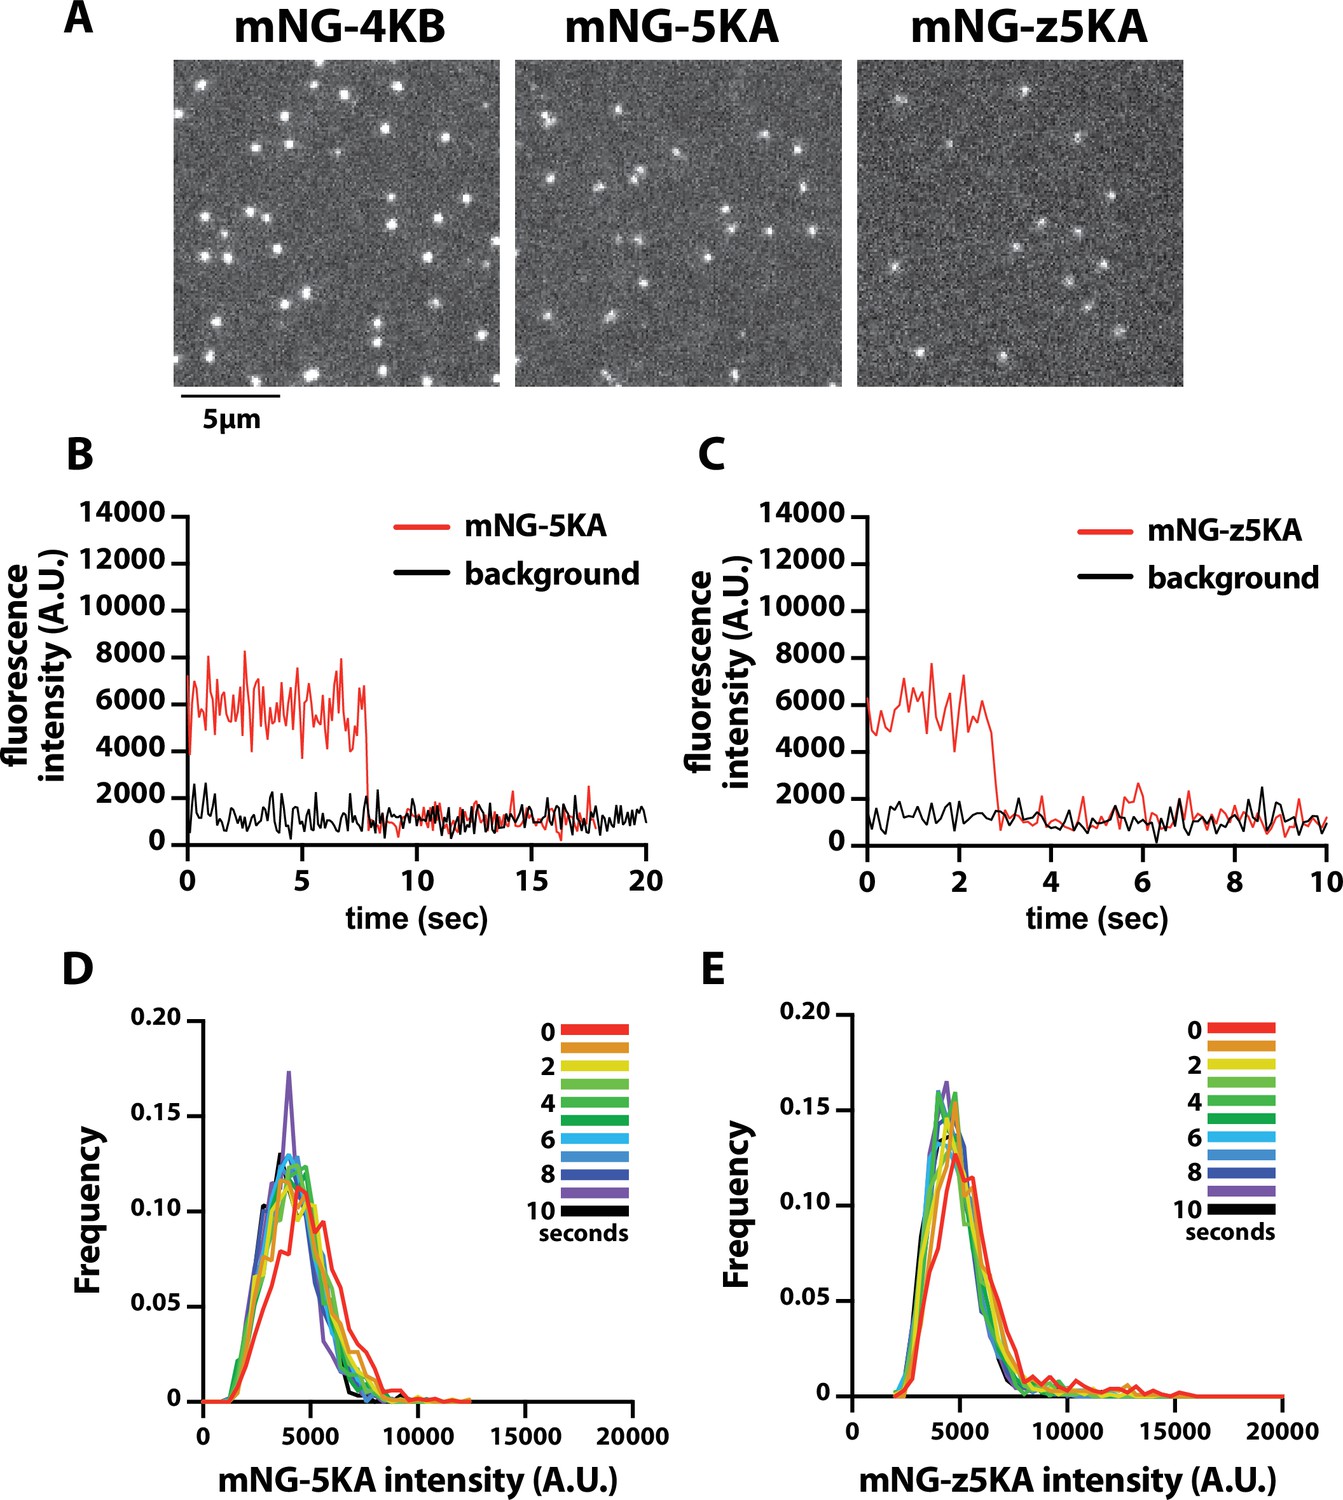
Molecular brightness and photobleaching analysis of mNG-PIP4K and mNG-PIP5K.
(A) Single-molecule total internal reflection fluorescence (TIRF) microscopy images of supported lipid bilayers (SLBs) incubated with either 1 pM mNG-PIP4KB, 5 pM mNG-mPIP5KA, or 5 pM mNG-zPIP5KA. (B, C) Single-molecule photobleaching dynamics of mNG-mPIP5KA (B, red line) and mNG-zPIP5KA (C, red line) compared to background fluorescence (black line). (D, E) Dynamic change in molecular brightness frequency distribution of mNG-mPIP5KA and mNG-zPIP5KA during photobleaching. Each histogram represents the population distribution measured during a 1 s window over the course of a 10 s photobleaching experiment (N = 564–1149 mNG-mPIP5KA particles observed per second, N = 810–1699 mNG-zPIP5KA particles observed per second). (A–E) Membrane composition: 96% DOPC, 4% PI(4,5)P2.
-
Figure 1—figure supplement 4—source data 1
Related to Figure 1—figure supplement 4.
- https://cdn.elifesciences.org/articles/73747/elife-73747-fig1-figsupp4-data1-v2.xlsx
Figure 1—video 1
Membrane -binding dynamics and multistep photobleaching of mNG-PIP4KB visualized by single-molecule total internal reflection fluorescence (smTIRF) microscopy.
Membrane composition: 96% DOPC, 4% PI(4,5)P2. Video associated with Figure 1. Scale bar is 2 µm.
Figure 1—video 2
Membrane -binding dynamics and single -step photobleaching of mNG-PIP5KB visualized by single-molecule total internal reflection fluorescence (smTIRF) microscopy.
Membrane composition: 96% DOPC, 4% PI(4,5)P2. Video associated with Figure 1. Scale bar is 2 µm.
Figure 2 with 5 supplements
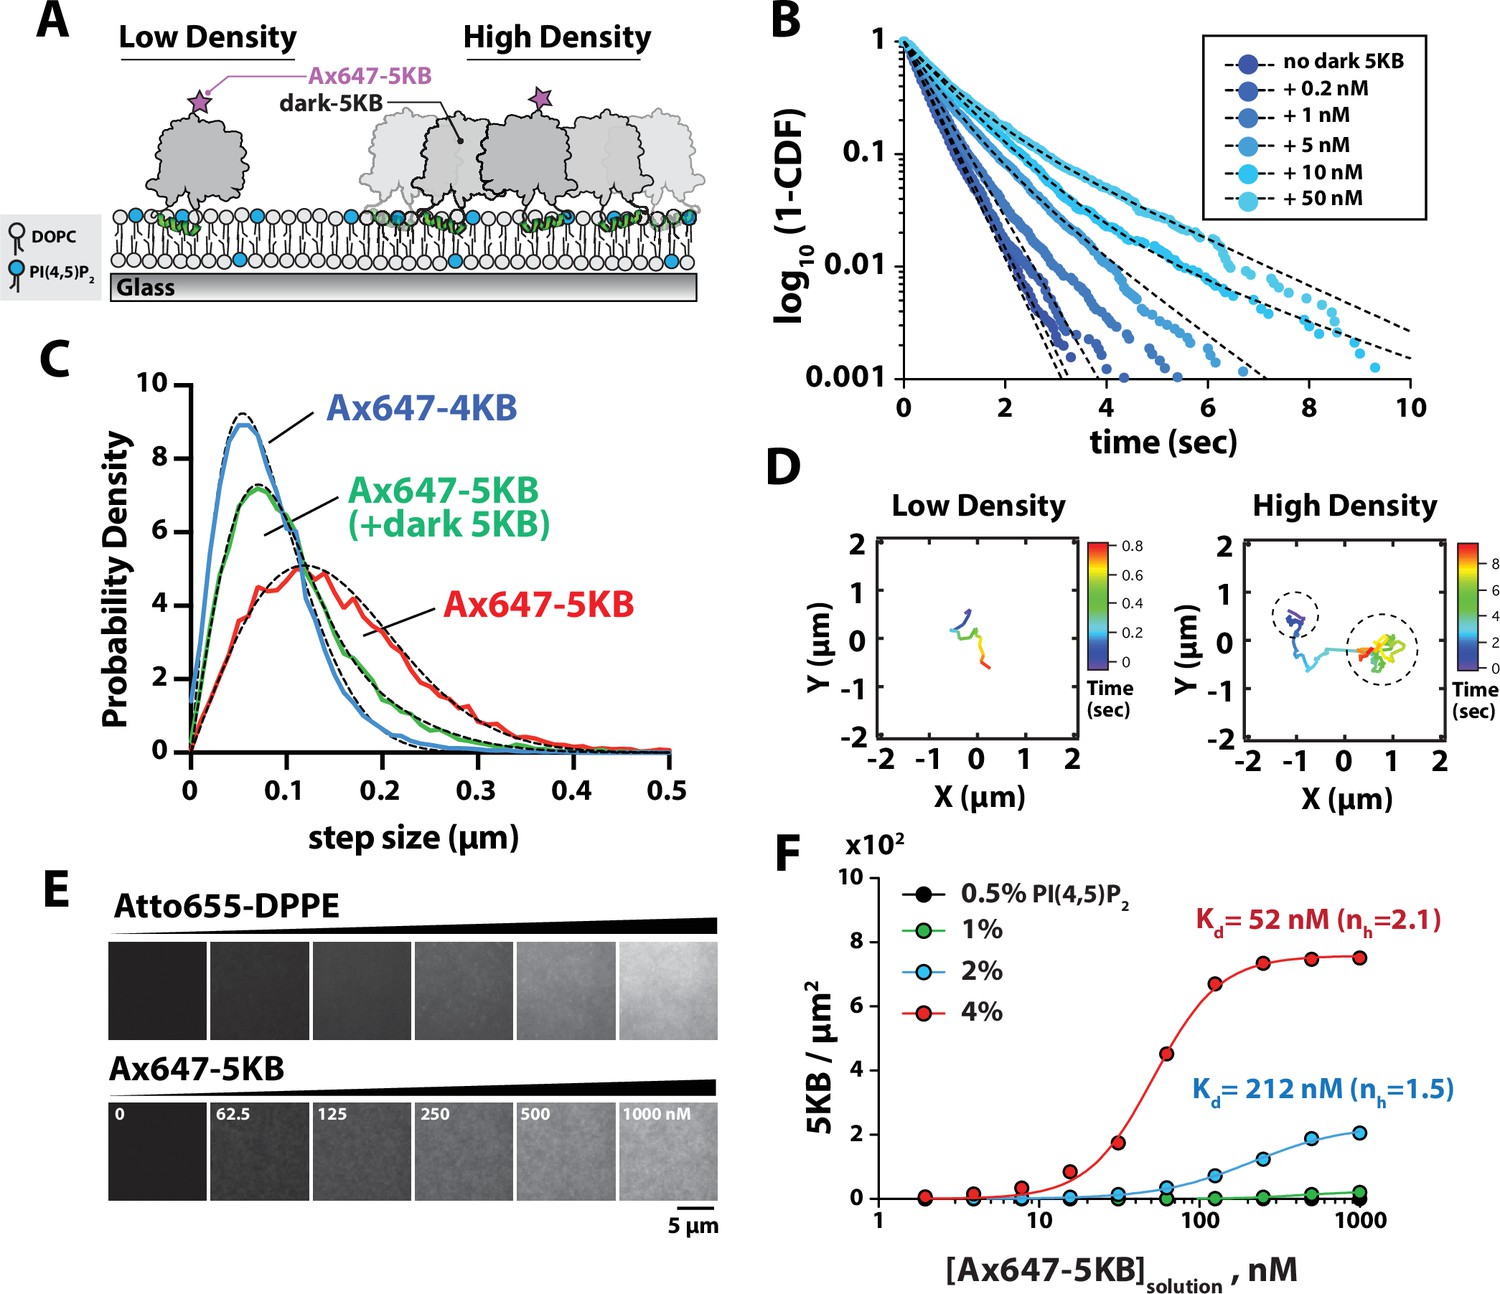
Protein density-dependent changes in PIP5K membrane binding.
(A) Supported lipid bilayer assay for measuring the single-molecule membrane-binding behavior Ax647-PIP5KB at low and high membrane surface densities of PIP5KB. Note that the ‘high-density’ kinase organization does not imply a specific oligomerization state. (B) Single-molecule dwell times of Ax647-PIP5KB measured in the presence of increasing concentrations of unlabeled PIP5KB (0–50 nM). Ax647-PIP5K dwell time was calculated by fitting log10(1 – cumulative distribution frequency [CDF]) to either a single- or double-exponential decay curve (black dashed lines). Bin size equals 50 ms. See Table 1 for statistics. (C) Representative step-size distributions measured in the presence of either 1 pM Ax647-PIP5KB (red), 1 pM Ax647-PIP5KB + 50 nM PIP5KB (green), or 1 pM Ax647-PIP4KB (blue). Dashed black line represents the curve fit used to calculate the diffusion coefficient (see ‘Materials and methods’). See Table 1 for statistics. (D) Representative trajectories showing the time-dependent movement of a single-membrane-bound Ax647-PIP5KB (1 pM) in the absence or presence of 5 nM dark PIP5KB. (B–D) Membrane composition: 98% DOPC, 2% PI(4,5)P2. (E) Montage of images showing supported membranes with increasing densities of Atto655 lipids used to calibrate the molecular density of membrane-bound Ax647-PIP5KB. Membrane composition: 96% DOPC, 4% PI(4,5)P2. (F) Ax647-PIP5KB binds cooperatively to membranes containing PI(4,5)P2 lipids. The density of membrane-bound PIP5KB was measured in the presence of increasing solution concentrations of Ax647-PIP5KB on membranes containing 0.5, 1, 2, or 4% PI(4,5)P2 lipids. Lines represent curve fit using concerted model for cooperativity (i.e., Hill equation). nH is the Hill coefficient. Points are mean values (N = 15–20 fluorescent intensity measurements per sample from one technical replicate).
-
Figure 2—source data 1
Related to Figure 2B.
- https://cdn.elifesciences.org/articles/73747/elife-73747-fig2-data1-v2.xlsx
-
Figure 2—source data 2
Related to Figure 2C.
- https://cdn.elifesciences.org/articles/73747/elife-73747-fig2-data2-v2.xlsx
-
Figure 2—source data 3
Related to Figure 2F.
- https://cdn.elifesciences.org/articles/73747/elife-73747-fig2-data3-v2.xlsx
Figure 2—figure supplement 1
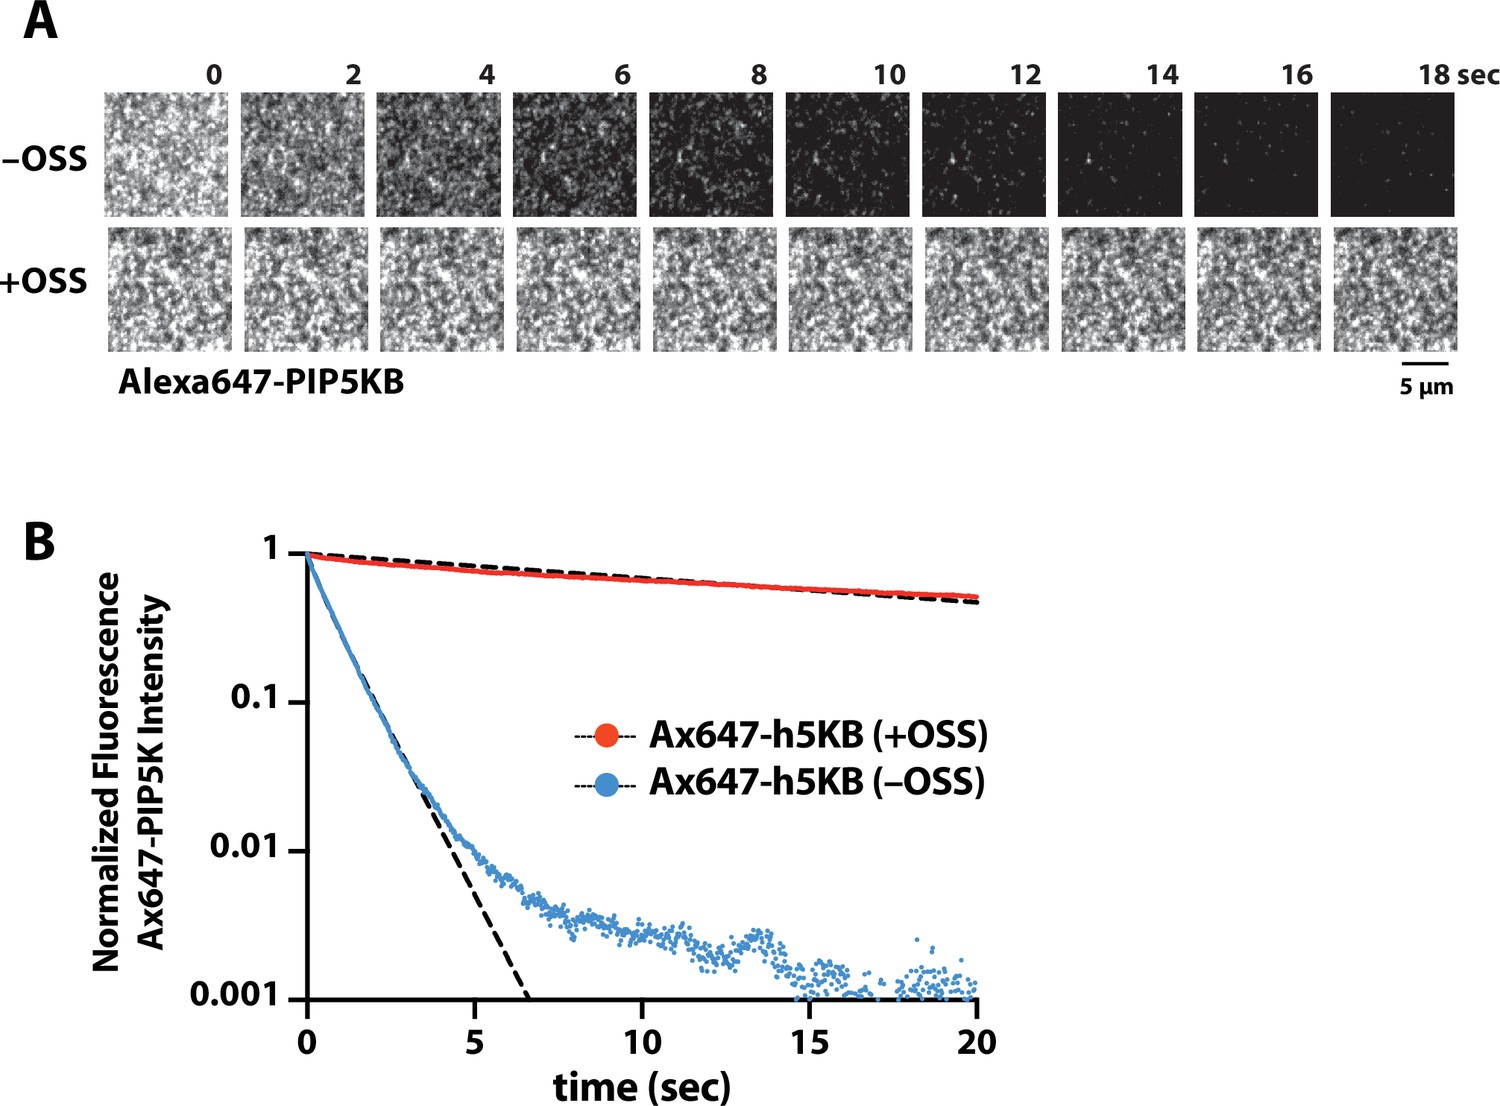
Quantification of Alexa647-PIP5KB photobleaching kinetics.
(A) Montage of total internal reflection fluorescence microscopy (TIRF-M) images showing the change in fluorescence of glass-immobilized Ax647-PIP5KB in the absence and presence of oxygen-scavenging system (OSS). (B) Quantification of Ax647-PIP5KB photobleaching kinetics. Fluorescence decay curves were fit with a single exponential decay curve yielding τbleach = 26.7 s (+OSS) and τbleach = 0.83 s (– OSS).
-
Figure 2—figure supplement 1—source data 1
Related to Figure 2—figure supplement 1.
- https://cdn.elifesciences.org/articles/73747/elife-73747-fig2-figsupp1-data1-v2.xlsx
Figure 2—figure supplement 2
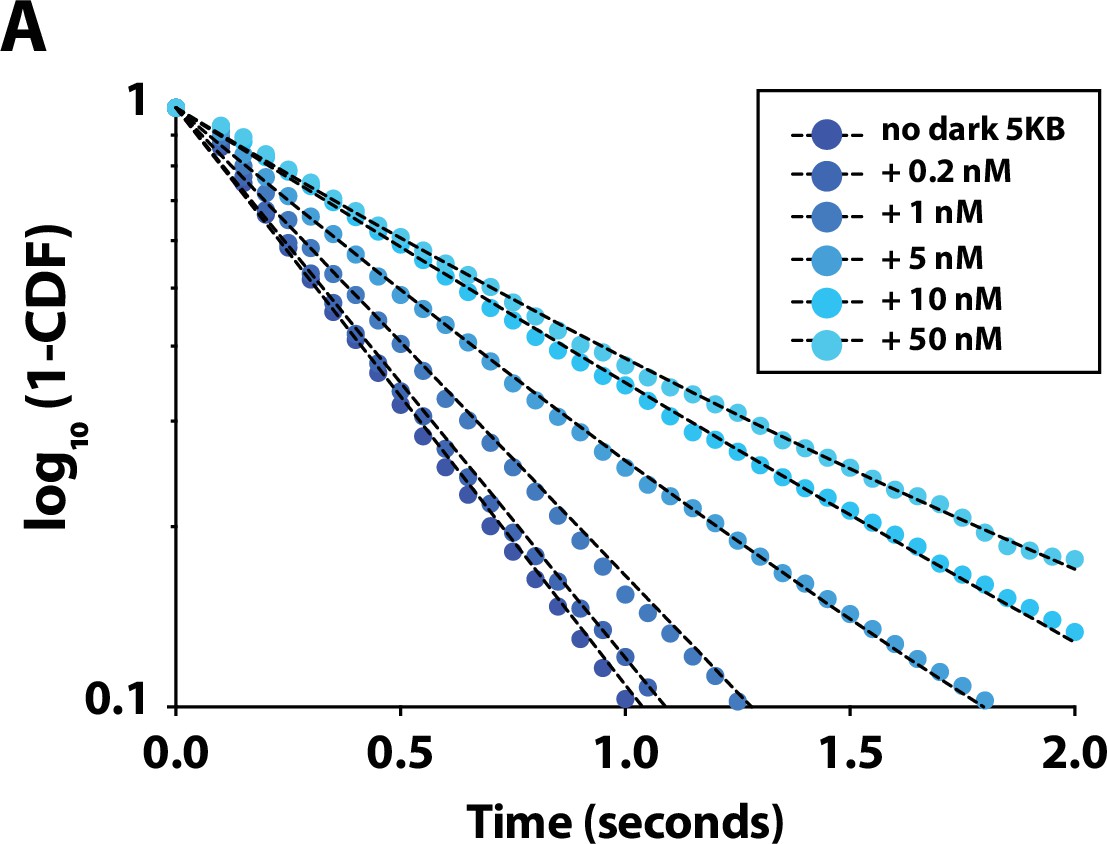
Protein density dependent changes in Ax647-PIP5K single molecule dwell time distributions.
(A) Zoomed graph showing the initial curve fits of the Ax647-PIP5KB dwell time distributions shown in Figure 2B.
-
Figure 2—figure supplement 2—source data 1
- https://cdn.elifesciences.org/articles/73747/elife-73747-fig2-figsupp2-data1-v2.xlsx
Figure 2—figure supplement 3
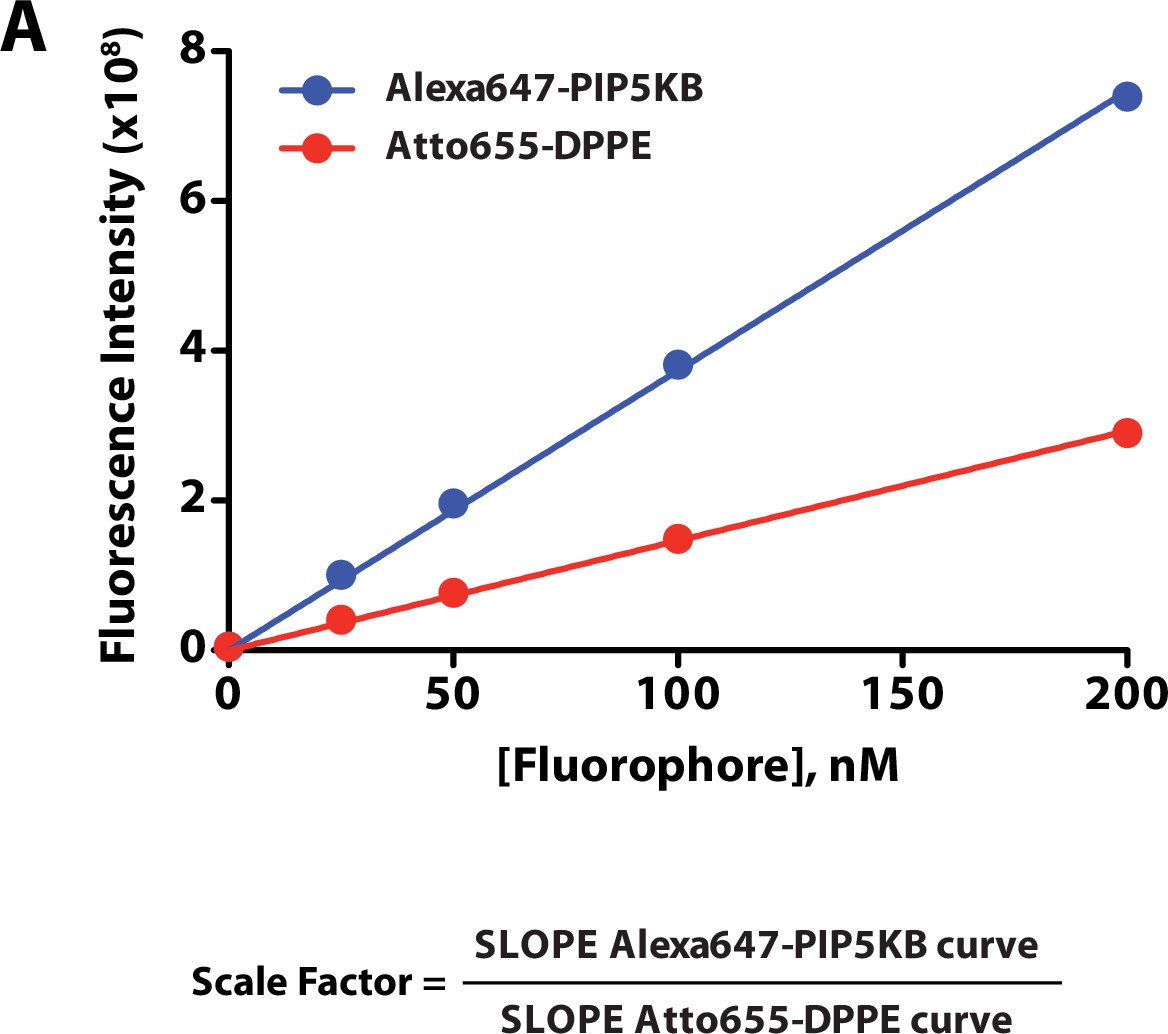
Calibration of Alexa647-PIP5KB membrane surface density measurements.
(A) Calculation of scaling factor used from comparing the fluorescence of Ax647-PIP5KB and Atto655-DPPE. The fluorescence intensity of small unilamellar vesicles containing varying concentrations of Atto655-DPPE lipids or purified Ax647-PIP5KB was measured using wide-field fluorescence microscopy. Data points represent the average fluorescence intensity of 20 images acquired using the identical camera settings, objective, laser power, and filters.
-
Figure 2—figure supplement 3—source data 1
Related to Figure 2—figure supplement 3.
- https://cdn.elifesciences.org/articles/73747/elife-73747-fig2-figsupp3-data1-v2.xlsx
Figure 2—video 1
Membrane -binding dynamics of 1 pM Ax647-PIP5KB visualized by single-molecule total internal reflection fluorescence (smTIRF) microscopy.
Membrane composition: 96% DOPC, 4% PI(4,5)P2. Video associated with Figure 2B. Scale bar is 2 µm.
Figure 2—video 2
Membrane -binding dynamics of 1 pM Ax647-PIP5KB plus 50 nM dark PIP5KB visualized by single-molecule total internal reflection fluorescence (smTIRF) microscopy.
Membrane composition: 96% DOPC, 4% PI(4,5)P2. Video associated with Figure 2B. Scale bar is 2 µm.
Figure 3 with 1 supplement
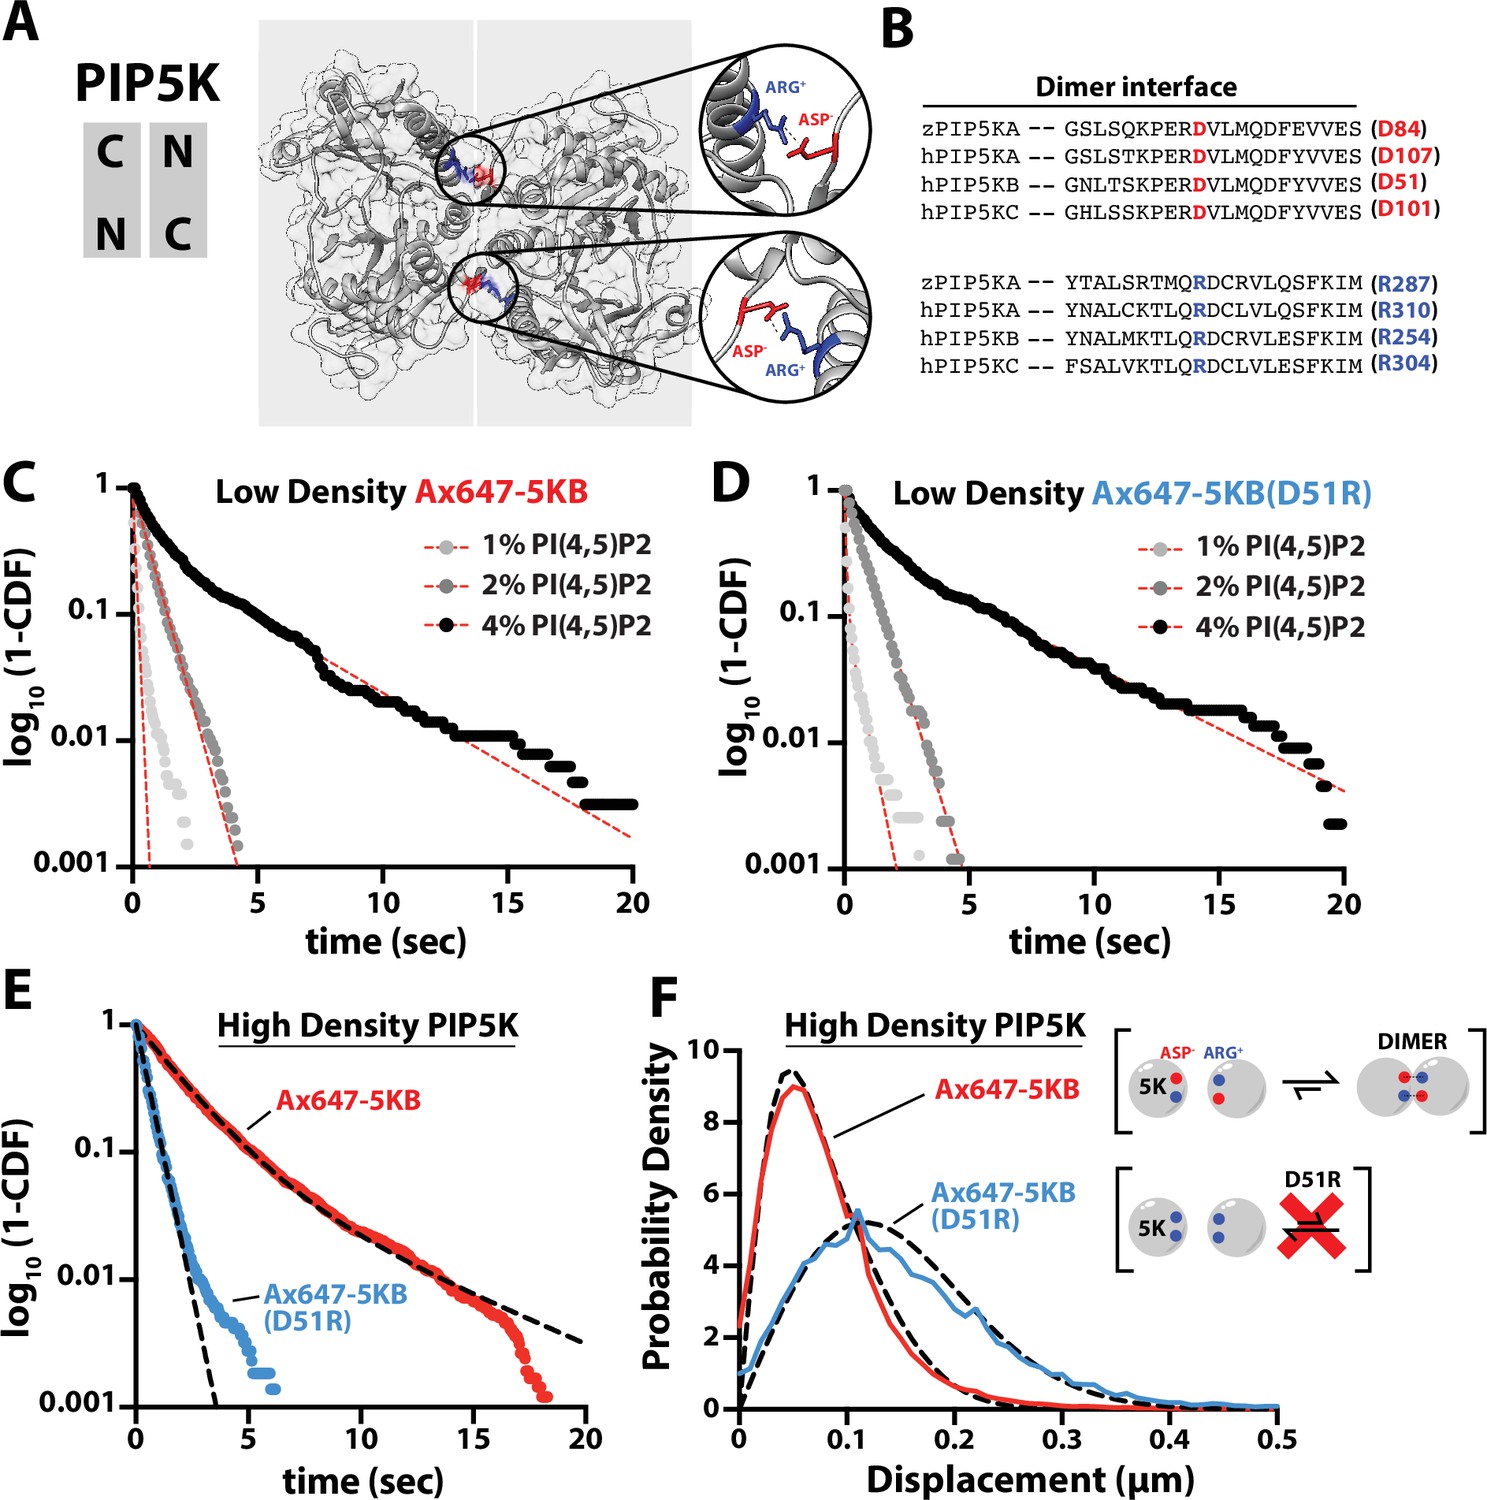
PIP5K binds cooperatively to PI(4,5)P2 independent of dimerization.
(A) Kinase domain orientation for the zebrafish PIP5KA homodimer (4TZ7.pdb). Salt bridges formed between Asp and Arg side chains are colored and shown in zoomed images. (B) Sequence alignment between zPIP5KA, human PIP5KA, human PIP5KB, and human PIP5KC highlights conservation of residues in dimer interface. (C, D) Dimerization is not required for cooperative PI(4,5)P2 binding. Representative single-molecule dwell time distributions measured at low protein density in the presence of either (C) 1–5 pM Ax647-PIP5KB and (D) 1–5 pM Ax647-PIP5KB (D51R). Membrane composition: 1, 2, or 4% PI(4,5)P2, plus 96–99% DOPC. (E, F) Single-molecule dwell times and step-size distributions measured at ‘high density’ in the presence of 50 nM non-fluorescent PIP5KB. (E) High protein surface density of PIP5KB increases the dwell time of Ax647-PIP5KB, but not Ax647-PIP5KB (D51R). (F) Membrane-mediated dimerization is responsible for the protein density-dependent decrease in Ax647-PIP5KB diffusion coefficient. (C–F) Membrane composition: 96% DOPC, 4% PI(4,5)P2. Dashed line represents fits of the dwell time distributions. See Table 2 for statistics.
-
Figure 3—source data 1
Related to Figure 3C.
- https://cdn.elifesciences.org/articles/73747/elife-73747-fig3-data1-v2.xlsx
-
Figure 3—source data 2
Related to Figure 3D.
- https://cdn.elifesciences.org/articles/73747/elife-73747-fig3-data2-v2.xlsx
-
Figure 3—source data 3
Related to Figure 3E.
- https://cdn.elifesciences.org/articles/73747/elife-73747-fig3-data3-v2.xlsx
-
Figure 3—source data 4
Related to Figure 3F.
- https://cdn.elifesciences.org/articles/73747/elife-73747-fig3-data4-v2.xlsx
Figure 3—figure supplement 1
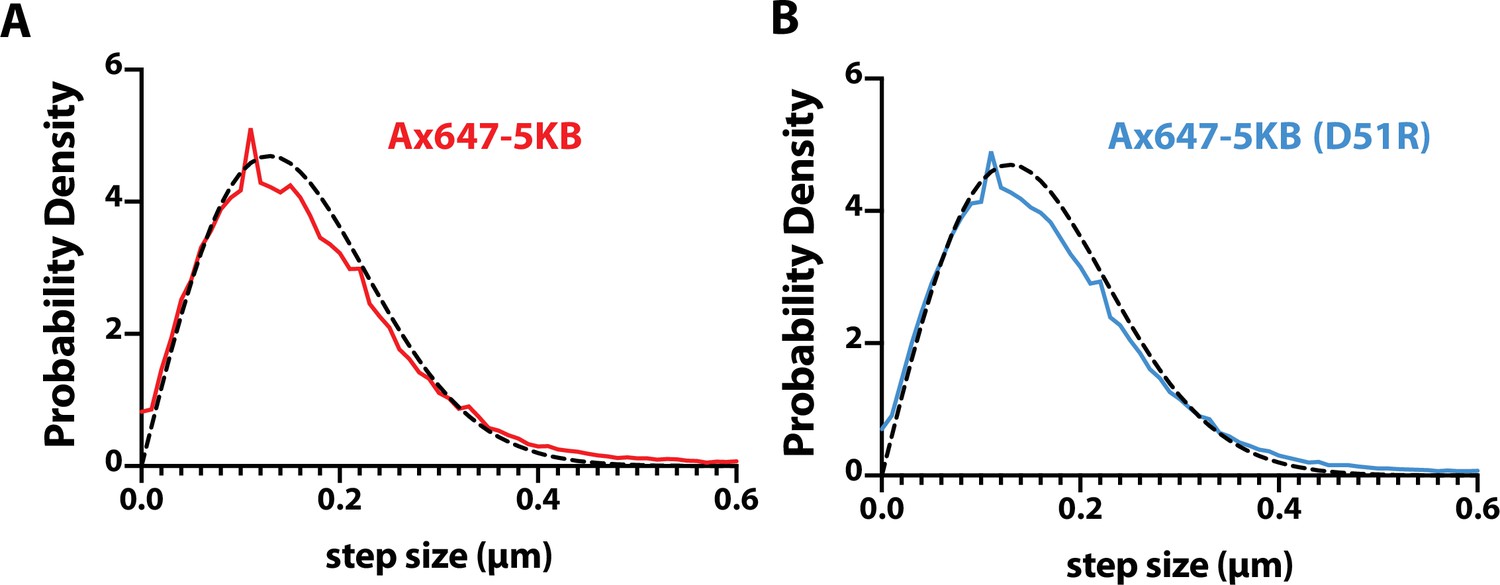
Dimer interface mutation does not alter diffusion of Ax647-PIP5K at low protein densities.
(A, B) Step-size distributions are indistinguishable when measured in the presence of (A) 5 pM Ax647-PIP5KB (0.171 ± 0.006 µm2/s, N = 174,748 steps) or (B) 5 pM Ax647-PIP5KB (D51R) (0.174 ± 0.001 µm2/s, N = 238,548 steps). Diffusion coefficients are mean values calculated from three technical replicates. Errors equal SD. Dashed black line is representative of the step-size distribution fit. Membrane composition: 98% DOPC, 2% PI(4,5)P2.
-
Figure 3—figure supplement 1—source data 1
Related to Figure 3—figure supplement 1.
- https://cdn.elifesciences.org/articles/73747/elife-73747-fig3-figsupp1-data1-v2.xlsx
Figure 4 with 2 supplements
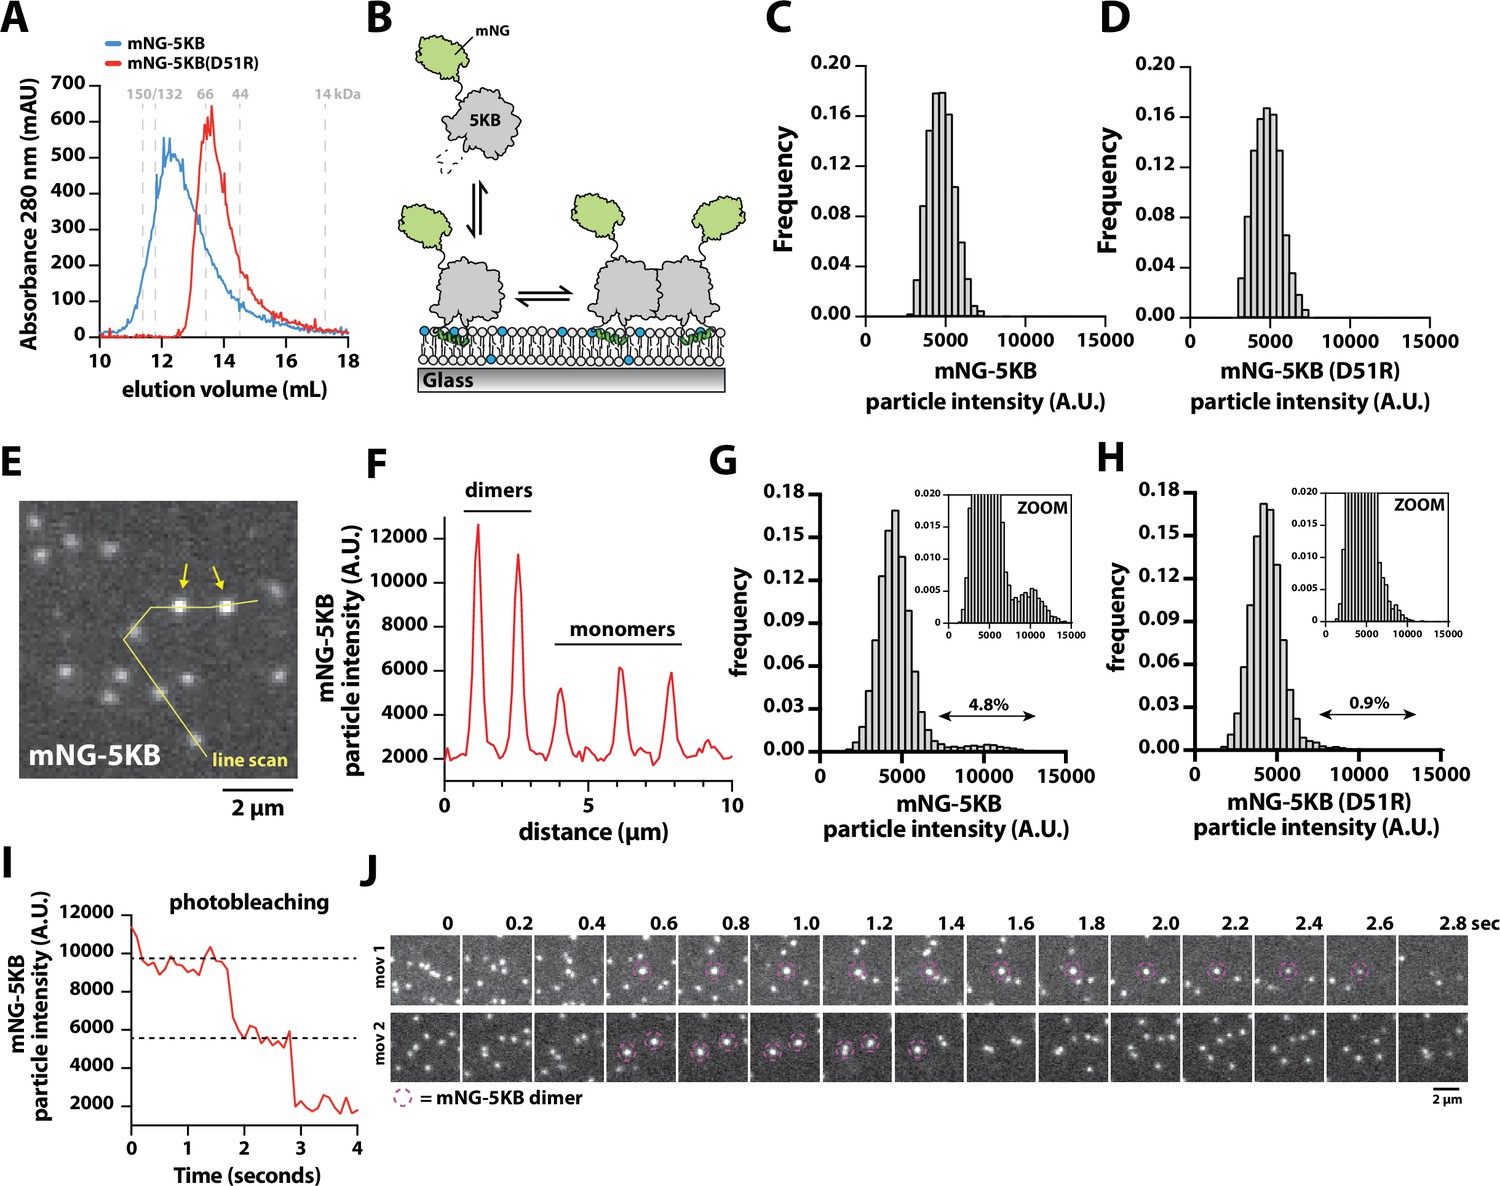
Direct visualization of mNG-PIP5KB membrane-mediated dimerization.
(A) Size-exclusion chromatography (SEC) elution profiles of purified mNG-PIP5KB and mNG-PIP5KB (D51R). The monomeric molecular weight of each kinase equals 75 kDa. Protein was at a concentration of 50 µM (~2 mg total) loaded on a Superdex 200 column. Based on the A280, peak elution concentration is 10–20 µM. (B) Diagram showing the experimental setup for visualizing membrane binding of mNG-PIP5KB (WT and D51R). (C–, D) Molecular brightness distributions of mNG-PIP5KB and mNG-PIP5KB (D51R) based on brightness of single kinases first attaching to the supported membrane (N = 2424 total binding events, four technical replicates in C; N = 1747 total binding events, four technical replicates in D). (E–, F) Molecular brightness distributions based on equilibrium membrane binding of either mNG-PIP5KB or mNG-PIP5KB (D51R). Molecules with a threshold particle intensity ≥8200 (A.U.) were considered dimeric. Values printed above double arrows equal percentage of apparent dimers (N = 11,355 mNG-PIP5KB particles in E; N = 12,759 mNG-PIP5KB (D51R) particles in F). (G) Image showing the localization of membrane-bound mNG-PIP5KB observed in the presence of a 100 pM solution concentration. Arrows indicate mNG-PIP5KB dimers. (H) Intensity line scan through line draw in (G). (I) Stepwise photobleaching of a membrane-bound mNG-PIP5KB dimer. (J) Direct visualizing of membrane-mediated dimerization in the presence of mNG-PIP5KB. (C–J) Data collected in the presence of 100 pM mNG-PIP5KB or mNG-PIP5KB (D51R). Membrane composition: 96% DOPC, 4% PI(4,5)P2.
-
Figure 4—source data 1
Related to Figure 4A.
- https://cdn.elifesciences.org/articles/73747/elife-73747-fig4-data1-v2.xlsx
-
Figure 4—source data 2
Related to Figure 4C.
- https://cdn.elifesciences.org/articles/73747/elife-73747-fig4-data2-v2.xlsx
-
Figure 4—source data 3
Related to Figure 4D.
- https://cdn.elifesciences.org/articles/73747/elife-73747-fig4-data3-v2.xlsx
-
Figure 4—source data 4
Related to Figure 4F.
- https://cdn.elifesciences.org/articles/73747/elife-73747-fig4-data4-v2.xlsx
-
Figure 4—source data 5
Related to Figure 4G.
- https://cdn.elifesciences.org/articles/73747/elife-73747-fig4-data5-v2.xlsx
-
Figure 4—source data 6
Related to Figure 4H.
- https://cdn.elifesciences.org/articles/73747/elife-73747-fig4-data6-v2.xlsx
-
Figure 4—source data 7
Related to Figure 4I.
- https://cdn.elifesciences.org/articles/73747/elife-73747-fig4-data7-v2.xlsx
Figure 4—figure supplement 1
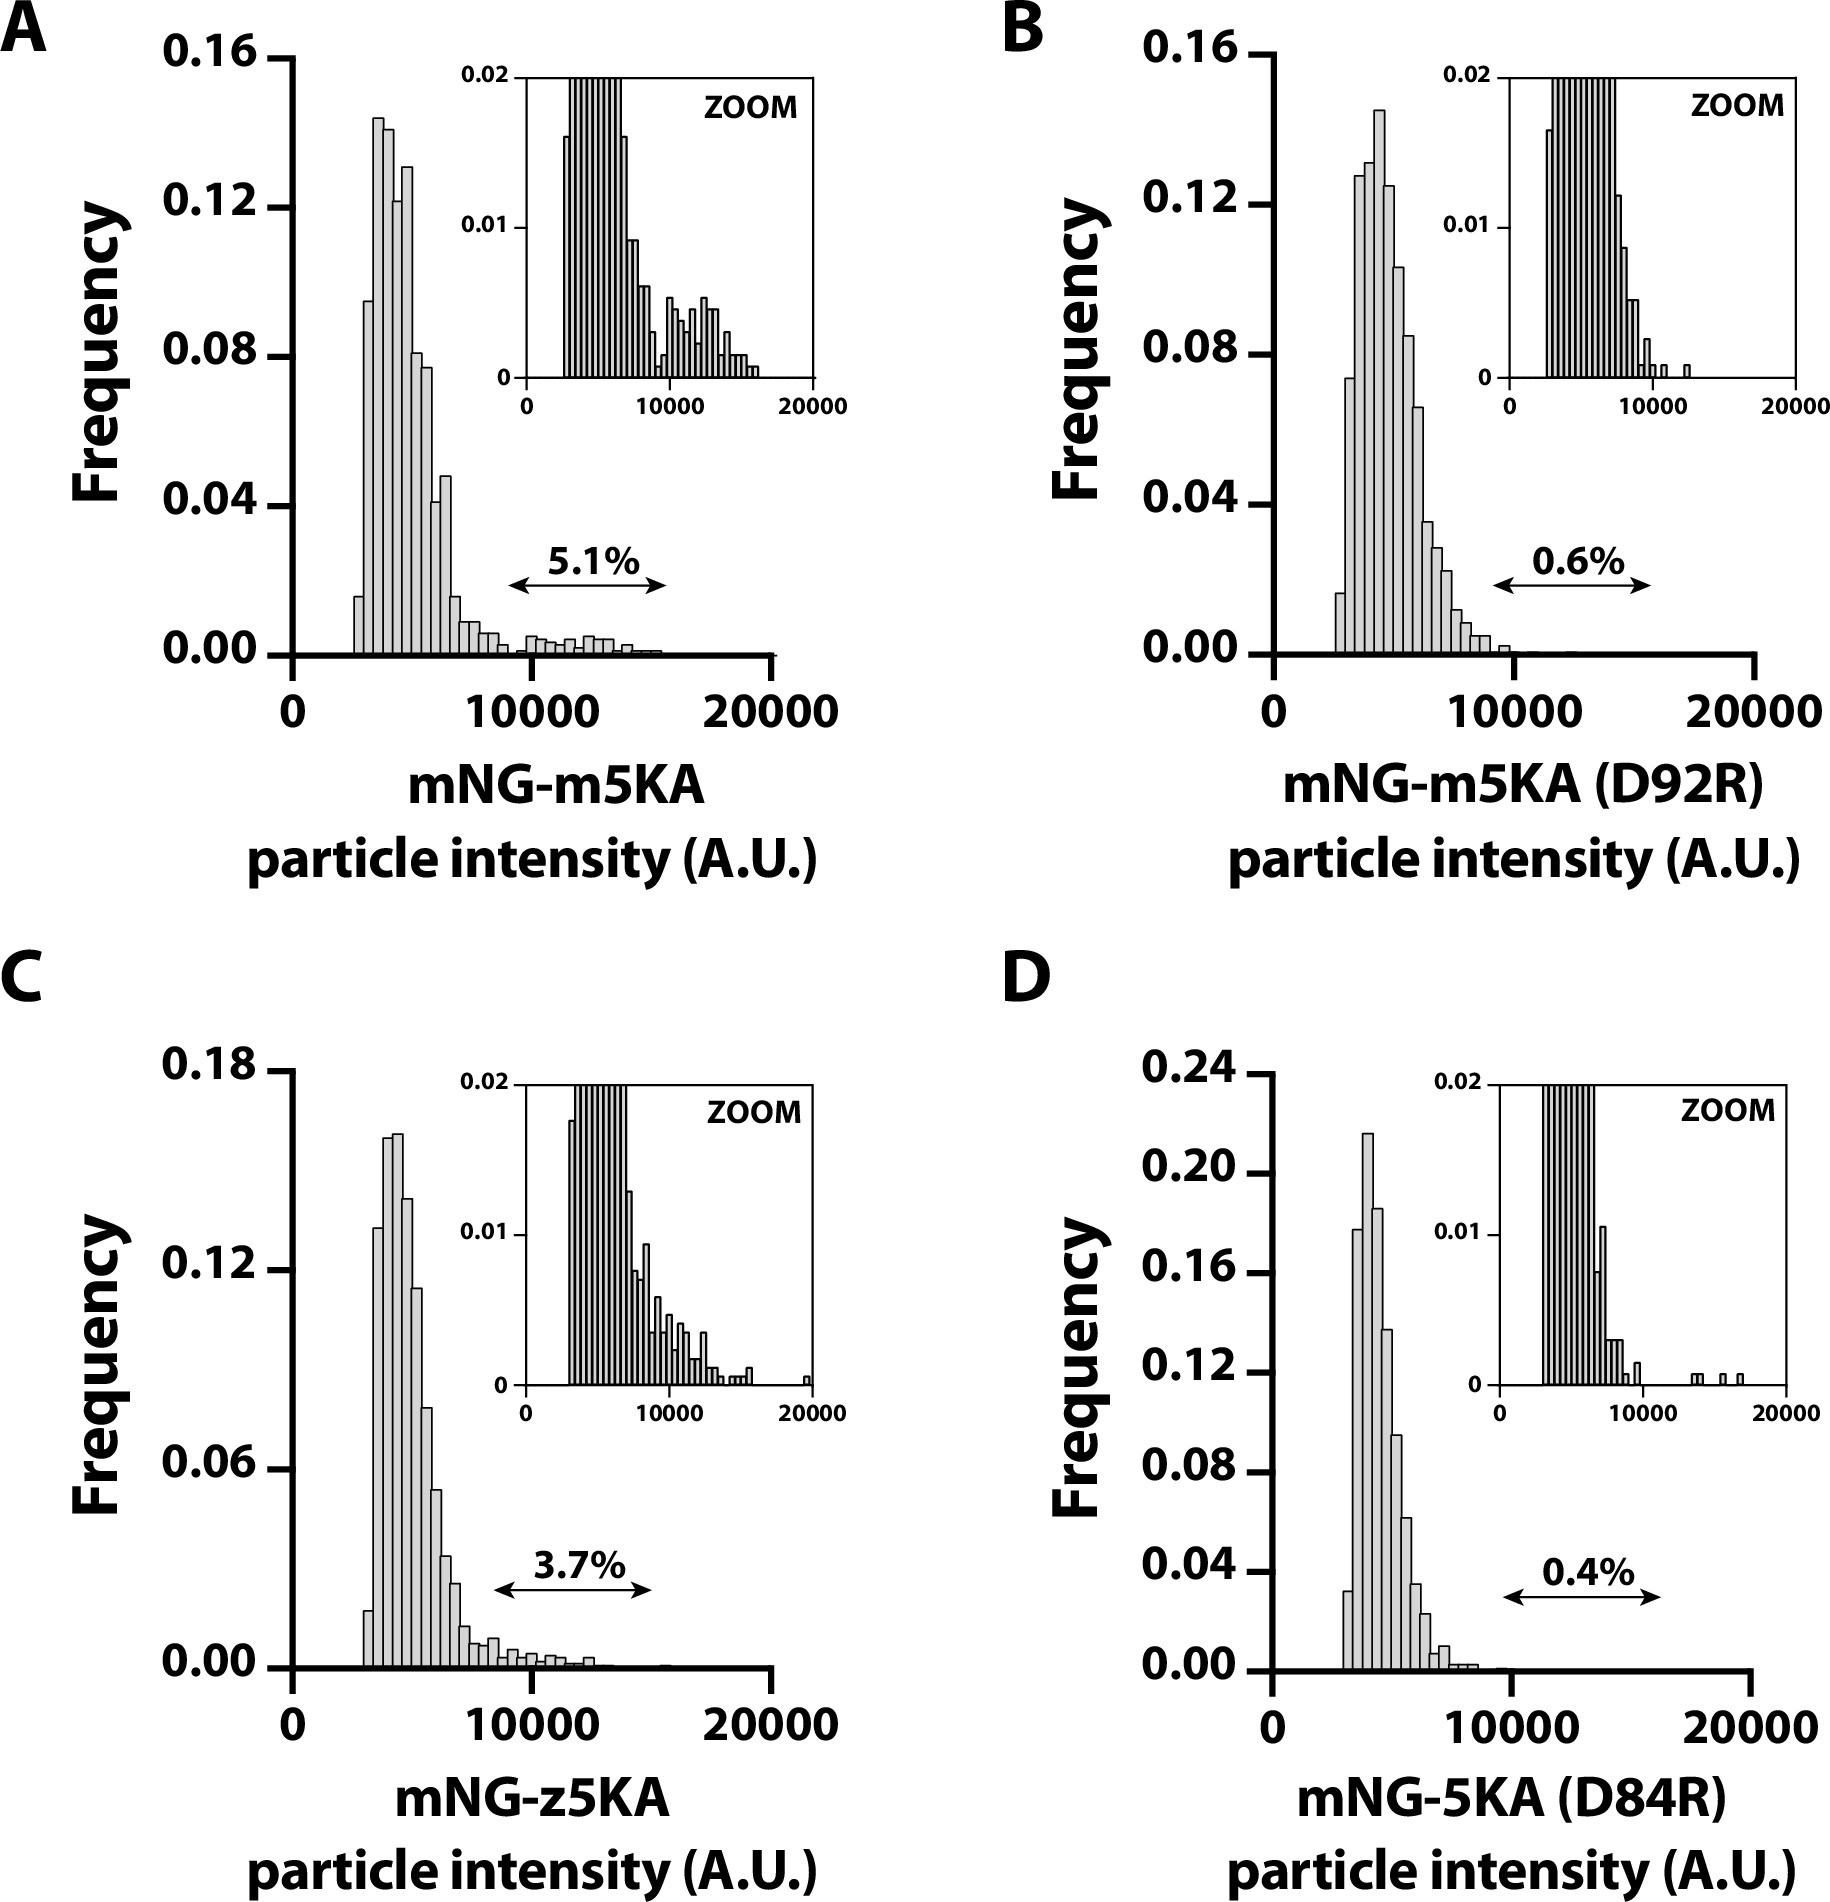
Quantification of PIP5K dimerization-based molecular brightness.
(A–D) Molecular brightness distributions measured in the presence of 100 pM mNG-mPIP5KA (A), mNG-mPIP5KA (D92R) (B), mNG-zPIP5KA (C), or mNG-zPIP5KA (D84R) (D) using diluted cell lysate. A threshold particle intensity ≥9200 (A.U.) is considered a dimer. Values printed above double arrows equal percentage of apparent dimers (N = 1304 mNG-mPIP5KA particles in A; N = 1149 mNG-mPIP5KA [D92R] particles in B; N = 1699 mNG-zPIP5KA particles in C; N = 1321 mNG-zPIP5KA [D84R] particles in D). Membrane composition: 96% DOPC and 4% PI(4,5)P2.
-
Figure 4—figure supplement 1—source data 1
Related to Figure 4—figure supplement 1.
- https://cdn.elifesciences.org/articles/73747/elife-73747-fig4-figsupp1-data1-v2.xlsx
Figure 4—video 1
Direct visualization of membrane-mediated dimerization of mNG-PIP5KB with single -molecule resolution.
Membrane composition: 96% DOPC, 4% PI(4,5)P2. Video associated with Figure 4J. Scale bar is 1 µm.
Figure 5 with 2 supplements
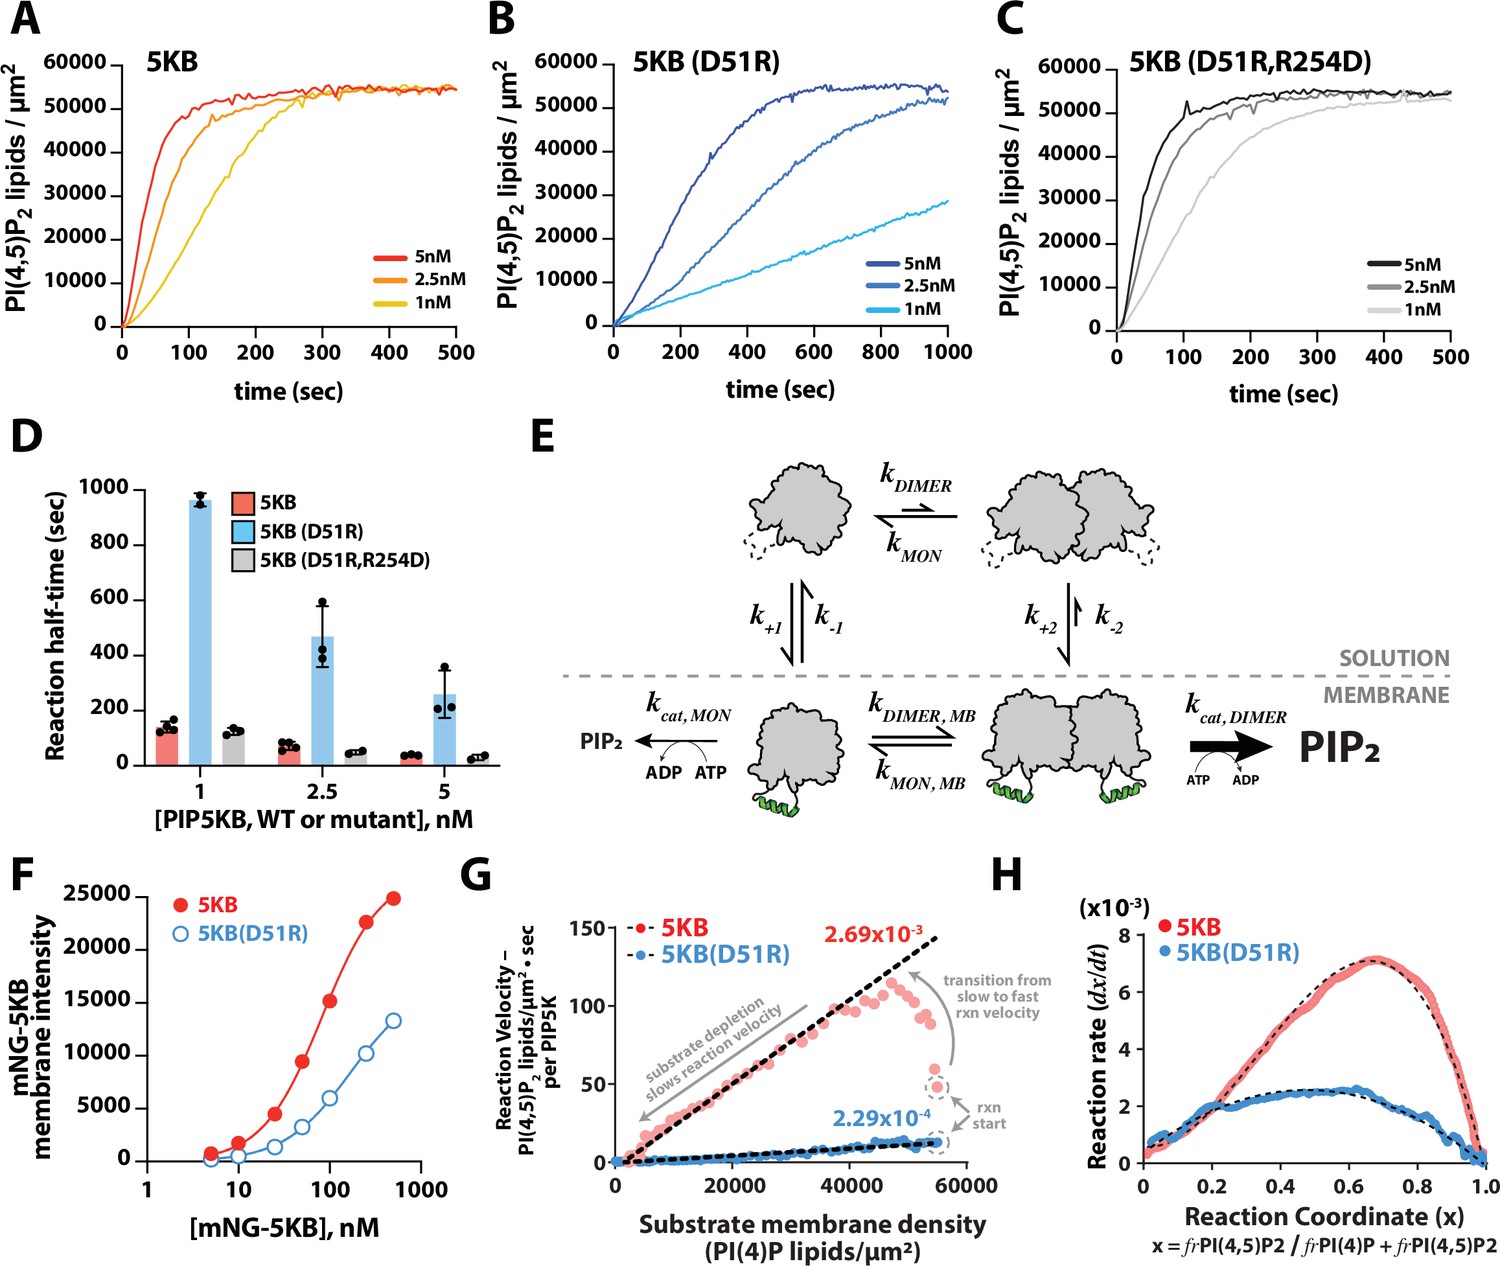
Membrane-mediated dimerization potentiates PIP5K lipid kinase activity.
(A–C) Representative kinetic traces monitoring the production of PI(4,5)P2 in the presence of 1–5 nM PIP5KB, PIP5KB (D51R), or PIP5KB (D51R/R254D). The PI(4,5)P2 membrane surface density was estimated based on the membrane localization of 20 nM Ax488-PLCδ. Initial membrane composition: 96% DOPC, 4% PI(4)P. (D) Quantification of reaction half-time from trajectories shown in (A–C). Bars equal mean values (N = 2–4 reactions per concentration, error = SD). (E) Equilibrium diagram showing the relationship between PIP5KB membrane binding, oligomerization, and catalysis. (F) Equilibrium fluorescence intensity of membrane-bound mNG-PIP5KB and mNG-PIP5KB (D51R) measured at varying solution concentrations. Points are mean values (N = 15–20 fluorescent intensity measurements per sample from one experiment). Membrane composition: 96% DOPC, 4% PI(4,5)P2. (G) Membrane-mediated dimerization enhances PIP5KB catalytic efficiency independent of membrane localization. Membrane localization of mNG-PIP5KB (WT and D51R) and production of PI(4,5)P2 were simultaneously monitored on supported membranes. Each data point in the plot represents the instantaneous velocity expressed as the number of PI(4,5)P2 lipids generated per µm2 per second per kinase as a function of the substrate density. The reaction catalyzed by PIP5KB displays the following three phases: (1) slow kinetics at reaction start, (2) rise to maximum reaction velocity, and (3) gradual decline in reaction velocity due to substrate depletion. (H) Feedback profiles for PIP5KB (WT and D51R). The following equations were used for curve fitting: for PIP5KB and for PIP5KB (D51R) where represents the phosphatidylinositol phosphate (PIP) lipid composition.
-
Figure 5—source data 1
Related to Figure 5A.
- https://cdn.elifesciences.org/articles/73747/elife-73747-fig5-data1-v2.xlsx
-
Figure 5—source data 2
Related to Figure 5B.
- https://cdn.elifesciences.org/articles/73747/elife-73747-fig5-data2-v2.xlsx
-
Figure 5—source data 3
Related to Figure 5C.
- https://cdn.elifesciences.org/articles/73747/elife-73747-fig5-data3-v2.xlsx
-
Figure 5—source data 4
Related to Figure 5D.
- https://cdn.elifesciences.org/articles/73747/elife-73747-fig5-data4-v2.xlsx
-
Figure 5—source data 5
Related to Figure 5F.
- https://cdn.elifesciences.org/articles/73747/elife-73747-fig5-data5-v2.xlsx
-
Figure 5—source data 6
Related to Figure 5G.
- https://cdn.elifesciences.org/articles/73747/elife-73747-fig5-data6-v2.xlsx
-
Figure 5—source data 7
Related to Figure 5H.
- https://cdn.elifesciences.org/articles/73747/elife-73747-fig5-data7-v2.xlsx
Figure 5—figure supplement 1
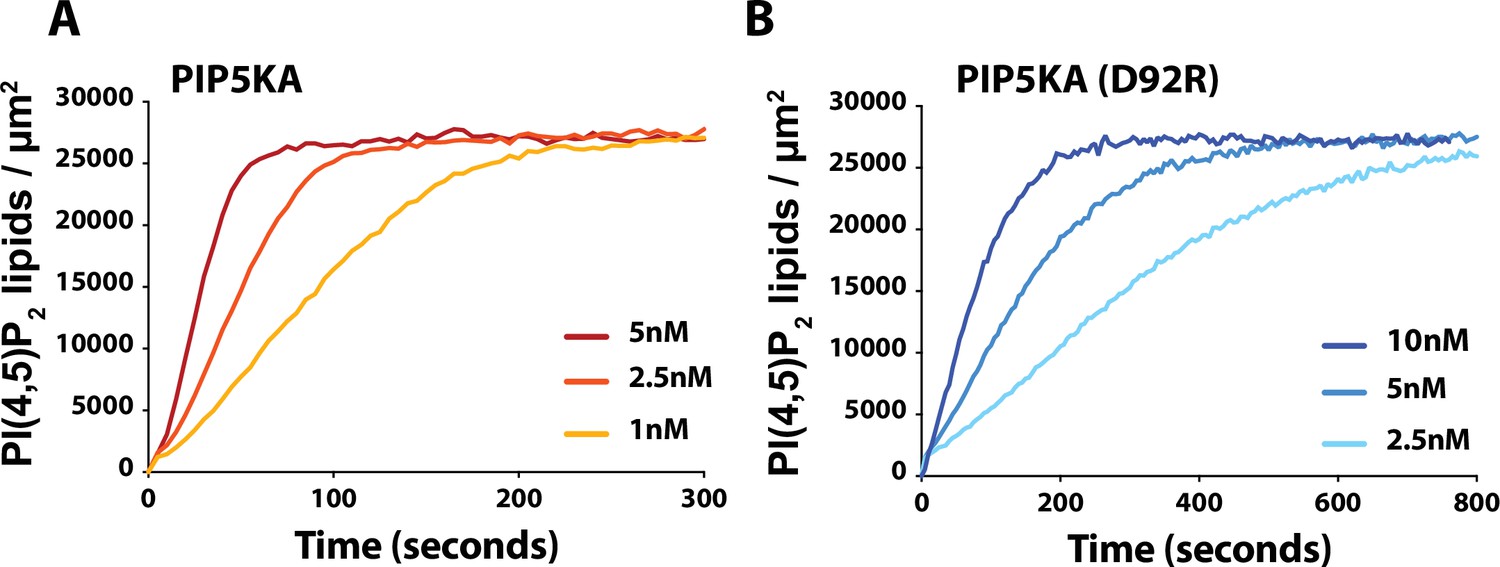
Dimerization enhances PIP5KA lipid kinase activity.
(A, B) Kinetics of PI(4,5)P2 production measured in the presence of either mouse PIP5KA or PIP5KA (D92R). The production of PI(4,5)P2 was monitored by the presence of 20 nM Alexa488-PLCδ. The following reaction half-times were measured in the presence of mPIP5KA: 28 s (5 nM), 49 s (2.5 nM), and 90 s (1 nM). The following reaction half-times were measured in the presence of mPIP5KA (D92R): 71 s (5 nM), 139 s (2.5 nM), and 270 s (1 nM). Kinetic traces shown represent one technical replicate. Initial membrane composition: 98% DOPC, 2% PI(4)P.
-
Figure 5—figure supplement 1—source data 1
Related to Figure 5—figure supplement 1.
- https://cdn.elifesciences.org/articles/73747/elife-73747-fig5-figsupp1-data1-v2.xlsx
Figure 5—figure supplement 2
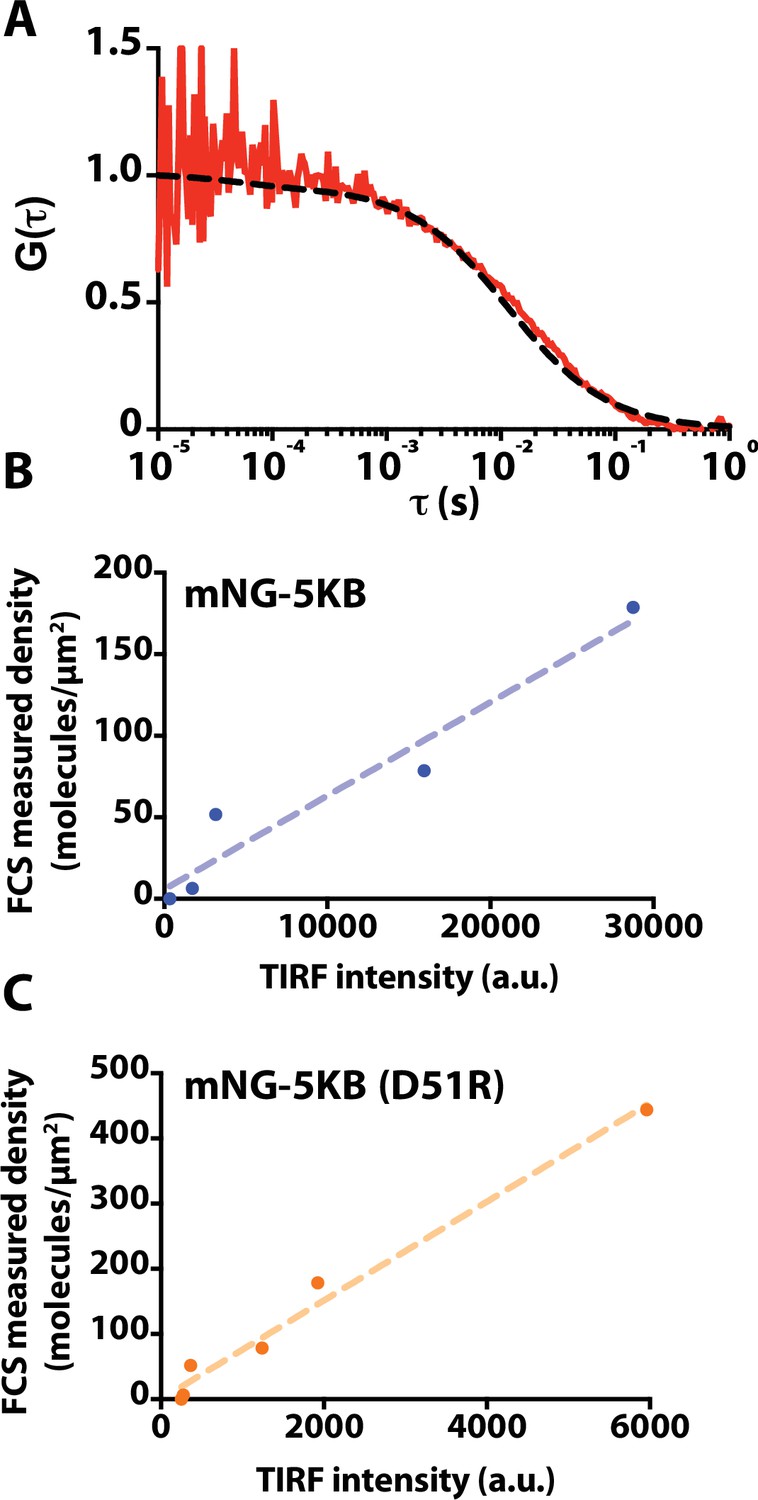
Fluorescence correlation spectroscopy membrane density calibration.
(A) Autocorrelation of his10-mNeonGreen (his10-mNG) measured by fluorescence correlation spectroscopy (FCS). Membrane composition: 98% DOPC, 2% NiNTA-DGS. (B, C) Calibration of mNG-PIP5KB and mNG-PIP5KB (D51R) membrane surface density using his10-mNG tethered to a supported lipid bilayer. Increasing concentrations of respective mNG-PIP5K proteins were incubated with support membranes containing the following composition: 96% DOPC, 4% PI(4,5)P2.
-
Figure 5—figure supplement 2—source data 1
Related to Figure 5—figure supplement 2.
- https://cdn.elifesciences.org/articles/73747/elife-73747-fig5-figsupp2-data1-v2.xlsx
Figure 6 with 2 supplements

PIP5K dimerization stabilizes phosphatidylinositol phosphate (PIP) compositional patterns.
(A) Diagram showing the network architecture of the bistable kinase–phosphatase-competitive reaction. The positive feedback loop of the 5-phosphatase, DrrA-OCRL, is regulated by product binding (Hansen et al., 2019). Note that DrrA is also commonly known as SidM/DrrA in L. pneomophila. (B) PIP5KB dimerization increases robustness of PIP compositional pattern formation. Montage image sequences showing the formation PIP compositional patterns in the presence 50 nM PIP5KB (WT, D51R, or D51R/R254D, montage rows 1–3) or 1 µM PIP5KB (D51R, montage row 4). (C) Localization of mNG-PIP5KB (WT or D51R) during PIP compositional pattern formation. Reactions were reconstitution in the presence of either 50 nM mNG-PIP5KB or 1 µM mNG-PIP5KB (D51R). (D) Plot showing the change in mNG-PIP5KB membrane intensity compositional patterns enriched in PI(4,5)P2 lipids. The dashed line represents the mean fluorescence intensity from N = 10 membrane domains. (B–D) All reactions contain the specified concentration of PIP5KB (WT or mutants), plus 20 nM DrrA-OCRL, 20 nM Ax488-PLCδ, and 20 nM Ax647-DrrA. Initial membrane composition: 96% DOPC, 2% PI(4)P, 2% PI(4,5)P2.
-
Figure 6—source data 1
Related to Figure 6D.
- https://cdn.elifesciences.org/articles/73747/elife-73747-fig6-data1-v2.xlsx
Figure 6—video 1
Visualization of mNG-PIP5KB localization during phosphatidylinositol phosphate (PIP) compositional pattern formation.
Reaction reconstituted in the presence of 50 nM mNG-PIP5KB, 20 nM DrrA-OCRL, and 20 nM Cy3-PLCδ. Initial membrane composition: 96% DOPC, 2% PI(4)P, 2% PI(4,5)P2. Video associated with Figure 6C. Scale bar is 10 µm.
Figure 6—video 2
Visualization of mNG-PIP5KB (D51R) localization during phosphatidylinositol phosphate (PIP) compositional pattern formation.
Reaction reconstituted in the presence of 1 µM mNG-PIP5KB (D51R), 20 nM DrrA-OCRL, and 20 nM Cy3-PLCδ. Initial membrane composition: 96% DOPC, 2% PI(4)P, 2% PI(4,5)P2. Video associated with Figure 6C. Scale bar is 10 µm.
Figure 7 with 2 supplements
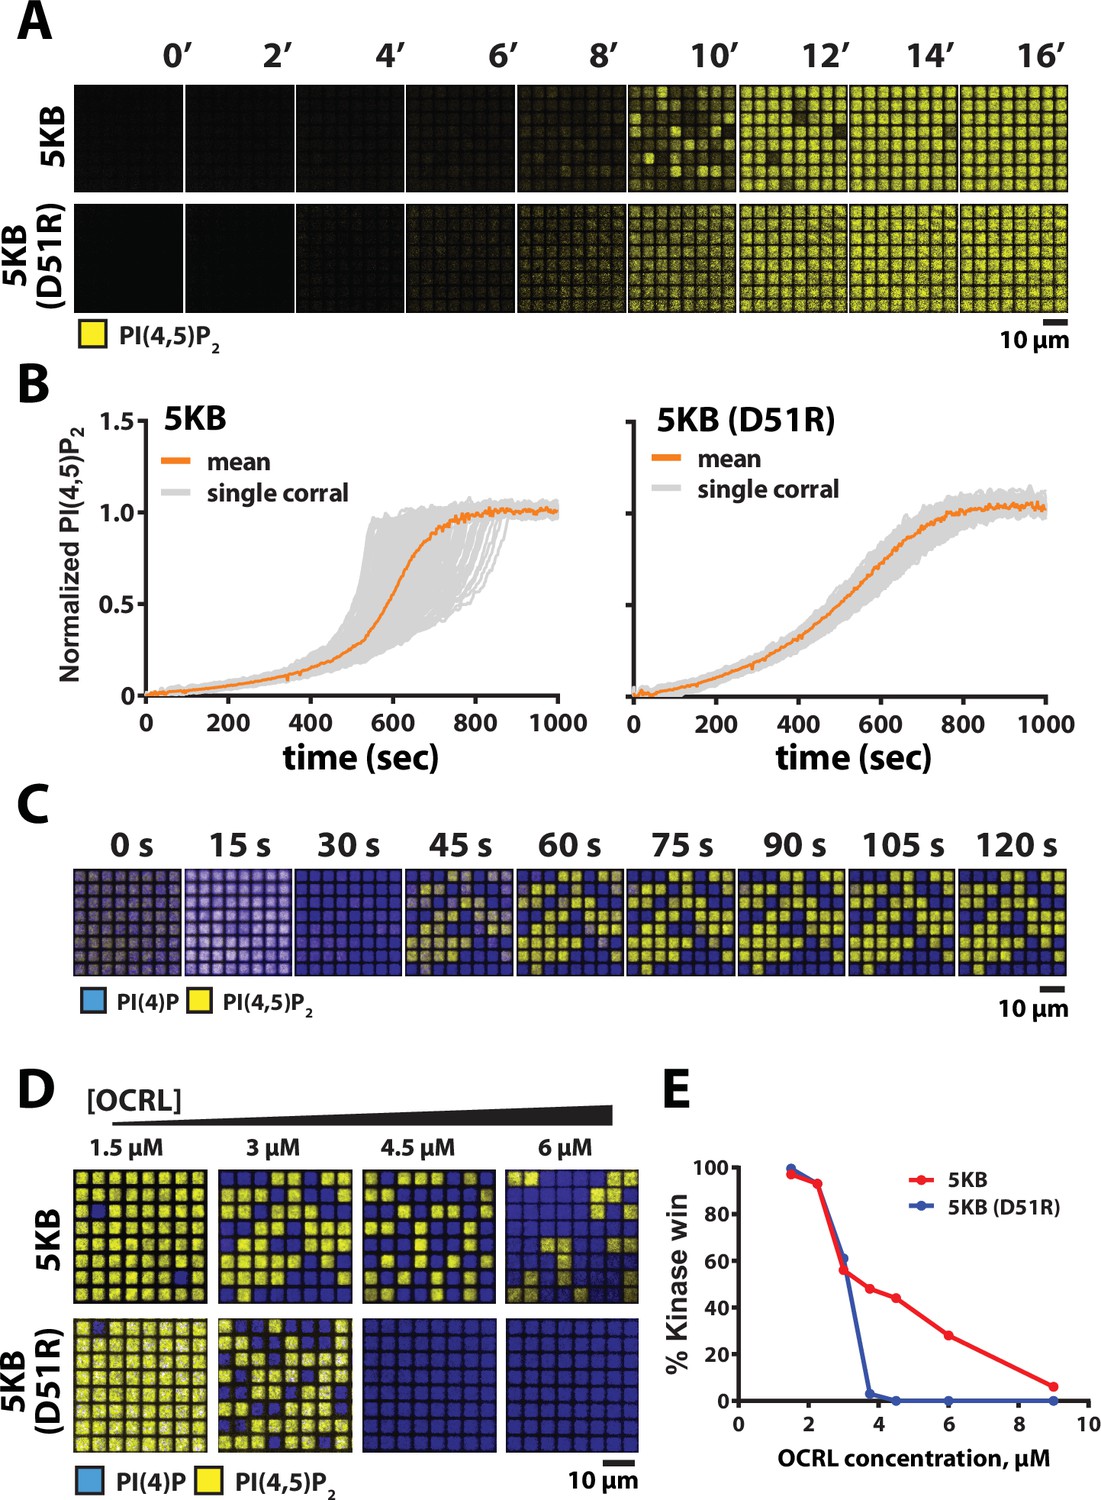
Reaction trajectory variation based on stochastic membrane-mediated dimerization.
(A) Lipid phosphorylation reactions reconstituted in 5 µm × 5 µm chromium-patterned-supported membranes in the presence of 5 nM PIP5K and 10 nM PIP5K (D51R). Reactions were visualized using 20 nM Alexa488-PLCδ. Initial membrane composition: 96% DOPC, 4% PI(4)P. (B) Reaction trajectories plots from (A) from N = 100 membrane corrals. The mean reaction trajectory is plotted in orange. (C) Time course of bistable kinase–phosphatase reaction reconstituted in 5 µm × 5 µm corrals in the presence of 50 nM PIP5K, 30 nM DrrA-OCRL, 20 nM Alexa488-PLCδ, and 20 nM Ax647-DrrA. (D) Dimerization enhances the ability of PIP5K to win competitive bistable kinase–phosphatase reaction in the presence of OCRL. Representative steady-state images showing outcomes reconstituted in the presence of 3 µM OCRL, plus either 18 nM PIP5KB or 370 nM PIP5KB (D51R). The concentration of PIP5KB (WT and D51R) used for these experiments was determined based on achieving an approximately 50–50 reaction outcome in the presence of 3 µM OCRL. (E) Quantification of final reaction outcome in (D) from a single experiment (N > 100 corrals per OCRL concentration). (C–E) Initial membrane composition: 96% DOPC, 2% PI(4)P, and 2% PI(4,5)P2.
-
Figure 7—source data 1
Related to Figure 7B.
- https://cdn.elifesciences.org/articles/73747/elife-73747-fig7-data1-v2.xlsx
-
Figure 7—source data 2
Related to Figure 7C.
- https://cdn.elifesciences.org/articles/73747/elife-73747-fig7-data2-v2.xlsx
-
Figure 7—source data 3
Related to Figure 7E.
- https://cdn.elifesciences.org/articles/73747/elife-73747-fig7-data3-v2.xlsx
Figure 7—video 1
Visualization of lipid phosphorylation reactions reconstituted in 5 µm x 5 µm chromium -patterned -supported membranes.
Reaction contains 5 nM PIP5KB and 20 nM Alexa488-PLCδ. Video associated with Figure 7A. Initial membrane composition: 96% DOPC, 4% PI(4)P. Scale bar is 10 µm.
Figure 7—video 2
Visualization of lipid phosphorylation reactions reconstituted in 5 µm x 5 µm chromium -patterned -supported membranes.
Reaction contains 10 nM PIP5KB (D51R) and 20 nM Alexa488-PLCδ. Video associated with Figure 7A. Initial membrane composition: 96% DOPC, 4% PI(4)P. Scale bar is 10 µm.
Figure 8
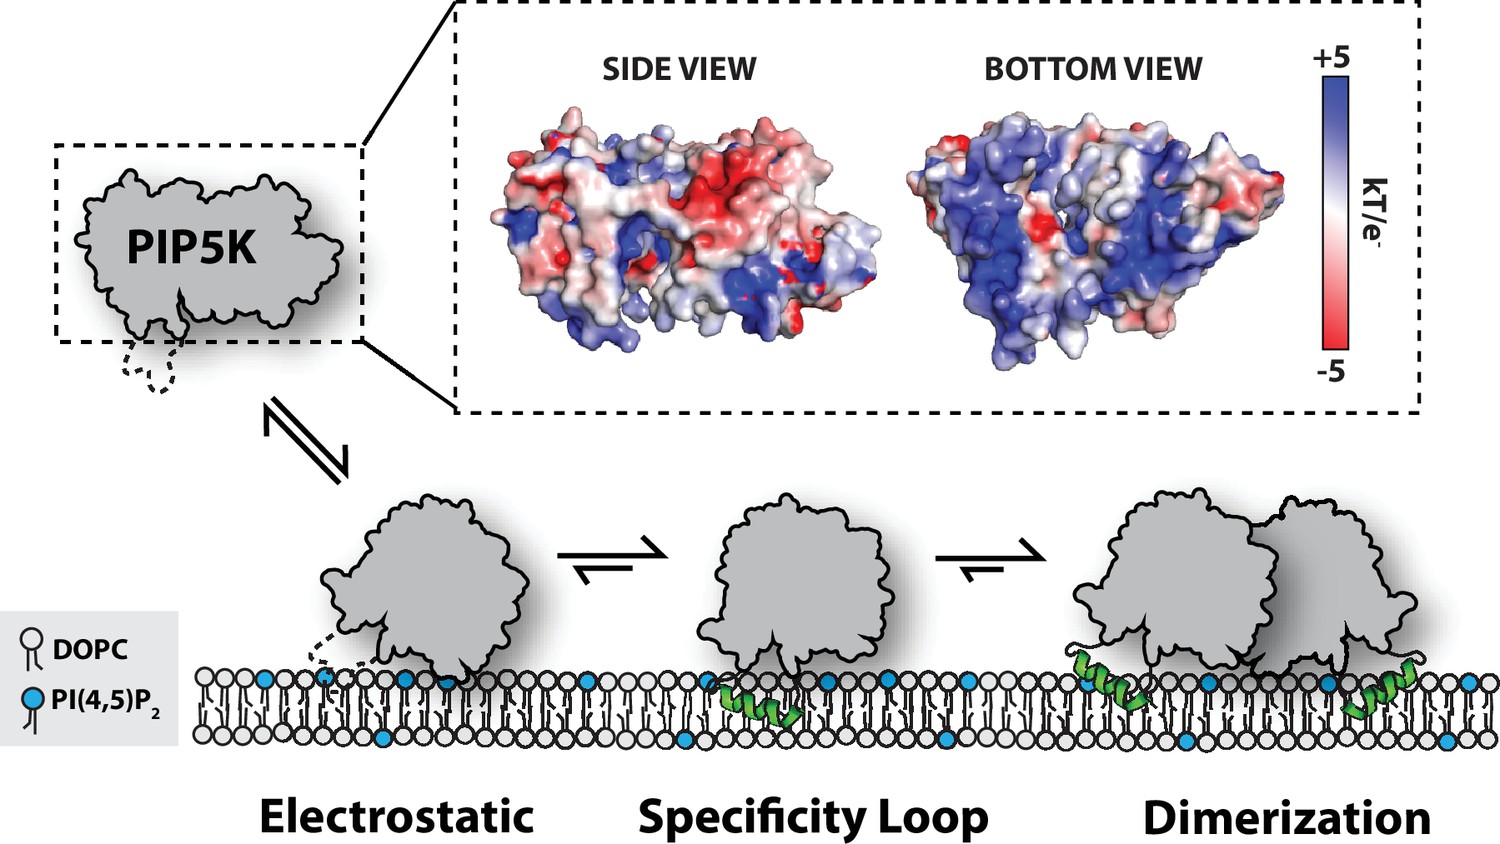
Model for PIP5K membrane-mediated dimerization.
Mediated by electrostatic interactions, PIP5K can associate with membranes as a monomer. The specificity loop stabilizes membrane association and enables PIP5K to catalyze the phosphorylation of PI(4)P to generate PI(4,5)P2. Increasing densities of PI(4,5)P2 and membrane-bound PIP5K promote membrane-mediated dimerization, which leads to enhanced catalytic efficiency.
Tables
Table 1
Protein density dependent changes in Ax647-PIP5KB membrane binding behavior.
| Protein visualized | [5KB] | τ1 ± SD (s) | τ2± SD (s) | α ± SD | N | D1 ± SD (µm2/s) | D2 ± SD (µm2/s) | α ± SD | Steps |
|---|---|---|---|---|---|---|---|---|---|
| 1 pM Ax647-5KB | 0 | 0.453 ± 0.013 | – | – | 7018 | 0.148 ± 0.005 | – | – | 66,889 |
| 1 pM Ax647-5KB | 0.2 nM | 0.475 ± 0.037 | – | – | 4855 | 0.058 ± 0.011 | 0.194 ± 0.012 | 0.20 ± 0.06 | 48,888 |
| 1 pM Ax647-5KB | 1 nM | 0.559 ± 0.009 | – | – | 4783 | 0.038 ± 0.001 | 0.189 ± 0.004 | 0.27 ± 0.02 | 56,027 |
| 1 pM Ax647-5KB | 5 nM | 0.599 ± 0.055 | 1.354 ± 0.32 | 0.72 ± 0.17 | 4268 | 0.038 ± 0.002 | 0.173 ± 0.007 | 0.40 ± 0.04 | 66,680 |
| 1 pM Ax647-5KB | 10 nM | 0.895 ± 0.032 | 2.791 ± 0.27 | 0.94 ± 0.03 | 2362 | 0.039 ± 0.004 | 0.164 ± 0.002 | 0.48 ± 0.05 | 47,103 |
| 1 pM Ax647-5KB | 50 nM | 0.787 ± 0.057 | 2.08 ± 0.078 | 0.70 ± 0.03 | 1530 | 0.043 ± 0.002 | 0.142 ± 0.008 | 0.63 ± 0.03 | 35,678 |
| 1 pM Ax647-4KB | 0 | 0.021 ± 0.005 | 0.058 ± 0.007 | 0.39 ± 0.15 | 227,275 |
-
SD, standard deviation from 3 to 5 technical replicates; N, total number of molecules tracked in 3–5 technical replicates; steps, total number of particle displacements measured in 3–5 technical replicates; alpha, fraction of molecules that have the characteristic dwell time or diffusion coefficient (τ1 or D1), τbleaching, Ax647-5KB = 26.7 s (see Figure 2—figure supplement 1); membrane composition, 98% DOPC, 2% PI(4,5)P2.
Table 2
Dimerization dependent changes in Ax647-PIP5KB membrane binding behavior.
| Protein visualized | [5KB] | % PIP2 | τ1 ± SD (s) | τ2 ± SD (s) | α ± SD | N | D1 ± SD (µm2/s) | D2 ± SD (µm2/s) | α ± SD | Steps |
|---|---|---|---|---|---|---|---|---|---|---|
| 25 pM Ax647-5KB | 0 | 1 | 0.096 ± 0.05 | – | – | 3422 | – | – | – | – |
| 5 pM Ax647-5KB | 0 | 2 | 0.64 ± 0.092 | – | – | 4525 | 0.171 ± 0.006 | – | – | 174,748 |
| 2 pM Ax647-5KB | 0 | 4 | 0.74 ± 0.088 | 3.43 ± 0.29 | 0.59 ± 0.06 | 1920 | – | – | – | – |
| 25 pM Ax647-5KB (D51R) | 0 | 1 | 0.090 ± 0.01 | – | – | 4848 | – | – | – | – |
| 5 pM Ax647-5KB (D51R) | 0 | 2 | 0.649 ± 0.043 | – | – | 2542 | 0.174 ± 0.001 | – | – | 238,548 |
| 2 pM Ax647-5KB (D51R) | 0 | 4 | 0.864 ± 0.077 | 3.97 ± 0.37 | 0.58 ± 0.03 | 1850 | – | – | – | – |
| 1 pM Ax647-5KB | 50 nM | 2 | 0.709 ± 0.24 | 2.49 ± 0.27 | 0.53 ± 0.08 | 9693 | 0.022 ± 0.002 | 0.067 ± 0.005 | 0.50 ± 0.07 | 311,198 |
| 1 pM Ax647-5KB (D15R) | 50 nM | 2 | 0.416 ± 0.02 | – | – | 8218 | 0.133 ± 0.008 | – | – | 74,928 |
-
SD, standard deviation from 3 to 5 technical replicates; N, total number of molecules tracked in 3–5 technical replicates; steps, total number of particle displacements measured in 3–5 technical replicates; alpha, fraction of molecules that have the characteristic dwell time or diffusion coefficient (τ1 or D1), τbleaching, Ax647-5KB = 26.7 s (see Figure 2—figure supplement 1); membrane composition, 96–99% DOPC, 1–4% PI(4,5)P2.
Additional files
-
Transparent reporting form
- https://cdn.elifesciences.org/articles/73747/elife-73747-transrepform1-v2.docx
-
Supplementary file 1
Plasmids and recombinant proteins.
Description of plasmids used for recombinant protein expression, purification, and transient transfection.
- https://cdn.elifesciences.org/articles/73747/elife-73747-supp1-v2.docx
Download links
A two-part list of links to download the article, or parts of the article, in various formats.
Downloads (link to download the article as PDF)
Open citations (links to open the citations from this article in various online reference manager services)
Cite this article (links to download the citations from this article in formats compatible with various reference manager tools)
Membrane-mediated dimerization potentiates PIP5K lipid kinase activity
eLife 11:e73747.
https://doi.org/10.7554/eLife.73747


