Comprehensive and unbiased multiparameter high-throughput screening by compaRe finds effective and subtle drug responses in AML models
- Biotech Research and Innovation Centre (BRIC) and Novo Nordisk Foundation Center for Stem Cell Biology (DanStem), University of Copenhagen, Denmark
- Institute for Molecular Medicine Finland (FIMM), Helsinki Institute of Life Science, University of Helsinki, Finland
- Rigshospitalet, Denmark
- Centre for Gene Regulation and Expression, School of Life Sciences, University of Dundee, United Kingdom
- Cell Biology Program and Center for Epigenetics Research, Memorial Sloan Kettering Cancer Center (MSKCC), United States
Figures
Figure 1
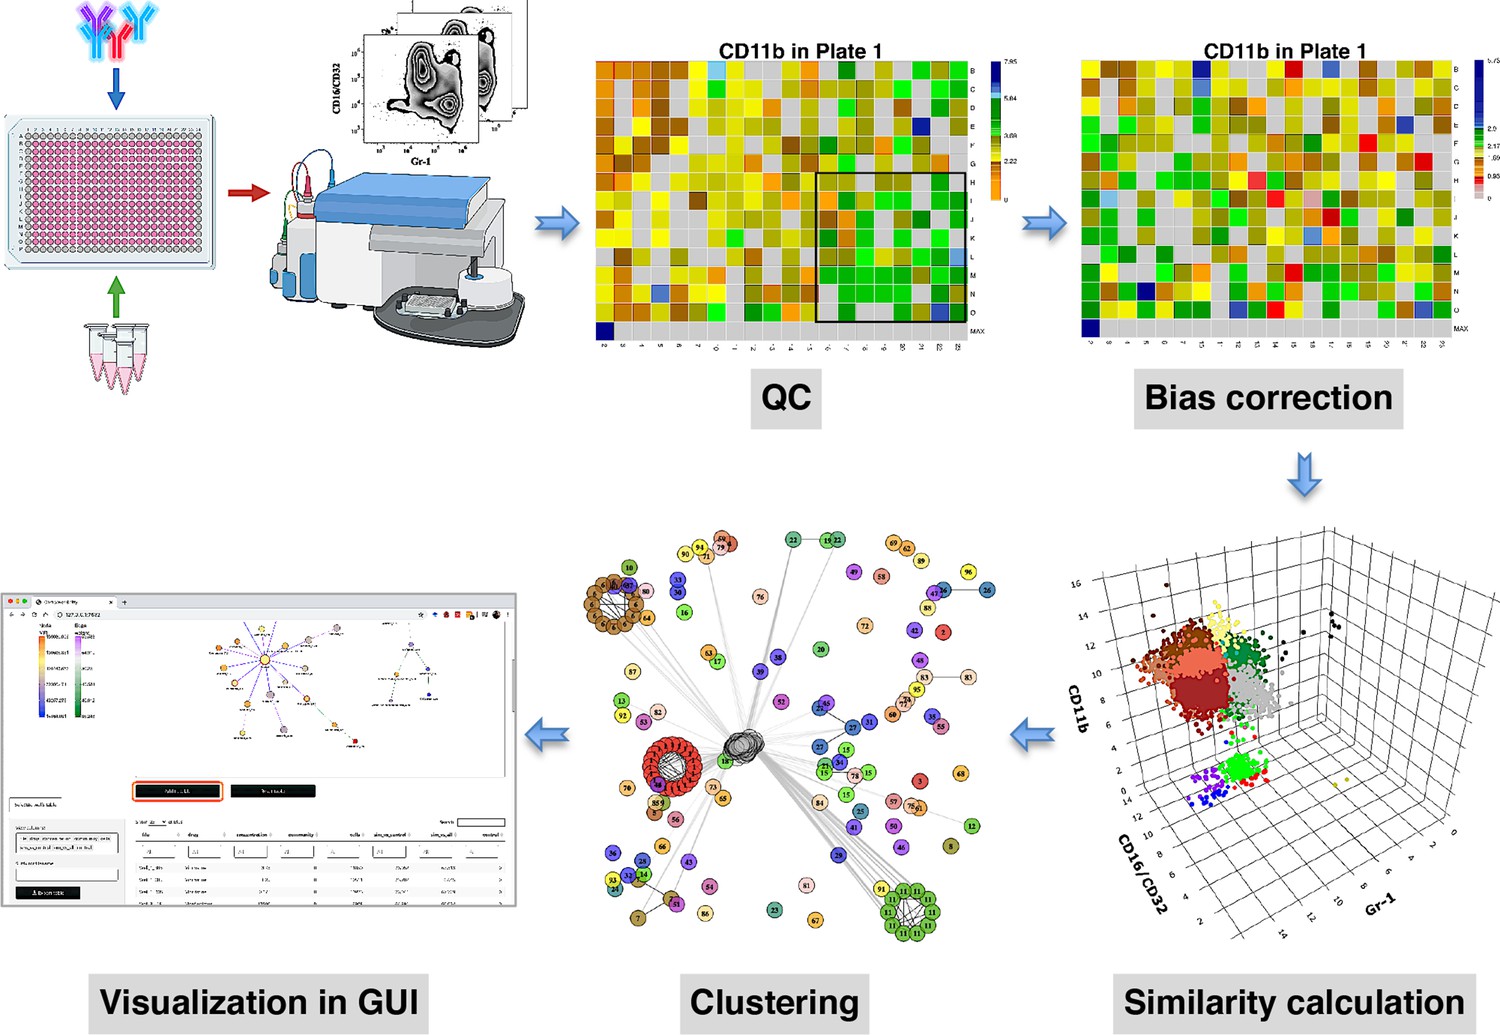
compaRe is a comprehensive suite for multiparameter screening data.
High-throughput flow cytometry generates massive multidimensional data from hundreds of samples. compaRe’s quality control (QC) module reveals several sources of bias in the assay such as signal (intensity difference between the top left and bottom right corners) and cell viability drifts. These two are corrected for in the bias correction modules within and between the plates. compaRe performs a pairwise similarity calculation between the samples using dynamic gridding and forming hypercubes (represented by distinct colors). The portions of the data within individual hypercubes are used to calculate similarity. Clustering is performed based on similarity. The graphical user interface (GUI) provides several ways to thoroughly explore and visualize the read-outs.
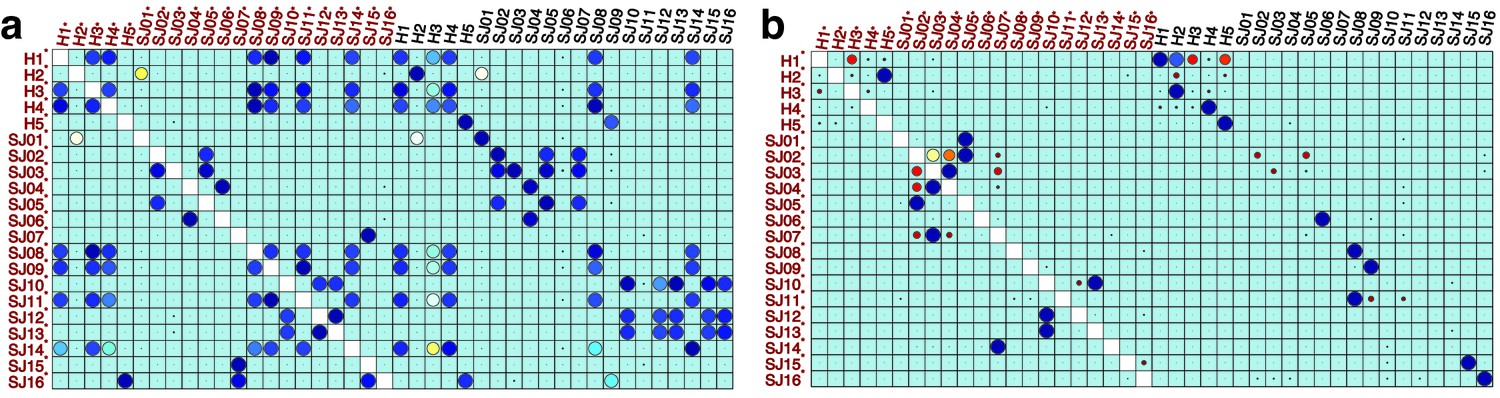
Figure 2
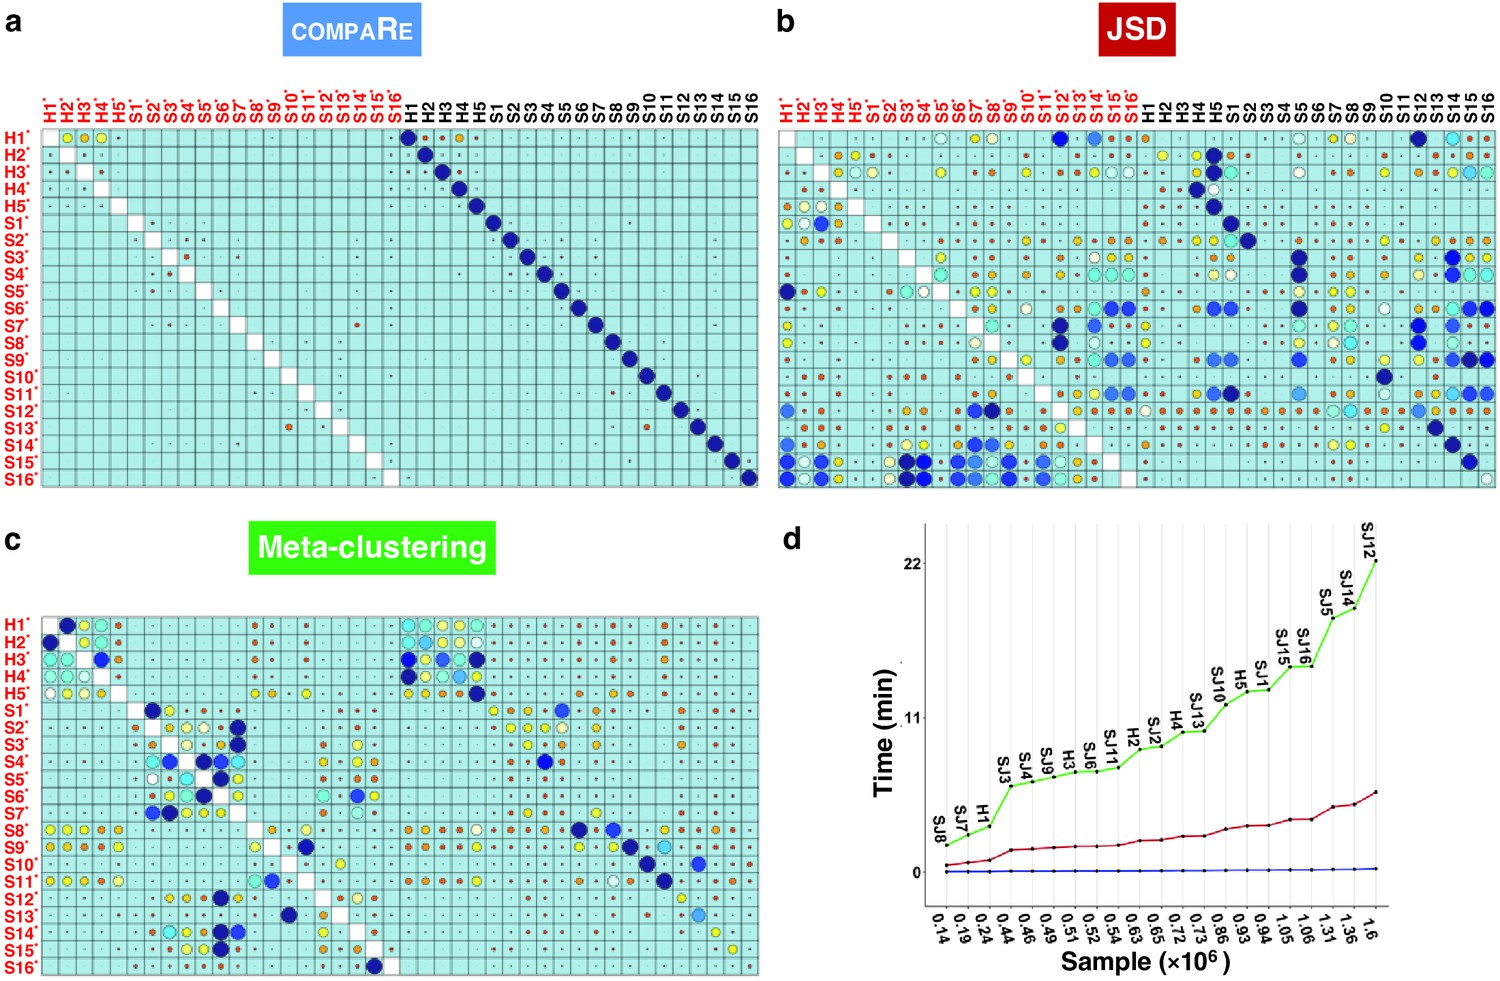
compaRe robustly measures the similarity between samples in the presence of batch effect.
Similarity matrix generated by compaRe is shown in (a). Size and color of dots represent the level of similarity. Self-comparisons were removed. Noise was added (marked with *) to the original 21 mass cytometry samples of bone marrow aspirates from 16 pediatric AML patients (S) and five healthy adult donors (H). Similarity matrices using JSD with UMAP and meta-clustering with PhenoGraph are shown in (b) and (c), respectively. The run time of comparing each sample to itself is shown in (d). Samples were sorted based on their size.
Figure 3
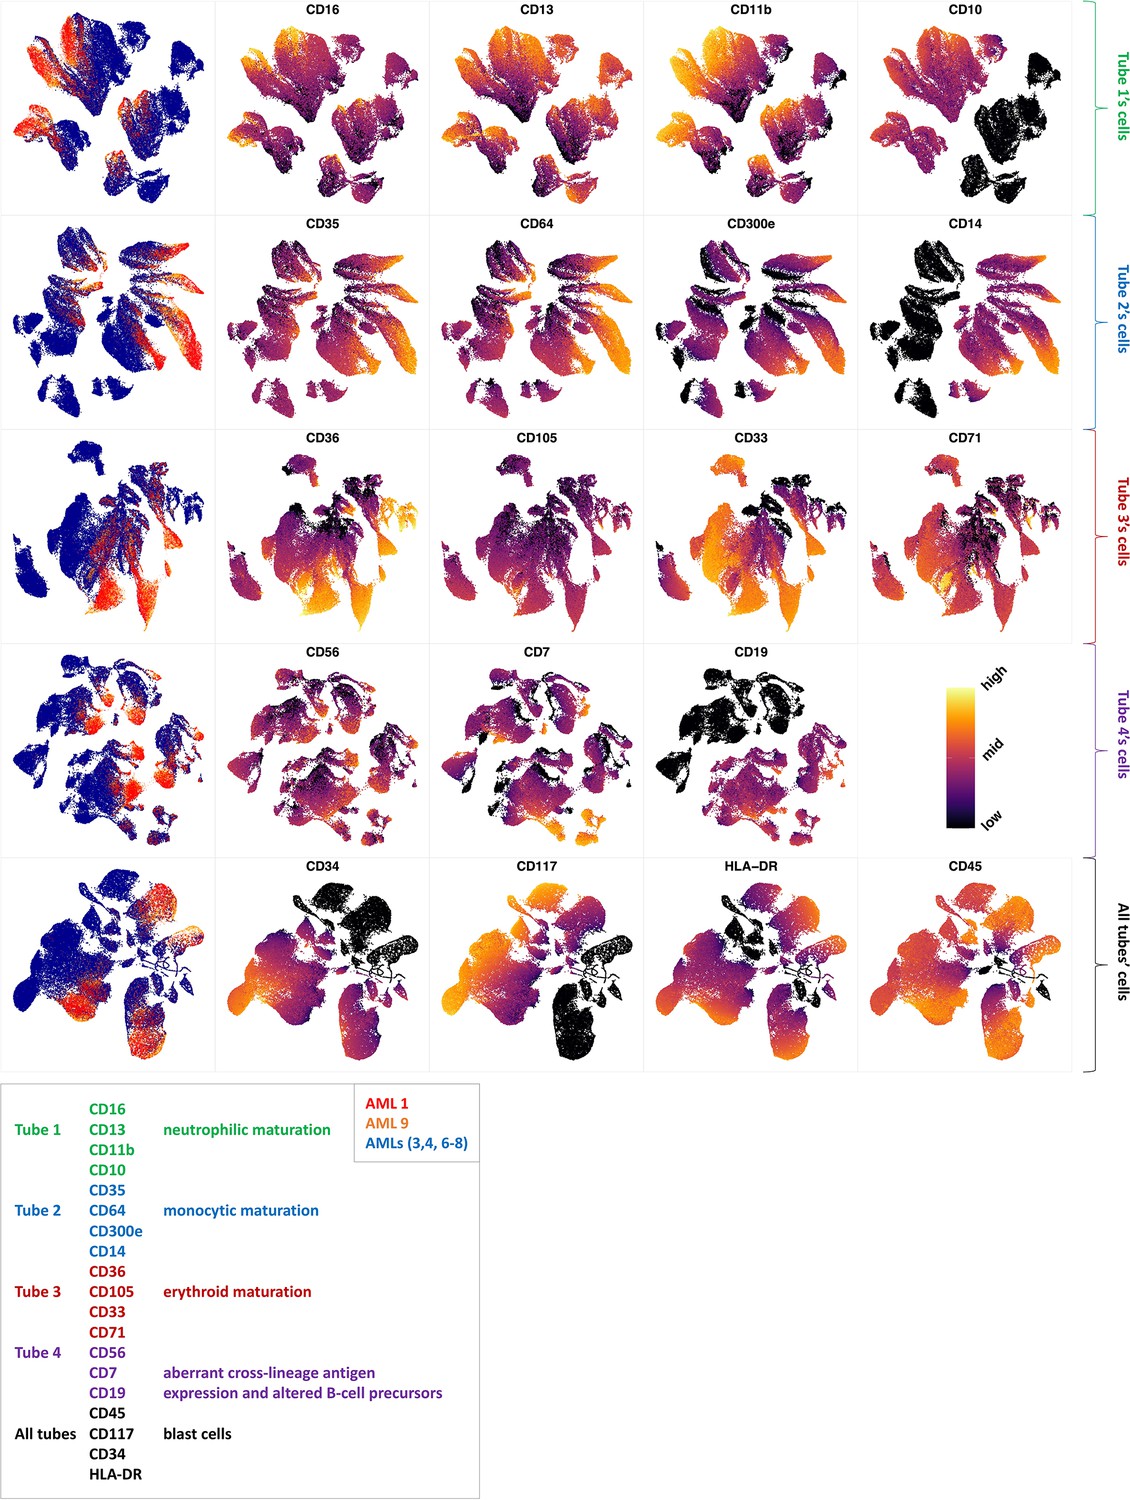
Immunophenotypic profiles of two different groups of AML patients.
Each row shows the UMAP projection of AML samples 1 and 9 (red and orange) vs AML samples 3, 4, 6–8 (blue) of the green cluster of (b) stained by the markers available in each tube.
Figure 4
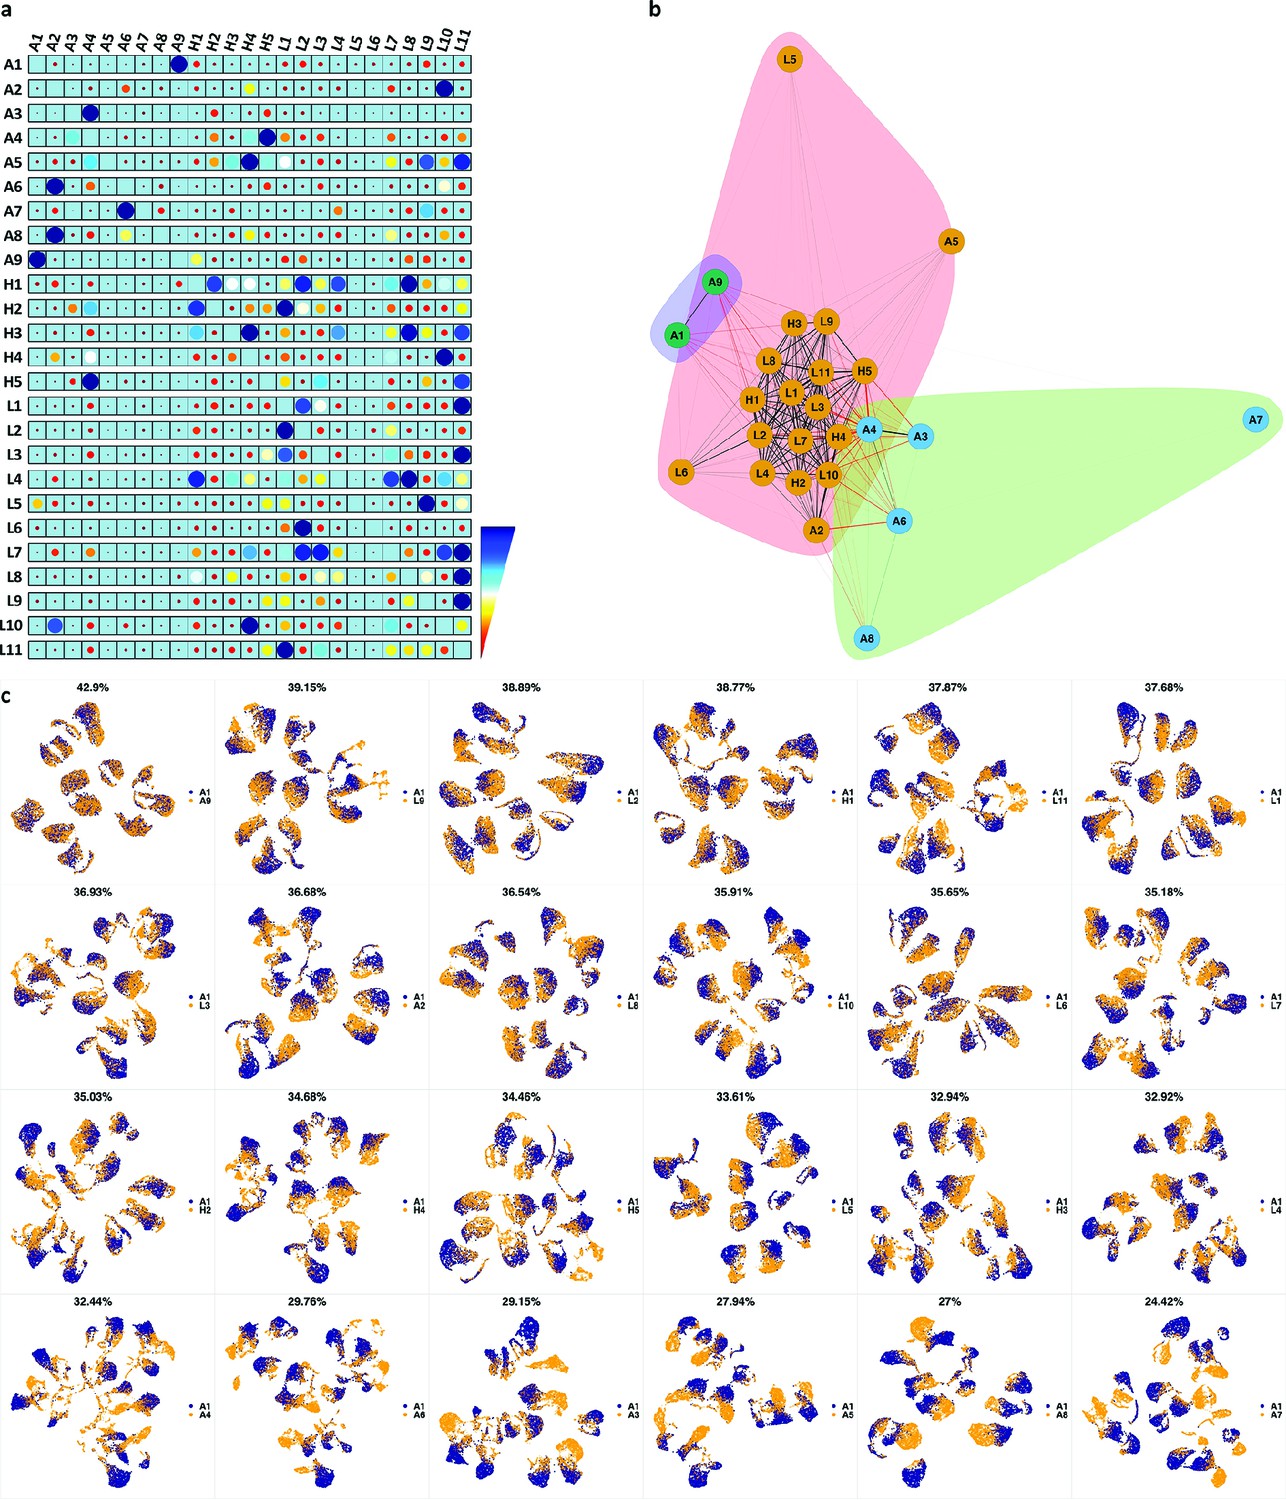
compaRe highlights immunophenotypic similarities.
(a) The similarity band plot visualizes the similarity between a sample specified by its row (band) and other samples measured by compaRe (H: higher-risk MDS, L: lower-risk MDS and A: AML). Each band was independently transformed by an exponential function to emphasize the highest and the lowest similarity values. (b) A graphical representation of the similarities. The graph nodes (samples) were clustered by a random walk. (c) The UMAP projection of A1 sample against the other patient samples is provided as an example. The other projections are given in Appendix 1—figures 3–26. The projections were sorted based on similarity.
Figure 5

compaRe analysis identifies several distinct cell subtype-specific responses in a high-throughput flow cytometry screening of mouse AML cells.
(a) A UMAP plot of cliques identified by compaRe. Cliques are colored by Gr-1 and CD16/CD32 MFIs. Group one is characterized with reduced Gr-1 and increased CD16/CD32 as compared with control. Group two has increased Gr-1 expression compared with control. (b) Heatmap of marker MFIs. Values are normalized between 0 and 1 per marker to make cross-comparisons possible. Cliques containing control, trametinib (2.5 nM) (C23), molibresib and birabresib (C100 and C110), and vincristine (C80) are marked. (c) Waterfall plot of compounds belonging to response group 1, showing live cell count as a percentage of control treatment (DMSO). (d) Density scatter plots for Control (DMSO), C23, C100, and C80.
Figure 6
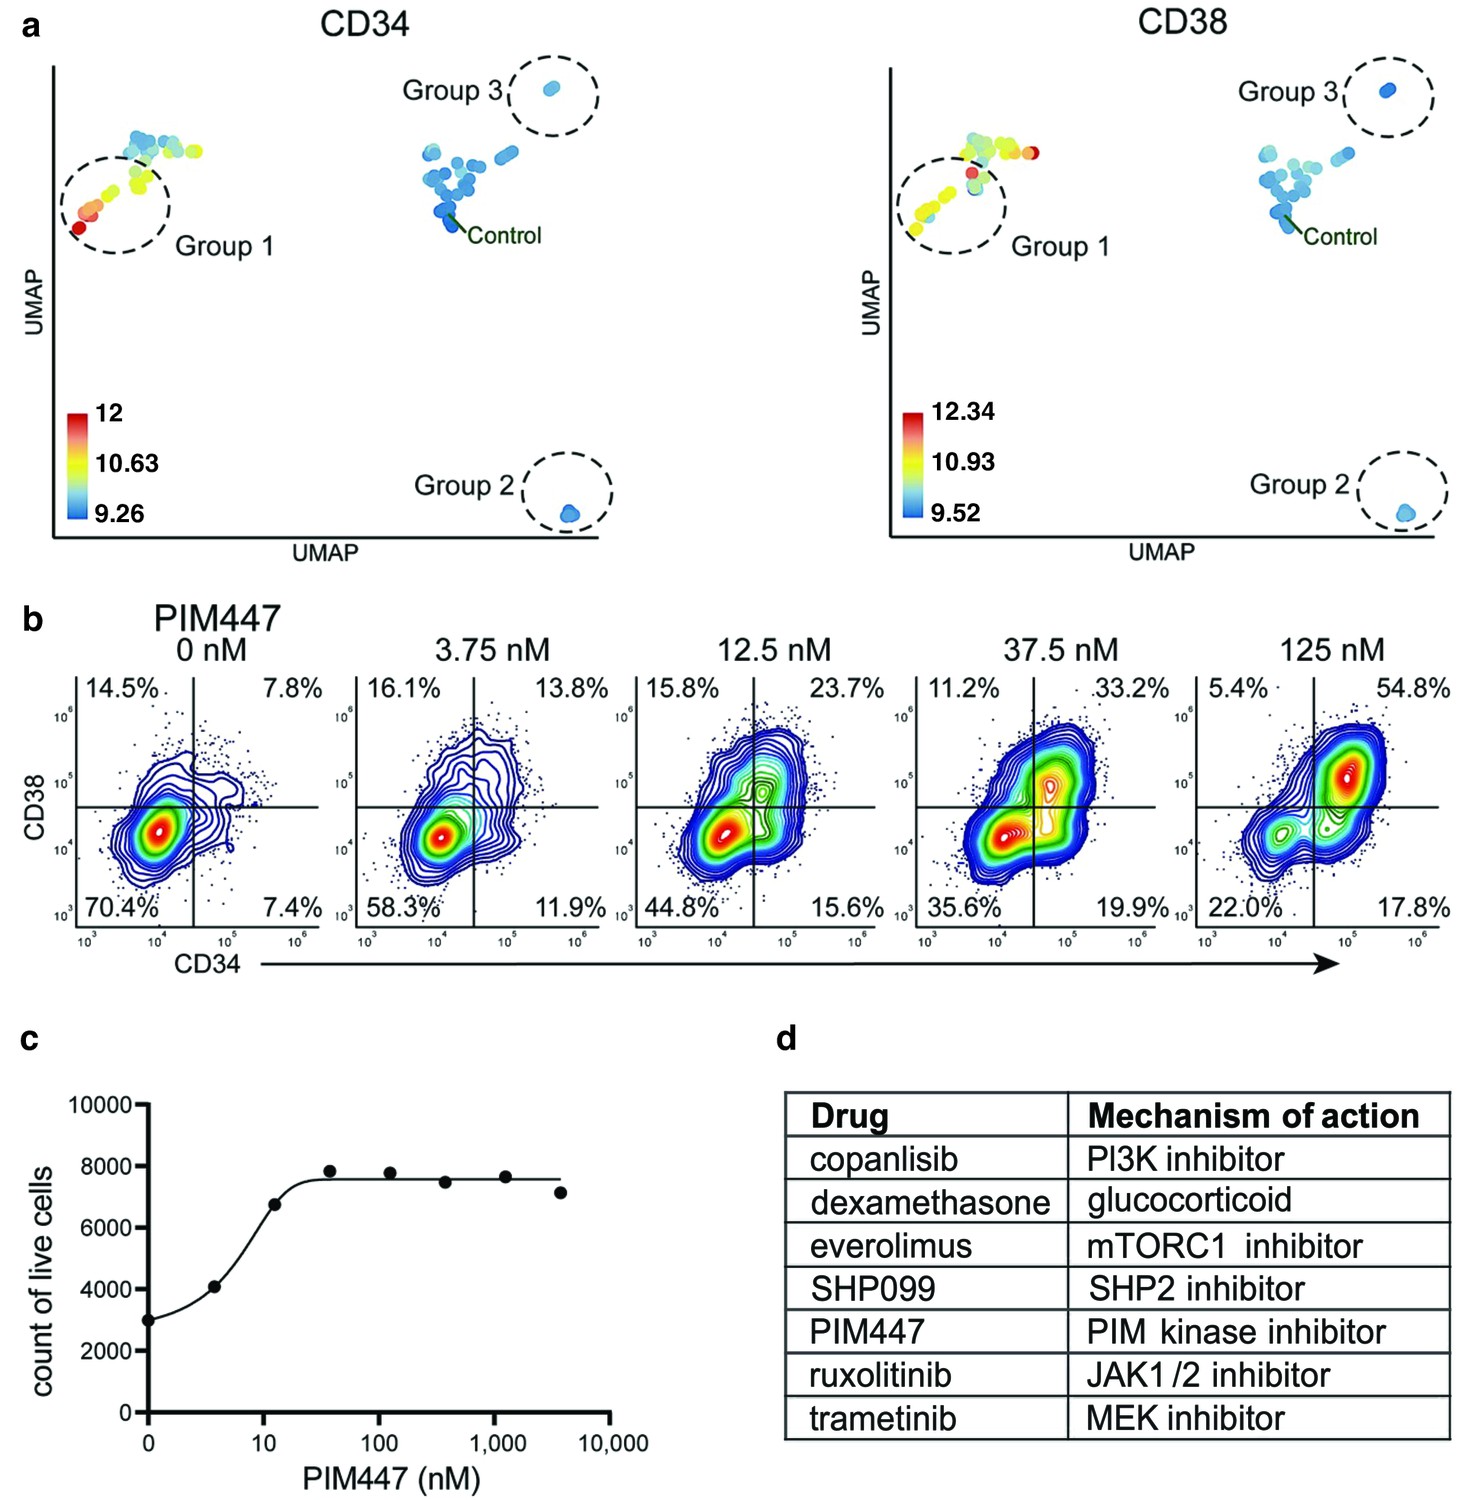
Identification of drugs that induce expansion of CD34+/CD38+ cells in an AML patient sample.
(a) UMAP of cliques identified by compaRe. Cliques are colored by CD34 and CD38 MFIs. Response groups of interest are indicated using a dashed line. (b) Example of response group 1: density scatter plot of markers CD34 and CD38 in different concentrations of PIM kinase inhibitor PIM447. (c) Count of live cells after 72 hr exposure to different concentrations of PIM kinase inhibitor PIM447. (d) Table of drugs that induced expansion of the CD34+/CD38+ cell population.
Appendix 1—figure 1
Performance of meta-clustering with SPADE FlowSOM in the presence of batch effect.
Similarity matrices generated by FlowSOM and SPADE are shown in (a) and (b) respectively. Size and color of dots represent the level of similarity. Self-comparisons were removed. Noise was added (marked with *) to the original 21 mass cytometry samples of bone marrow aspirates from 16 pediatric AML patients (S) and five healthy adult donors (H).
Appendix 1—figure 2

Phenotypic characterization in a high-parameter heterogeneous population of cell types.
Cells from a target cluster (an immunophenotypic cell population) were gradually removed to contort its configuration. We used a dataset of 3 healthy and two pediatric AML bone marrow mononuclear cell samples from the data provided in the 6th reference. Samples were stained with 29 (15 membrane and 14 intracellular signaling) markers. Taking H1 as reference, we gradually removed 25%, 50%, 75% and 100% (phenotypic changes) of cells from the target cluster identified by PhenoGraph. To capture the higher heterogeneity harbored in the AML samples, we set compaRe's n to 4 while we set it to 3 for healthy samples. Each column was scaled individually retaining mutual differences.
Appendix 1—figure 3
UMAP projections of A2 sample against all other patient samples.
From top left to bottom right, the similarity measured by compaRe decreases as the degree of overlap decreases and the number of exclusive cell populations increases.
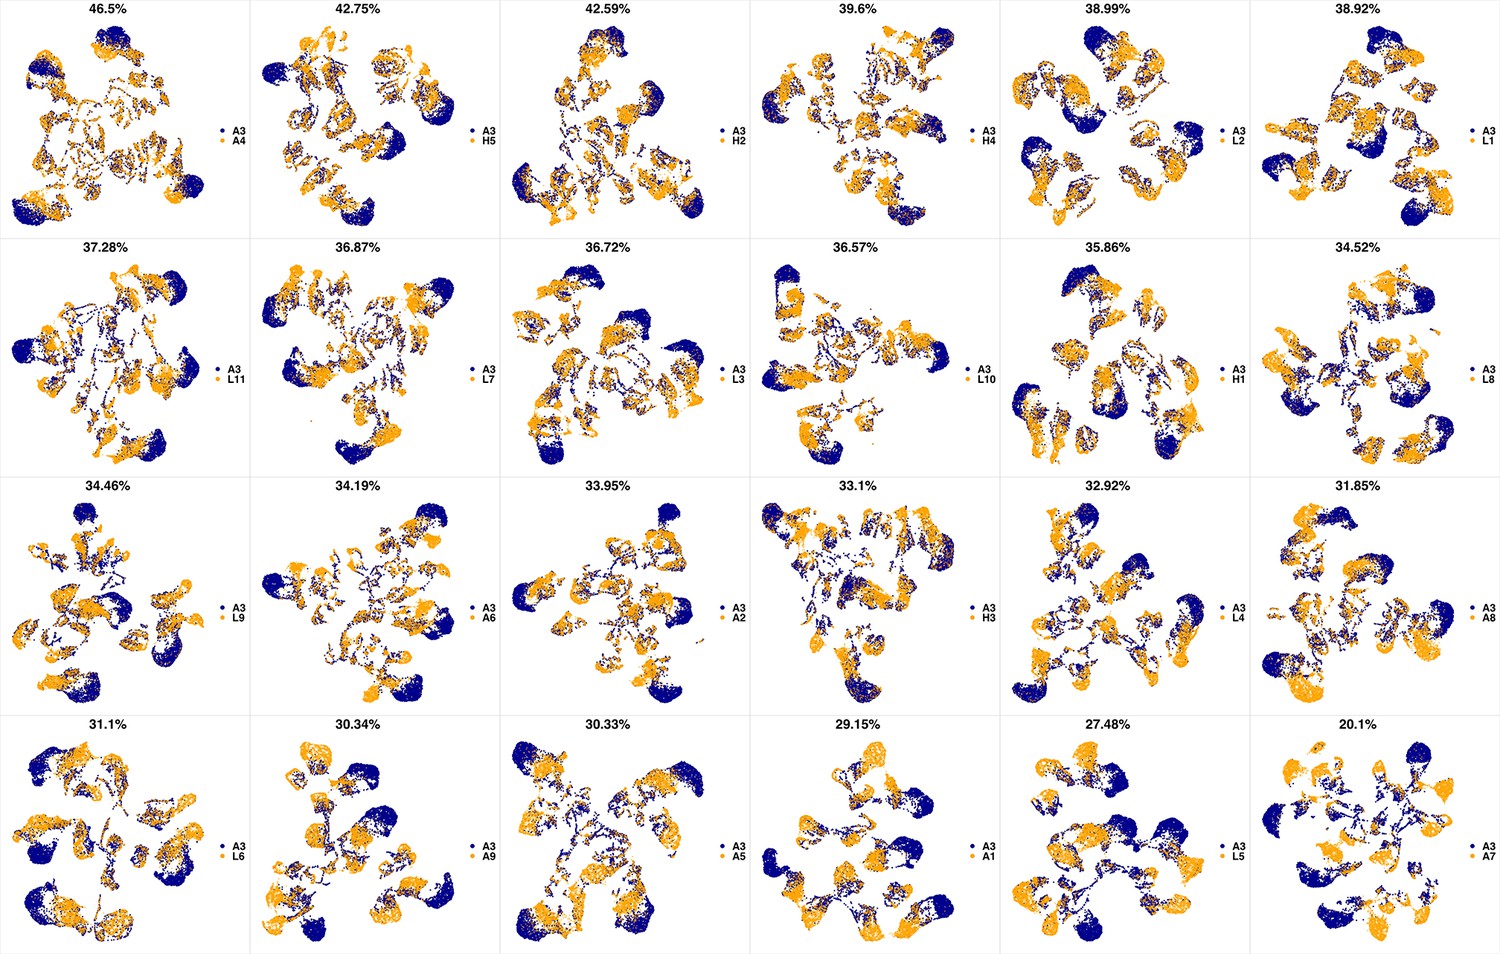
Appendix 1—figure 4
UMAP projections of A3 sample against all other patient samples.
From top left to bottom right, the similarity measured by compaRe decreases as the degree of overlap decreases and the number of exclusive cell populations increases.
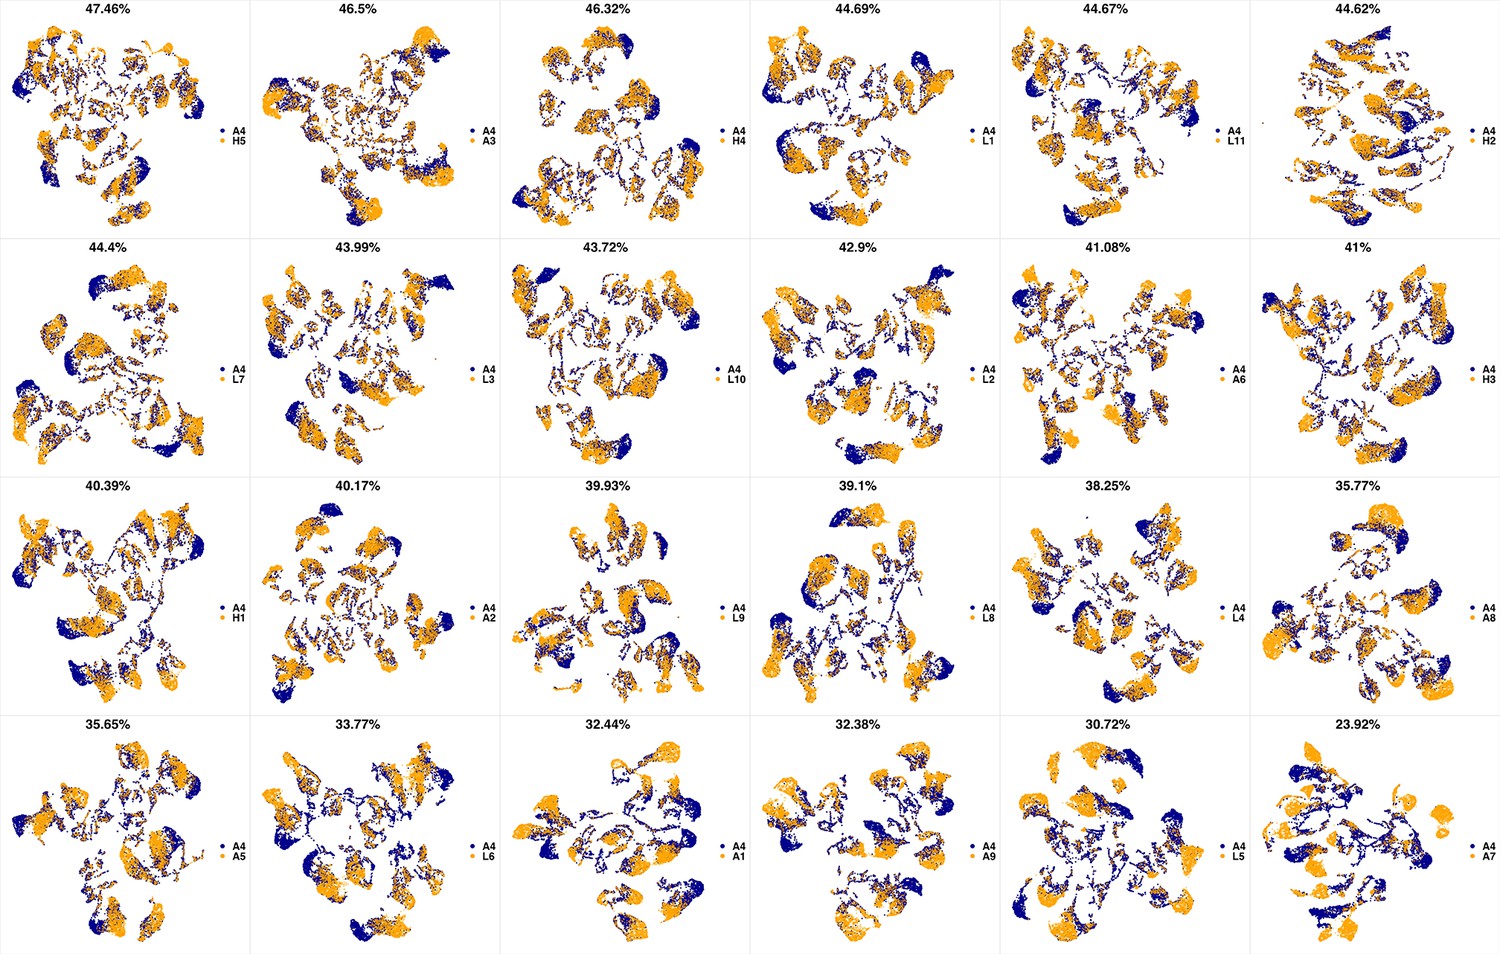
Appendix 1—figure 5
UMAP projections of A4 sample against all other patient samples.
From top left to bottom right, the similarity measured by compaRe decreases as the degree of overlap decreases and the number of exclusive cell populations increases.
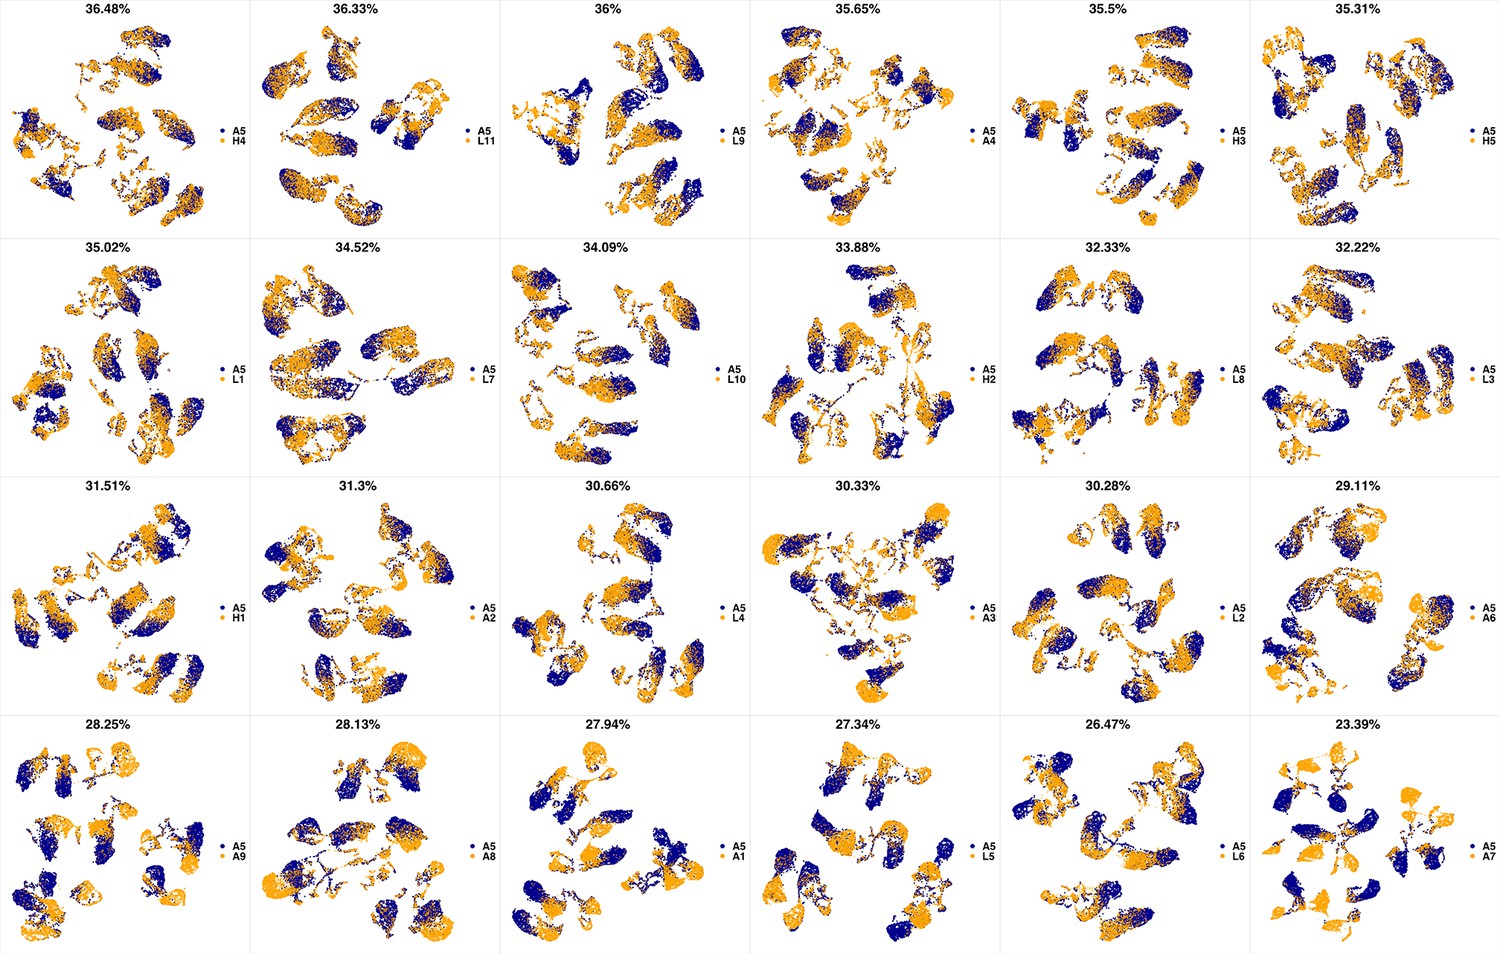
Appendix 1—figure 6
UMAP projections of A5 sample against all other patient samples.
From top left to bottom right, the similarity measured by compaRe decreases as the degree of overlap decreases and the number of exclusive cell populations increases.
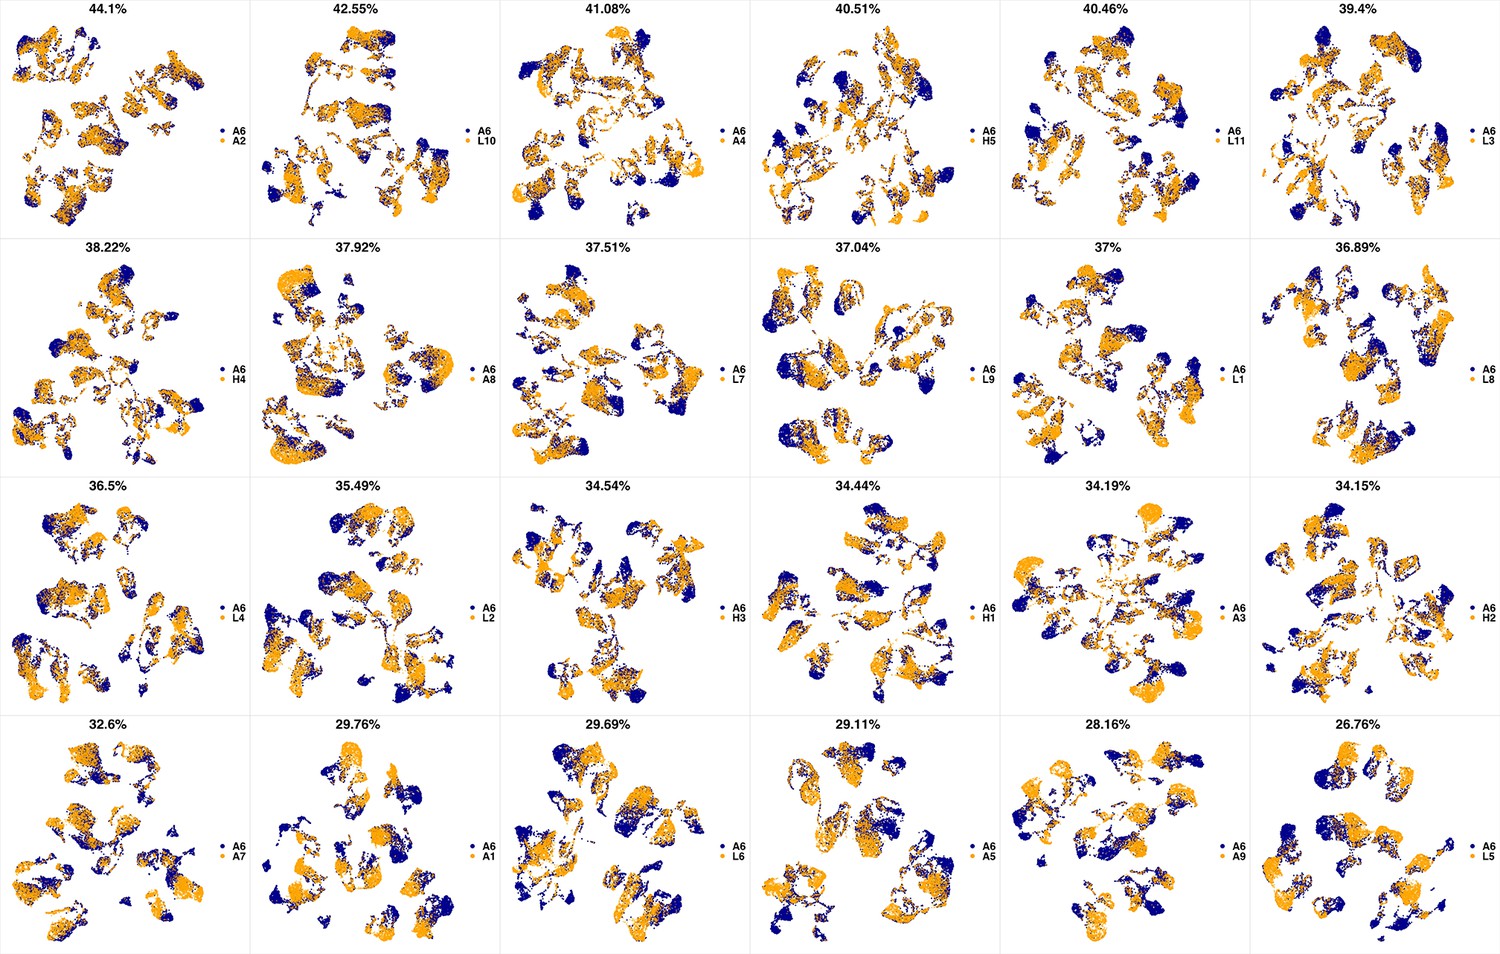
Appendix 1—figure 7

UMAP projections of A6 sample against all other patient samples.
From top left to bottom right, the similarity measured by compaRe decreases as the degree of overlap decreases and the number of exclusive cell populations increases.
Appendix 1—figure 8

UMAP projections of A7 sample against all other patient samples.
From top left to bottom right, the similarity measured by compaRe decreases as the degree of overlap decreases and the number of exclusive cell populations increases.
Appendix 1—figure 9

UMAP projections of A8 sample against all other patient samples.
From top left to bottom right, the similarity measured by compaRe decreases as the degree of overlap decreases and the number of exclusive cell populations increases.
Appendix 1—figure 10
UMAP projections of A9 sample against all other patient samples.
From top left to bottom right, the similarity measured by compaRe decreases as the degree of overlap decreases and the number of exclusive cell populations increases.
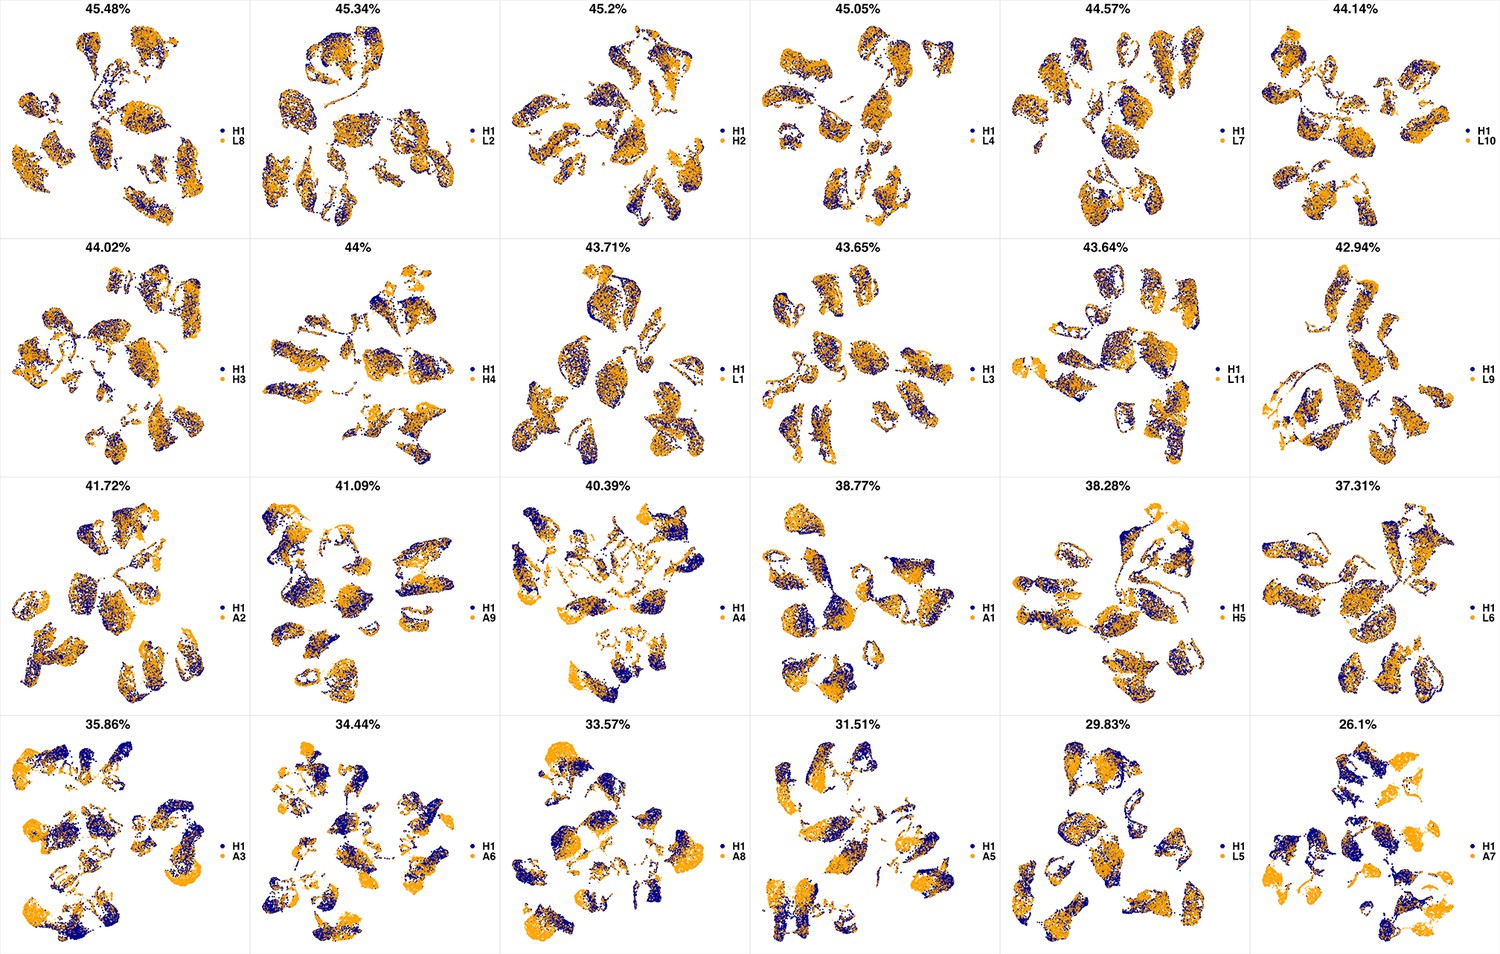
Appendix 1—figure 11
UMAP projections of H1 sample against all other patient samples.
From top left to bottom right, the similarity measured by compaRe decreases as the degree of overlap decreases and the number of exclusive cell populations increases.
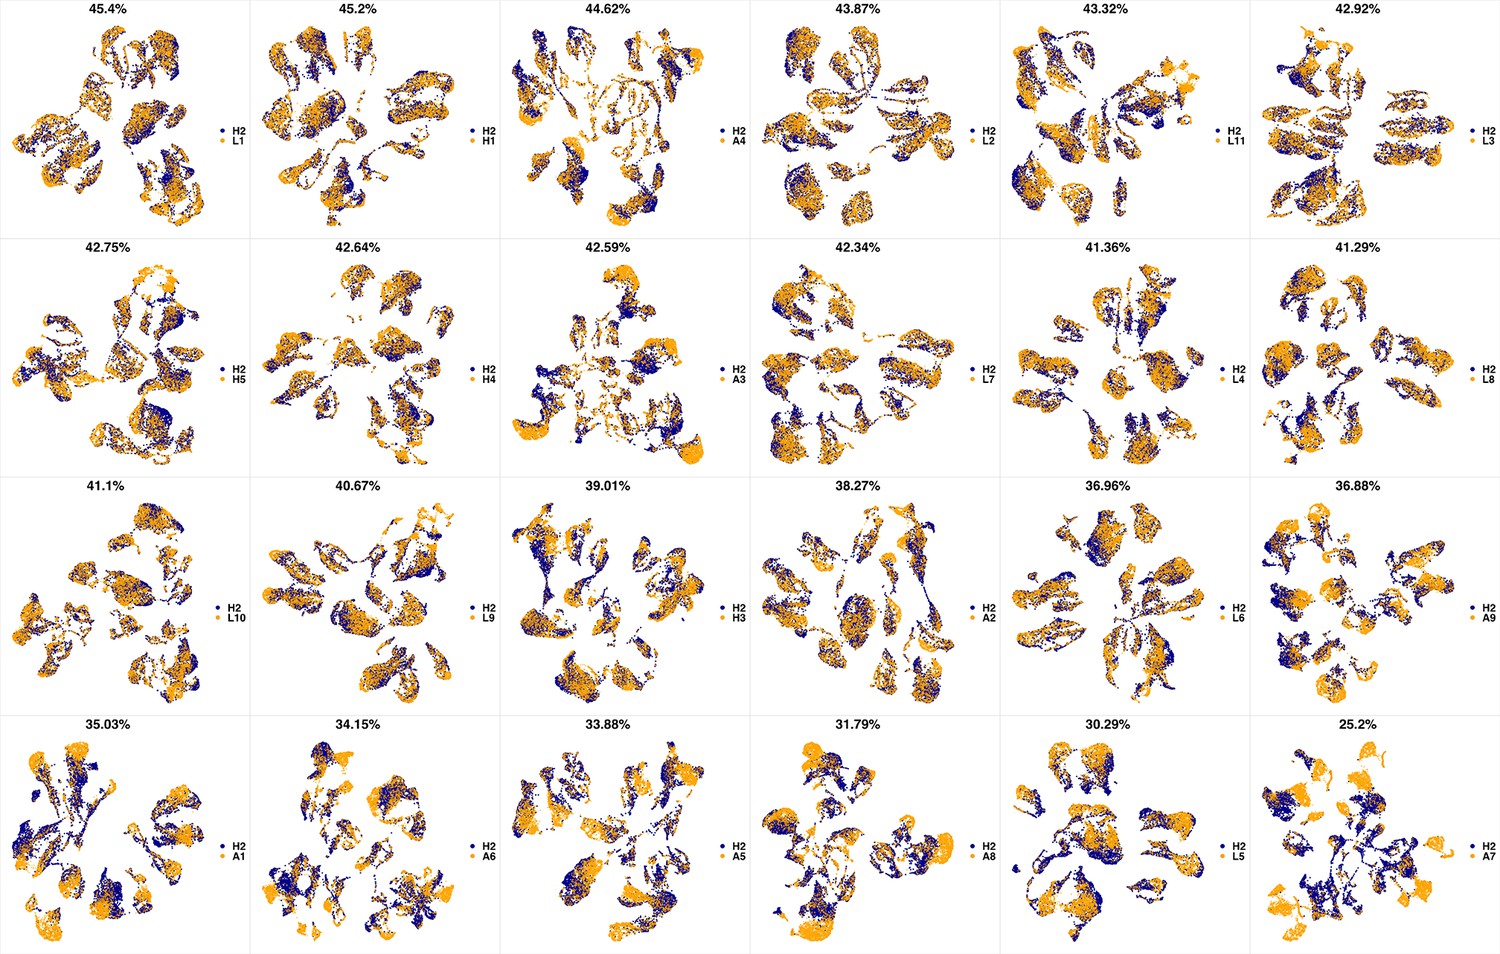
Appendix 1—figure 12

UMAP projections of H2 sample against all other patient samples.
From top left to bottom right, the similarity measured by compaRe decreases as the degree of overlap decreases and the number of exclusive cell populations increases.
Appendix 1—figure 13
UMAP projections of H3 sample against all other patient samples.
From top left to bottom right, the similarity measured by compaRe decreases as the degree of overlap decreases and the number of exclusive cell populations increases.
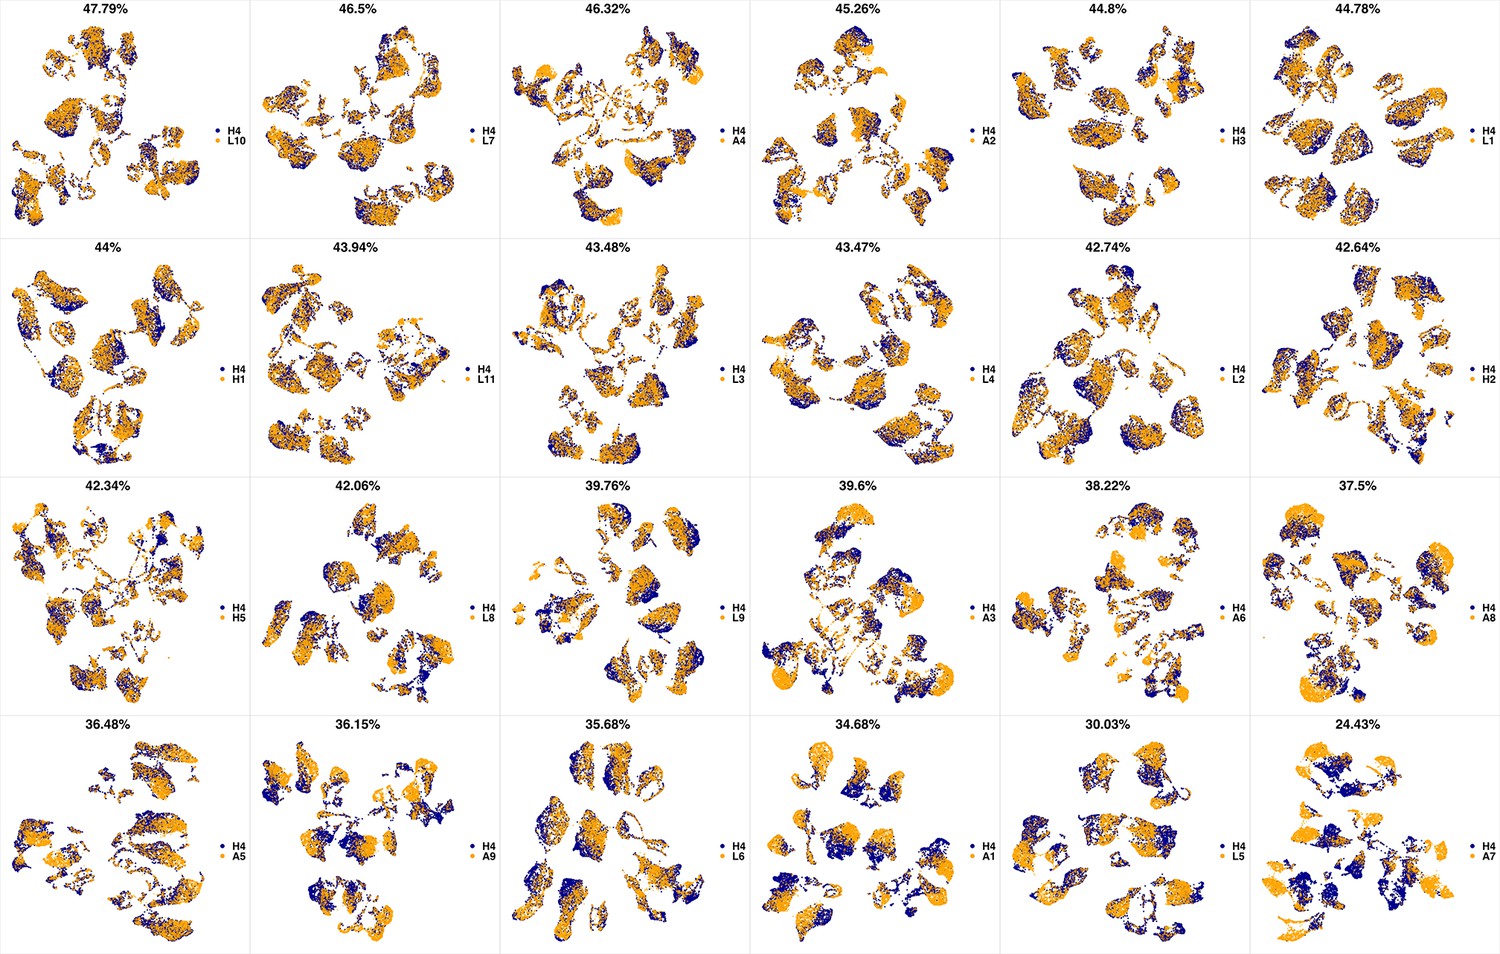
Appendix 1—figure 14

UMAP projections of H4 sample against all other patient samples.
From top left to bottom right, the similarity measured by compaRe decreases as the degree of overlap decreases and the number of exclusive cell populations increases.
Appendix 1—figure 15
UMAP projections of H5 sample against all other patient samples.
From top left to bottom right, the similarity measured by compaRe decreases as the degree of overlap decreases and the number of exclusive cell populations increases.
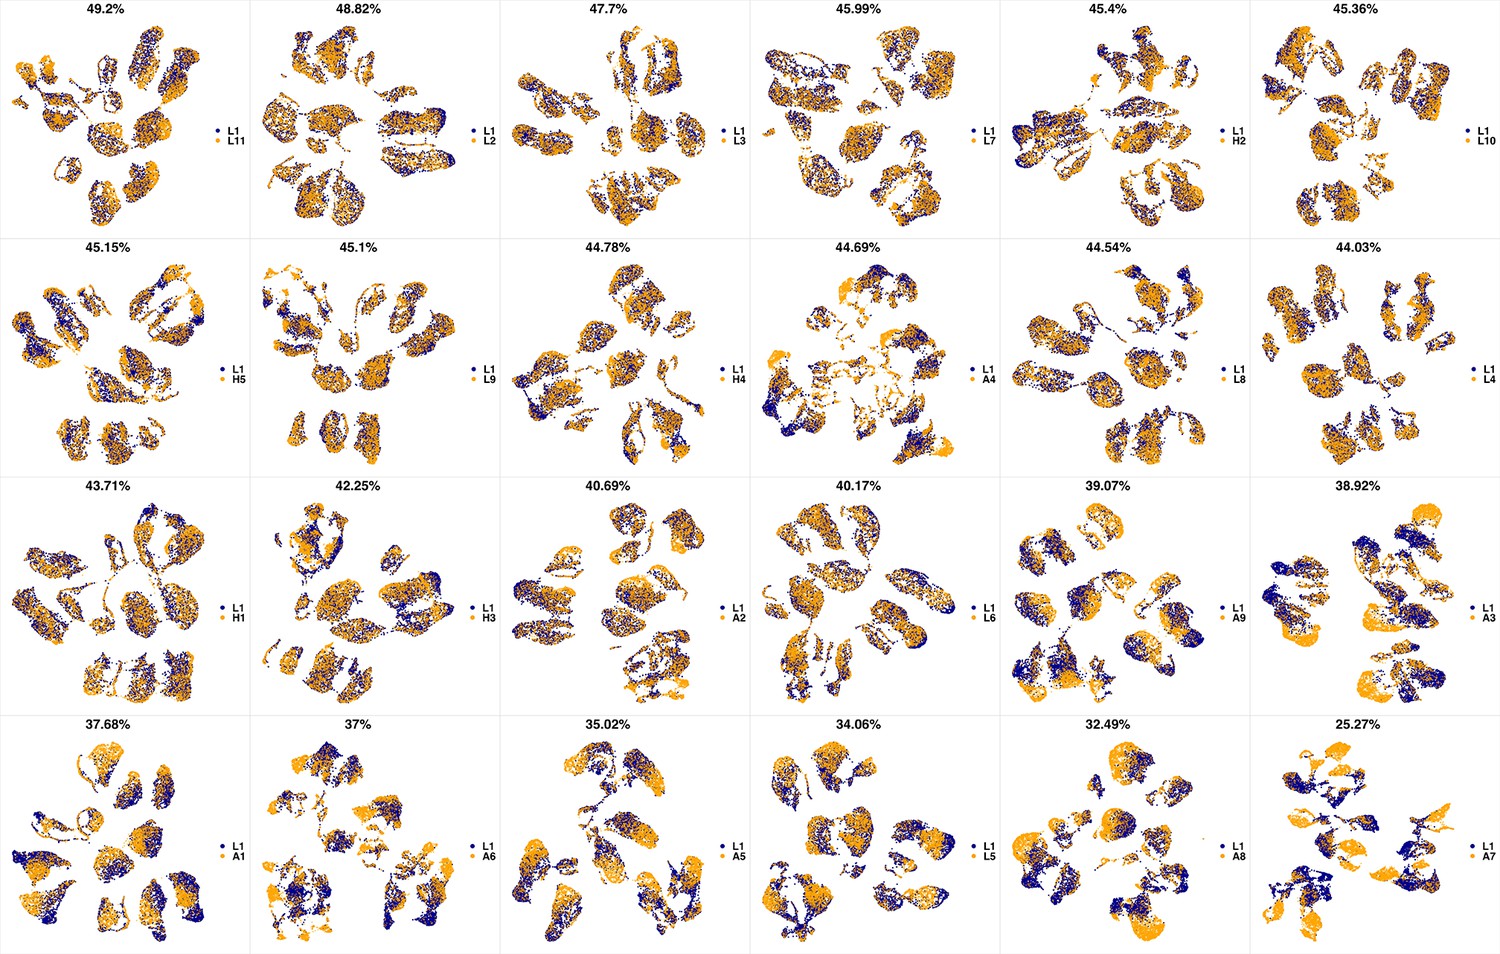
Appendix 1—figure 16
UMAP projections of L1 sample against all other patient samples.
From top left to bottom right, the similarity measured by compaRe decreases as the degree of overlap decreases and the number of exclusive cell populations increases.
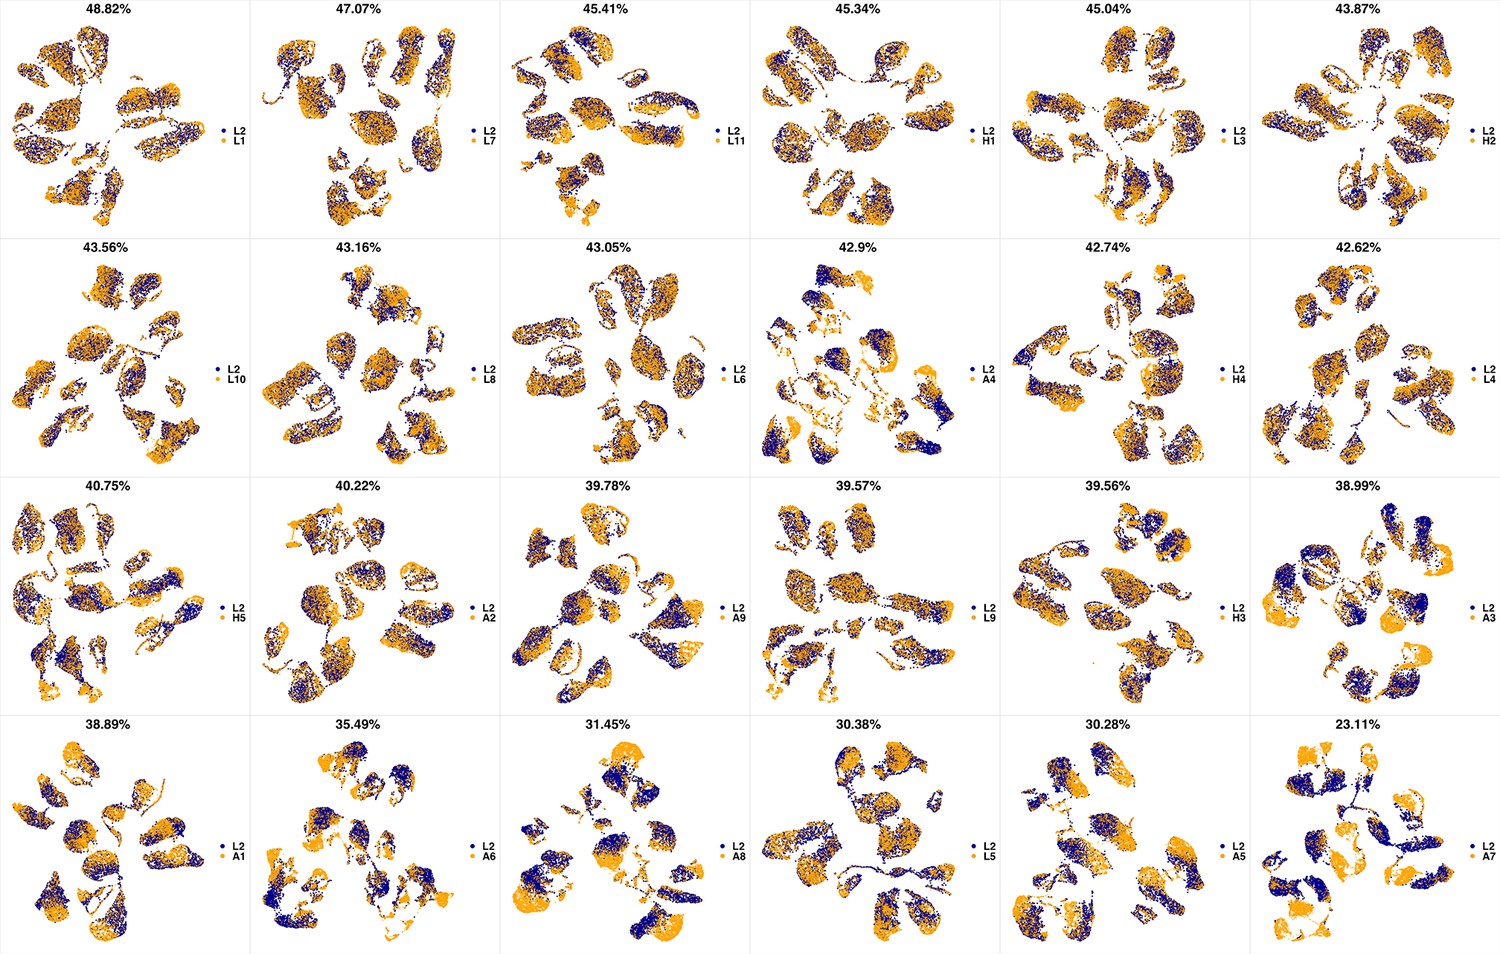
Appendix 1—figure 17
UMAP projections of L2 sample against all other patient samples.
From top left to bottom right, the similarity measured by compaRe decreases as the degree of overlap decreases and the number of exclusive cell populations increases.
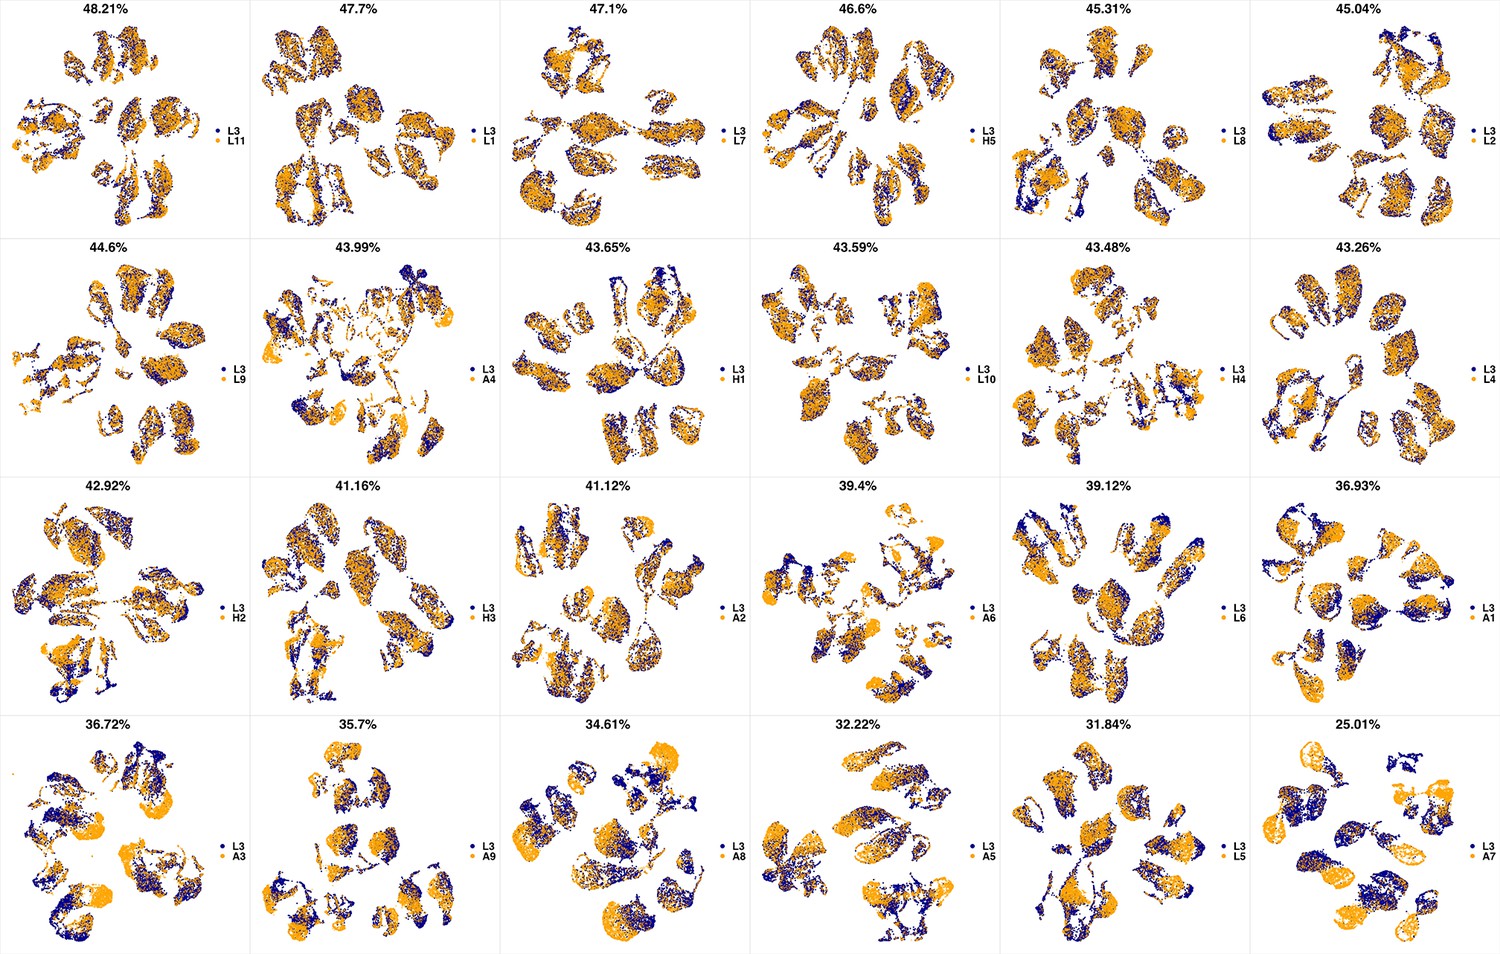
Appendix 1—figure 18

UMAP projections of L3 sample against all other patient samples.
From top left to bottom right, the similarity measured by compaRe decreases as the degree of overlap decreases and the number of exclusive cell populations increases.
Appendix 1—figure 19
UMAP projections of L4 sample against all other patient samples.
From top left to bottom right, the similarity measured by compaRe decreases as the degree of overlap decreases and the number of exclusive cell populations increases.
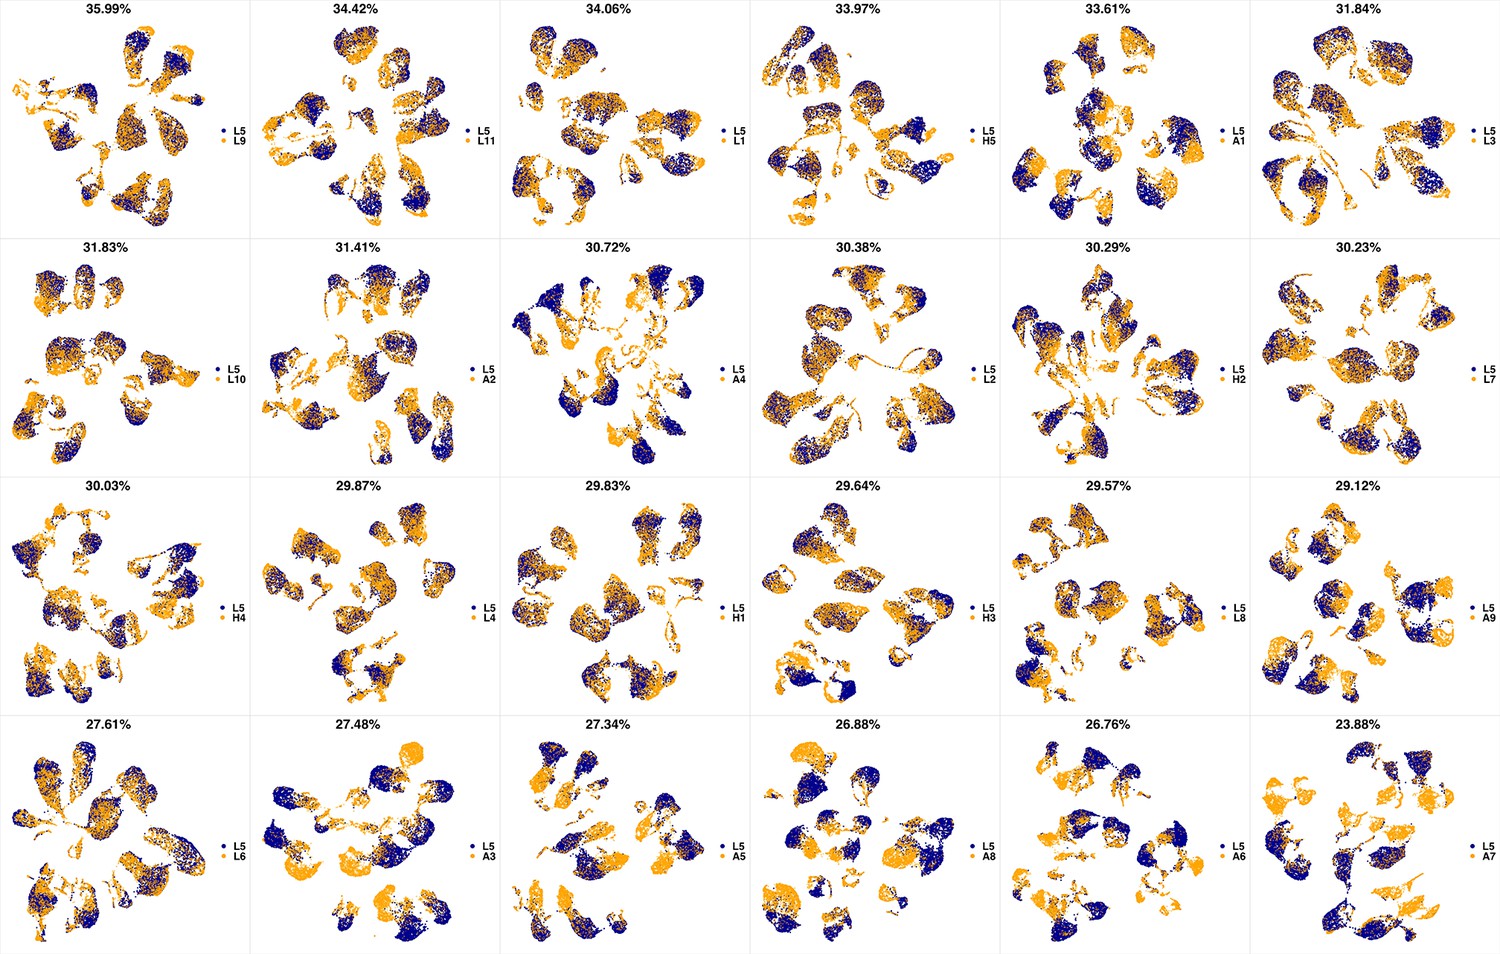
Appendix 1—figure 20
UMAP projections of L5 sample against all other patient samples.
From top left to bottom right, the similarity measured by compaRe decreases as the degree of overlap decreases and the number of exclusive cell populations increases.
Appendix 1—figure 21
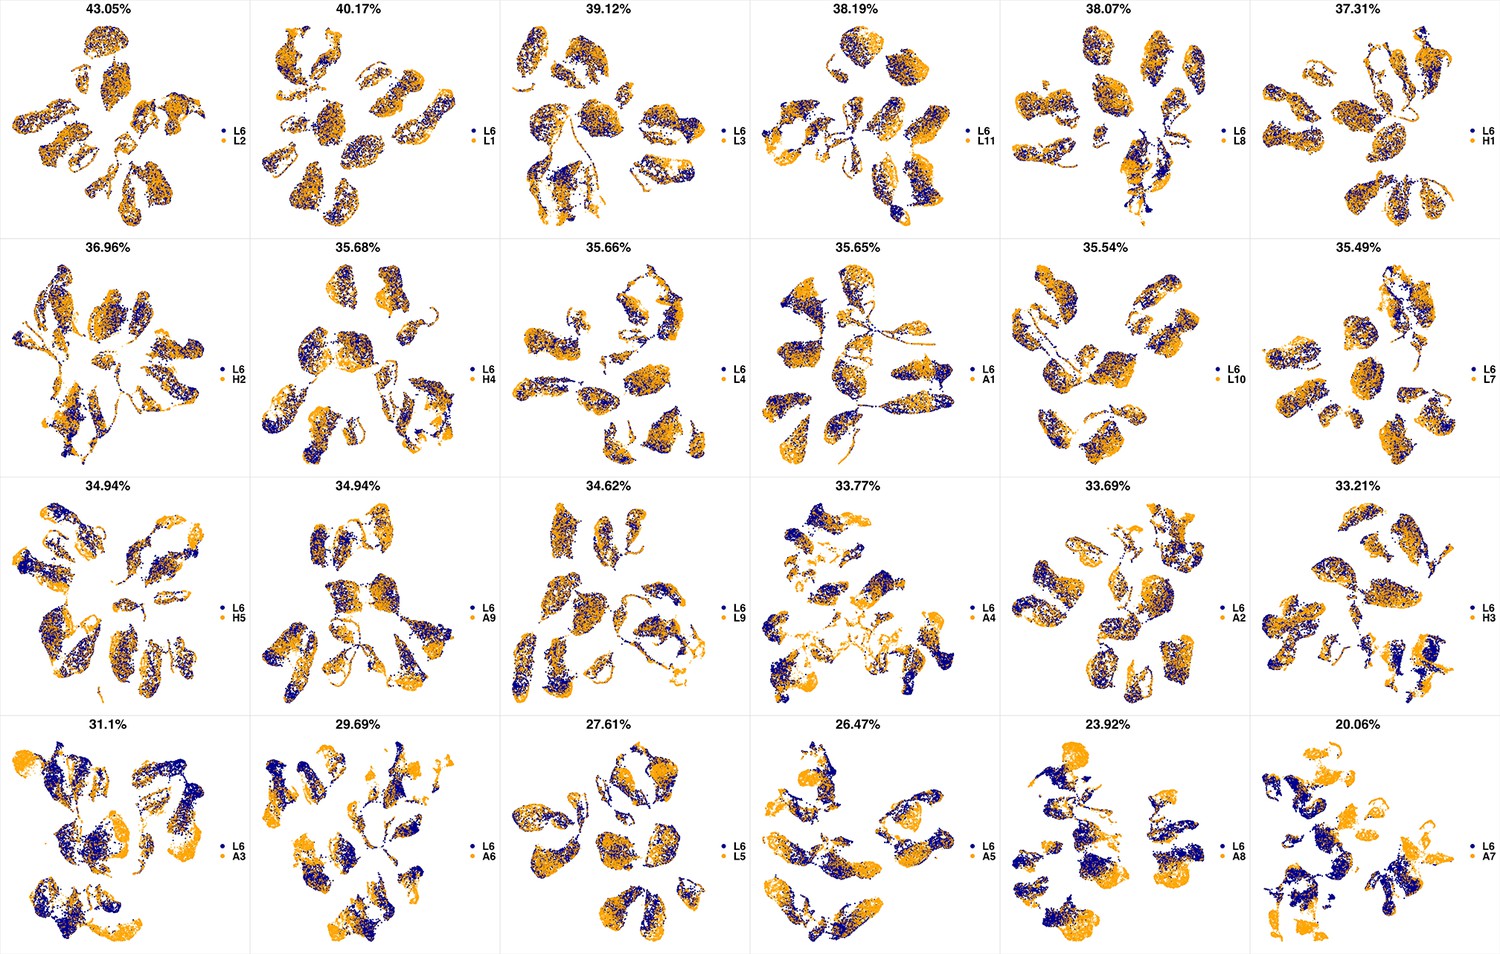
UMAP projections of L6 sample against all other patient samples.
From top left to bottom right, the similarity measured by compaRe decreases as the degree of overlap decreases and the number of exclusive cell populations increases.
Appendix 1—figure 22
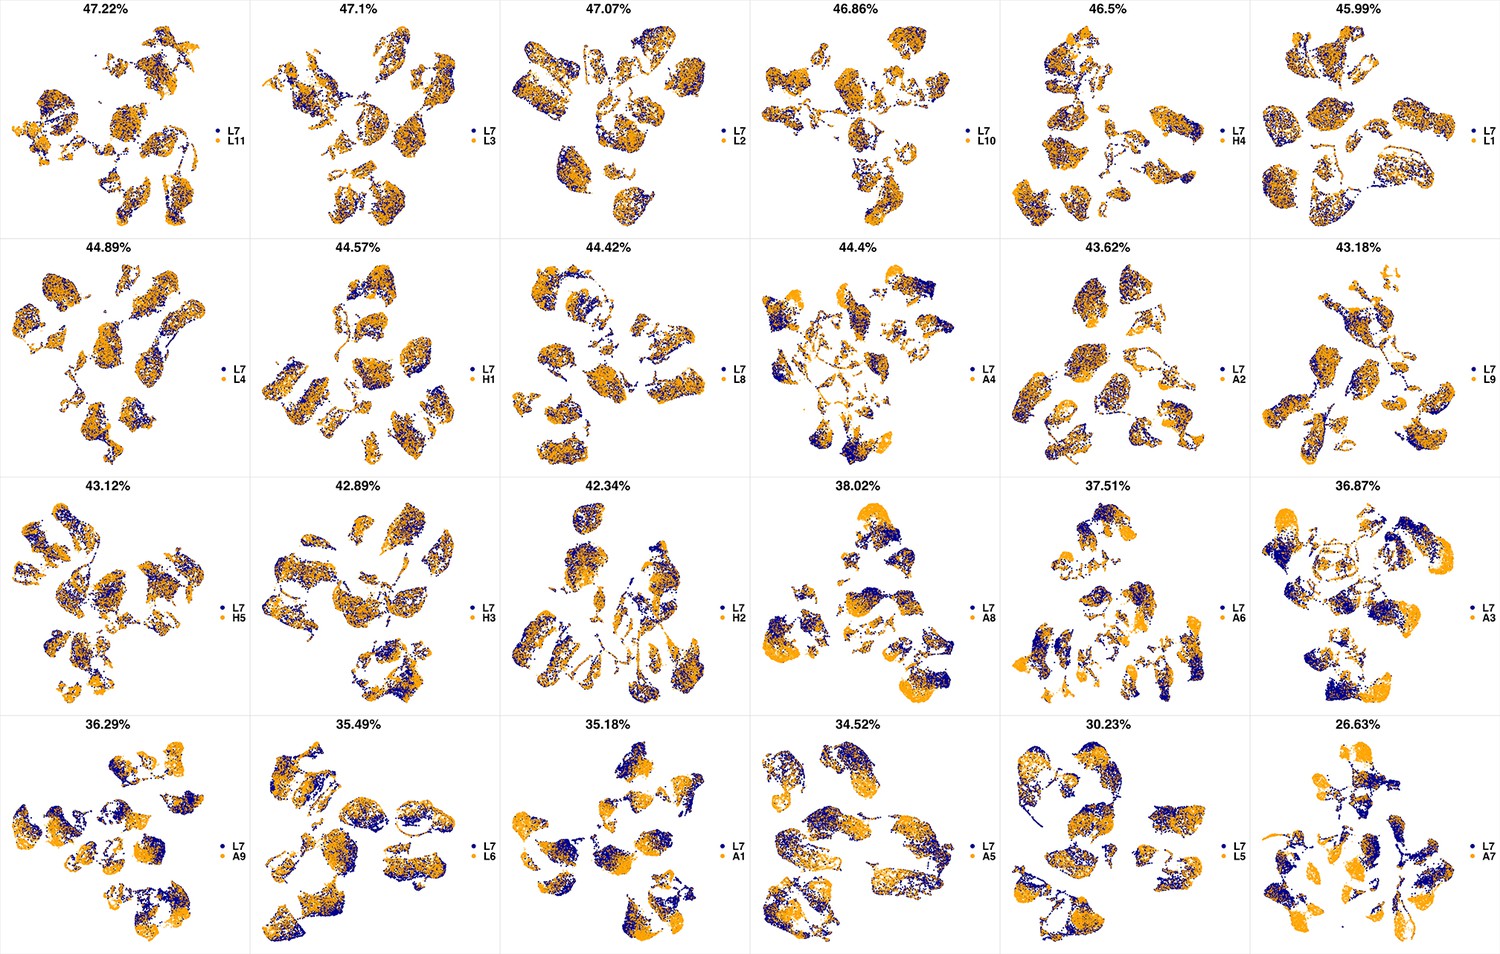
UMAP projections of L7 sample against all other patient samples.
From top left to bottom right, the similarity measured by compaRe decreases as the degree of overlap decreases and the number of exclusive cell populations increases.
Appendix 1—figure 23
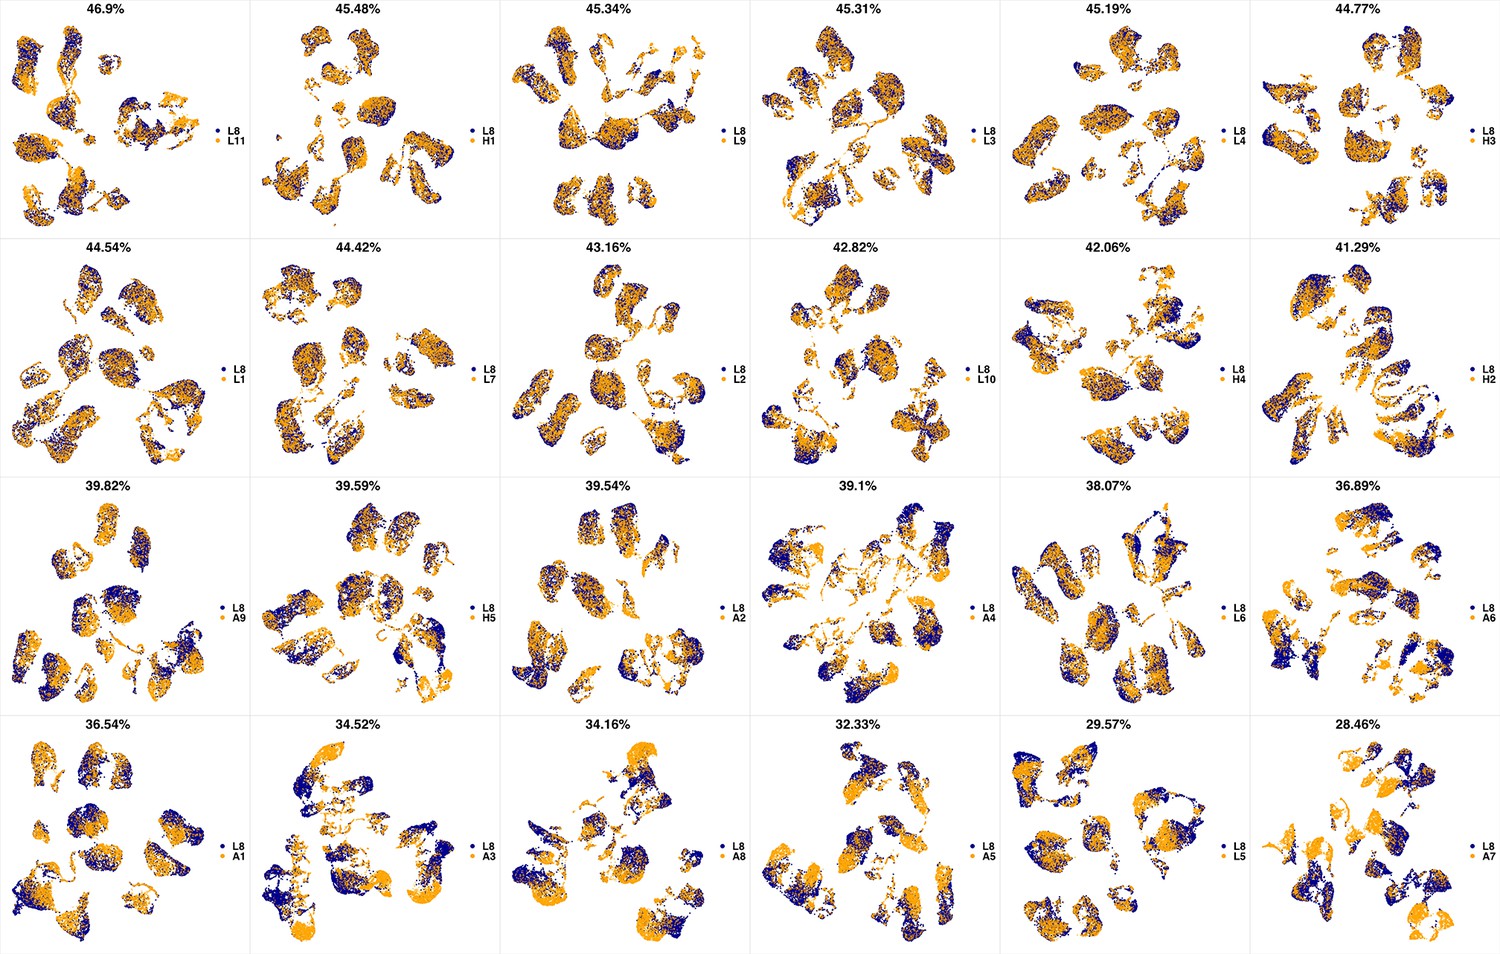
UMAP projections of L8 sample against all other patient samples.
From top left to bottom right, the similarity measured by compaRe decreases as the degree of overlap decreases and the number of exclusive cell populations increases.
Appendix 1—figure 24

UMAP projections of L9 sample against all other patient samples.
From top left to bottom right, the similarity measured by compaRe decreases as the degree of overlap decreases and the number of exclusive cell populations increases.
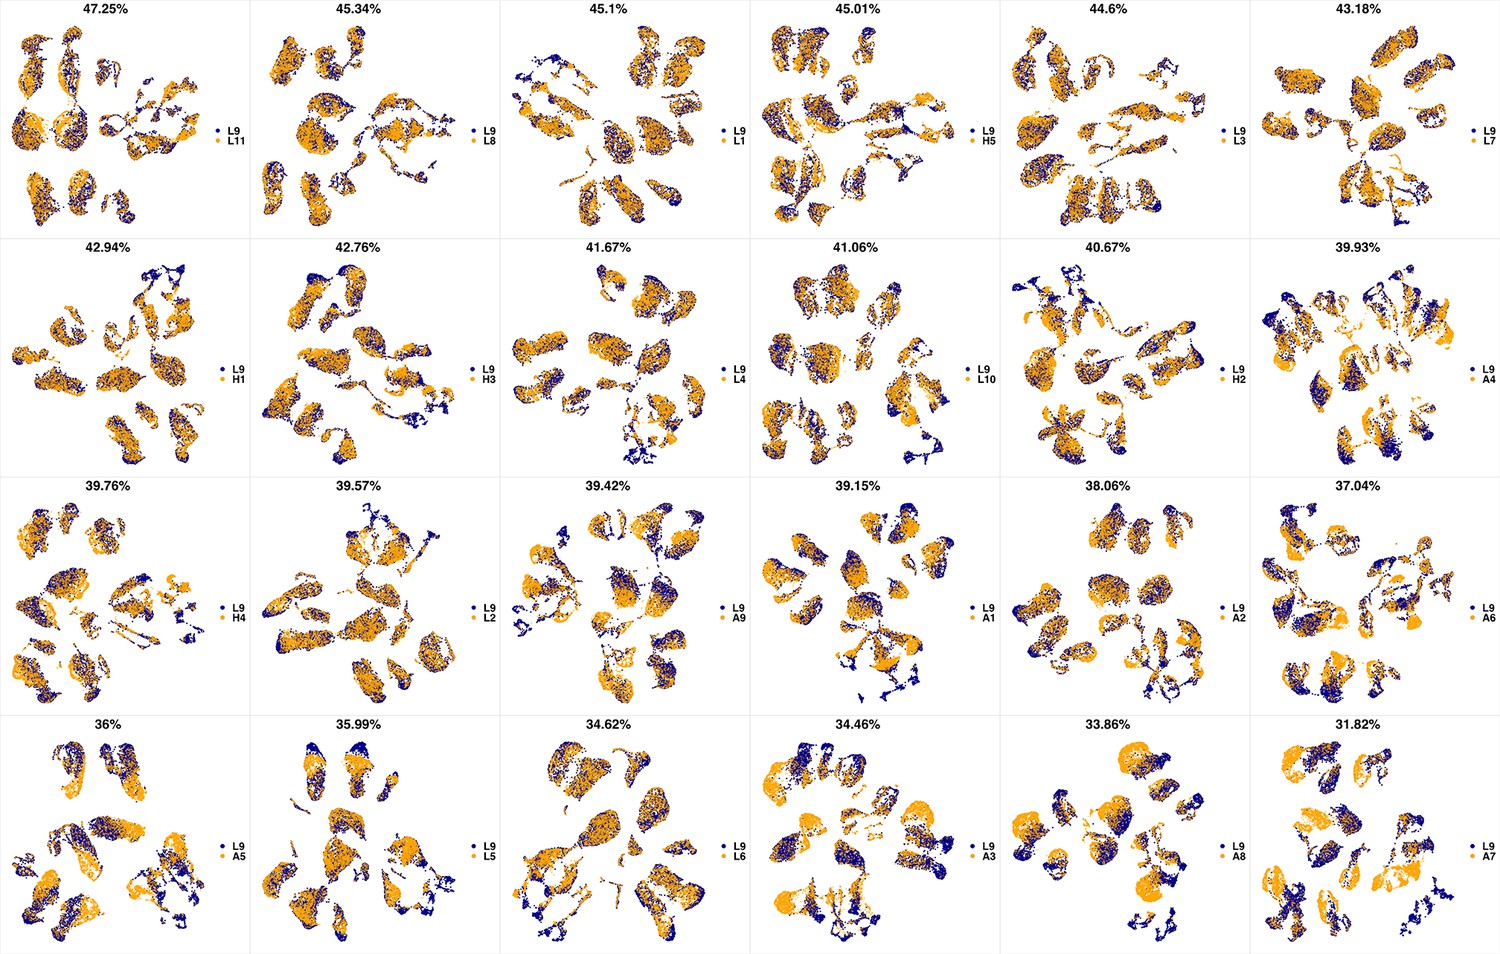
Appendix 1—figure 25
UMAP projections of L10 sample against all other patient samples.
From top left to bottom right, the similarity measured by compaRe decreases as the degree of overlap decreases and the number of exclusive cell populations increases.
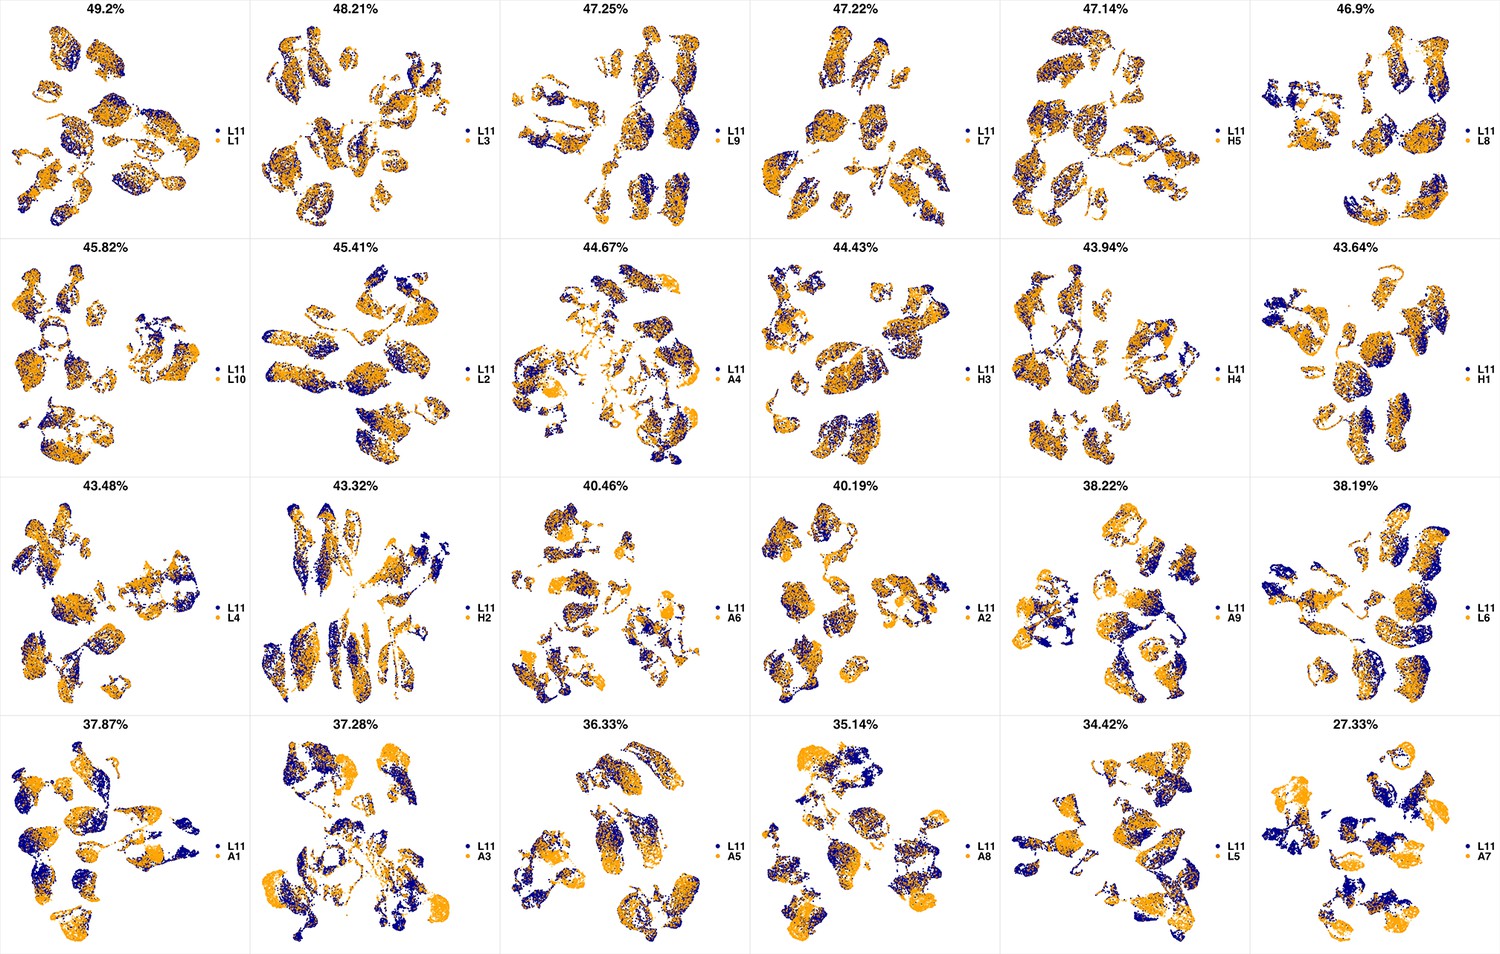
Appendix 1—figure 26
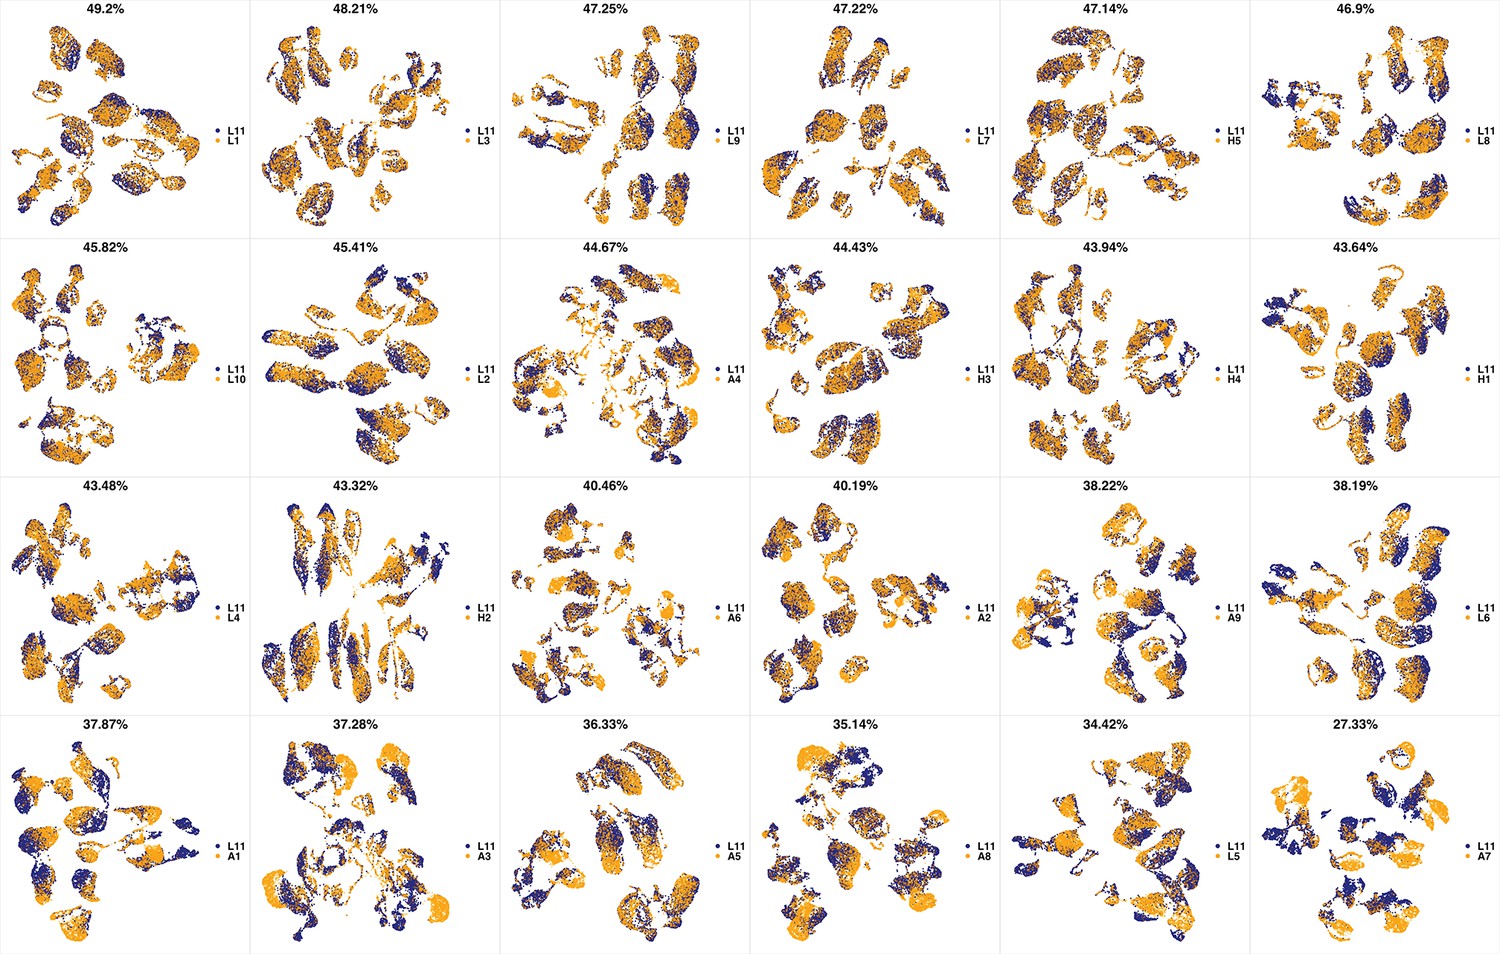
UMAP projections of L11 sample against all other patient samples.
From top left to bottom right, the similarity measured by compaRe decreases as the degree of overlap decreases and the number of exclusive cell populations increases.
Appendix 1—figure 27
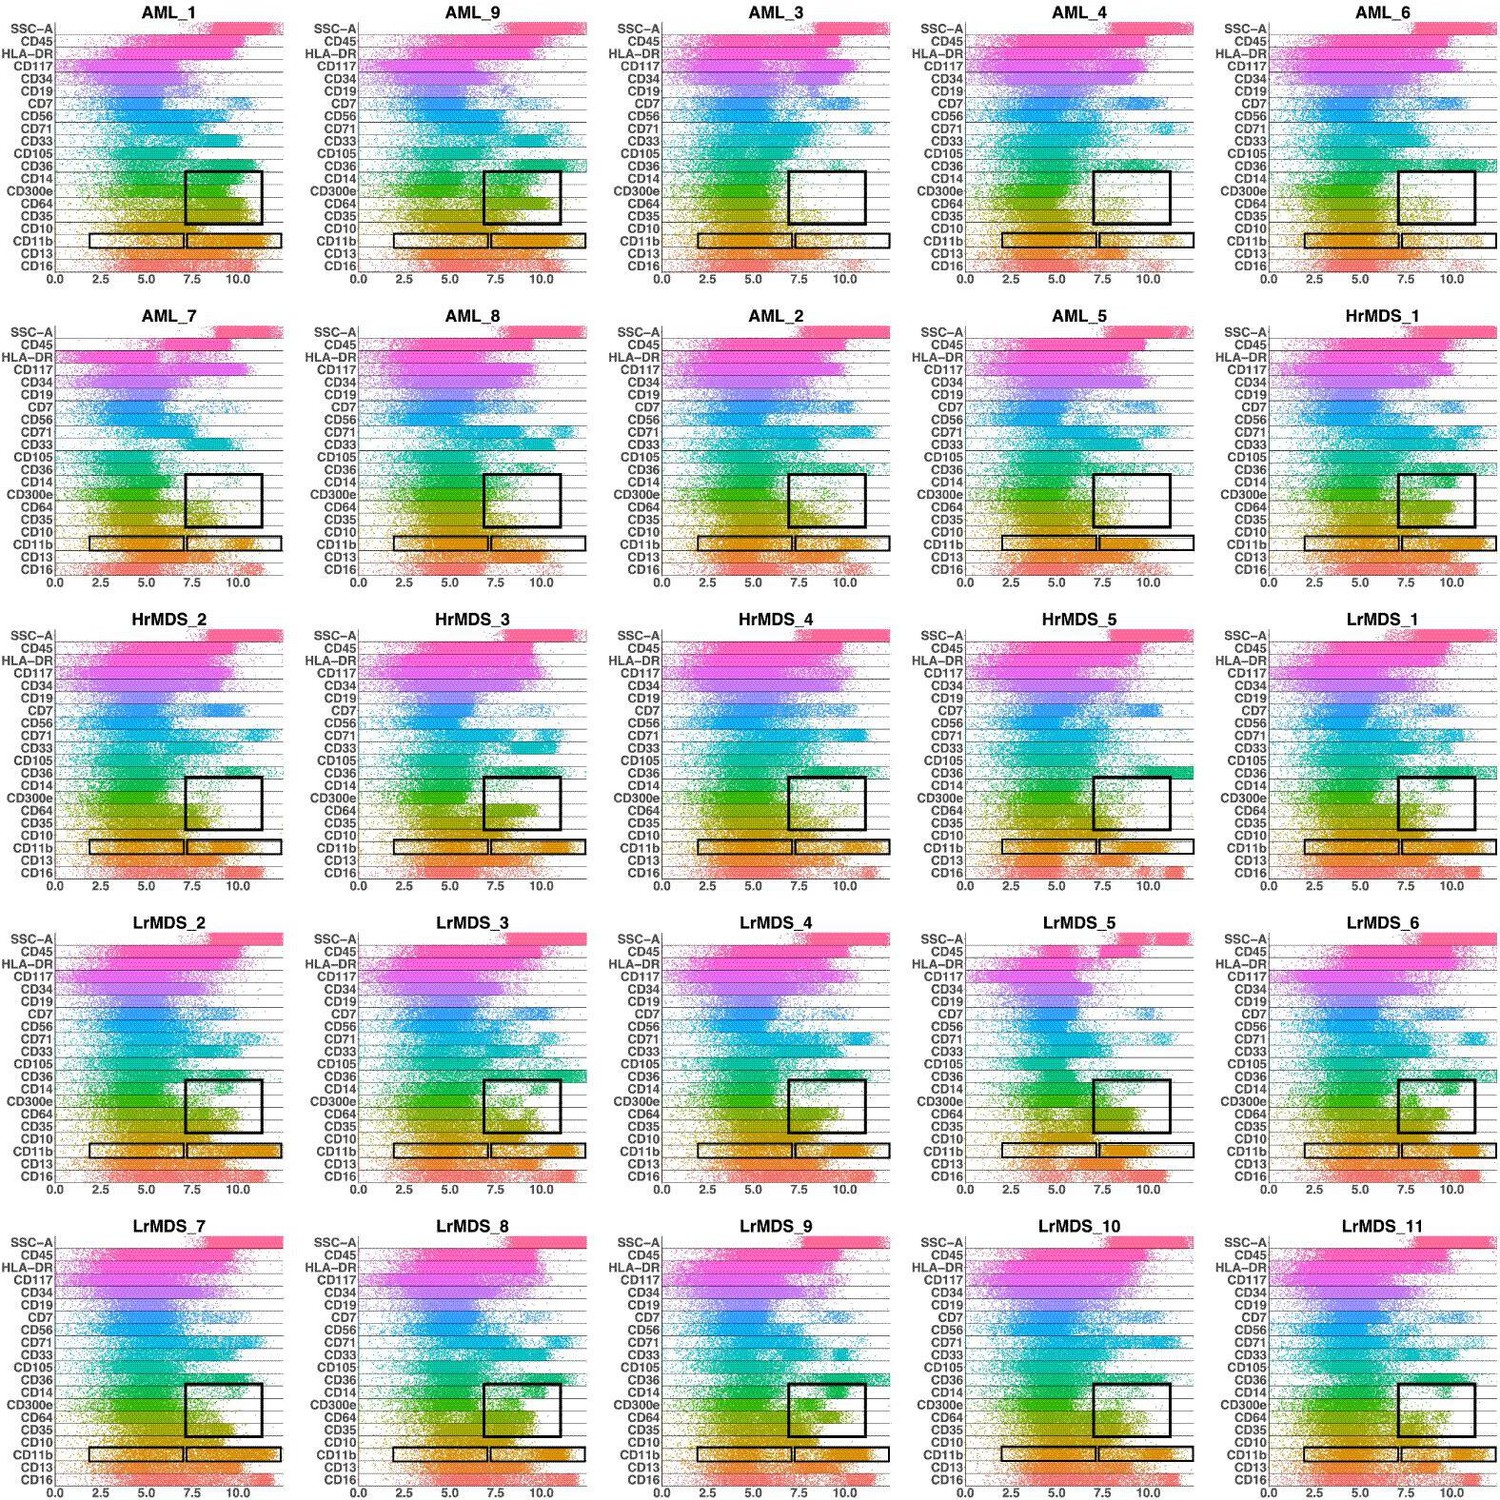
Band plots of AML and MDS patient samples.
The immunophenotype of each patient sample is shown in a multiparameter band-dot plot (HrMDS: higher-MDS, LrMDS: lower-MDS). Rectangles gate positive and/or negative populations of monocytic maturation markers as well as the CD11b marker.
Appendix 1—figure 28
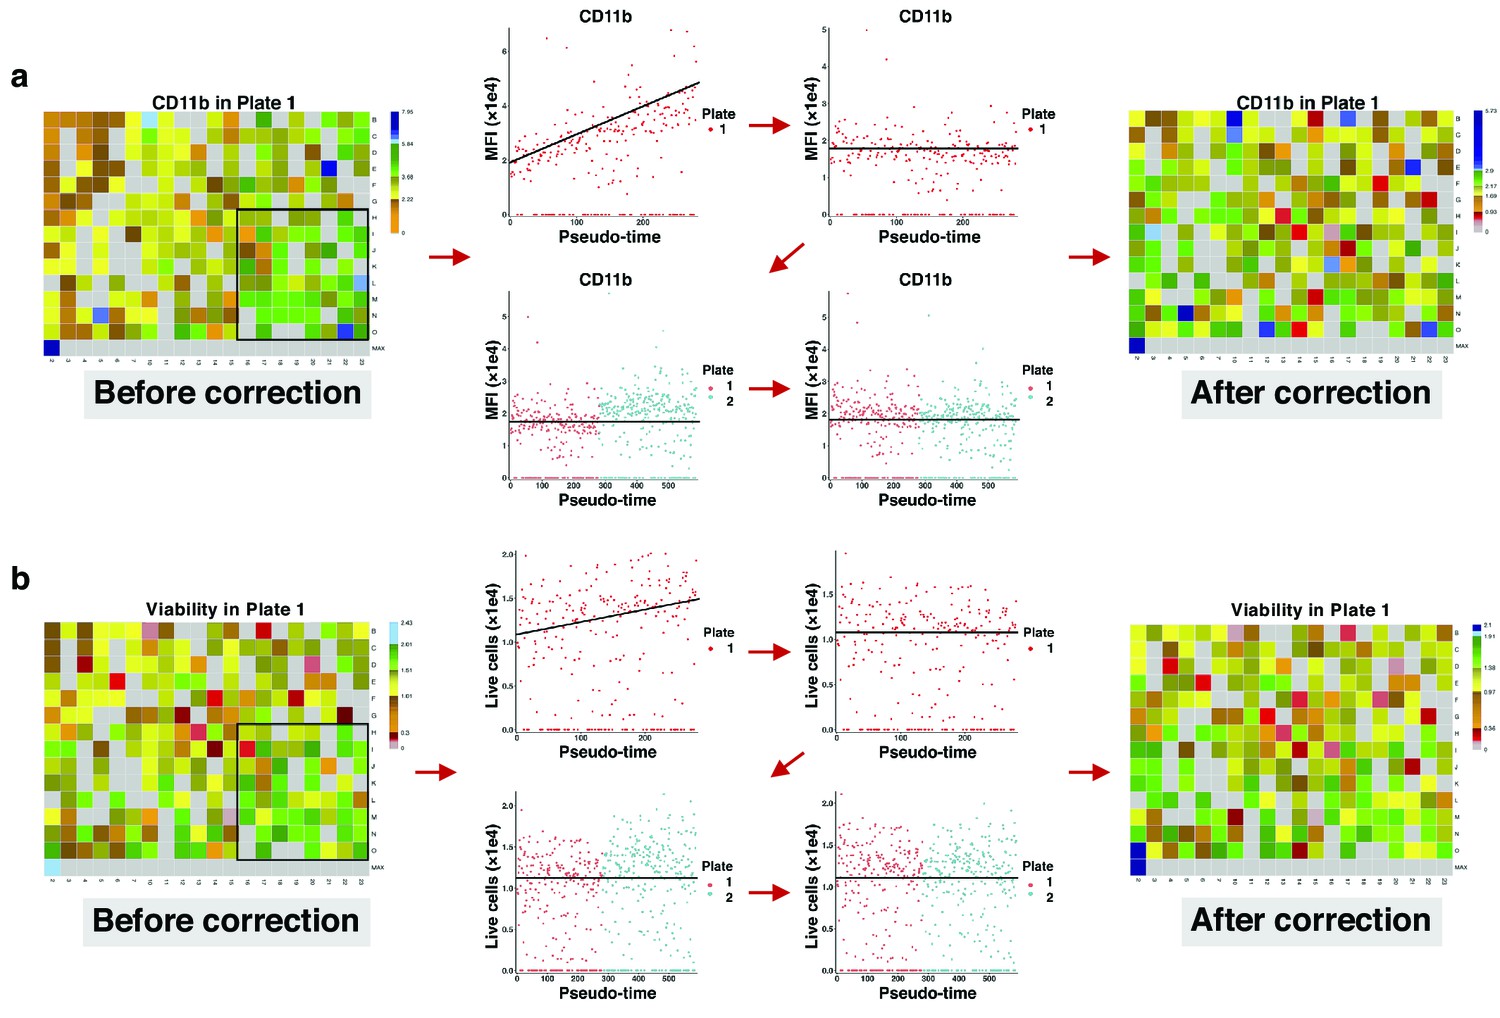
Correcting signal and cell viability drift.
(a) Intra- and inter-plate signal drift correction. Accumulation of green-blue tiles in the bottom right corner of the left heatmap shows signal drift in CD11b expression for drugs in plate 1. Sorting median expressions (MFIs) of wells into reading order (column wise left to right) reveals a linear slope. After correction, the slope becomes non-positive (intra-plate correction). Still, there are different baselines between the two plates. Matching median lines of corrected values of all plates correct for this bias (inter-plate correction). (b) Intra- and inter-plate cell viability correction. Accumulation of green tiles in the bottom right corner of the left heatmap shows cell viability drift (7-AAD marker). We follow similar steps with (a) for cell viability correction.
Appendix 1—figure 29
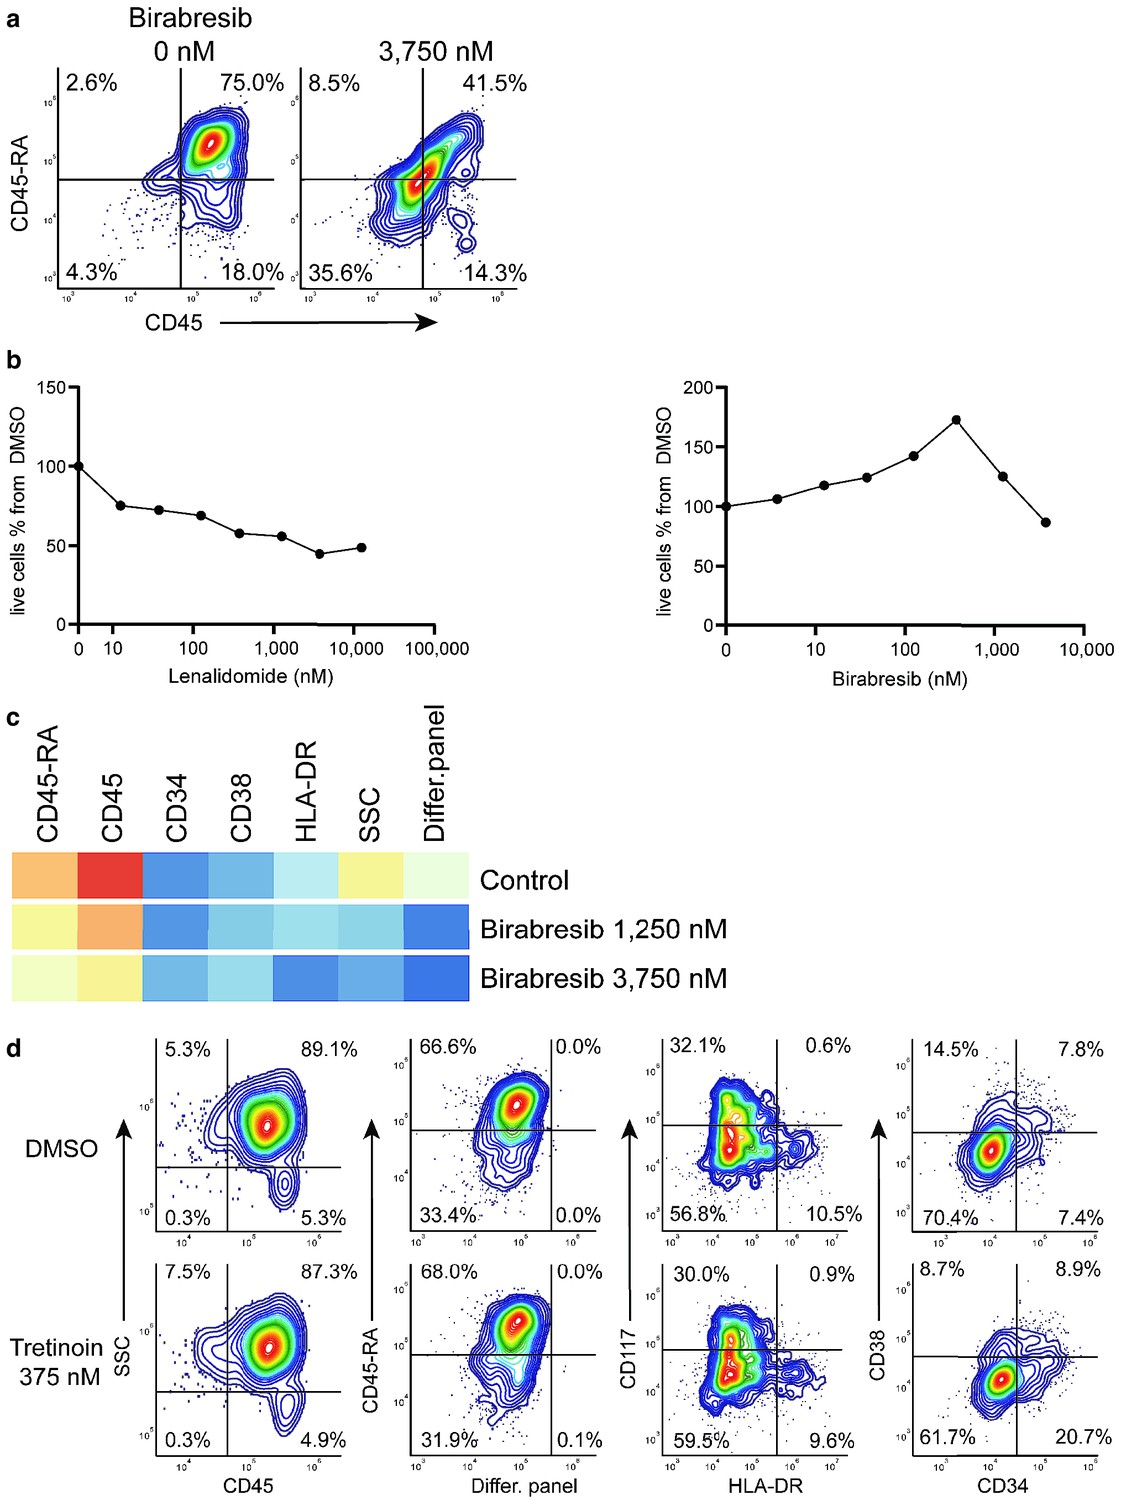
Birabresib treatment leads to loss of CD45 and CD45-RA expression without loss of live cell numbers.
(a) Birabresib response as density scatter plot, CD45 vs CD45-RA. (b) Count of live cells per different concentrations of lenalidomide and birabresib. (c) Heatmap of birabresib response in all marker channels. (d) Example of response group 3: density scatter plots of DMSO-control vs. tretinoin 375 nM in different marker channels.
Appendix 1—figure 30
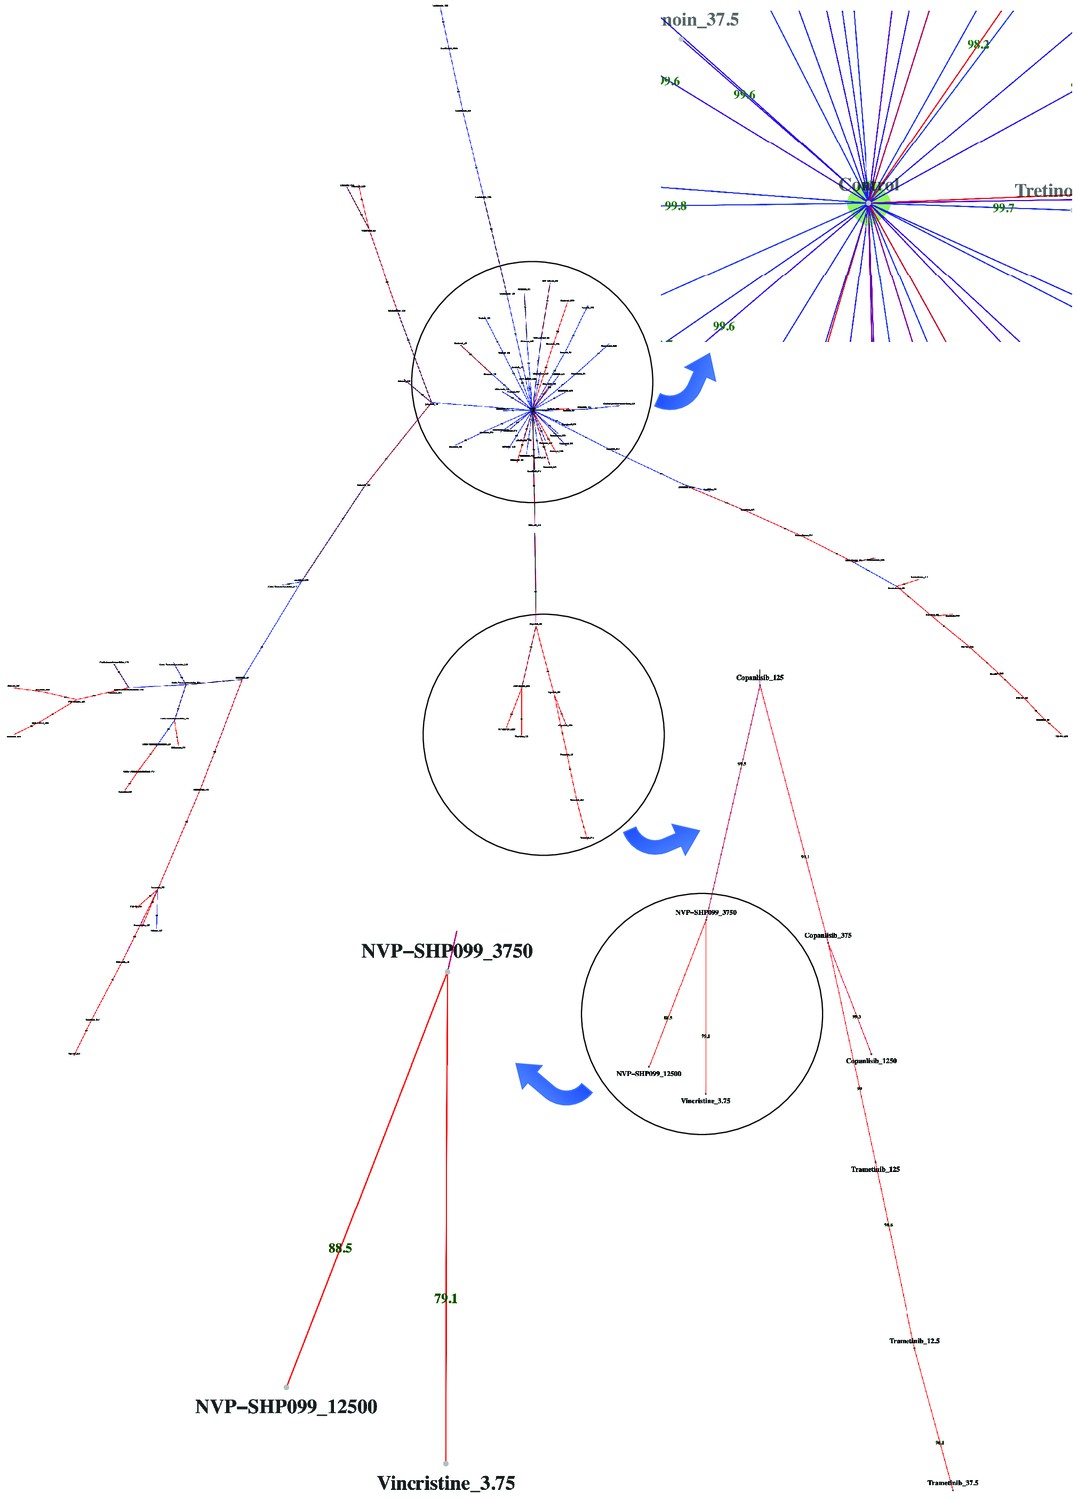
Dispersion graph.
The (maximum spanning) tree demonstrates the dispersion of tens of potent antineoplastic agents around the control node containing negative controls (DMSO) and impotent agents. The drug library was analyzed by high-throughput flow cytometry coupled with compaRe in an AML human sample. Edge color and label show the amount of similarity between the agents. Impotent drugs are those which were similar enough to negative controls for a cutoff inferred during clustering. As the tree branches and spreads, drugs with stronger potency, usually with higher doses, tend to lie farther from the control node. Using the graph, the investigator can easily pick potent agents such as hits. The graph may also be potentially used to investigate different paths for mechanism of action, leading to different branches.
Appendix 1—figure 31
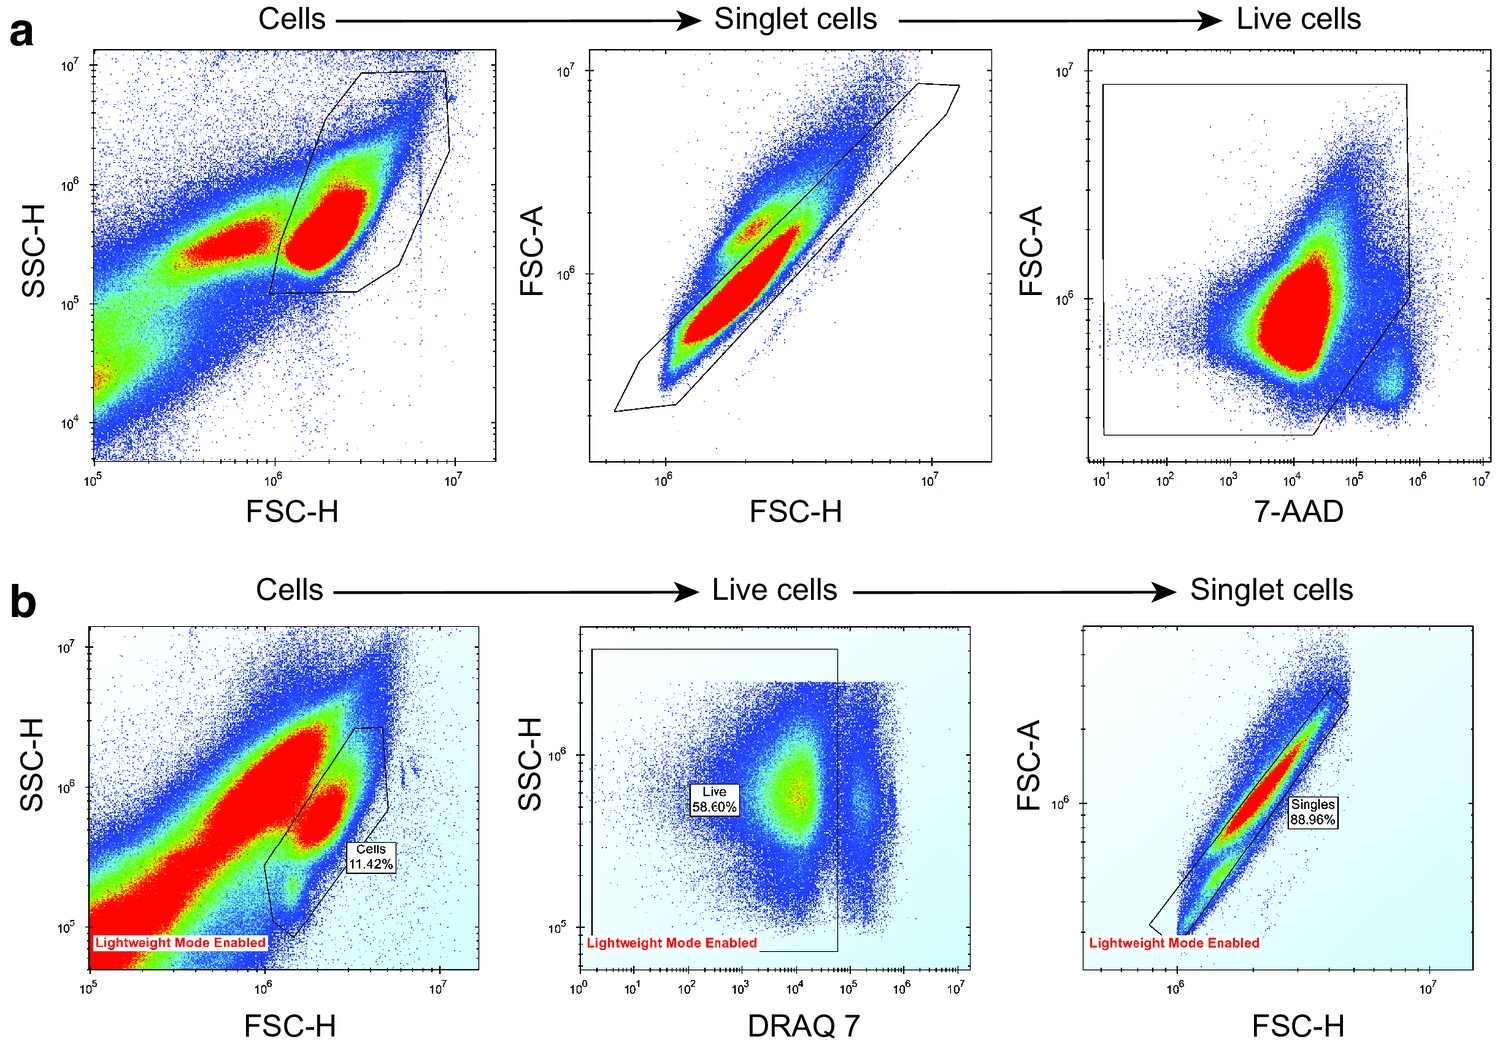
Removal of noise, dead cells and doublet cells from mouse and human AML sample drug screening data.
(a) AML mouse model drug screening. (b) AML human sample drug screening. Cells were separated from debris using a side scatter height (SSC-H) vs forward scatter height (FSC-H) plot. Singlet cells were determined from FSC-H vs forward scatter area (FSC-A) plot. Live cells were separated from dead cells using a dead-cell-labelling dye, either 7-AAD or DRAQ7.
Appendix 1—figure 32
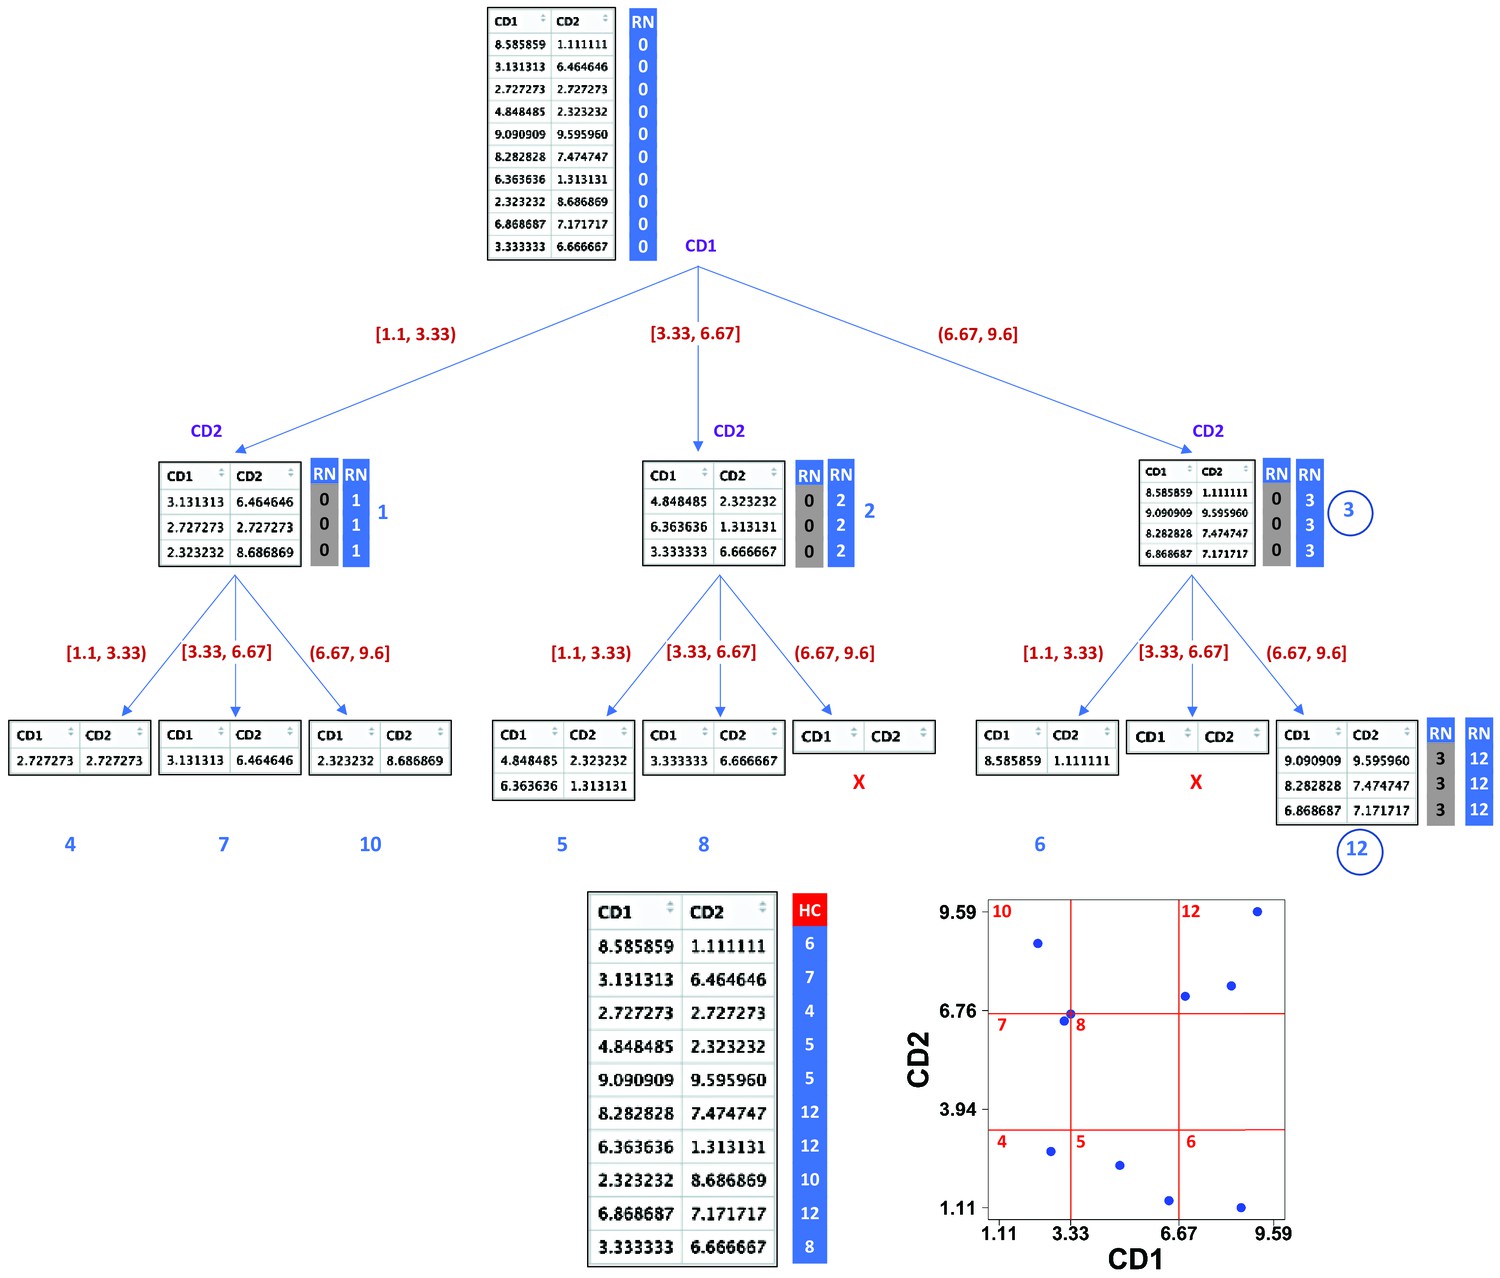
Demonstration of compaRe algorithm using a 2-dimensional table.
It first forms an abstract square grid (red) encompassing all the data points within the range (1.1, 9.6). At the top level, all the cells (table rows) are in the region number (RN) 0. First iteration divides the first dimension formed by CD1 marker into 3 ( = ) subsets. Assuming a left-first numbering rule, the RN column is dynamically updated (blue column) for each subset using some information such as current RN (grey column), current dimension and possible number of families and siblings behind. For instance, child node 12 has parent node 3, could have two siblings (node 6, node 9) and two families (parent 1, parent 2) behind, although children 11 and 9 were never born as marked with ☓. Final leaves are called hypercubes (HCs). The corresponding grid on the biplot demonstrates that two regions which were devoid of data points have not been assigned any hypercube. For comparing two samples, they are first jointly normalized between a range. The tree graph is just for better visualization and will not be implemented.
Additional files
-
Supplementary file 1
EuroFlow antibody panel for AML and MDS.
- https://cdn.elifesciences.org/articles/73760/elife-73760-supp1-v2.xlsx
-
Supplementary file 2
Antibodies used by compaRe in the AML/MDS study.
- https://cdn.elifesciences.org/articles/73760/elife-73760-supp2-v2.xlsx
-
Supplementary file 3
Clinical reports of the patients in the AML/MDS study.
- https://cdn.elifesciences.org/articles/73760/elife-73760-supp3-v2.xlsx
-
Supplementary file 4
Drug panel of the AML mouse model study.
- https://cdn.elifesciences.org/articles/73760/elife-73760-supp4-v2.xlsx
-
Supplementary file 5
Drug clusters identified by compaRe in the AML mouse model study.
- https://cdn.elifesciences.org/articles/73760/elife-73760-supp5-v2.xlsx
-
Supplementary file 6
Mechanism of action of the response group one in Figure 5c.
- https://cdn.elifesciences.org/articles/73760/elife-73760-supp6-v2.xlsx
-
Supplementary file 7
Drug panel of the AML human sample study.
- https://cdn.elifesciences.org/articles/73760/elife-73760-supp7-v2.xlsx
-
Supplementary file 8
Drug clusters identified by compaRe in the AML human sample study.
- https://cdn.elifesciences.org/articles/73760/elife-73760-supp8-v2.xlsx
-
Supplementary file 9
Antibodies used by compaRe in the AML mouse model study.
- https://cdn.elifesciences.org/articles/73760/elife-73760-supp9-v2.xlsx
-
Supplementary file 10
Antibodies used by compaRe in the AML human model study.
- https://cdn.elifesciences.org/articles/73760/elife-73760-supp10-v2.xlsx
-
Transparent reporting form
- https://cdn.elifesciences.org/articles/73760/elife-73760-transrepform1-v2.docx
Download links
A two-part list of links to download the article, or parts of the article, in various formats.
Downloads (link to download the article as PDF)
Open citations (links to open the citations from this article in various online reference manager services)
Cite this article (links to download the citations from this article in formats compatible with various reference manager tools)
Comprehensive and unbiased multiparameter high-throughput screening by compaRe finds effective and subtle drug responses in AML models
eLife 11:e73760.
https://doi.org/10.7554/eLife.73760


