In vivo MRI is sensitive to remyelination in a nonhuman primate model of multiple sclerosis
- Translational Neuroradiology Section, Laboratory of Functional and Molecular Imaging, National Institute of Neurological Disorders and Stroke, National Institutes of Health, United States
- Department of Neurology and Neurological Sciences, Stanford University, United States
- Department of Neurobiology, University of Pittsburgh, United States
- Section on Neural Function, National Institute of Mental Health, National Institutes of Health, United States
- Department of Neuroradiology, Clinical Neuroscience Center, University Hospital Zurich, University of Zurich, Switzerland
- Viral Immunology Section, Laboratory of Functional and Molecular Imaging, National Institute of Neurological Disorders and Stroke, National Institutes of Health, United States
- Cerebral Microcirculation Section, Laboratory of Functional and Molecular Imaging, National Institute of Neurological Disorders and Stroke, National Institutes of Health, United States
- Department of Radiology and Radiological Sciences, Uniformed Services University of the Health Sciences, United States
- Vertex Pharmaceuticals Incorporated, United States
- Neuroimaging Program, Department of Neurology, Cedars Sinai, United States
Figures
Figure 1

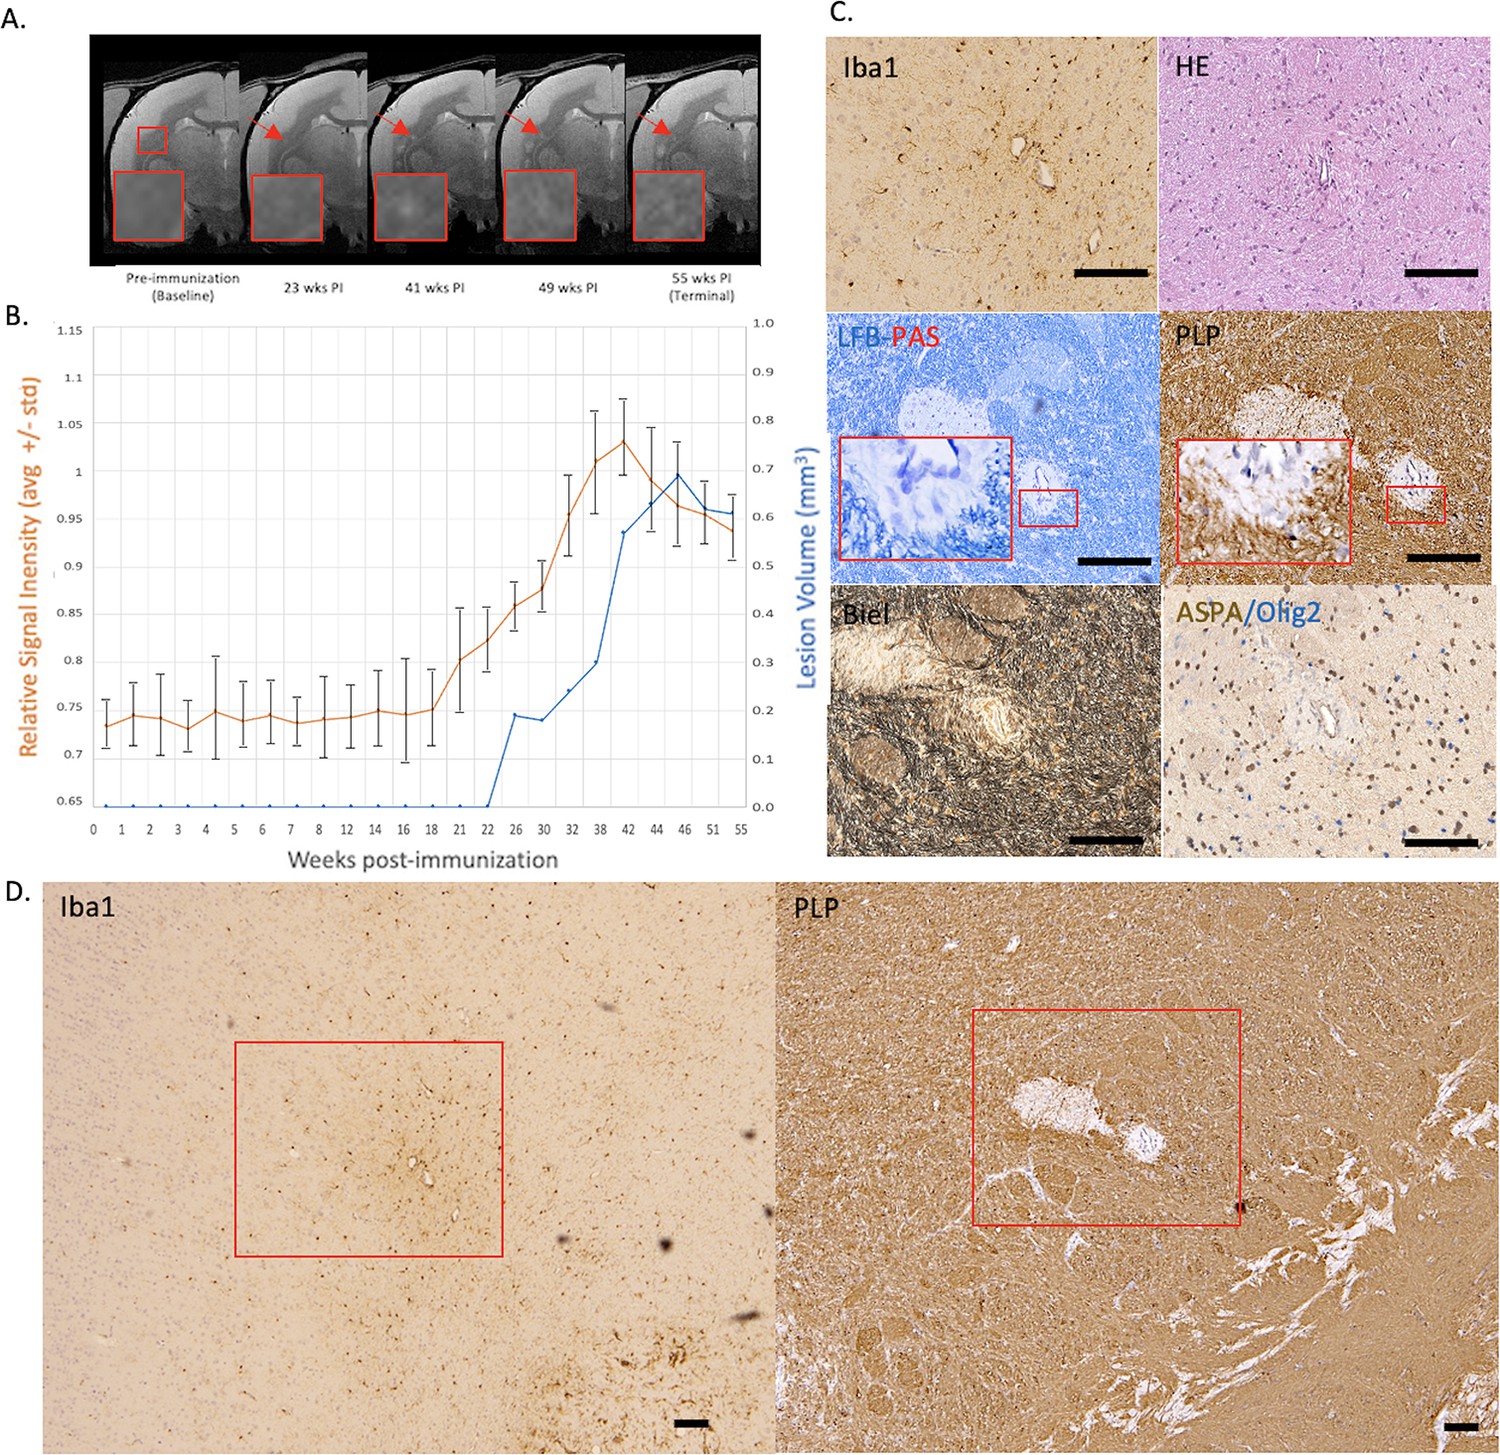
Example of an early active demyelinating EAE lesion with persistent hyperintensity on PDw MRI and active inflammatory demyelination on histopathology.
(A) In vivo PDw MRI acquired before EAE induction (baseline) and at various timepoints leading up to the terminal scan. Images were processed as described in Methods. Red arrows: focal white matter lesion first detected 16 weeks after immunization, which persisted through the terminal MRI 3 weeks later. Red boxes: location of magnified insets. (B) Temporal evolution of volume (blue line) and normalized PDw signal intensity (orange line) of the segmented lesion. (C) Histochemical panel magnification of the same lesion, demonstrating inflammation (Iba1+microglia/macrophage infiltration) and demyelination (loss of normal PLP staining). (D) Higher magnification images from the center of the lesion (red boxes in C) showing increased cellularity, loss of myelin lipid (LFB), partial loss of oligodendrocytes and their precursors (ASPA/Olig2), partial loss of axons (Biel), and edema (increased intercellular spaces). Scale bars = 200 µm. Hematoxylin counterstaining used for PLP and Iba1. Lesion selected from M#6. Abbreviations: EAE, experimental autoimmune encephalomyelitis; PDw, proton density-weighted; MRI, magnetic resonance imaging; PLP, proteolipid protein; LFB-PAS, Luxol fast blue–periodic acid Schiff; Biel, Bielschowsky; ASPA, aspartoacylase.
Figure 2
Example of a chronic, at least partially demyelinated EAE lesion core with long-lasting hyperintensity on serial PDw MRI and complete loss of myelin on histopathology.
(A) In vivo PDw MRI acquired before EAE induction (baseline) and at various timepoints leading up to the terminal scan. Images were processed as described in Methods. Red arrows: focal white matter lesion first detected 23 weeks after immunization, which persisted through the terminal MRI 32 weeks later. Red boxes: location of magnified insets. (B) Temporal evolution of volume (blue line) and normalized PDw signal intensity (orange line) of the segmented lesion. (C) Histochemical panel magnification of the same lesion, demonstrating mild inflammation (Iba1+ microglia/macrophage infiltration) as well as demyelination (loss of normal PLP staining). (D) Higher magnification images from the center of the lesion (red boxes in C) showing minimally increased cellularity, partial loss of myelin lipid (LFB), loss of oligodendrocytes and their precursors (ASPA/Olig2), and loss of axons (Biel). Scale bars = 200 µm. Hematoxylin counterstaining used for PLP and Iba1. Lesion selected from M#3. Abbreviations: EAE, experimental autoimmune encephalomyelitis; PDw, proton density-weighted; MRI, magnetic resonance imaging; PLP, proteolipid protein; LFB-PAS, Luxol fast blue–periodic acid Schiff; Biel, Bielschowsky; ASPA, aspartoacylase.
Figure 3
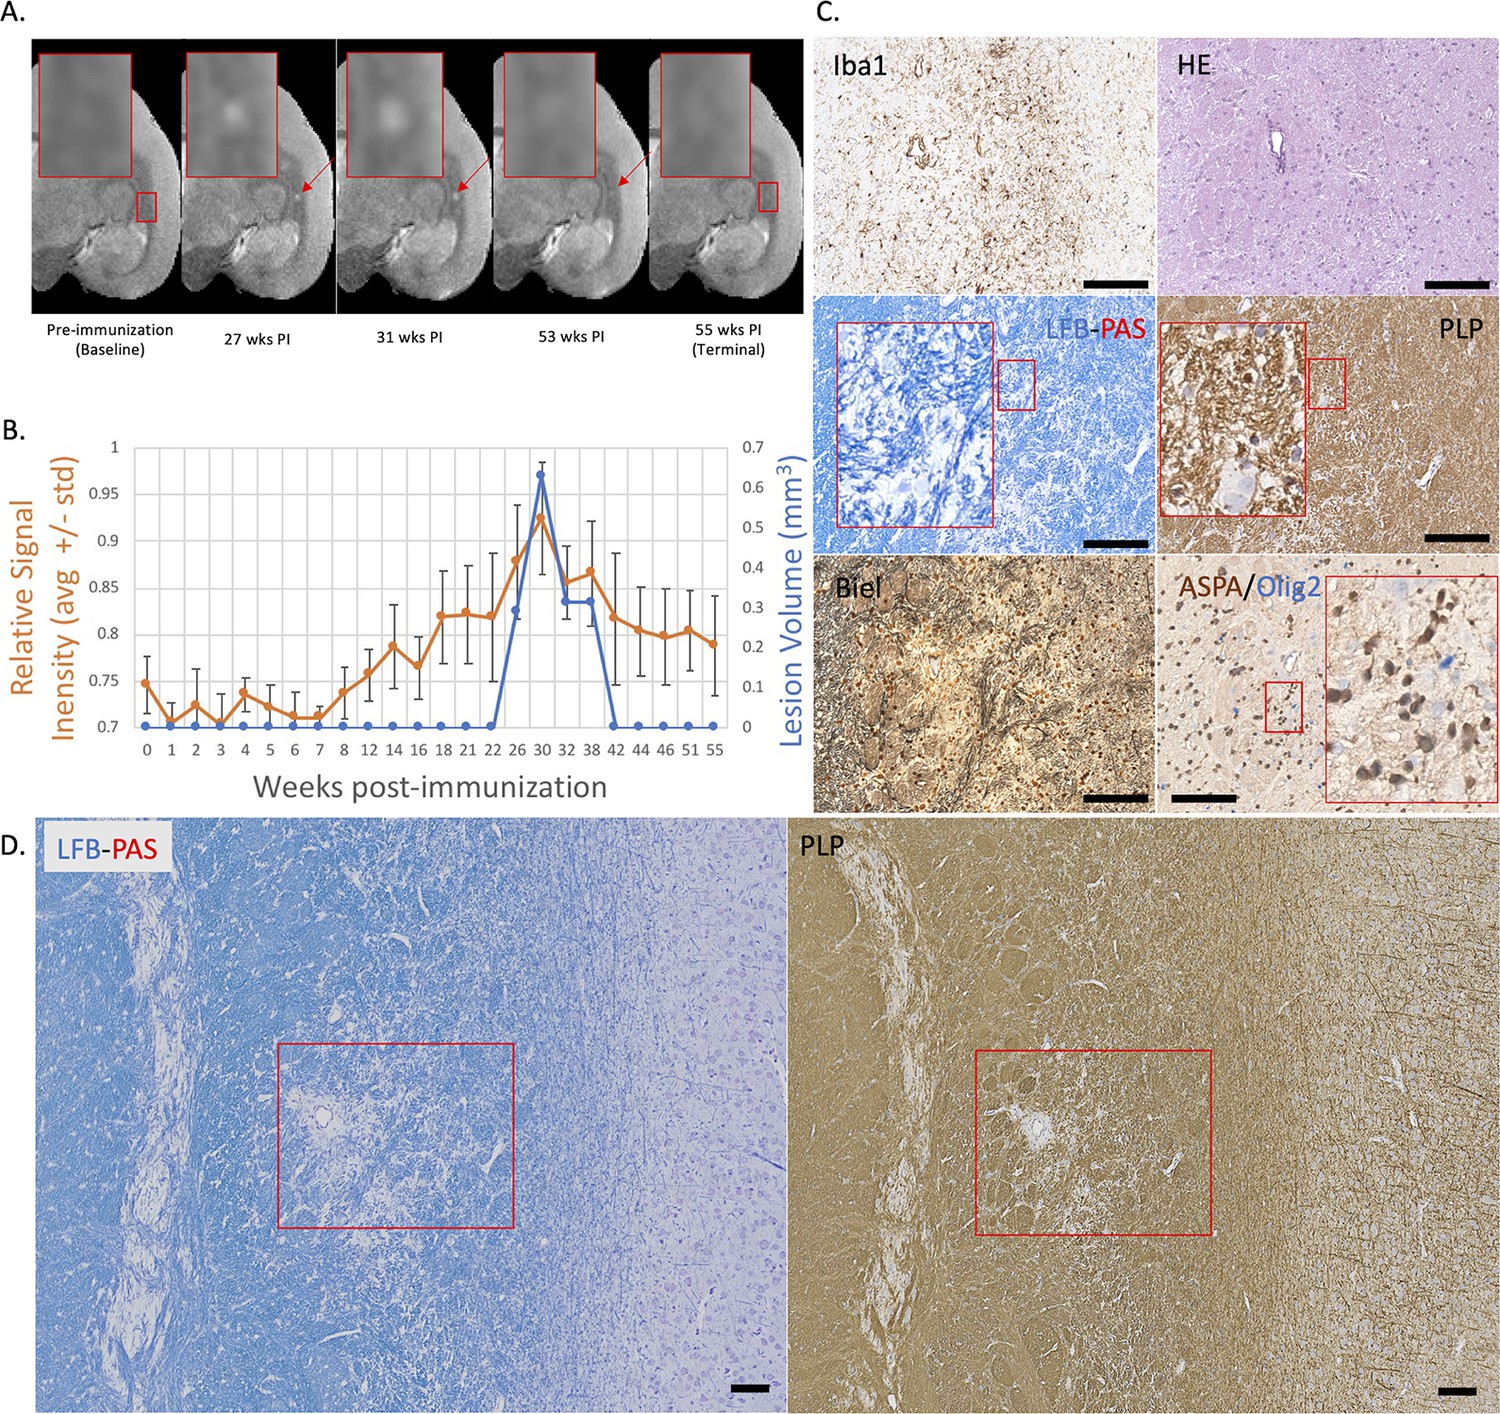
Example of a nearly complete remyelinated EAE lesion with initial hyperintensity that returned to isointensity on serial PDw MRI.
(A) In vivo PDw MRI acquired before EAE induction (baseline) and at various timepoints leading up to the terminal scan. Images were processed as described in Methods. Red arrows: focal white matter lesion first detected 27 weeks after immunization, which largely resolved on MRI and could not be reliably segmented on the terminal MRI 32 weeks later. Red boxes: location of magnified insets. (B) Temporal evolution of volume (blue line) and normalized PDw signal intensity (orange line) of the segmented lesion. (C) Histochemical panel magnification of the same lesion, demonstrating pale myelin lipid staining (LFB) and near-normal levels of myelin protein (PLP). (D) Higher magnification images from the center of the lesion (red boxes in C) showing minimal inflammation (Iba1), presence of oligodendrocytes and their precursors (ASPA/Olig2), and partial preservation of axons (Biel). Scale bars = 200 µm. Hematoxylin counterstaining used for PLP and Iba1. Lesion selected from M#3. Abbreviations: EAE, experimental autoimmune encephalomyelitis; PDw, proton density-weighted; MRI, magnetic resonance imaging; PLP, proteolipid protein; LFB-PAS, Luxol fast blue–periodic acid Schiff; Biel, Bielschowsky; ASPA, aspartoacylase.
Figure 4
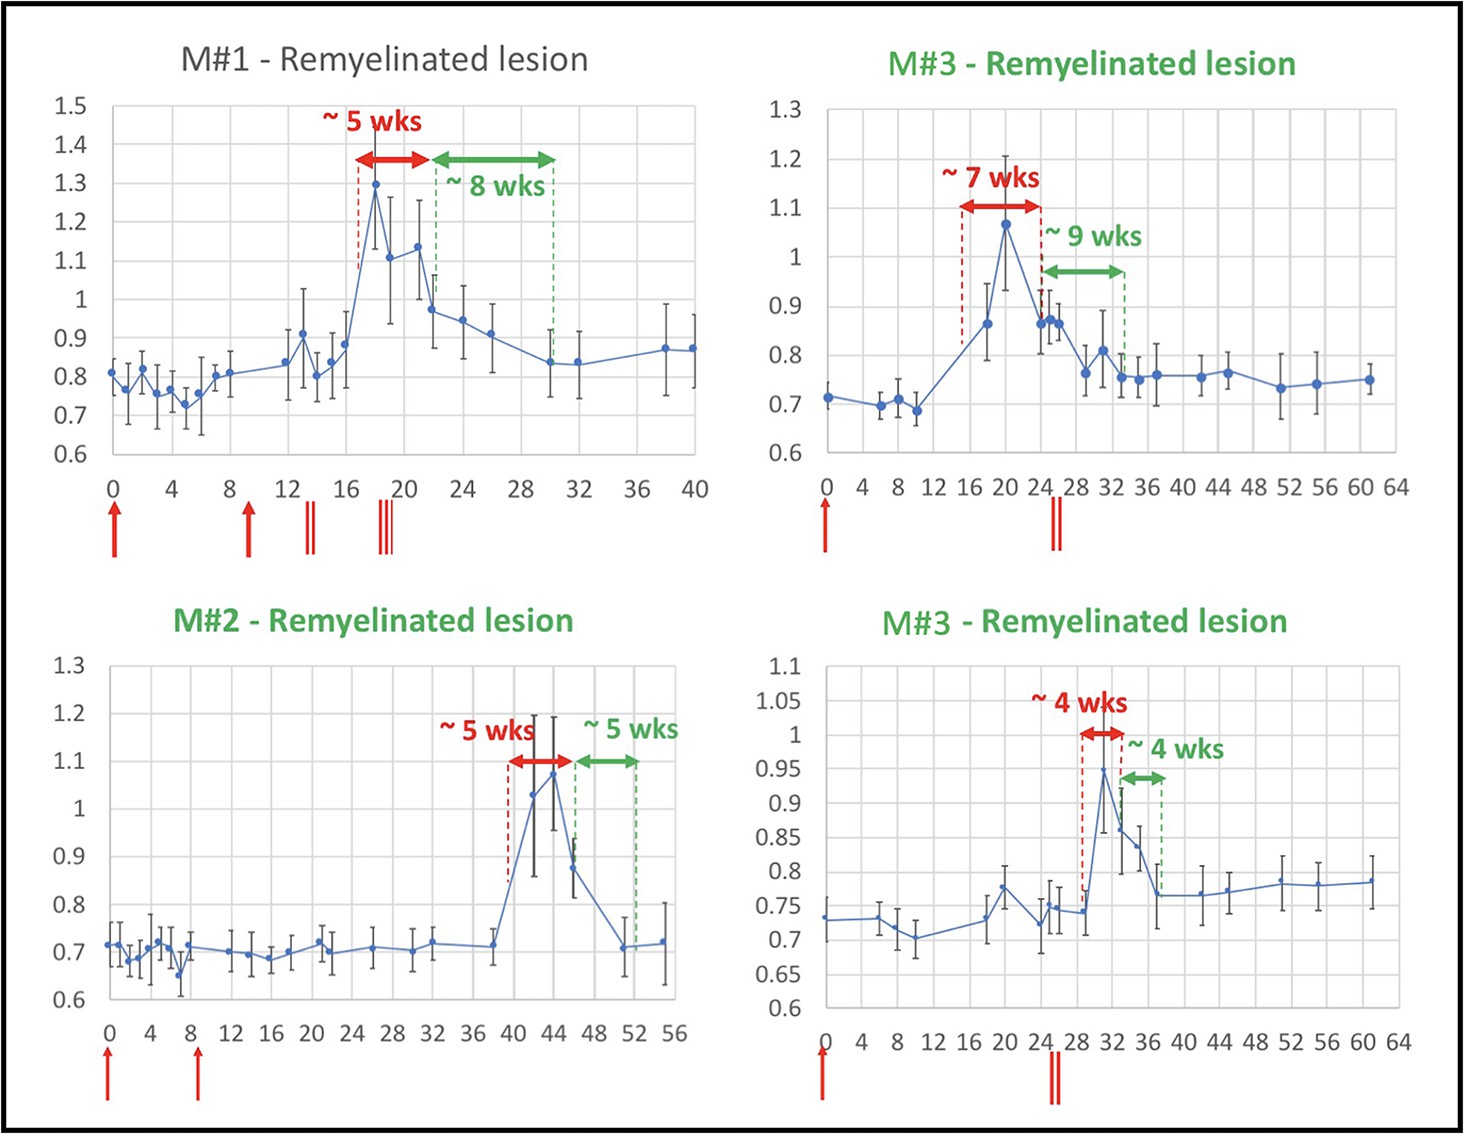
Evolution of in vivo PDw MRI signal intensity of remyelinating EAE lesions shows a typical 4- to 9-week time course of remyelination.
Vertical axis: mean PDw signal intensity relative to gray matter. Horizontal axis: weeks post-immunization. Blue line corresponds to mean normalized PDw signal intensity (with standard deviation) of the segmented lesion, relative to gray matter signal intensity, quantified in a region of interest drawn manually and located in the normal appearing white matter area before the lesion appeared and kept constant over time. Normal white matter displays an average normalized signal intensity of 0.65–0.75. Vertical red arrows indicate EAE immunization. Vertical red bars indicate days when corticosteroid treatments were administered (M#1 was treated twice). Horizontal red double arrows indicate the estimated period of demyelination. Horizontal green double arrows indicate the estimated period of remyelination based on the downward slope of intensity measurement, followed by plateauing of signal intensity drop. Green titles indicate that the lesion subtype was confirmed with histopathology. M# corresponds to animal number in Table 4. Abbreviations: PDw, proton density-weighted; EAE, experimental autoimmune encephalomyelitis; MRI, magnetic resonance imaging; M, marmoset; wks, weeks.
Figure 5
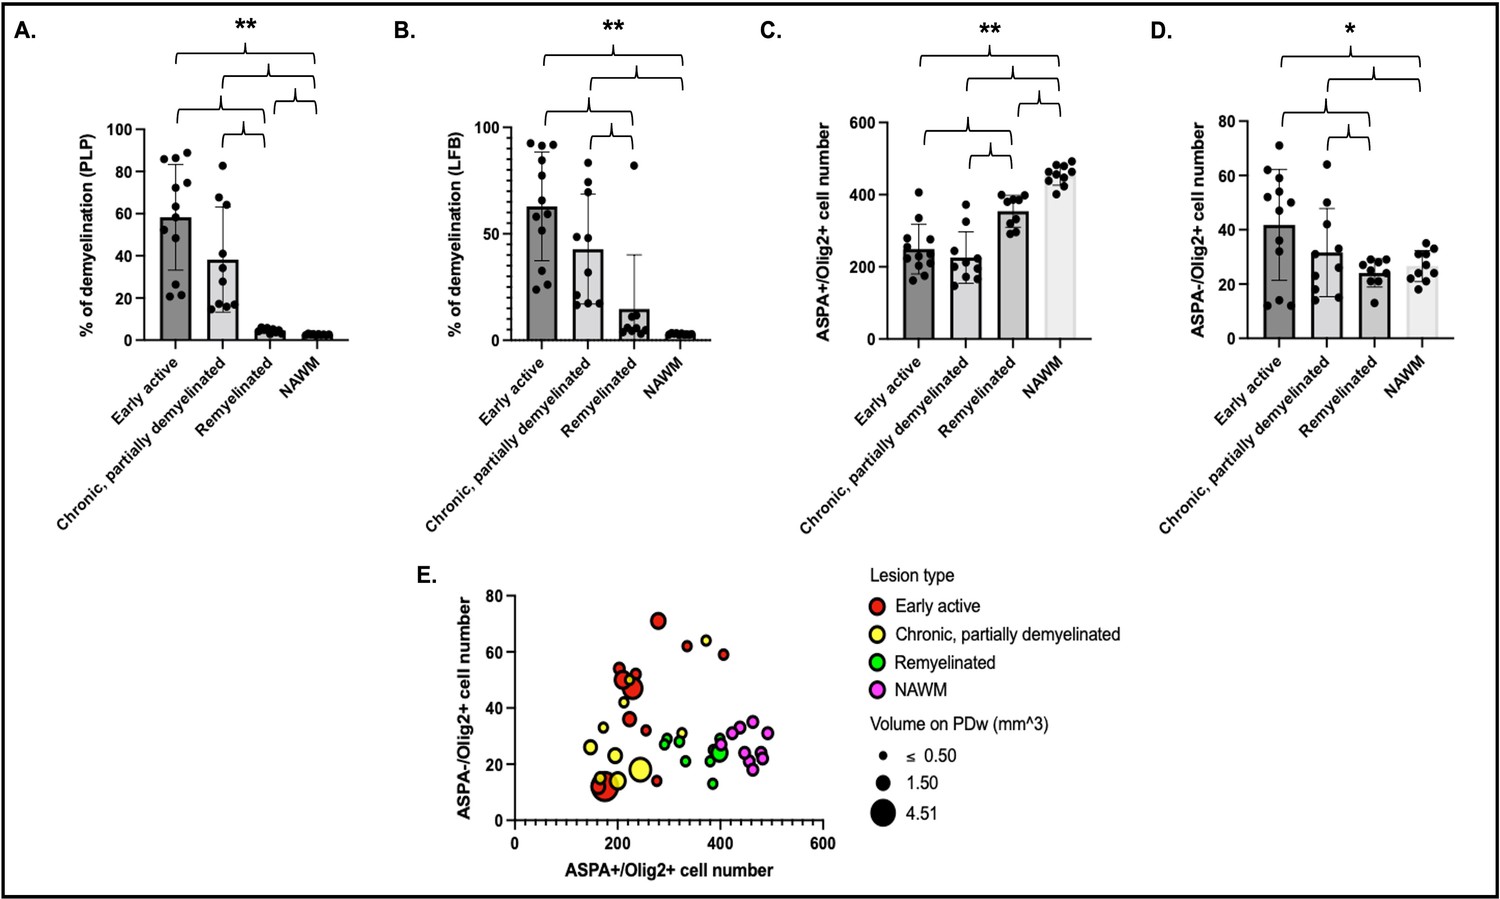
Histological quantification of myelin highlights different patterns across lesion categories and NAWM.
Cells were quantified in a region of interest of 1500 µm2 centered on each lesion core. Percentage of demyelination quantified for each lesion category and NAWM on PLP (A) and LFB (B). Number of ASPA and Olig2 double-positive oligodendrocytes (C) and ASPA negative, Olig2-positive OPC (D) in different lesion categories and NAWM. Data in A and B highlight more demyelination in acute and chronic lesions compared to remyelinated lesions or NAWM. Data in C and D highlight more mature oligodendrocytes in remyelinated lesions and NAWM compared to acute and chronic lesions, as well as more OPC in acute lesions compared to chronic lesions, remyelinated lesions, or NAWM. (E) Bubble plot of the 31 lesions and NAWM investigated with histopathology. Vertical axis: counts of ASPA- Olig2+ OPC. Horizontal axis: counts of ASPA+ Olig2+ oligodendrocytes. Bubble color: red; acute lesions, yellow; chronic lesions, green; remyelinated lesions, purple; NAWM. Bubble size: volume on PDw at the terminal scan in mm3. ANOVA: *p<0.05, **p<0.005. Abbreviations: NAWM, normal appearing white matter; PLP, proteolipid protein; LFB, Luxol fast blue; ASPA; aspartoacylase; ANOVA, analysis of variance; OPC, oligodendrocyte progenitor cells; PDw, proton density-weighted.
Figure 6 with 2 supplements
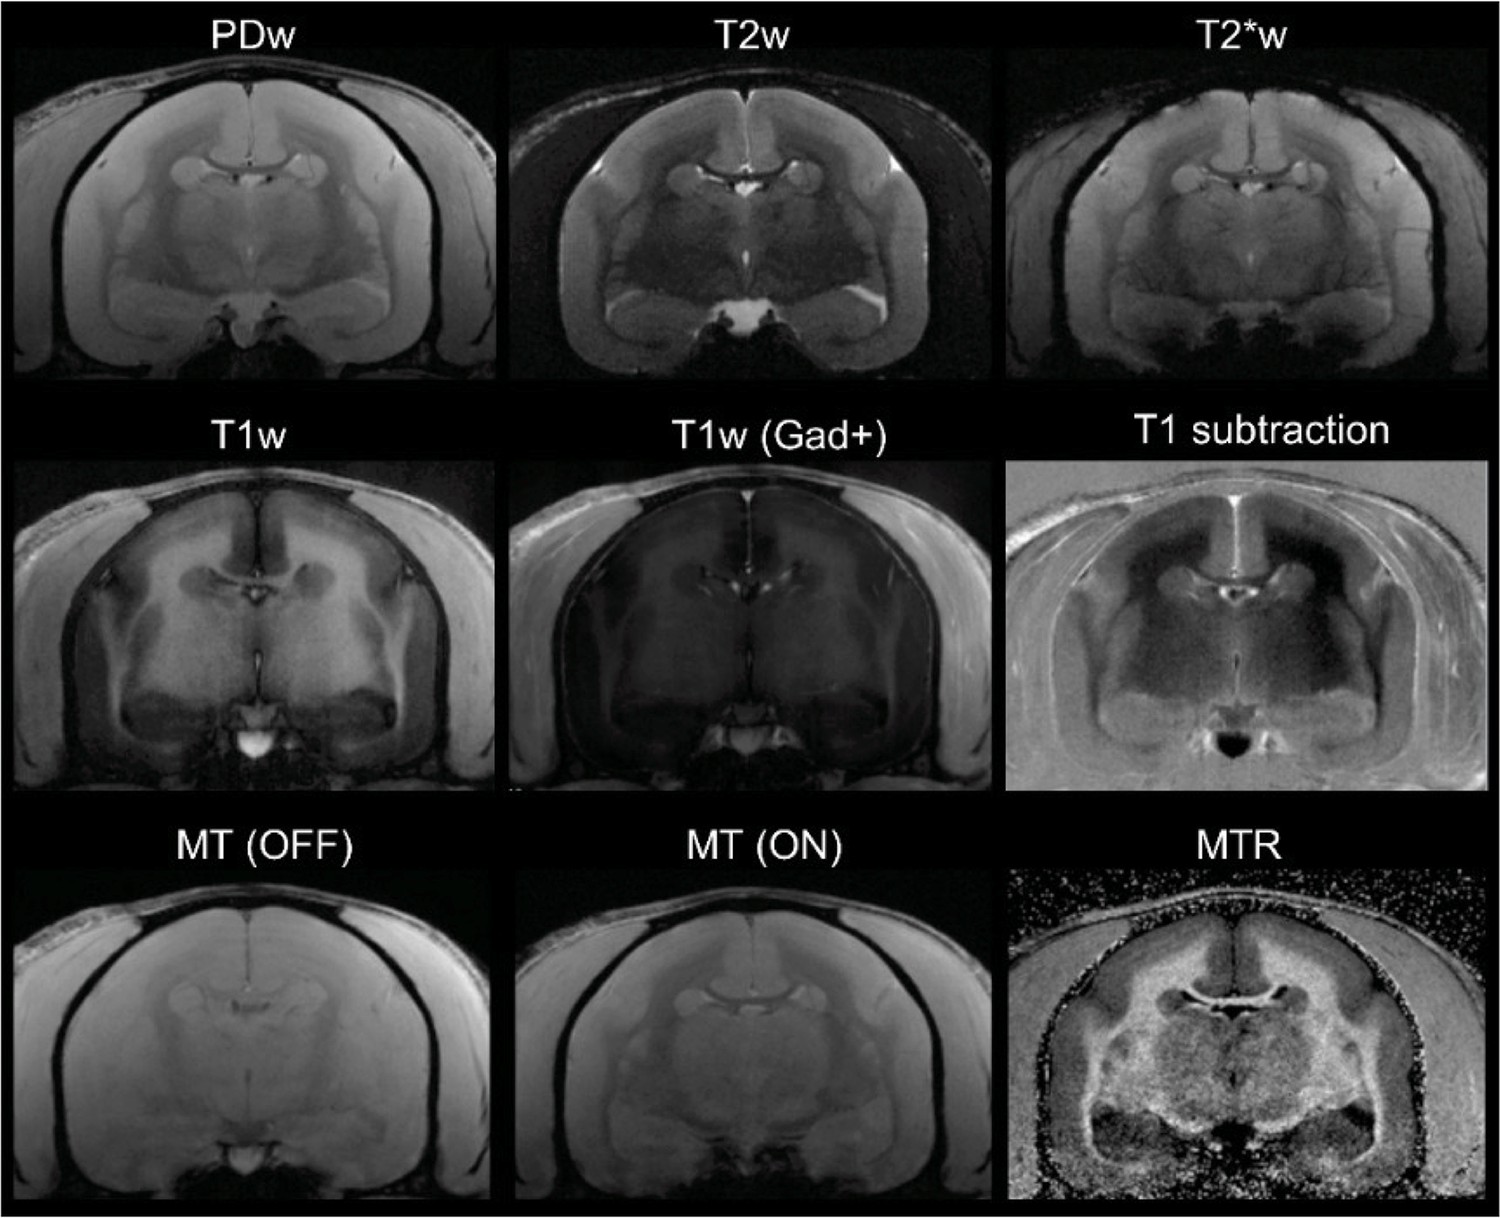
In vivo (baseline) multicontrast marmoset brain magnetic resonance imaging (MRI).
The T1 subtraction image was obtained by voxelwise subtraction of pre-gadolinium from post-gadolinium T1-weighted (T1w) images. The magnetization transfer ratio (MTR) image was derived voxelwise as (M0 – MSAT)/M0. Animal M#5.
Figure 6—figure supplement 1
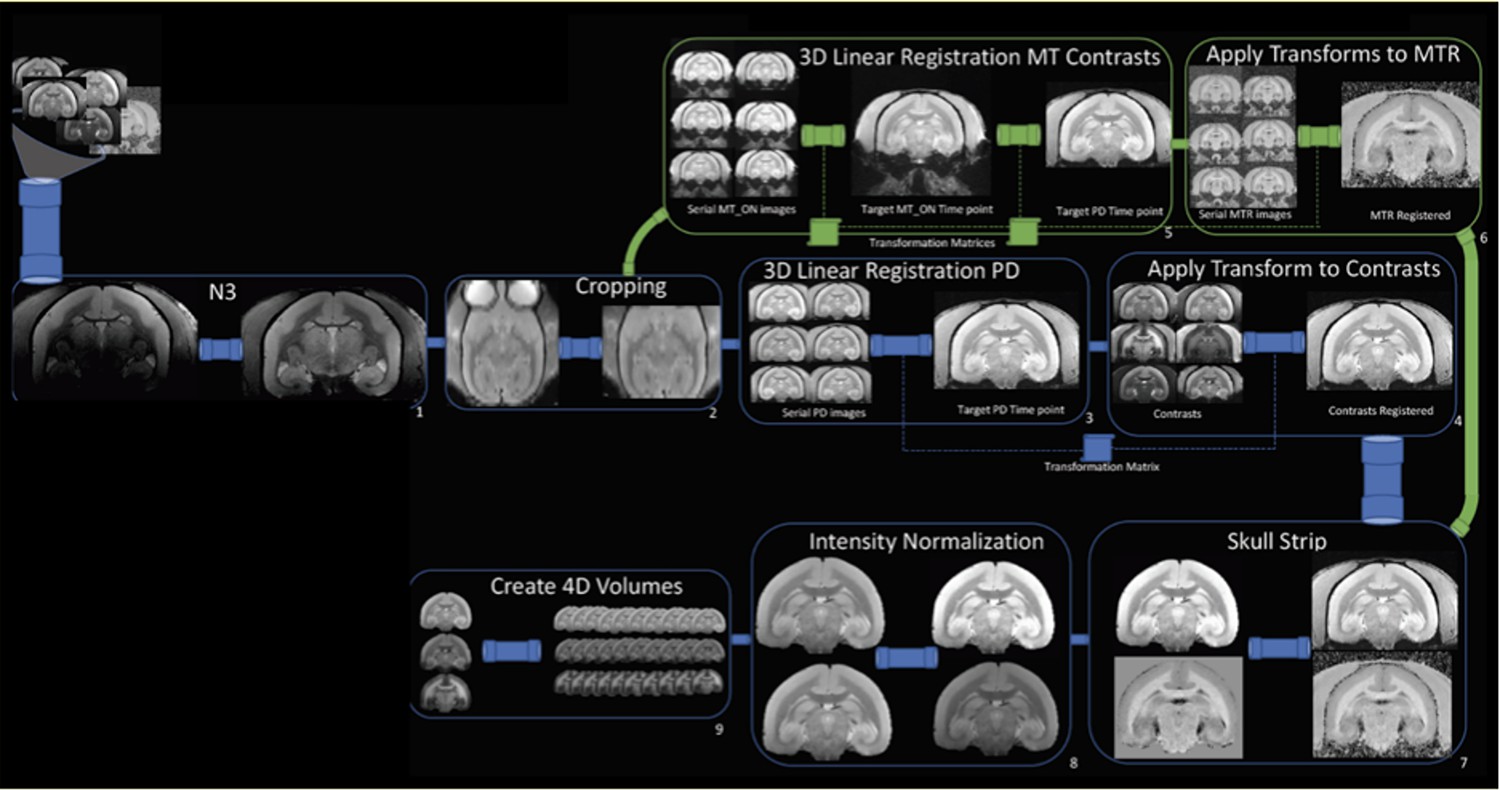
Workflow of the magnetic resonance imaging (MRI) postprocessing pipeline.
PD = proton density; MT = magnetization transfer; MTR = magnetization transfer ratio; N3=bias field correction.
Figure 6—figure supplement 2
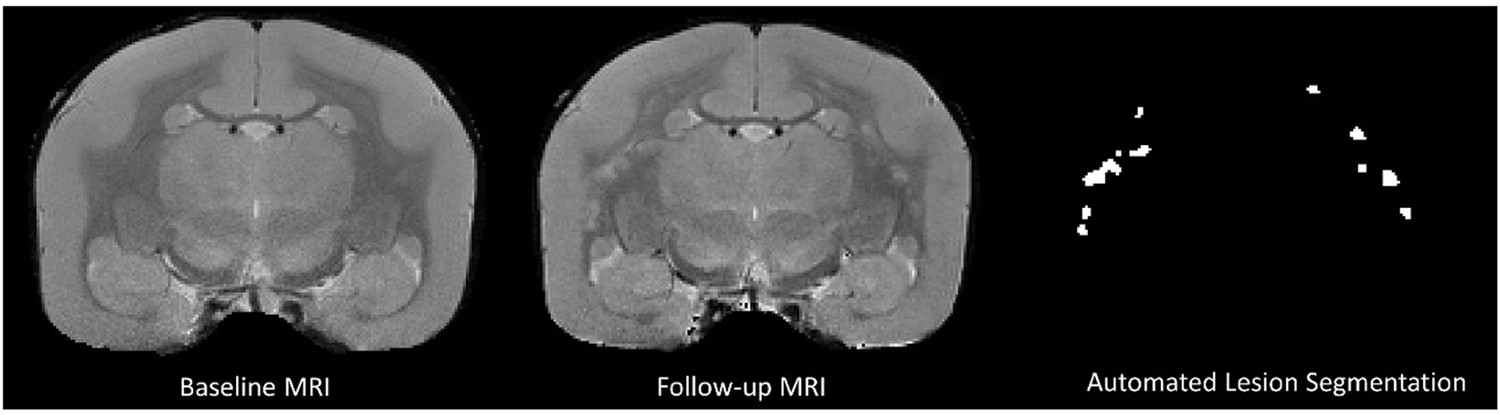
Postprocessed proton-density weighted images used as input for the convolutional neural network-based lesion segmentation.
All hyperintense lesions that appeared on the follow-up magnetic resonance imaging (MRI) performed post-immunization (in this example, M#1, 22 weeks post-immunization) were captured by the automated algorithm.
Tables
Table 1
Classification of focal lesions by proton density-weighted magnetic resonance imaging.
| Animal | Predicted early active | Predicted chronic, at least partially demyelinated | Predicted remyelinated | Total |
|---|---|---|---|---|
| M#1 | 1 | 2 | 6 | 9 |
| M#2 | 1 | 1 | 6 | 8 |
| M#3 | 1 | 1 | 4 | 6 |
| M#4 | 0 | 1 | 2 | 3 |
| M#5 | 3 | 3 | 0 | 6 |
| M#6 | 6 | 2 | 0 | 8 |
| Total | 12 | 10 | 18 | 40 |
Table 2
Classification of focal lesions by histopathology.
| Animal | Early active | Chronic, at least partially demyelinated | Remyelinated | Total |
|---|---|---|---|---|
| M#2 | 1 | 3 | 4 | 8 |
| M#3 | 1 | 1 | 4 | 6 |
| M#4 | 0 | 2 | 1 | 3 |
| M#5 | 3 | 3 | 0 | 6 |
| M#6 | 7 | 1 | 0 | 8 |
| Total | 12 | 10 | 9 | 31 |
Table 3
Confusion matrix for PDw MRI prediction of demyelinated vs. remyelinated lesions compared to histology.
| n=31 | Predicted demyelination by MRI | Predicted remyelination by MRI | |
|---|---|---|---|
| Actual demyelination by histology | 19 | 3 | 22 |
| Actual remyelination by histology | 0 | 9 | 9 |
| 19 | 12 |
Table 4
Demographics and experimental information for the six marmosets included in this study.
Immunizations used human white matter homogenate. Experiment duration corresponds to the time between immunization and terminal MRI.
| Animal | Sex | Age (years) | First immunization | Second immunization | Corticosteroid treatment | Experiment duration (weeks) |
|---|---|---|---|---|---|---|
| M#1* | Male | 3.7 | 100 mg | 200 mg | Yes | 40 |
| M#2* | Male | 3.7 | 100 mg | 200 mg | No | 54 |
| M#3† | Male | 6.2 | 200 mg | – | Yes | 61 |
| M#4† | Male | 6.2 | 200 mg | – | No | 60 |
| M#5‡ | Female | 2.8 | 200 mg | – | Yes | 18 |
| M#6‡ | Female | 2.8 | 200 mg | – | No | 16 |
-
Denote the three different pairs of twin animals.
Table 5
Main parameters used for the different MRI contrasts acquired in vivo.
| MRI contrast | PDw | T1w | T2w | T2*w | MTR* |
|---|---|---|---|---|---|
| Sequence | 2D RARE | 2D MDEFT | 2D RARE | 2D MGE | 3D MGE |
| FOV (mm) | 32×24 | 32×24 | 32×24 | 32×24 | 38.4×38.4 |
| Matrix | 214×160 | 214×160 | 214×160 | 214×160 | 256×256 |
| Number of slices | 36 | 36 | 36 | 36 | 36 |
| Slice thickness (mm) | 1 | 1 | 1 | 1 | 1 |
| TR (ms) | 2300 | 12.5 | 8000 | 2150 | 20 |
| TE (ms) | 16 | 4.2 | 72 | 18 | 5 |
| TI (ms) | N/A | 1200 | N/A | N/A | N/A |
| ETL | 1 | N/A | 4 | N/A | N/A |
| Excitation pulse (shape, FA) | Sinc3, 90° | Sinc3, 12° | Sinc3, 90° | Sinc3, 70° | Sinc3, 10° |
| Refocusing pulse (shape, FA) | Sinc3, 180° | N/A | Sinc3, 180° | N/A | N/A |
| Preparation pulse (type, shape, FA, offset) | N/A | Excitation/inversion, Sech, 90°/180° | N/A | N/A | MT, Gauss, 1500 Hz |
| NEX | 1 | 1 | 2 | 1 | 2 |
| AT | 7 min 40 s | 6 min 56 s | 13 min 20 s | 7 min 10 s | 7 min 58 s |
-
FOV = field of view; TR = repetition tine; TE = echo time; TI = inversion time; ETL = echo train length (or RARE factor); FA = flip angle; NEX = number of repetitions; AT = acquisition time; RARE = rapid acquisition with relaxation and enhancement; MDEFT = modified drive equilibrium Fourier transform; MGE = multi-gradient echo.
-
*
Sequence was performed twice: with (MSAT) and without (M0) the MT pre-pulse.
Additional files
-
Supplementary file 1
Immunohistochemistry methodology.
For each of the immunohistochemical targets, respective source, clonalities and hosts, and methods for antigen retrieval, blocking, and primary and secondary antibody inoculation are listed. HIER = heat-induced epitope retrieval; RT = room temperature; P=polyclonal antibody; M=monoclonal antibody; Rb = rabbit; Ms = mouse
- https://cdn.elifesciences.org/articles/73786/elife-73786-supp1-v2.docx
-
Transparent reporting form
- https://cdn.elifesciences.org/articles/73786/elife-73786-transrepform1-v2.docx
-
Source data 1
First part of serial in vivo magnetic resonance images of animal #1, including proton density-weighted sequence, used for analysis and figure generation.
Uploaded into two separate source data for size of files. Files are in neuroimaging informatics technology initiative (NIFTI) format.
- https://cdn.elifesciences.org/articles/73786/elife-73786-data1-v2.zip
-
Source data 2
Second part of serial in vivo magnetic resonance images of animal #1, including proton density-weighted sequence, used for analysis and figure generation.
Uploaded into two separate source data for size of files. Files are in neuroimaging informatics technology initiative (NIFTI) format.
- https://cdn.elifesciences.org/articles/73786/elife-73786-data2-v2.zip
-
Source data 3
First part of serial in vivo magnetic resonance images of animal #2, including proton density-weighted sequence, used for analysis and figure generation.
Uploaded into two separate source data for size of files. Files are in neuroimaging informatics technology initiative (NIFTI) format.
- https://cdn.elifesciences.org/articles/73786/elife-73786-data3-v2.zip
-
Source data 4
Second part of serial in vivo magnetic resonance images of animal #2, including proton density-weighted sequence, used for analysis and figure generation.
Uploaded into two separate source data for size of files. Files are in neuroimaging informatics technology initiative (NIFTI) format.
- https://cdn.elifesciences.org/articles/73786/elife-73786-data4-v2.zip
-
Source data 5
Serial in vivo magnetic resonance images of animal #3, including proton density-weighted sequence, used for analysis and figure generation.
Files are in neuroimaging informatics technology initiative (NIFTI) format.
- https://cdn.elifesciences.org/articles/73786/elife-73786-data5-v2.zip
-
Source data 6
Serial in vivo magnetic resonance images of animal #4, including proton density-weighted sequence, used for analysis and figure generation.
Files are in neuroimaging informatics technology initiative (NIFTI) format.
- https://cdn.elifesciences.org/articles/73786/elife-73786-data6-v2.zip
-
Source data 7
Serial in vivo magnetic resonance images of animal #5, including proton density-weighted sequence, used for analysis and figure generation.
Files are in neuroimaging informatics technology initiative (NIFTI) format.
- https://cdn.elifesciences.org/articles/73786/elife-73786-data7-v2.zip
-
Source data 8
Serial in vivo magnetic resonance images of animal #6, including proton density-weighted sequence, used for analysis and figure generation.
Files are in neuroimaging informatics technology initiative (NIFTI) format.
- https://cdn.elifesciences.org/articles/73786/elife-73786-data8-v2.zip
-
Source data 9
Iba1 and proteolipid protein (PLP) immunohistochemistry images of animals #2–6 used for analysis and figure generation.
- https://cdn.elifesciences.org/articles/73786/elife-73786-data9-v2.pdf
Download links
A two-part list of links to download the article, or parts of the article, in various formats.
Downloads (link to download the article as PDF)
Open citations (links to open the citations from this article in various online reference manager services)
Cite this article (links to download the citations from this article in formats compatible with various reference manager tools)
In vivo MRI is sensitive to remyelination in a nonhuman primate model of multiple sclerosis
eLife 12:e73786.
https://doi.org/10.7554/eLife.73786


