Single-cell profiling reveals periventricular CD56bright NK cell accumulation in multiple sclerosis
- MS Center Amsterdam, Department of Molecular Cell Biology and Immunology, Amsterdam Neuroscience, Vrije Universiteit Amsterdam, Amsterdam UMC, Netherlands
- Amsterdam UMC, Vrije Universiteit Amsterdam, Department of Molecular Cell Biology and Immunology, Cancer Center Amsterdam, Amsterdam Infection and Immunity Institute, Netherlands
Figures
Figure 1 with 5 supplements
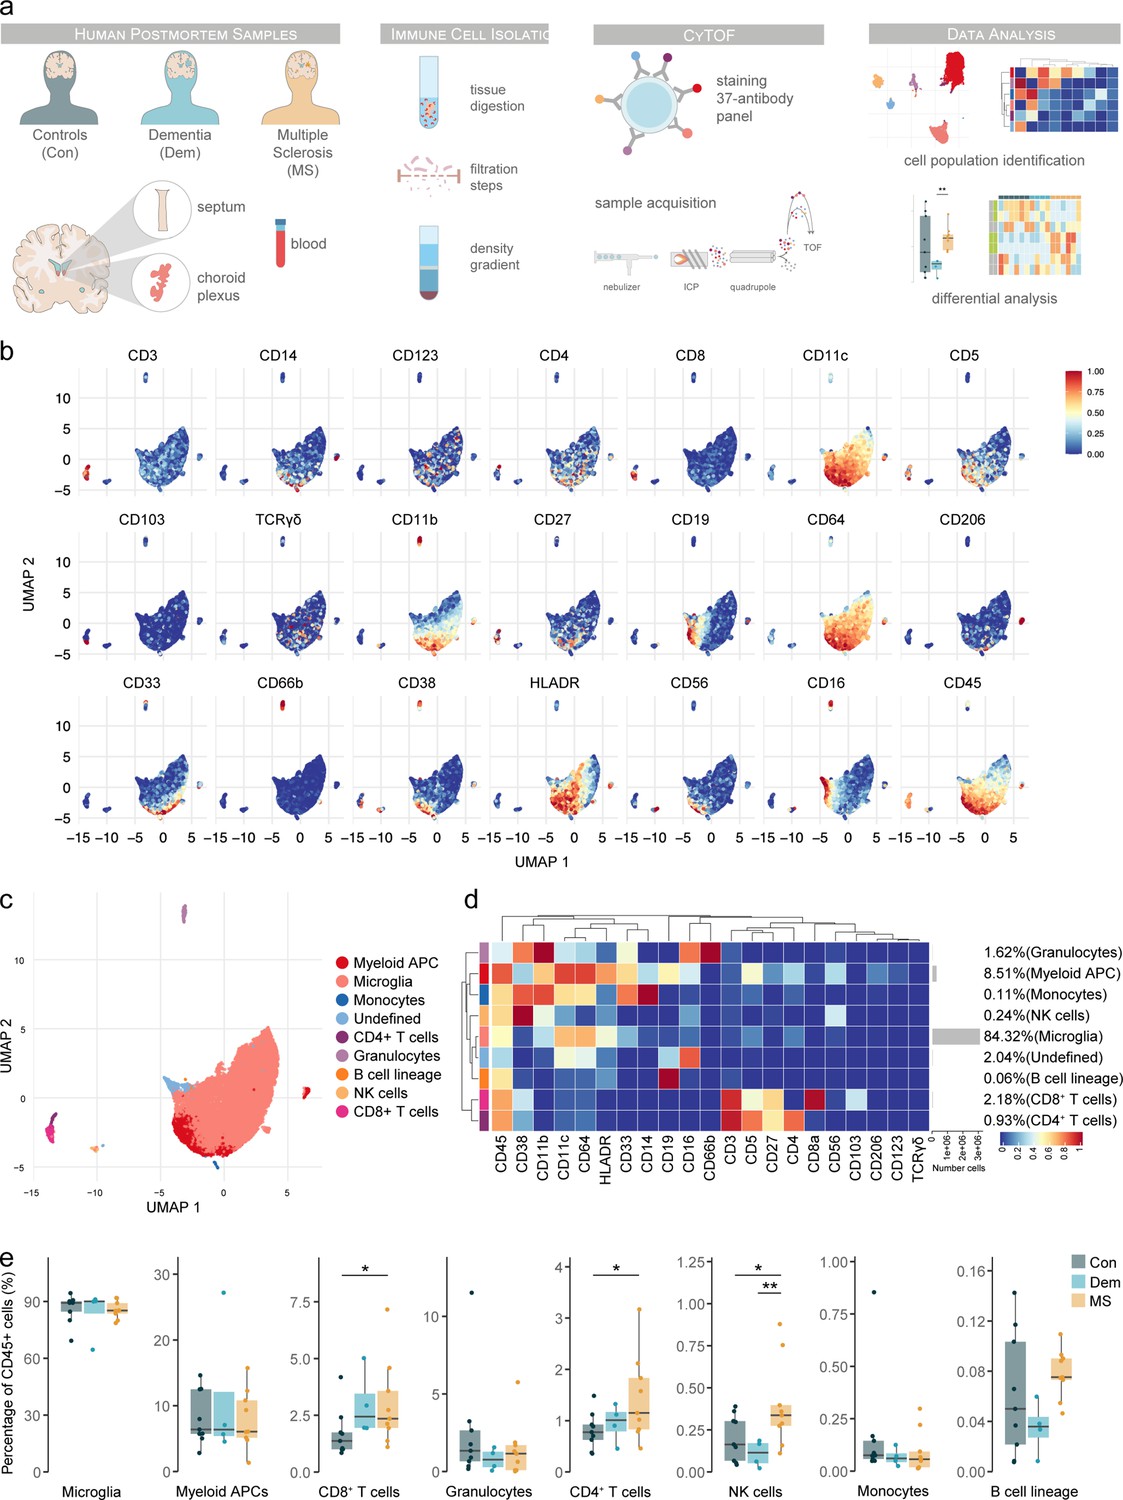
Immune phenotyping of the septum using mass cytometry reveals inflammation in multiple sclerosis involving T cells and natural killer cells.
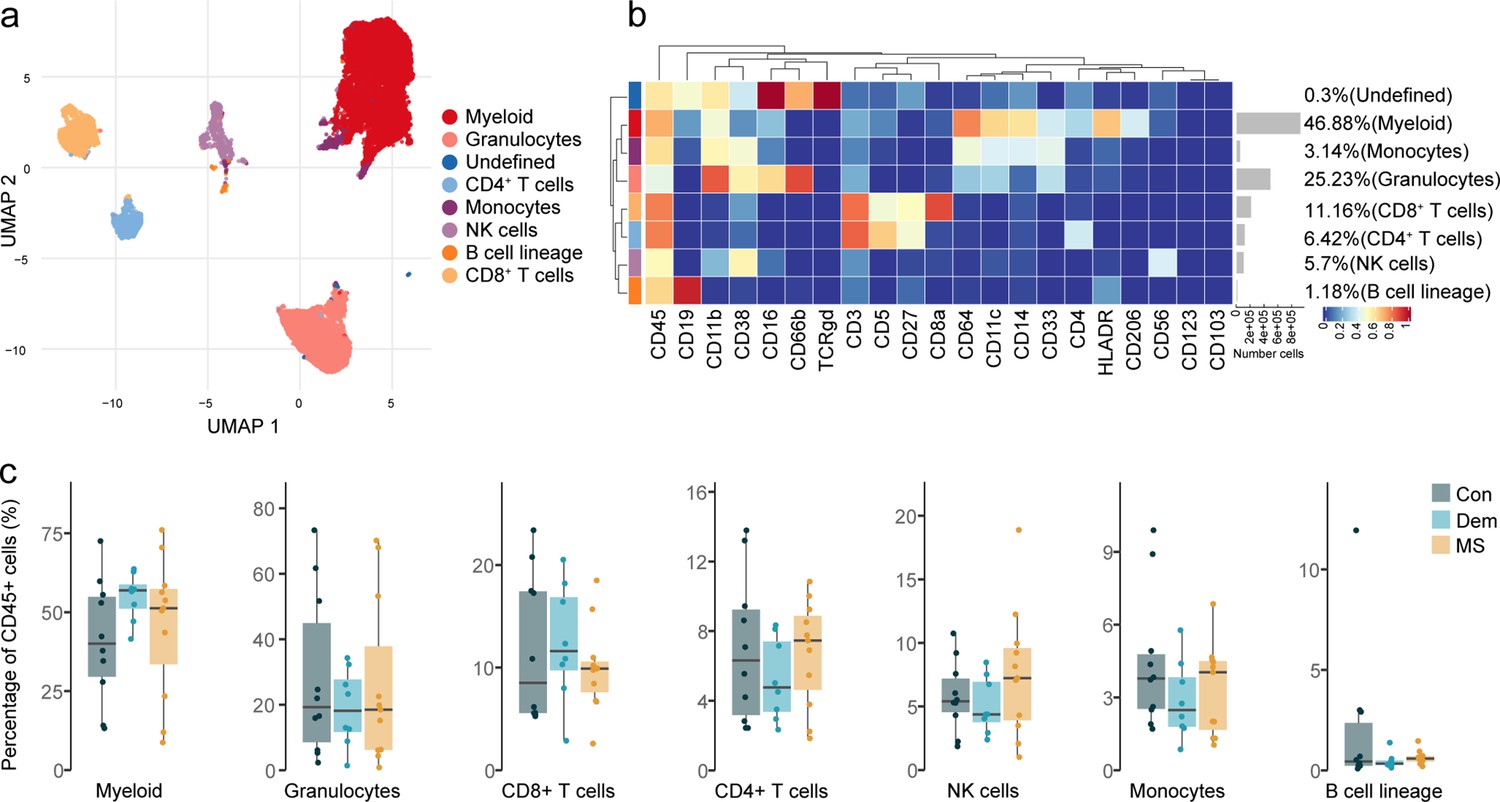
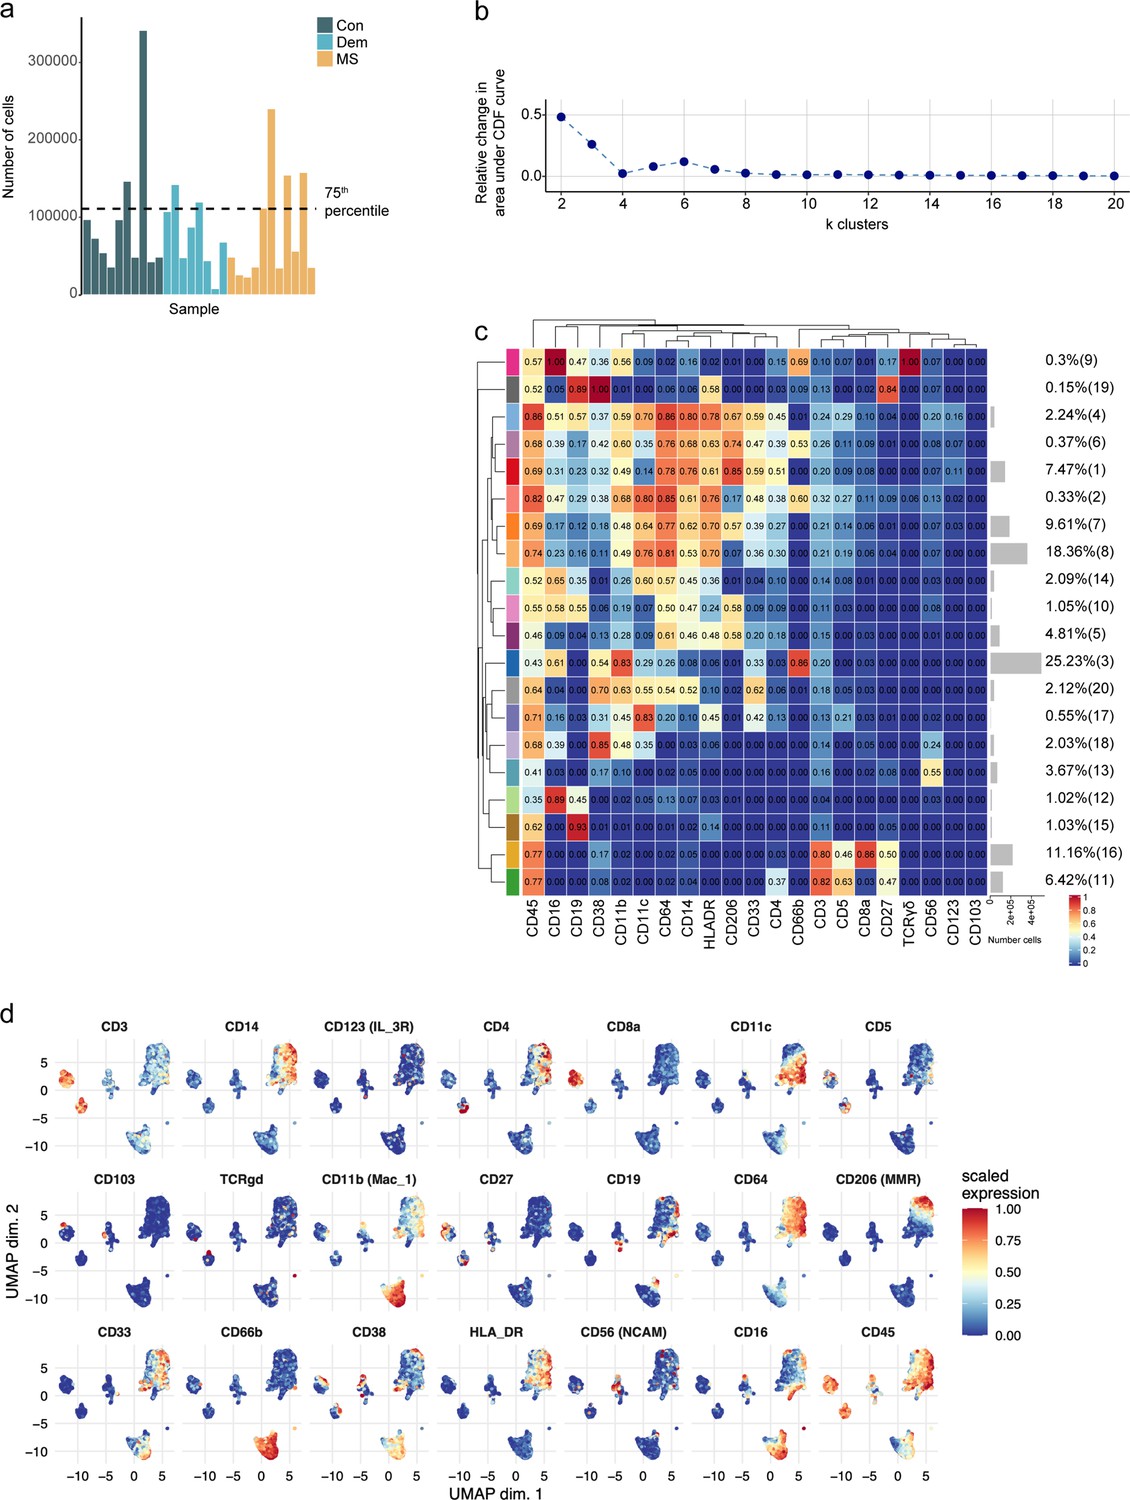
(a) Schematic overview of the study design. Immune cells were isolated from septum, choroid plexus and blood samples. Cells were then fixed, barcoded, stained and acquired on a CyTOF Helios system and analysed using FlowSOM and ConsensusClusterPlus. (b) UMAP plots are based on the arcsinh-transformed expression of the ‘type’ (lineage) markers in the septum-derived immune cells. A subset of 1000 randomly selected cells per sample is shown, colored according to the expression level of each marker. (c) UMAP plot based on the arcsinh-transformed expression of the ‘type’ (lineage) markers in the septum-derived immune cells. A subset of 1000 randomly selected cells is shown per sample, colored according to the manually annotated clusters. (d) Median scaled intensities of the ‘type’ (lineage) markers across the nine annotated septum-derived immune cell populations. The horizontal gray bars show the percentage of each cluster out of the total number of cells. (e) Percentage of each annotated cell population out of the total CD45+ cells from the septum of controls (Con), dementia (Dem) and multiple sclerosis (MS) donors. * adjusted p<0.1; ** adjusted p<0.05. Source data is listed in Source data 1.
Figure 1—figure supplement 1
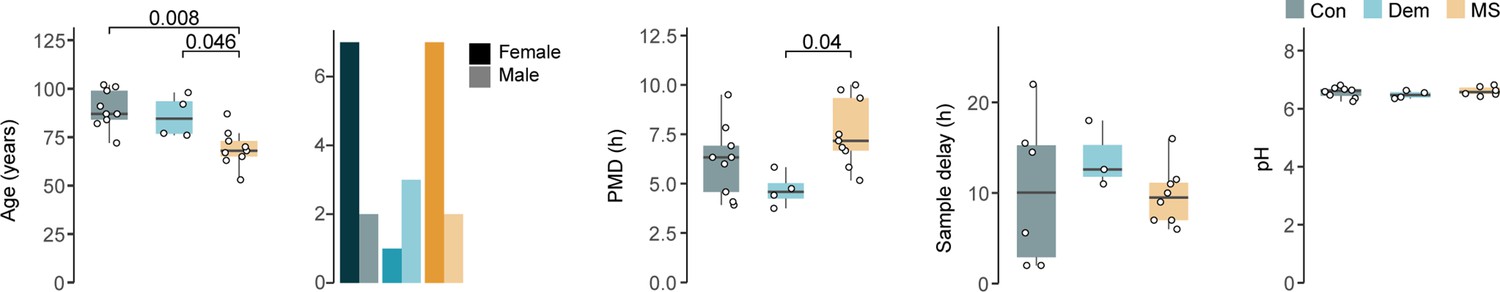
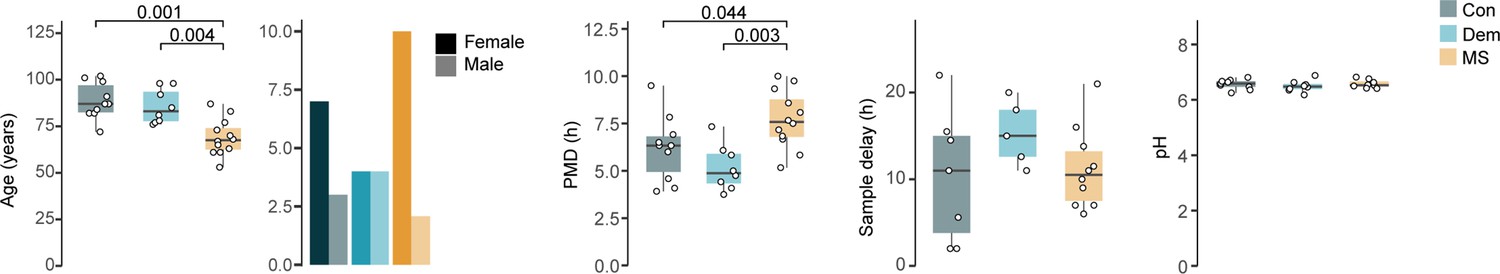
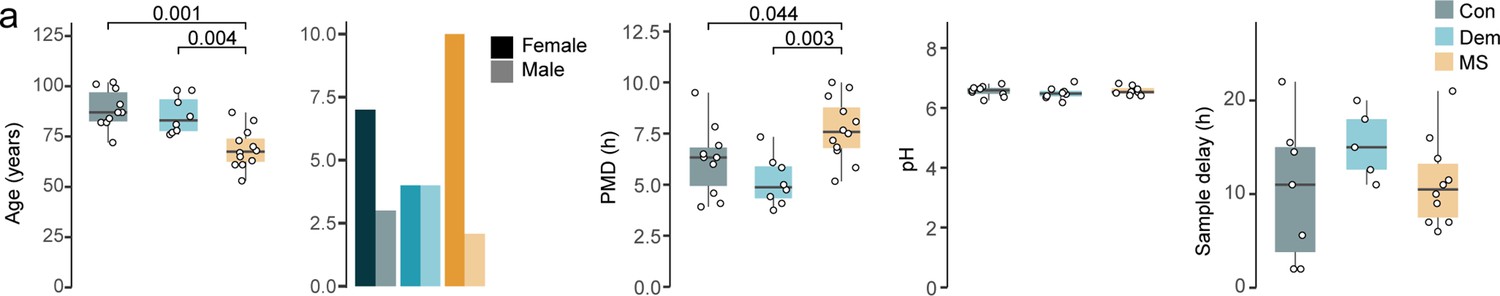
Demographic and clinical information.
Clinical parameters of the septum samples. Age and PMD (postmortem delay): pairwise comparisons using Wilcoxon rank-sum test with continuity correction; p-values adjusted with Benjamini-Hochberg method. Sample delay and pH: Kruskal-Wallis rank-sum test. Con: controls; Dem: dementia; MS: multiple sclerosis.
Figure 1—figure supplement 2
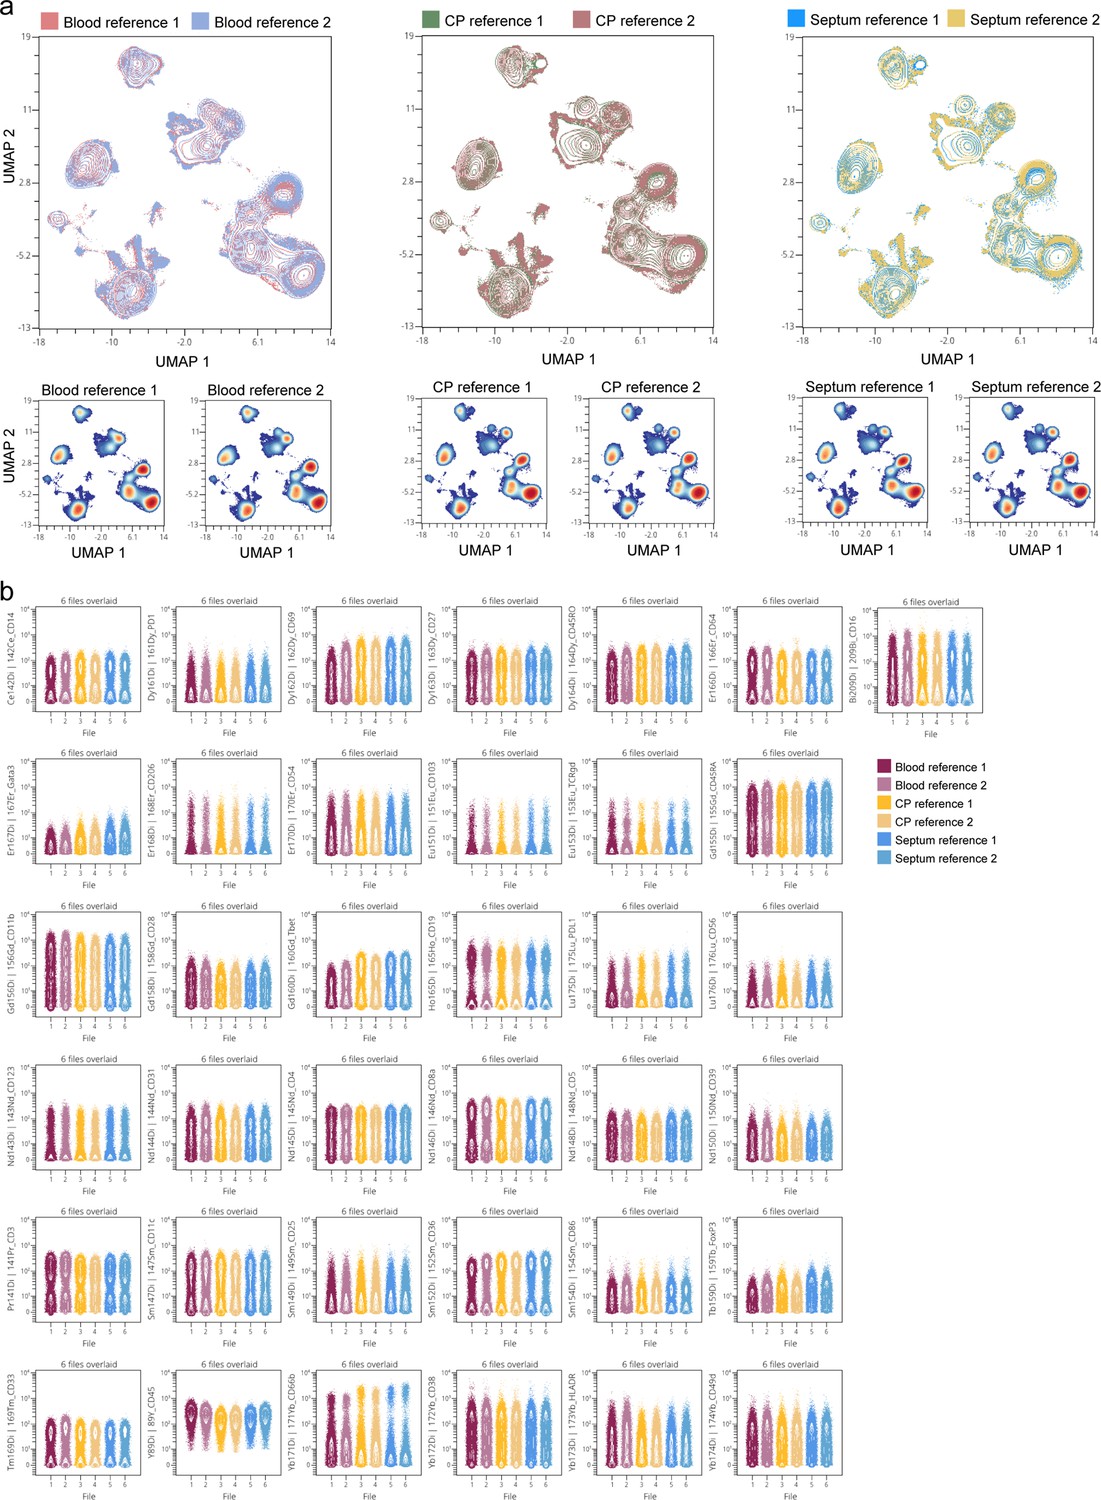
Staining intensity between the different barcoded CyTOF runs displayed using a reference sample.
(a) UMAP plots based on the arcsinh-transformed expression of all markers in the reference sample that were stained together with barcoded runs of septum, choroid plexus and blood samples. A total of 150,000 random cells were selected per sample. The first plot shows an overlay figure where the reference sample is colored by its barcoded run. The plots below are colored according to the density. (b) Contour plots with 0.1 outlier percentile showing the staining intensity per marker of the reference sample used at different barcodes. The six aliquots of reference samples used were derived from the same sample that was fixated, aliquot and frozen at –80 °C before. CP: choroid plexus.
Figure 1—figure supplement 3
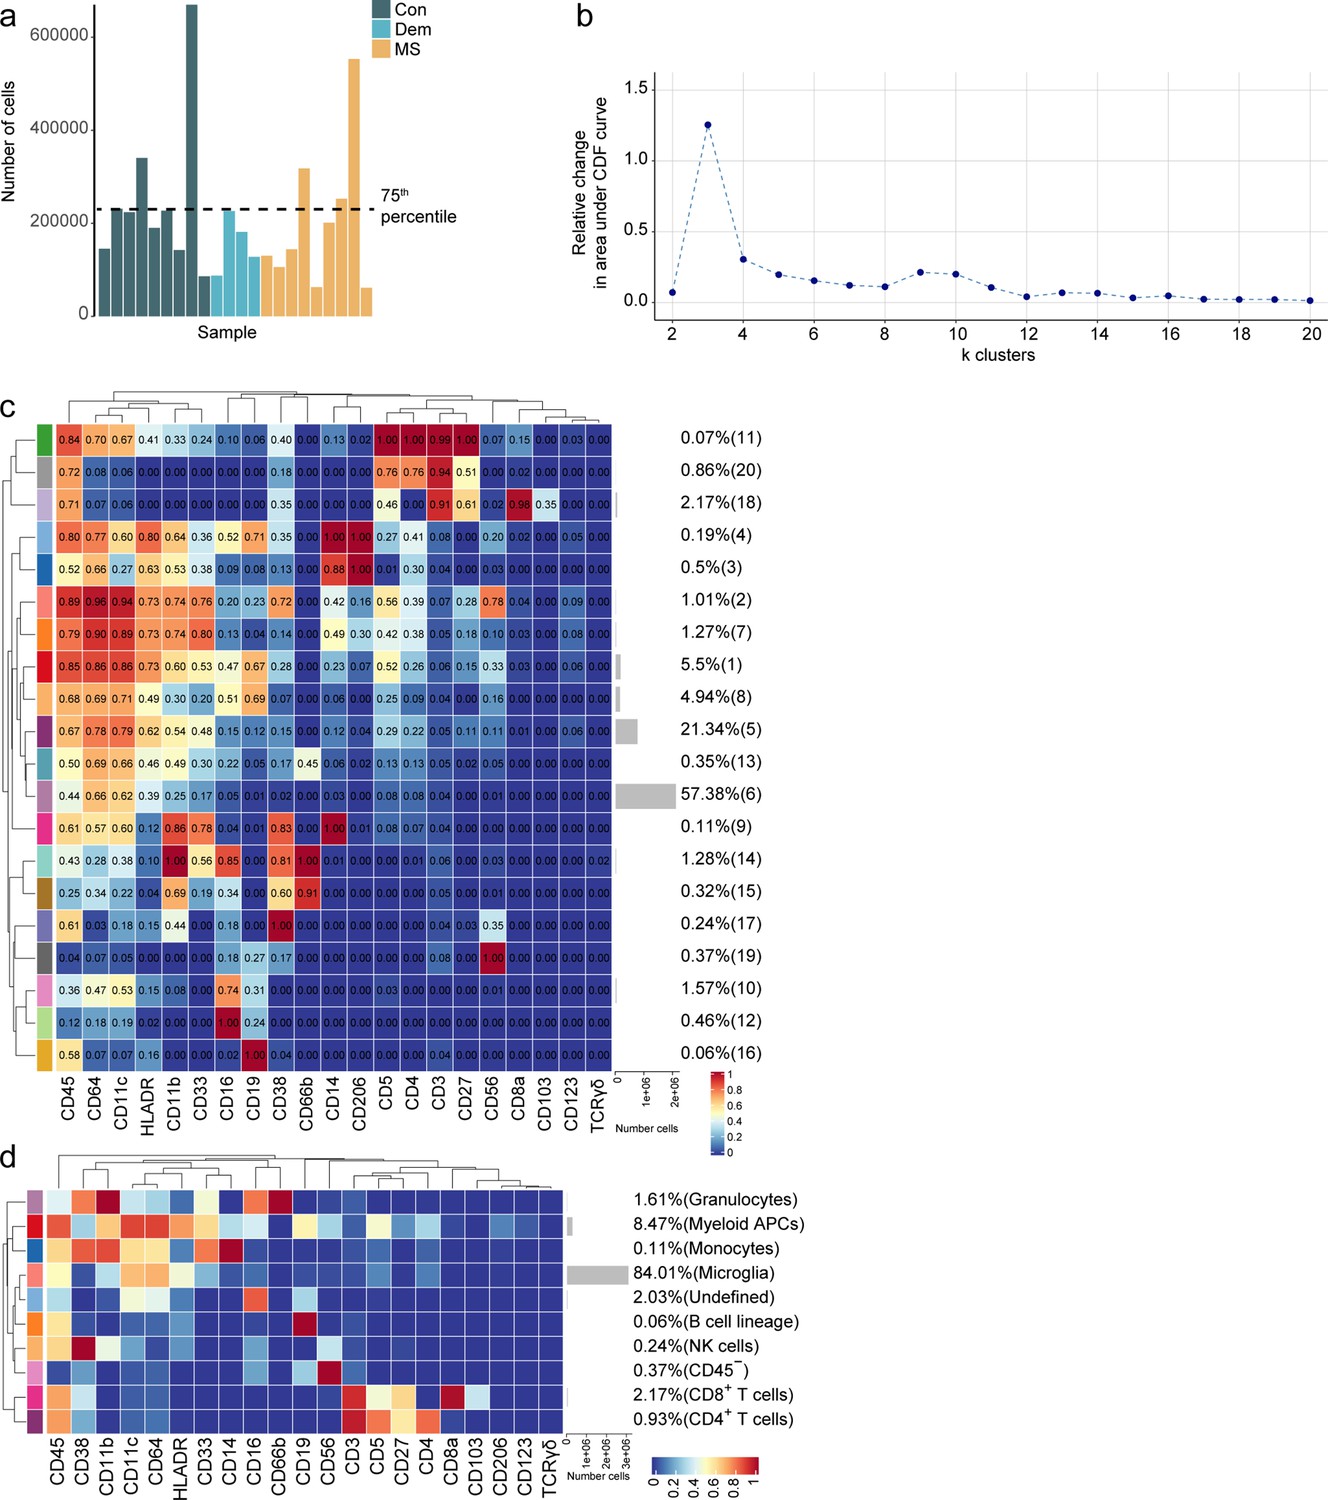
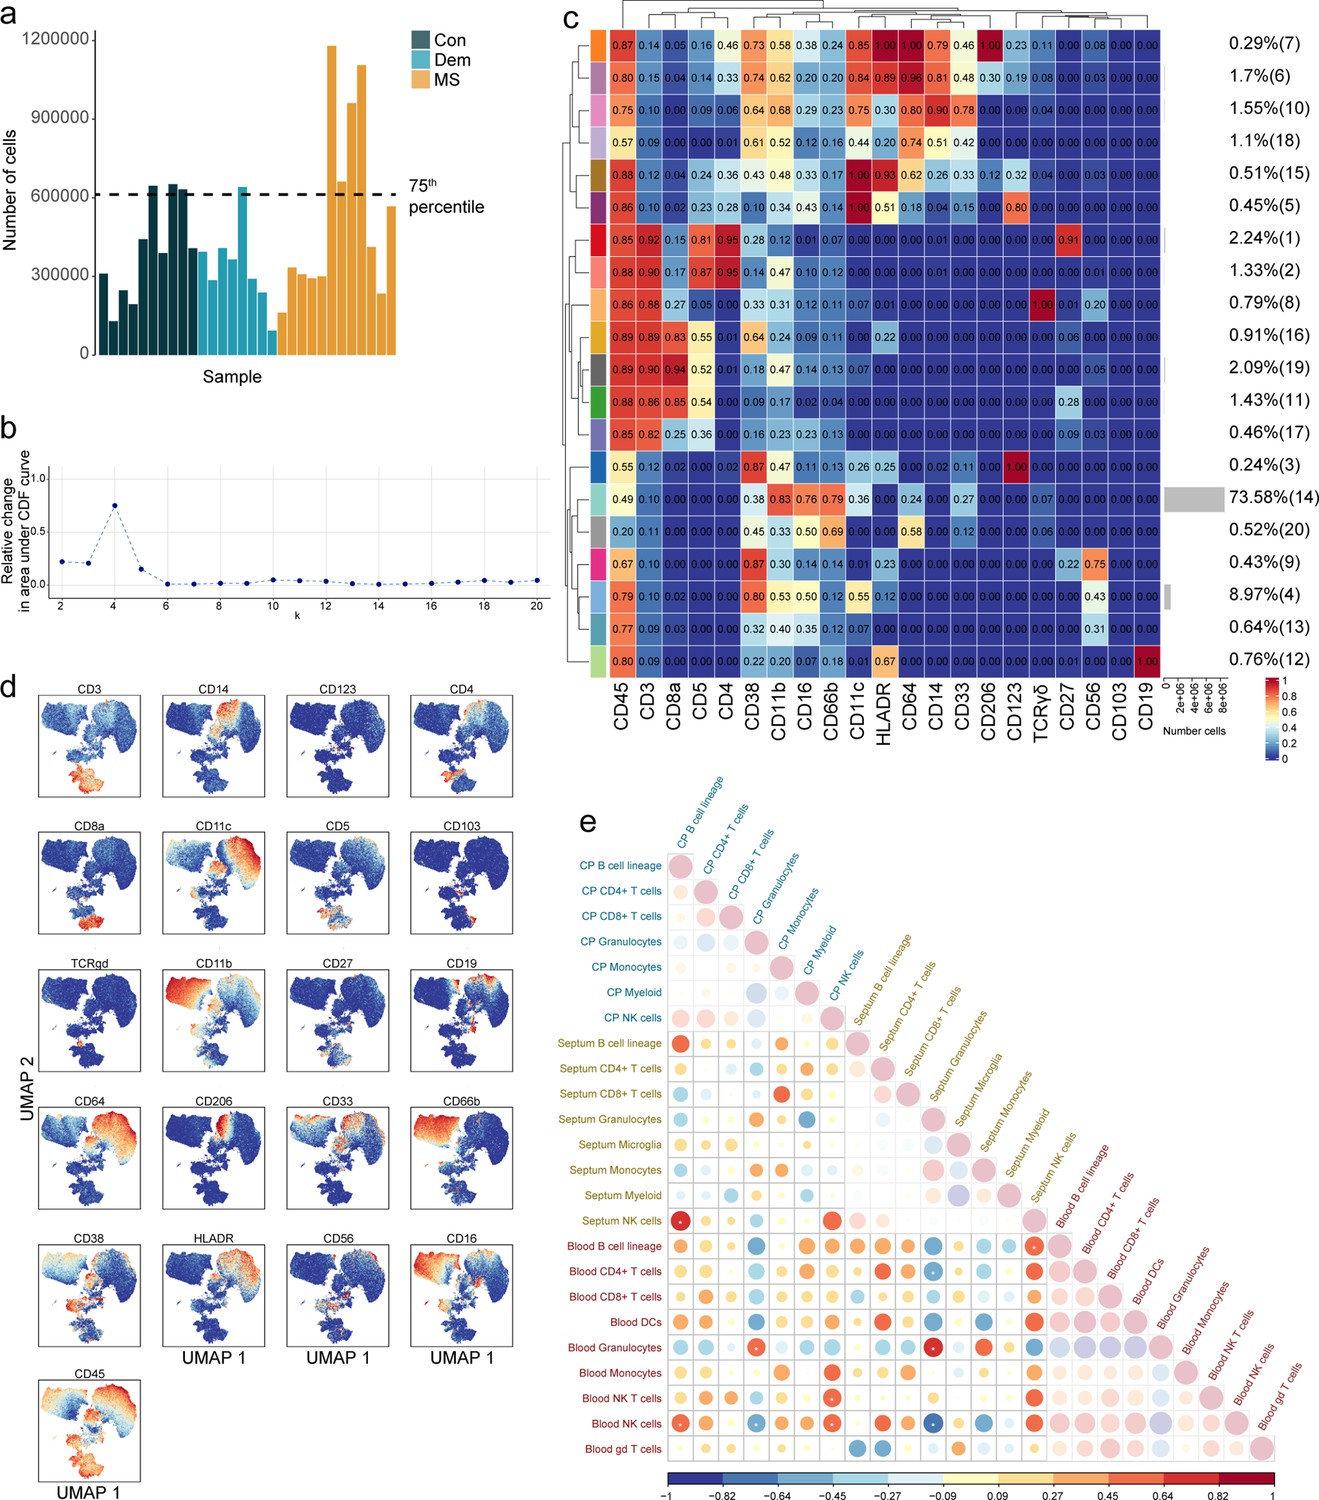
Immune phenotyping of the septum using mass cytometry reveals inflammation in multiple sclerosis involving T cells and natural killer cells.
(a) Bar plot showing the number of cells used for clustering from each septum sample. A threshold was set at the 75th percentile to avoid over-representation of certain samples in the analysis. (b) Delta area (‘elbow’) plot indicating the relative increase in cluster stability when clustering into k groups the 100 SOM clusters generated by FlowSOM. CDF: Consensus Cumulative Distribution Function. (c) Median marker intensities of the ‘type’ markers across septum-derived cell populations obtained with FlowSOM and ConsensusClusterPlus. The color in the heatmap represents the median of the arcsinh, 0–1 transformed marker expression calculated over cells from all samples. The left dendrogram is based on hierarchical clustering with average linkage and Euclidean distance between the 20 metaclusters. (d) Median marker intensities of the ‘type’ markers across septum-derived cell populations. (c, d) Horizontal gray bars show the percentage out of the total cells. Con: controls; Dem: dementia; MS: multiple sclerosis. Source data is listed in Source data 1.
Figure 1—figure supplement 4
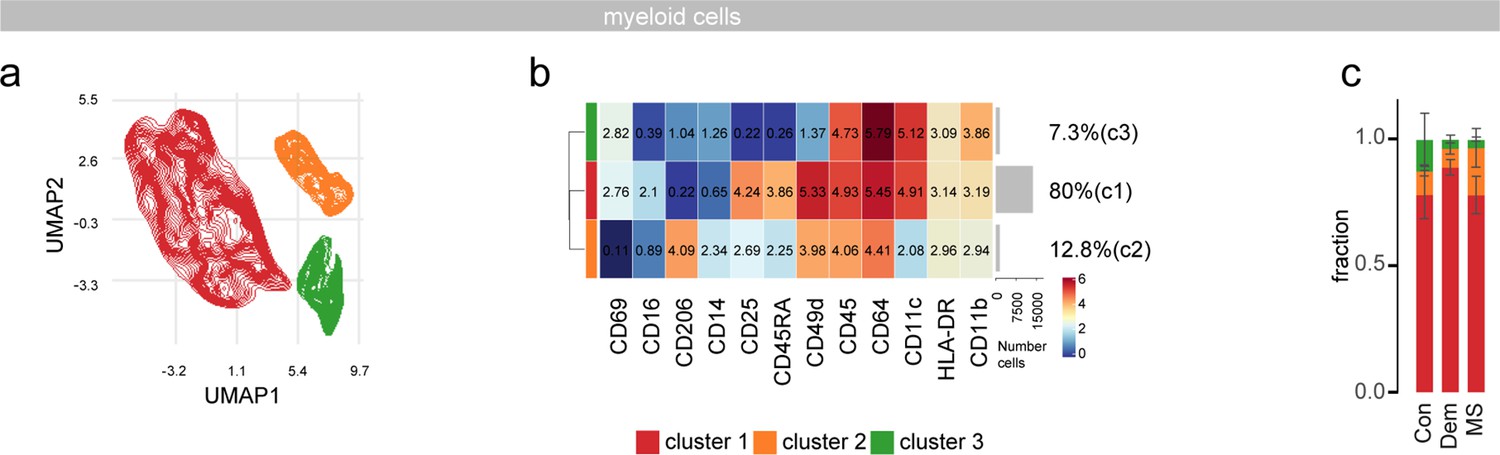
Myeloid subclustering in the septum.
(a) UMAPs displaying pre-gated myeloid subpopulation in the septum. The cells are colored according to PARC-guided clustering. (b) Median marker intensities of pre-selected markers across myeloid subpopulations of the septum. Horizontal gray bars show the percentage out of the total cells. The color in the heatmap represents the median of the arcsinh, 0–1 transformed marker expression calculated over cells from all the samples. (c) Stacked bargraph show the fraction of each of the three clusters. Con: controls; Dem: dementia; MS: multiple sclerosis. Source data is listed in Source data 1.
Figure 1—figure supplement 5
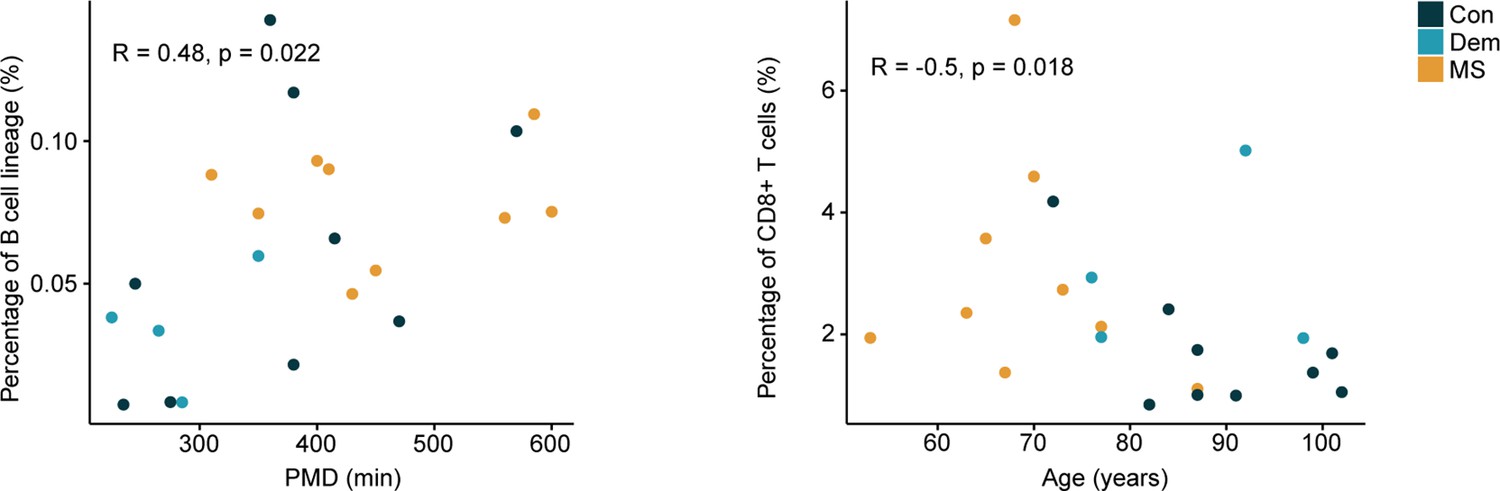
Correlations between the percentage of immune cells from the septum and clinical parameters.
Dot plots show the significant correlations (p<0.05) between the percentage of the septum-derived immune cells and sample parameters. Non-normally distributed data: Spearman’s rank correlation rho; normally distributed data: Pearson’s correlation. Con: controls; Dem: dementia; MS: multiple sclerosis. Source data is listed in Source data 1.
Figure 2 with 2 supplements
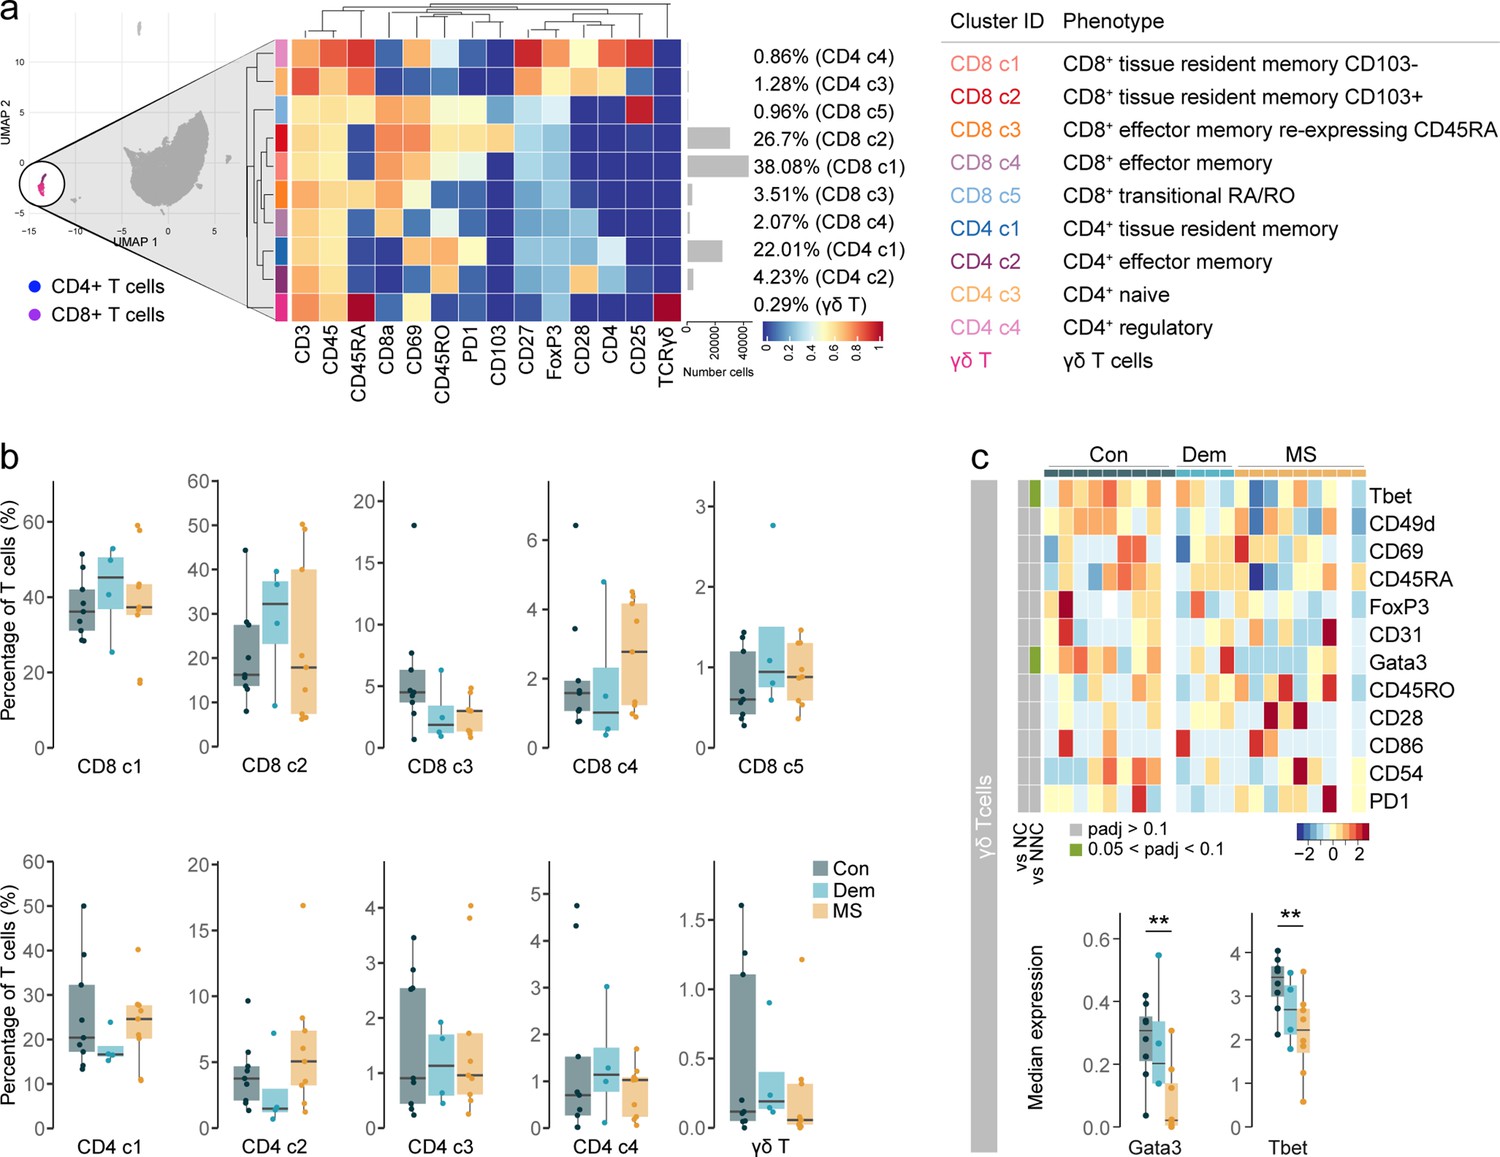
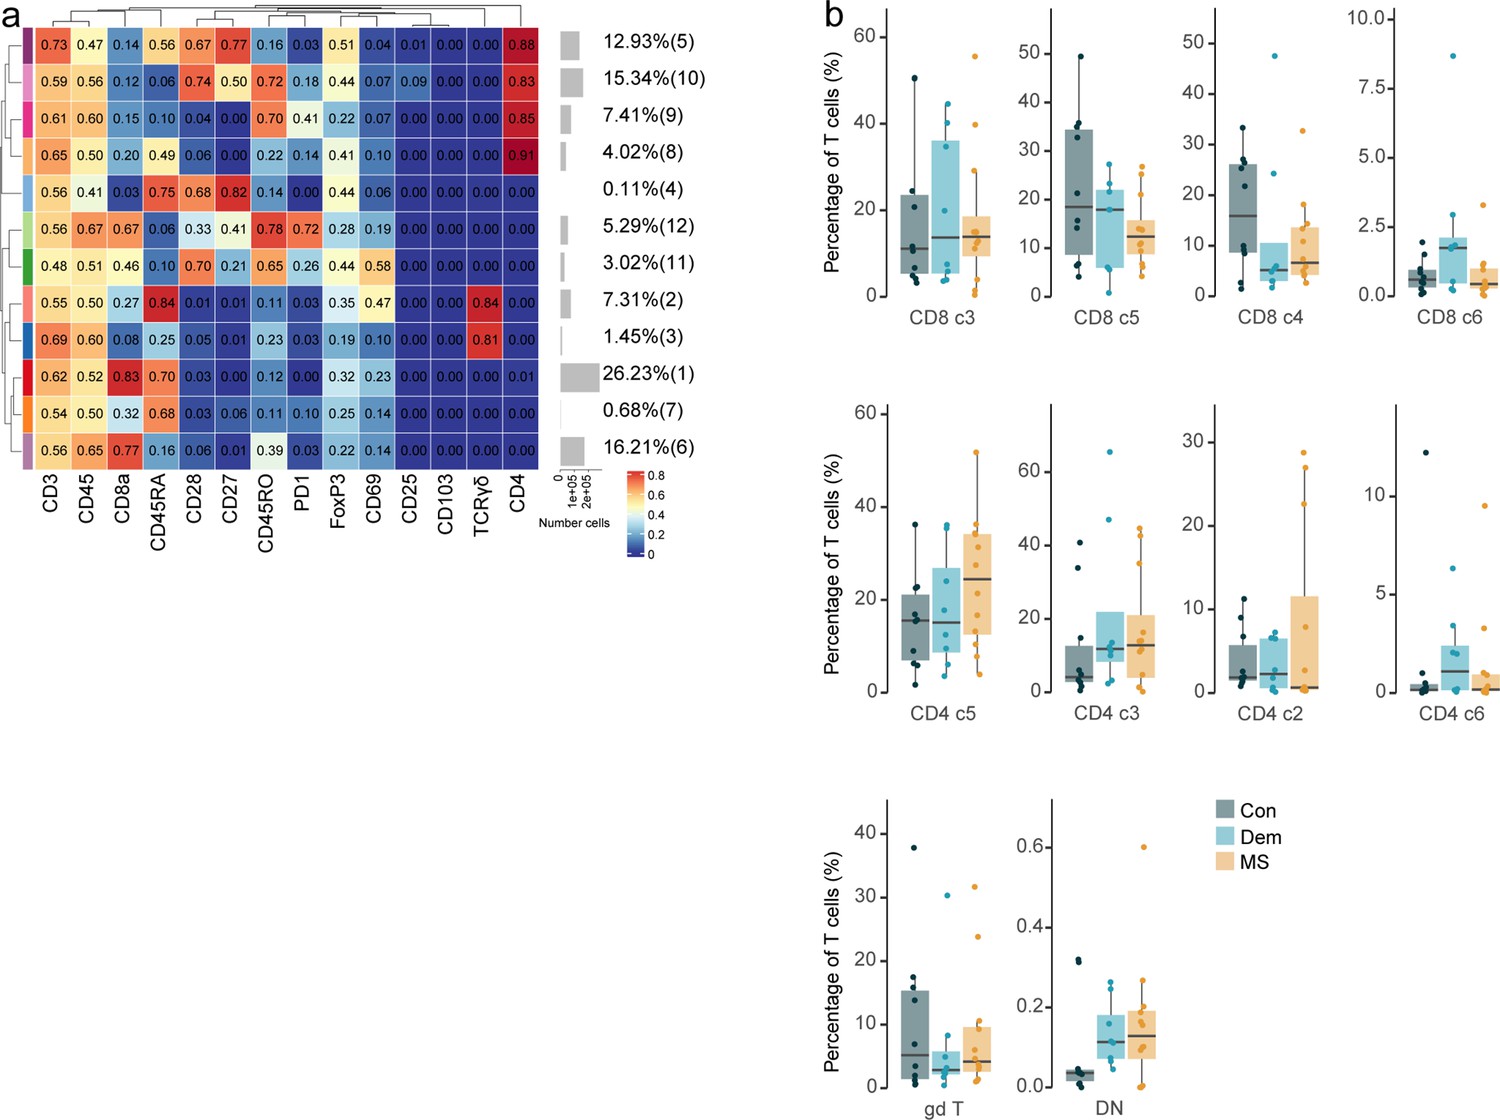
Phenotyping the T cell populations in the septum using mass cytometry.
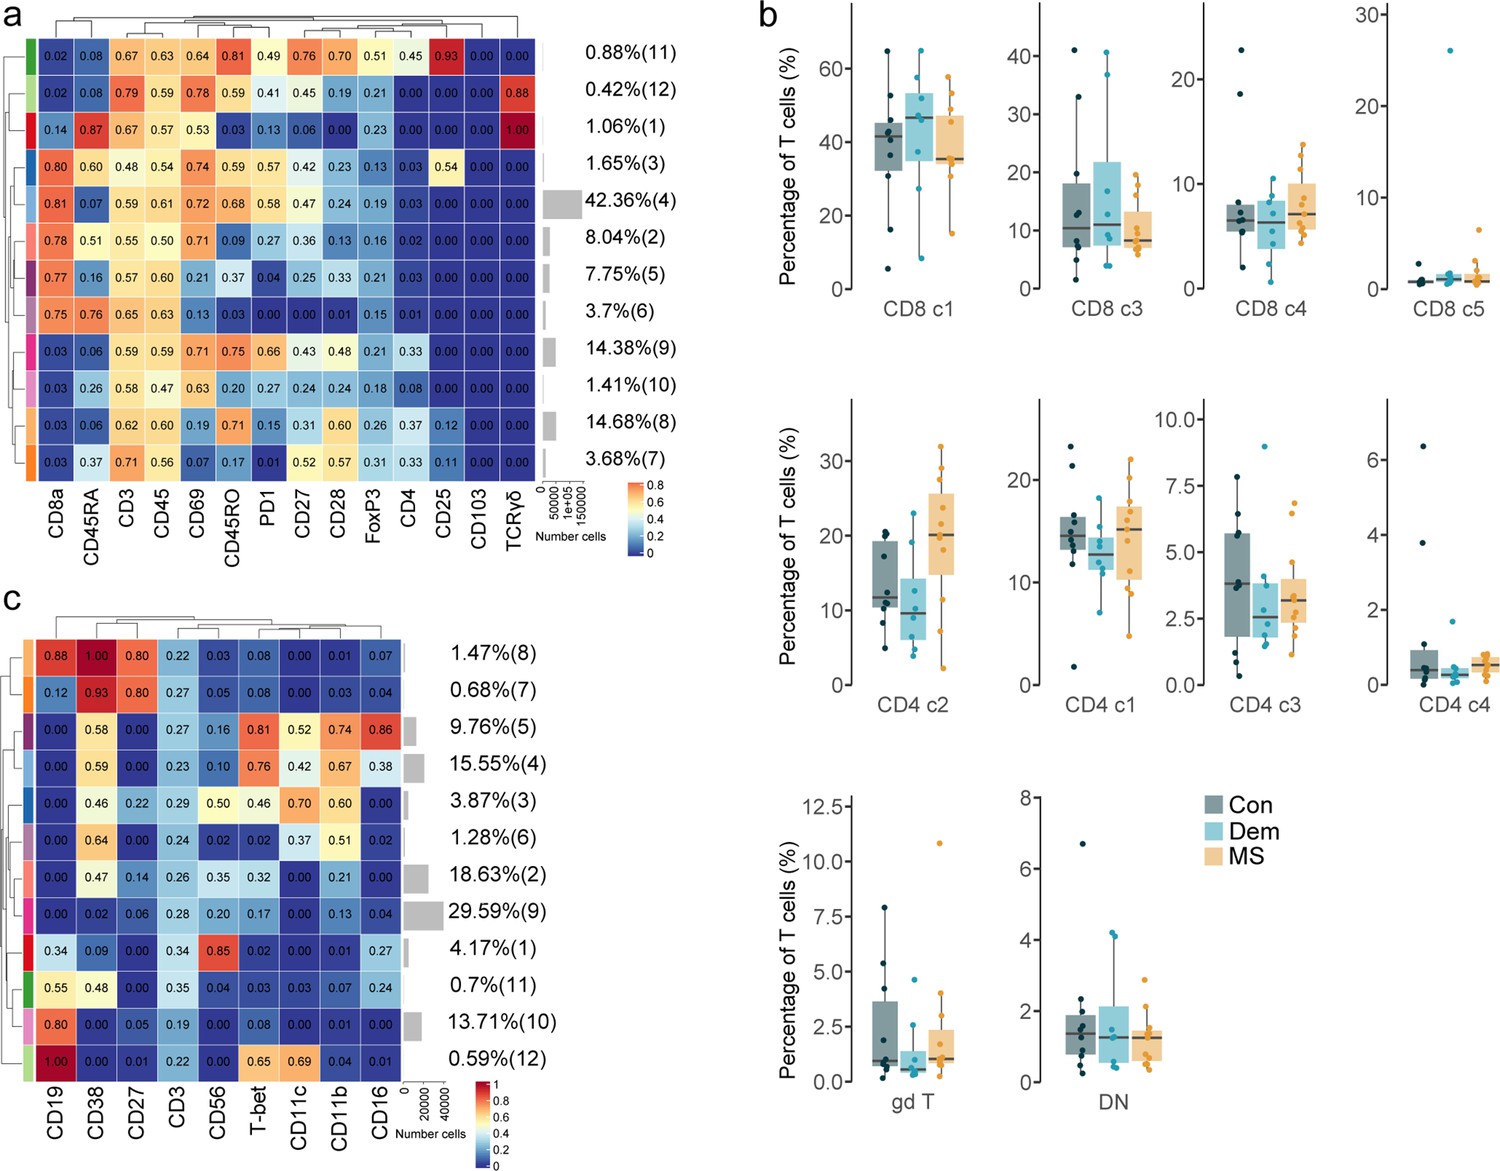
(a) Median scaled intensities of the ‘type’ markers across T cell subpopulations in the septum. The horizontal gray bars show the percentage of each cluster out of the total investigated cells. The table on the right shows the tentative biological names of the T cell subpopulations. (b) Percentage of each annotated cell population out of the total number of T cells (CD4+ and CD8+ T cells) from the septum of controls, dementia and MS donors. (c) Median scaled intensities of the ‘state’ markers in γδ T cells across all septum samples. Column annotation shows disease groups; row annotation shows adjusted p-values of comparing MS vs dementia and MS vs control samples. Color key shows row Z score. Blank cells are shown in a sample where γδ T cells were absent. Boxplots show median expression in γδ T cells of markers showing differential expression between the MS and control samples. ** adjusted p<0.05. Con: controls; Dem: dementia; MS: multiple sclerosis. Source data is listed in Source data 1.
Figure 2—figure supplement 1
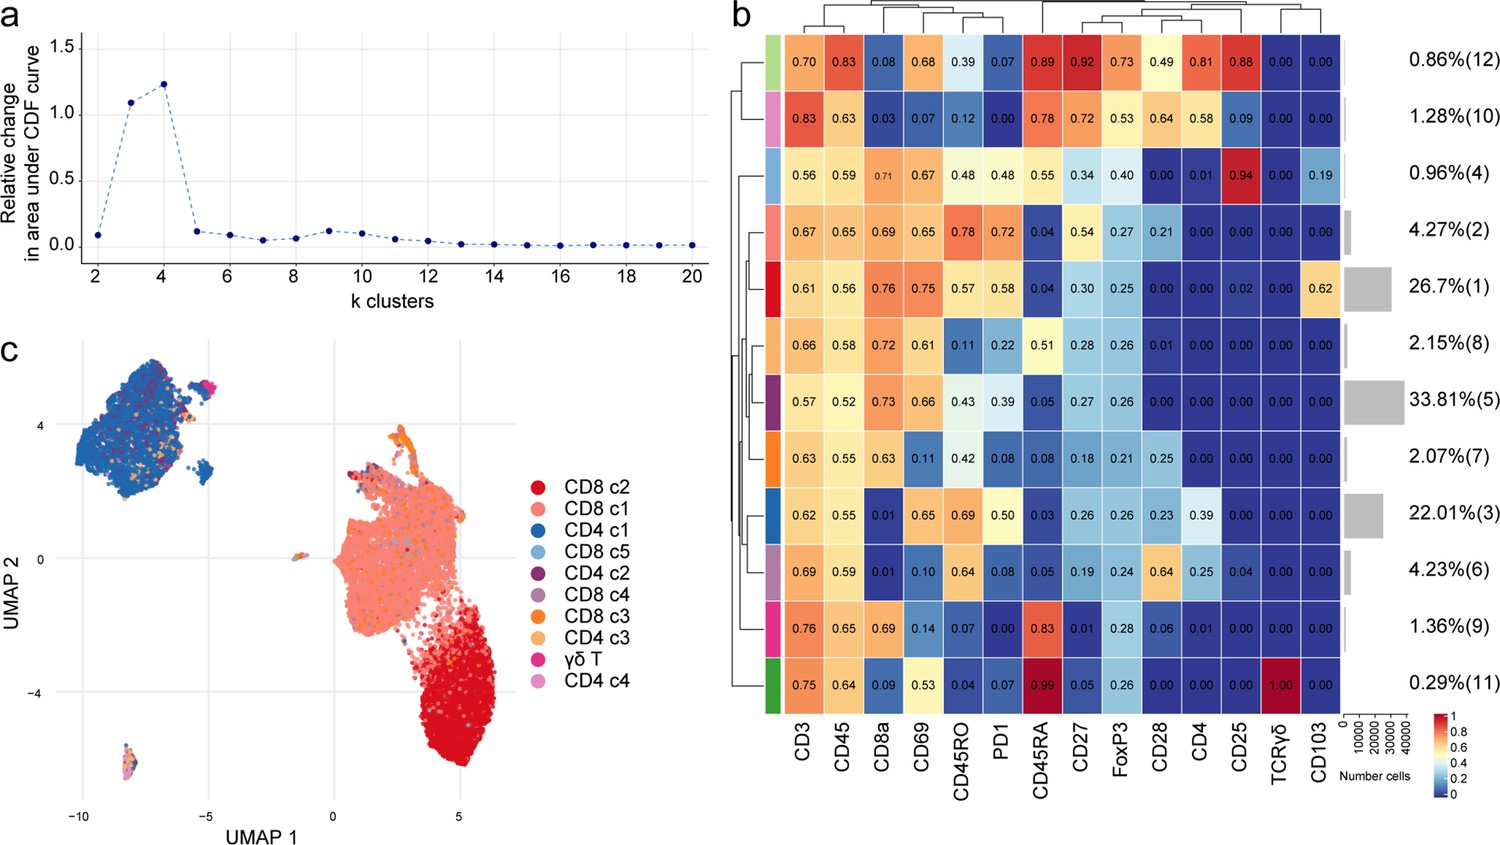
Phenotyping the T cell populations in the septum using mass cytometry.
(a) Delta area (‘elbow’) plot indicating the relative increase in cluster stability when clustering into k groups the 100 SOM clusters generated by FlowSOM. CDF: Consensus Cumulative Distribution Function. (b) Median marker intensities the ‘type’ markers across T cell lineage populations of the septum obtained with FlowSOM and ConsensusClusterPlus. Horizontal gray bars show the percentage out of the total cells. The color in the heatmap represents the median of the arcsinh, 0–1 transformed marker expression calculated over cells from all the samples. The left dendrogram is based on the hierarchical clustering with average linkage and Euclidean distance between the clusters. (c) UMAP plot based on the arcsinh-transformed expression of the 14 ‘type’ markers in the T cell subsets in the septum. A subset of 1000 randomly selected cells per sample is shown, colored according to the manually annotated clusters. Source data is listed in Source data 1.
Figure 2—figure supplement 2
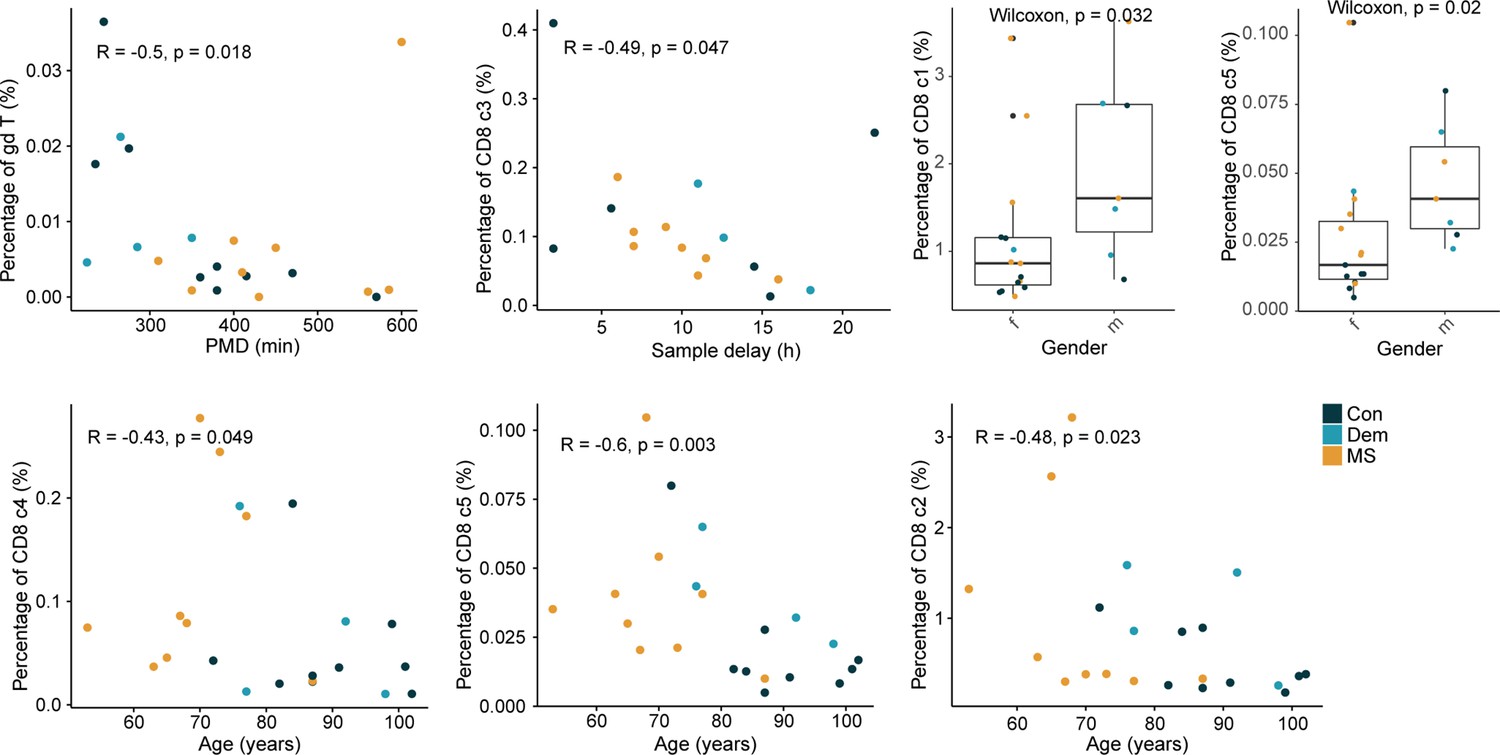
Correlations between the percentage of T cells and different clinical parameters.
Dot plots show the significant correlations (p<0.05) found between the percentage of the T cell subsets of the septum and clinical sample parameters. Spearman’s rank correlation rho is shown for non-normally distributed data and Pearson’s correlation for normally distributed data. Boxplots show the percentage of cells in females (f) and males (m). Con: controls; Dem: dementia; MS: multiple sclerosis. Source data is listed in Source data 1.
Figure 3 with 4 supplements
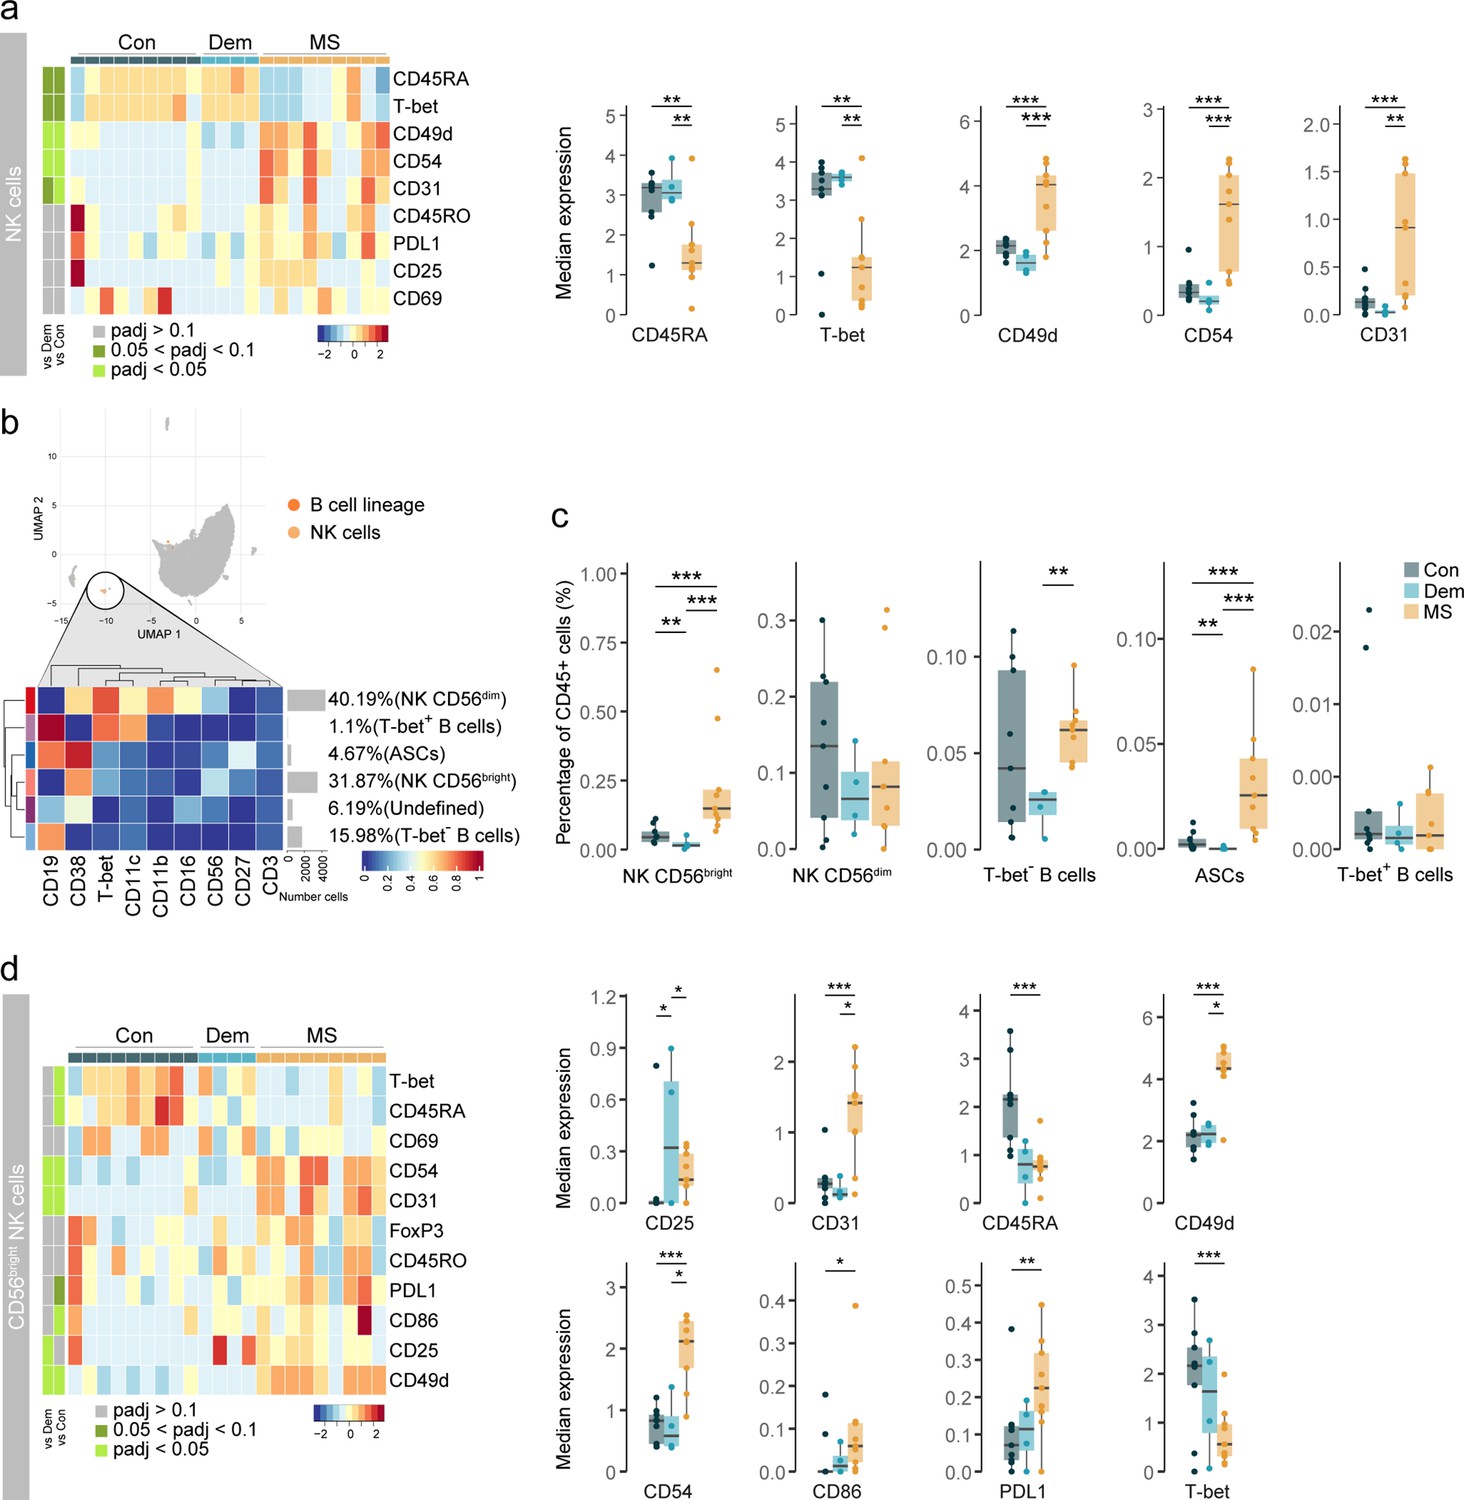
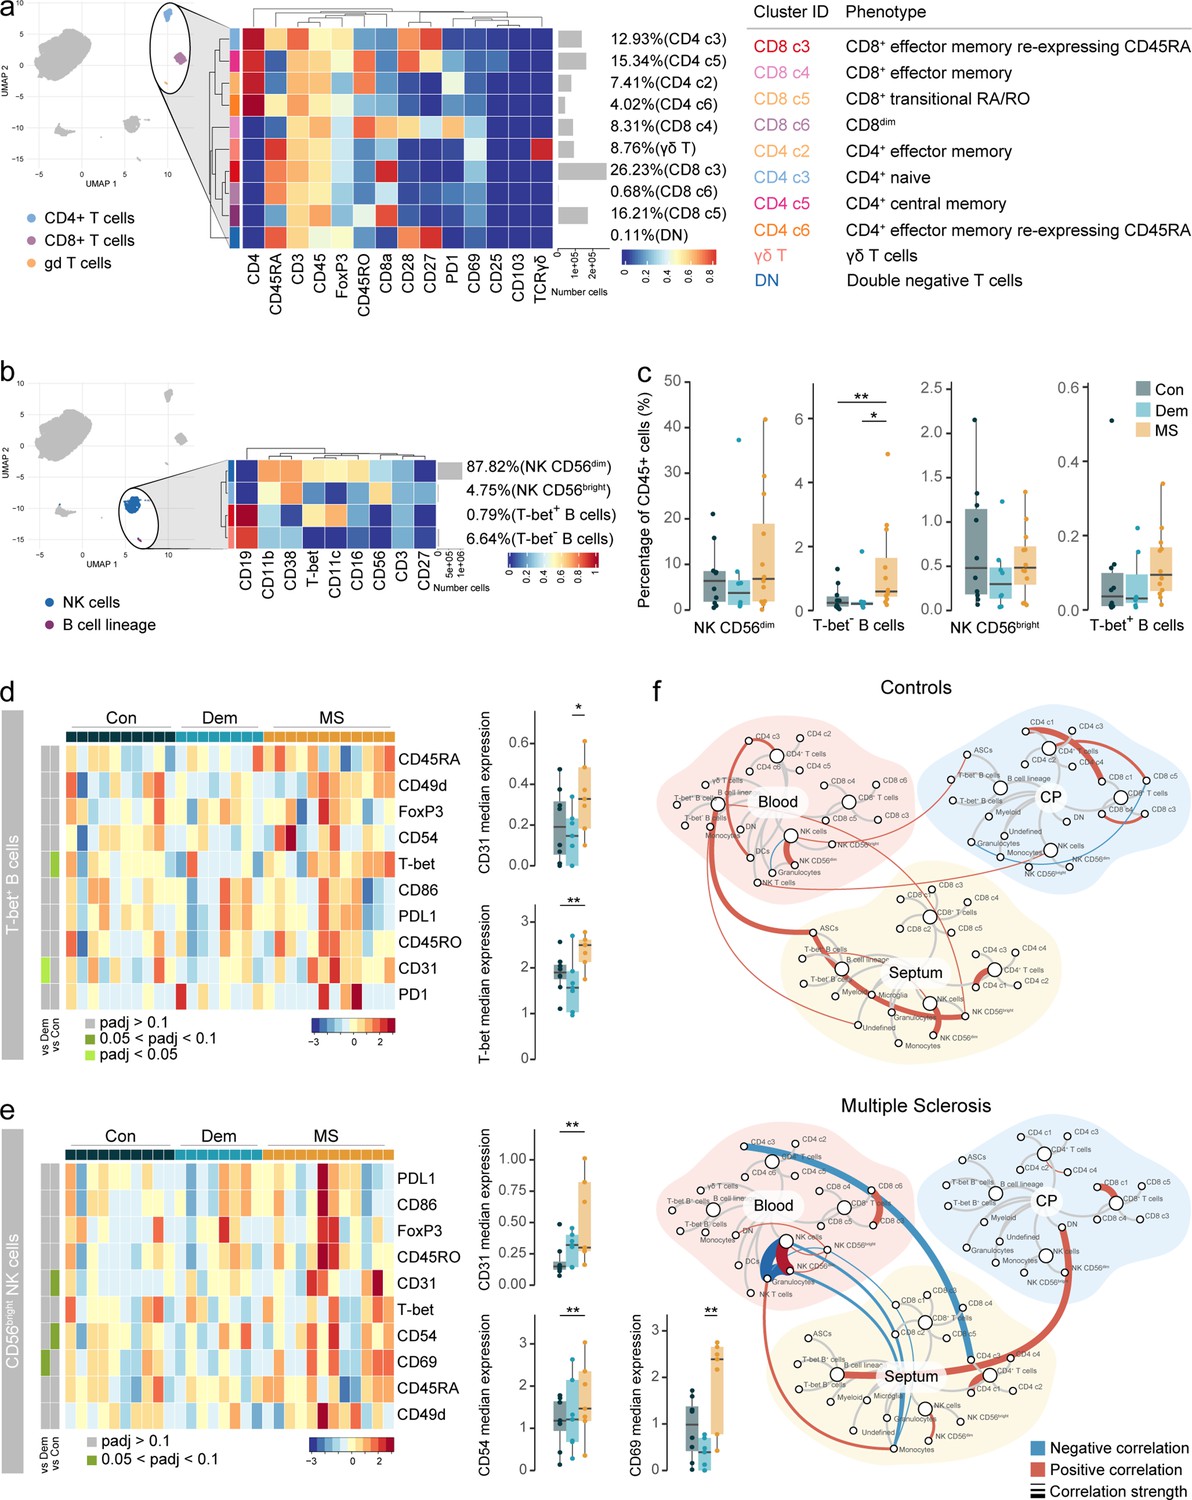
Activated CD56bright NK cells and antibody-secreting cells accumulate in the MS septum.
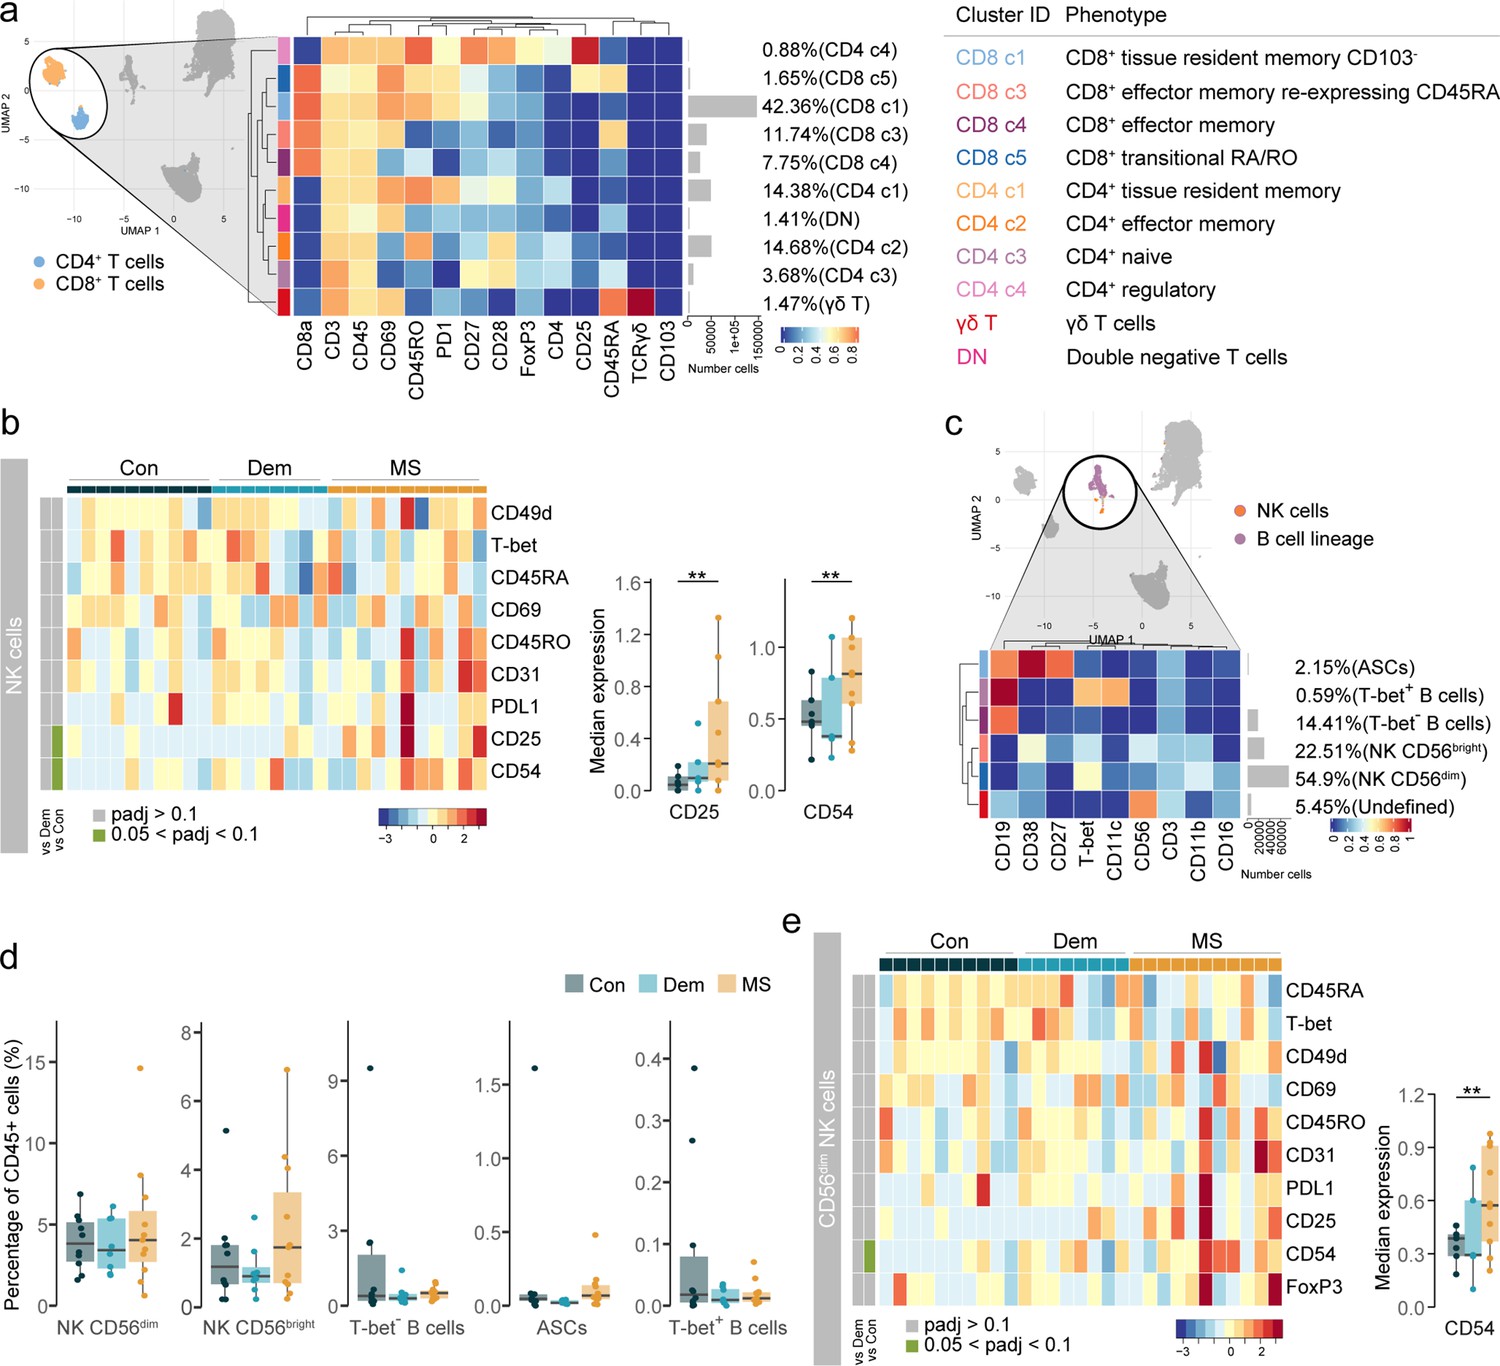
(a) Median scaled intensities of the ‘state’ markers in NK cells across all septum samples. Column annotation shows disease groups; row annotation shows adjusted p-values of comparing MS vs dementia and MS vs control. Color key shows row Z score. Boxplots show median expression in NK cells of markers with differential expression between MS and control samples. (b) Median scaled intensities of the ‘type’ markers across NK cell and B cell lineage populations in the septum. The horizontal gray bars show the percentage of each cluster out of the total investigated cells. (c) Percentage of each annotated cell population out of the total CD45+ cells from the septum of controls, dementia, and MS donors. (d) Median scaled intensities of the ‘state’ (phenotype) markers in CD56bright NK cells across all septum samples. Column annotation shows disease groups; row annotation shows adjusted p-values of comparing MS vs dementia and MS vs control samples. Color key shows row Z score. Boxplots on the right show median expression in CD56bright NK cells of markers showing differential expression between the MS and control samples. NK: natural killer; ASCs: antibody-secreting cells. * adjusted p<0.1; ** adjusted p<0.05, *** adjusted p<0.01. Con: controls; Dem: dementia; MS: multiple sclerosis. Source data is listed in Source data 1.
Figure 3—figure supplement 1
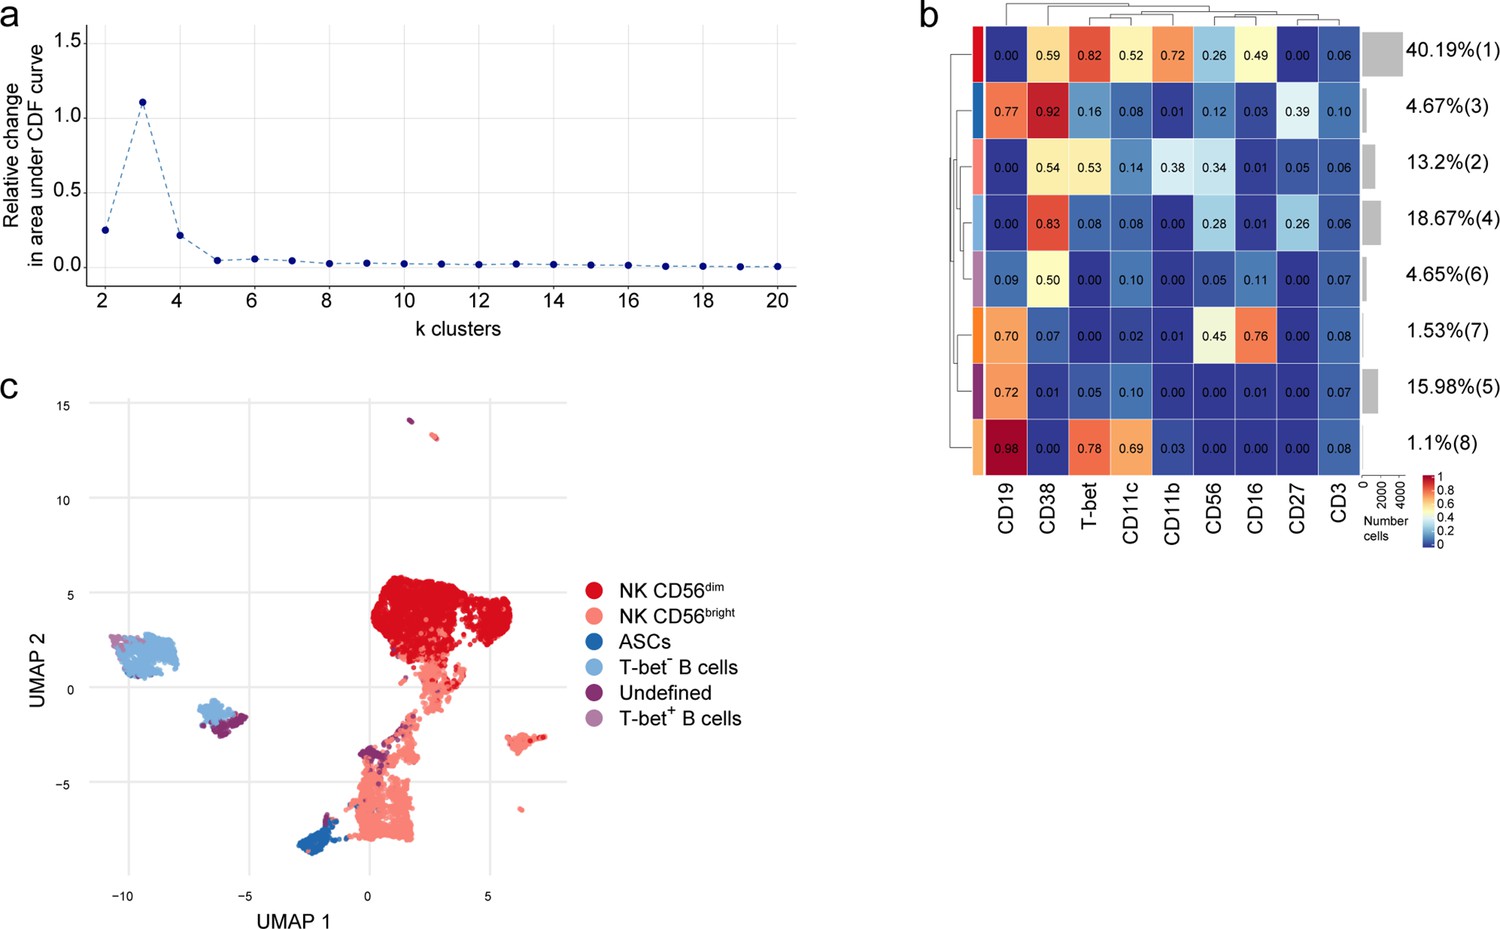
Subclustering of NK and B cell populations in the septum.
(a) Delta area (‘elbow’) plot indicating the relative increase in cluster stability when clustering into k groups the 100 SOM clusters generated by FlowSOM in the NK and B cell populations. CDF: Consensus Cumulative Distribution Function. (b) Median scaled intensities of the ‘type’ markers across NK and B cell lineage populations of the septum obtained with FlowSOM and ConsensusClusterPlus. Horizontal gray bars show the percentage out of the total cells. The color in the heatmap represents the median of the arcsinh, 0–1 transformed marker expression calculated over cells from all the samples. The left dendrogram is based on the hierarchical clustering with average linkage and Euclidean distance between metaclusters. (c) UMAP plot based on the arcsinh-transformed expression the ‘type’ markers in the NK and B cell lineage populations of the septum. A subset of 1000 randomly selected cells is shown, colored according to the manually annotated clusters. Source data is listed in Source data 1.
Figure 3—figure supplement 2
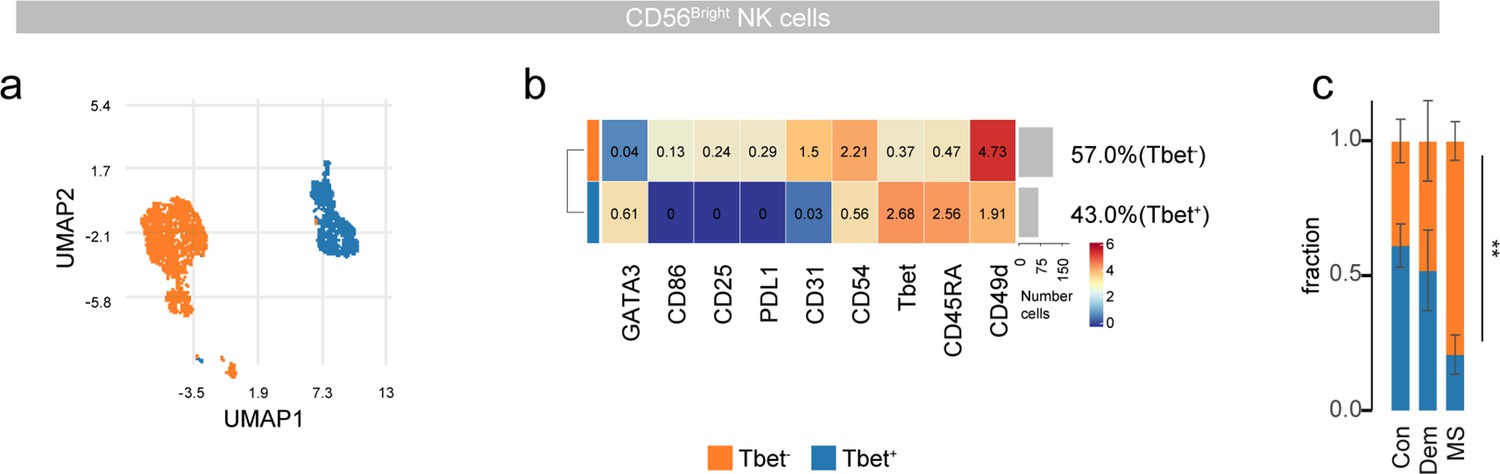
NK cell subclustering in the septum.
(a) UMAPs displaying pre-gated CD56bright NK subpopulation in the septum. The cells are colored according to PARC-guided clustering. (b) Median marker intensities of pre-selected markers across CD56bright NK subpopulations of the septum. Horizontal gray bars show the percentage out of the total cells. The color in the heatmap represents the median of the arcsinh, 0–1 transformed marker expression calculated over cells from all the samples. (c) Stacked bargraph show the fraction of T-bet- and T-bet +clusters measured by two-way ANOVA. Con: controls; Dem: dementia; MS: multiple sclerosis. Source data is listed in Source data 1.
Figure 3—figure supplement 3
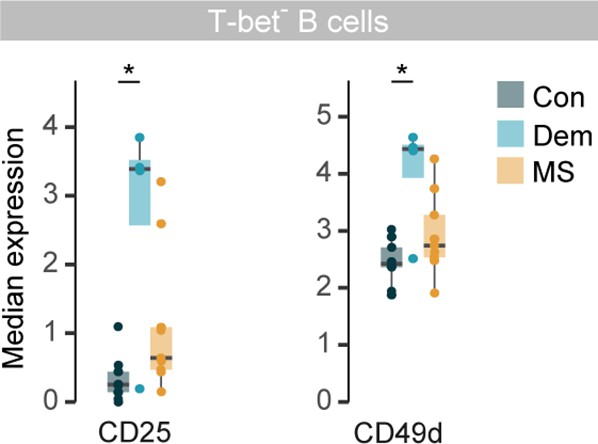
Marker expression in T-bet- B cells from the septum.
Boxplots display the median marker expression of CD25 and CD49d in T-bet- B cells from the septum. *adjusted p<0.1. Con: controls; Dem: dementia; MS: multiple sclerosis. Source data is listed in Source data 1.
Figure 3—figure supplement 4
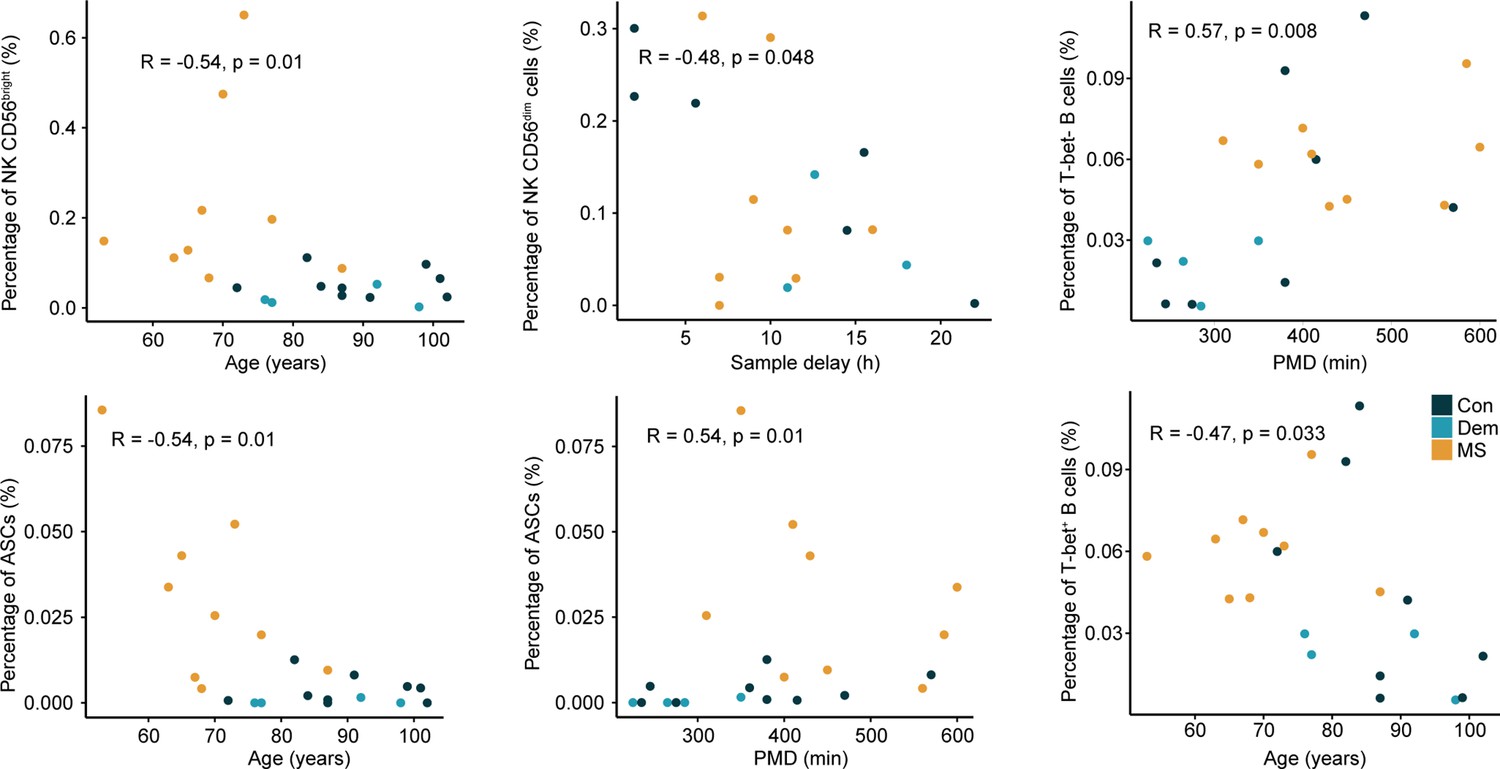
Correlation plots between the percentage of NK and B cell subsets and clinical parameters.
Dot plots show the significant correlations (p<0.05) found between the percentage of the septum NK and B cell subsets and clinical sample parameters. ** p<0.01. Spearman’s rank correlation rho is shown for non-normally distributed data and Pearson’s correlation for normally distributed data. Con: controls; Dem: dementia; MS: multiple sclerosis. Source data is listed in Source data 1.
Figure 4 with 2 supplements
Immune phenotyping of the choroid plexus using mass cytometry.
(a) UMAP plot based on the arcsinh-transformed expression of the ‘type’ (lineage) markers in the choroid plexus-derived immune cells. A subset of 1000 randomly selected cells per sample is shown, colored according to the manually annotated clusters. (b) Median scaled intensities of the ‘type’ (lineage) markers across choroid plexus-derived immune cell populations. The horizontal gray bars show the percentage of each cluster out of the total number of cells. (c) Percentage of each annotated cell population out of the total number of CD45+ cells from the choroid plexus of controls, dementia and MS donors. Con: controls; Dem: dementia; MS: multiple sclerosis. Source data is listed in Source data 2.
Figure 4—figure supplement 1
Demographic and clinical information.
Clinical parameters of the choroid plexus samples. Age and PMD (postmortem delay): pairwise comparisons using Wilcoxon rank-sum test with continuity correction; p-values adjusted with Benjamini-Hochberg method. Sample delay and pH: Kruskal-Wallis rank-sum test. Con: controls; Dem: dementia; MS: multiple sclerosis.
Figure 4—figure supplement 2
Immune phenotyping of the choroid plexus using mass cytometry.
(a) Bar plot of the number of cells used for clustering from each choroid plexus sample. A threshold was set at the 75th percentile to avoid over-representation of certain samples. (b) Delta area (‘elbow’) plot indicating the relative increase in cluster stability when clustering into k groups the 100 SOM clusters generated by FlowSOM. CDF: Consensus Cumulative Distribution Function. (c) Median scaled intensities of the ‘type’ markers across choroid plexus-derived cell populations obtained with FlowSOM and ConsensusClusterPlus. Horizontal gray bars show the percentage out of the total cells. The color in the heatmap represents the median of the arcsinh, 0–1 transformed marker expression calculated over cells from all the samples. The left dendrogram is based on the hierarchical clustering with average linkage and Euclidean distance between the 20 metaclusters. (d) UMAP plots based on the arcsinh-transformed expression of the ‘type’ markers in the choroid plexus-derived immune cells. A subset of 1000 randomly selected cells per sample is shown, colored according to the expression level of each marker. Con: controls; Dem: dementia; MS: multiple sclerosis. Source data is listed in Source data 2.
Figure 5 with 1 supplement
The choroid plexus in MS presents alterations in the NK cell populations.
(a) Median scaled intensities of the ‘type’ markers across T cell subsets in the choroid plexus. The table shows tentative biological names of the T cell subpopulations. (b) Median scaled intensities of the ‘state’ markers in NK cells across all choroid plexus samples. Column annotation shows disease groups; row annotation shows adjusted p-values of comparing dementia vs controls and MS vs control samples. Color key shows row Z score. Boxplots show median expression in NK cells of markers with differential expression between MS and controls. (c) Median scaled intensities of the ‘type’ markers across NK cell and B cell lineage populations in the choroid plexus. (d) Percentage of each annotated NK or B cell population out of the total number of CD45+ cells from the choroid plexus of controls, dementia, and MS donors. (e) Median scaled intensities of the ‘state’ markers in CD56dim NK cells across all choroid plexus samples. Column annotation shows disease groups; row annotation shows adjusted p-values of comparing dementia vs control and MS vs control samples. Color key shows row Z score. Boxplot shows median expression in CD56dim NK cells of the marker with differential expression between MS and control. ** adjusted p<0.05. Con: controls; Dem: dementia; MS: multiple sclerosis. (a, c) The horizontal gray bars show the percentage out of the total cells. Source data is listed in Source data 2.
Figure 5—figure supplement 1
Immune phenotyping of the T cell, NK and B cell subsets in choroid plexus.
(a) Median scaled intensities of the ‘type’ markers across T cell clusters of the choroid plexus obtained with FlowSOM and ConsensusClusterPlus. (b) Percentage of each annotated cell population out of the total number of T cells (CD4+ and CD8+) from the choroid plexus of control, dementia, and MS donors. (c) Median scaled intensities of the ‘type’ markers across NK and B cell lineage populations of the choroid plexus obtained with FlowSOM and ConsensusClusterPlus. (a, c) Horizontal gray bars show the percentage out of the total cells. The color in the heatmap represents the median of the arcsinh, 0–1 transformed marker expression calculated over cells from all the samples. The left dendrogram is based on the hierarchical clustering with average linkage and Euclidean distance between the clusters. Con: controls; Dem: dementia; MS: multiple sclerosis. Source data is listed in Source data 2.
Figure 6 with 2 supplements
Immune phenotyping reveals an accumulation of B cells in postmortem MS blood.
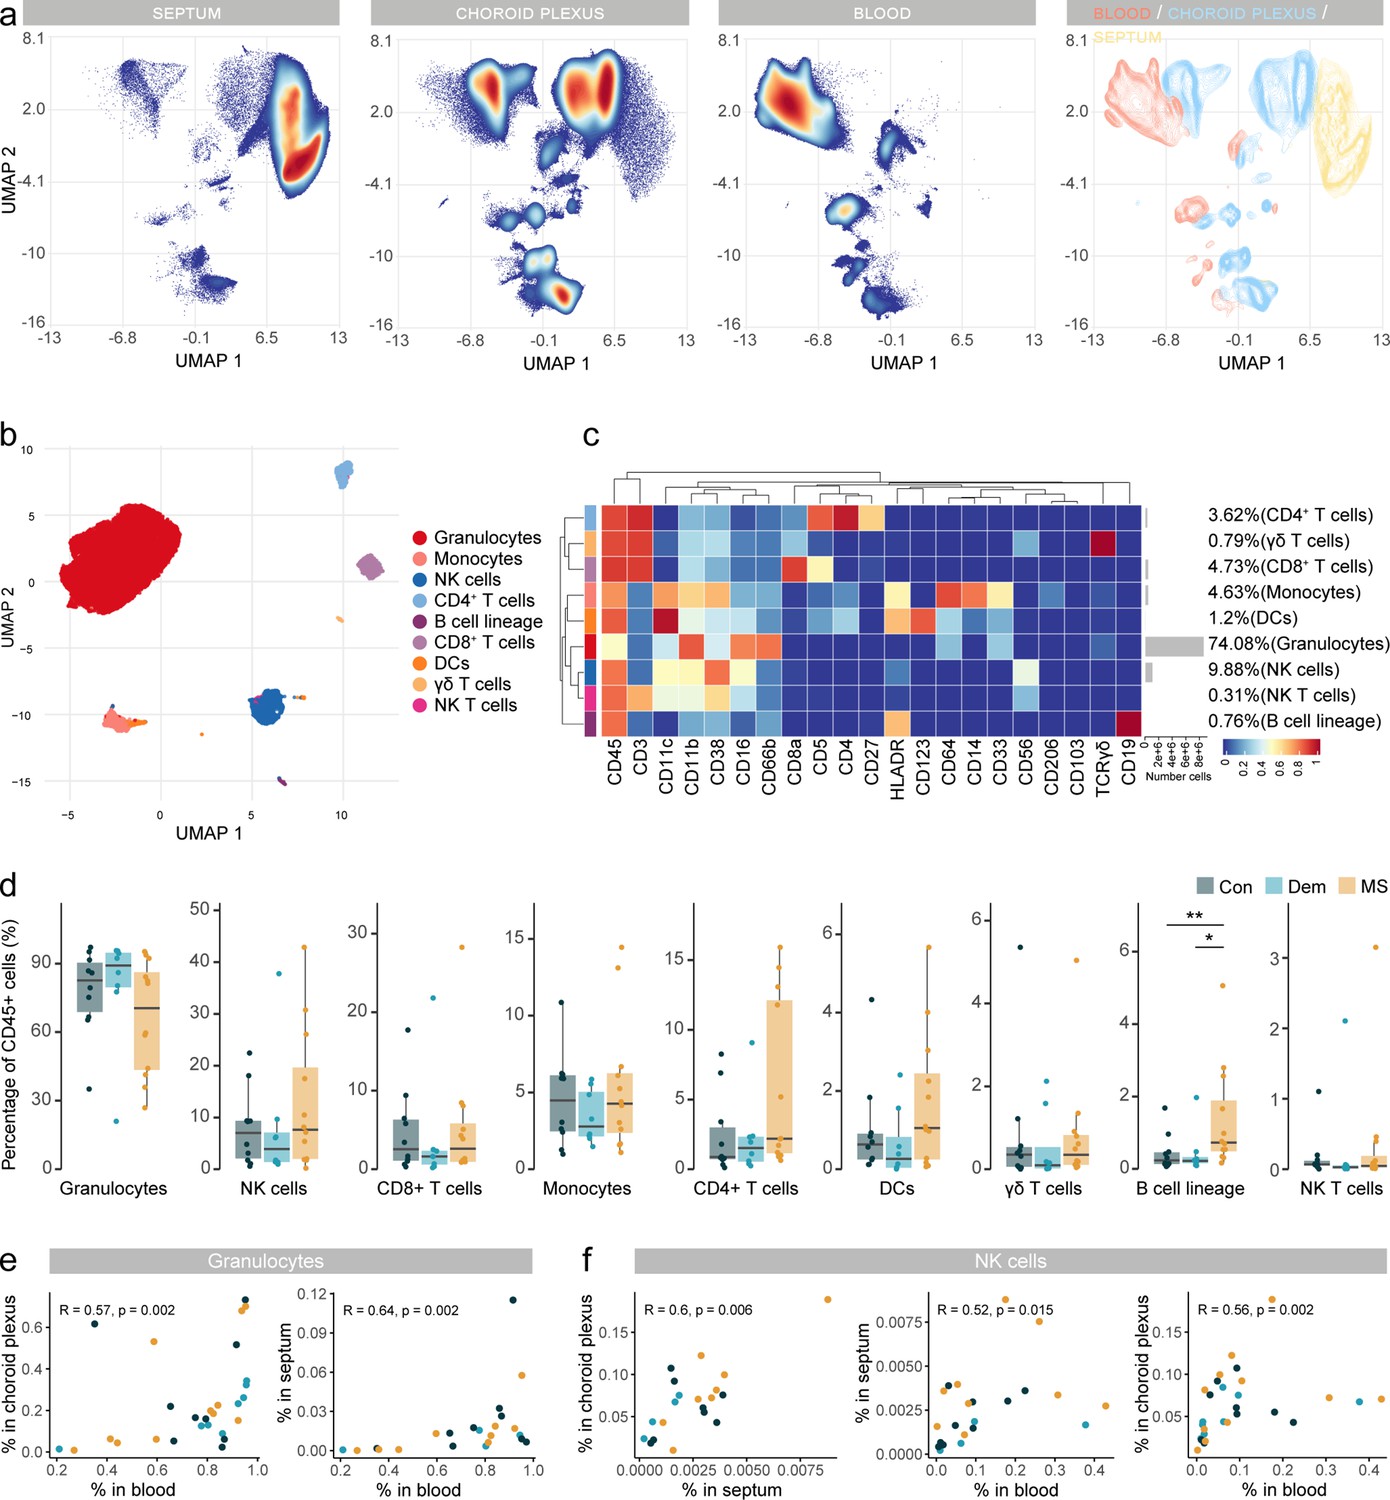
(a) UMAP plot based on the arcsinh-transformed expression of all markers in the immune cells of the septum, choroid plexus, and blood. A total of 100,000 randomly selected cells were selected per sample. The first three plots are colored according to the density. The final plot shows an overlay figure where cells are colored by their tissue of origin. (b) UMAP plot based on the arcsinh-transformed expression of the ‘type’ (lineage) markers in the blood-derived immune cells. A subset of 1000 randomly selected cells per sample is shown, colored according to the manually annotated clusters. (c) Median scaled intensities of the ‘type’ markers across blood-derived immune cell populations. Horizontal gray bars show the percentage out of the total cells. (d) Percentage of each annotated cell population out of the total number of CD45+ cells from the blood of control, dementia, and MS donors. (e) Scatter plots showing correlations between the proportions of granulocytes in blood, choroid plexus, and septum. Each dot represents a sample, colored by disease group. (f) Scatter plots showing correlations between the proportions of NK cells in different tissues. Each dot represents a sample, colored by disease group. R: Spearman’s Rho rank correlation coefficient; p=p-value. * adjusted p<0.1; ** adjusted p<0.05. Con: controls; Dem: dementia; MS: multiple sclerosis. Source data for a, e, f is listed in Source data 1–3; for b, c, d in Source data 3.
Figure 6—figure supplement 1
Demographic and clinical information.
Clinical parameters of the blood samples. Age and PMD (post-mortem delay): pairwise comparisons using Wilcoxon rank-sum test with continuity correction; p-values adjusted with Benjamini-Hochberg method. Sample delay and pH: Kruskal-Wallis rank-sum test. Con: controls; Dem: dementia; MS: multiple sclerosis.
Figure 6—figure supplement 2
Immune phenotyping of the main immune cell populations in blood and their correlations with those in septum and choroid plexus.
(a) Bar plot of the number of cells used for clustering from each blood sample. A threshold was set at the 75th percentile to avoid over-representation of certain samples. (b) Delta area (‘elbow’) plot indicating the relative increase in cluster stability when clustering into k groups the 100 SOM clusters generated by FlowSOM. CDF: Consensus Cumulative Distribution Function. (c) UMAP plot based on the arcsinh-transformed expression of all markers in the immune cells of the septum, choroid plexus and blood. 100,000 cells were randomly selected per sample, colored according to the expression level of each marker. (d) Median scaled intensities of the ‘type’ markers across blood-derived cell populations obtained with FlowSOM and ConsensusClusterPlus. Horizontal gray bars show the percentage out of the total cells. The color in the heatmap represents the median of the arcsinh, 0–1 transformed marker expression calculated over cells from all the samples. The left dendrogram is based on the hierarchical clustering with average linkage and Euclidean distance between the 20 metaclusters. (e) Spearman correlation matrix of the proportion of the main immune cell populations among the studied tissues. Positive correlations are displayed in red and negative correlations in blue. The size of the circle is proportional to the correlation coefficients. p-Values adjusted with Benjamini-Hochberg method, excluding intra-tissue correlations. * adjusted p<0.1. Con: controls; Dem: dementia; MS: multiple sclerosis. Source data is listed in Source data 3.
Figure 7 with 2 supplements
Circulating Tbet+ B cells in MS express higher levels of T-bet.
(a) Median scaled intensities of the ‘type’ markers across T cell subpopulations in blood. Table shows tentative biological names of the T cell subpopulations. (b) Median scaled intensities of the ‘type’ markers across NK cell and B cell lineage populations in blood. (c) Percentage of NK and B cell lineage populations out of the total CD45+ cells from the blood of control, dementia and MS donors. (d) Median scaled intensities of the ‘state’ markers in T-bet+ B cells across all blood samples. Column annotation shows disease groups; row annotation shows adjusted p-values of comparing dementia vs control and MS vs control. Color key shows row Z score. Boxplots show median expression in T-bet+ B cells of markers with differential expression between MS and control. (e) Median scaled intensities of ‘state’ markers in CD56bright NK cells across all blood samples. Column annotation shows disease groups; row annotation shows adjusted p-values of comparing dementia vs control and MS vs control samples. Color key shows row Z score. Boxplots show median expression in CD56bright NK cells of markers with differential expression between MS and control. (f) Network plot illustrating correlations between identified immune subsets in the three anatomical sites analysed. Positive correlations are displayed in red and negative correlations in blue. Width of the line is proportional to the correlation coefficients. p-Values adjusted with Benjamini-Hochberg method. ** adjusted p<0.05. Con: controls; Dem: dementia; MS: multiple sclerosis (a, b) Horizontal gray bars show the percentage out of the total cells. Source data for a, b, c, d, e is listed in Source data 3; for f in Source data 1–3.
Figure 7—figure supplement 1
Immune phenotyping of the T cell, NK and B cell subsets in blood and their correlations with those in septum and choroid plexus.
(a) Median scaled intensities of the ‘type’ markers across T cell clusters in the blood obtained with FlowSOM and ConsensusClusterPlus. (b) Percentage of each annotated cell population out of the total number of T cells (CD4+, CD8+, and γδ T) from the septum of control, dementia and MS donors. (a, b) Horizontal gray bars show the percentage out of the total cells. The color in the heatmap represents the median of the arcsinh, 0–1 transformed marker expression calculated over cells from all the samples. The left dendrogram is based on the hierarchical clustering with average linkage and Euclidean distance between the clusters. Con: controls; Dem: dementia; MS: multiple sclerosis. Source data is listed in Source data 3.
Figure 7—figure supplement 2
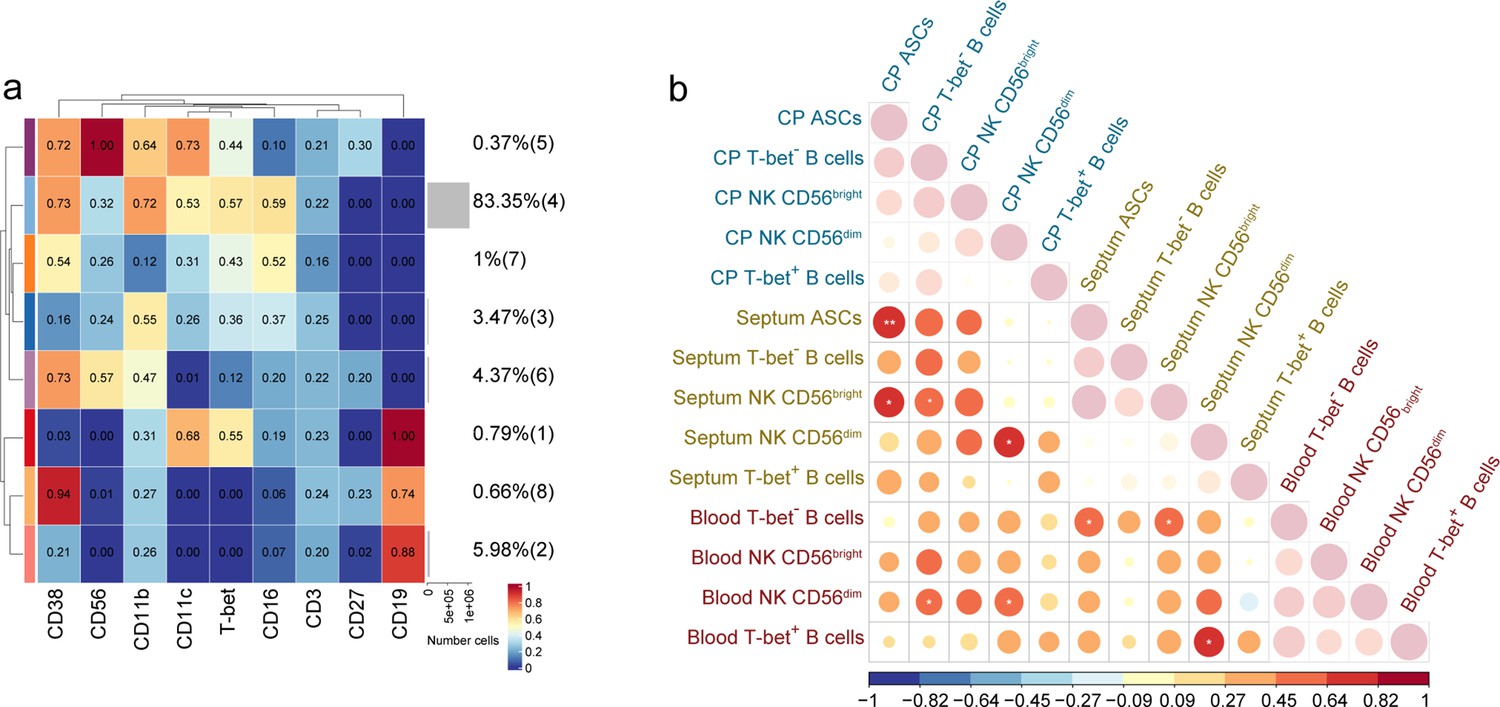
Median intensity of NK and B cell subsets in blood and correlations of their proportions with those in septum and choroid plexus.
(a) Median scaled intensities of the ‘type’ markers across NK and B cell lineage populations in the blood obtained with FlowSOM and ConsensusClusterPlus. (b) Spearman correlation matrix of the proportion of NK and B cell populations among the studied tissues. Positive correlations are displayed in red and negative correlations in blue. The size of the circle is proportional to the correlation coefficients. p-Values adjusted with Benjamini-Hochberg method, excluding intra-tissue correlations. * adjusted p<0.1. Source data is listed in Source data 1–3.
Figure 8
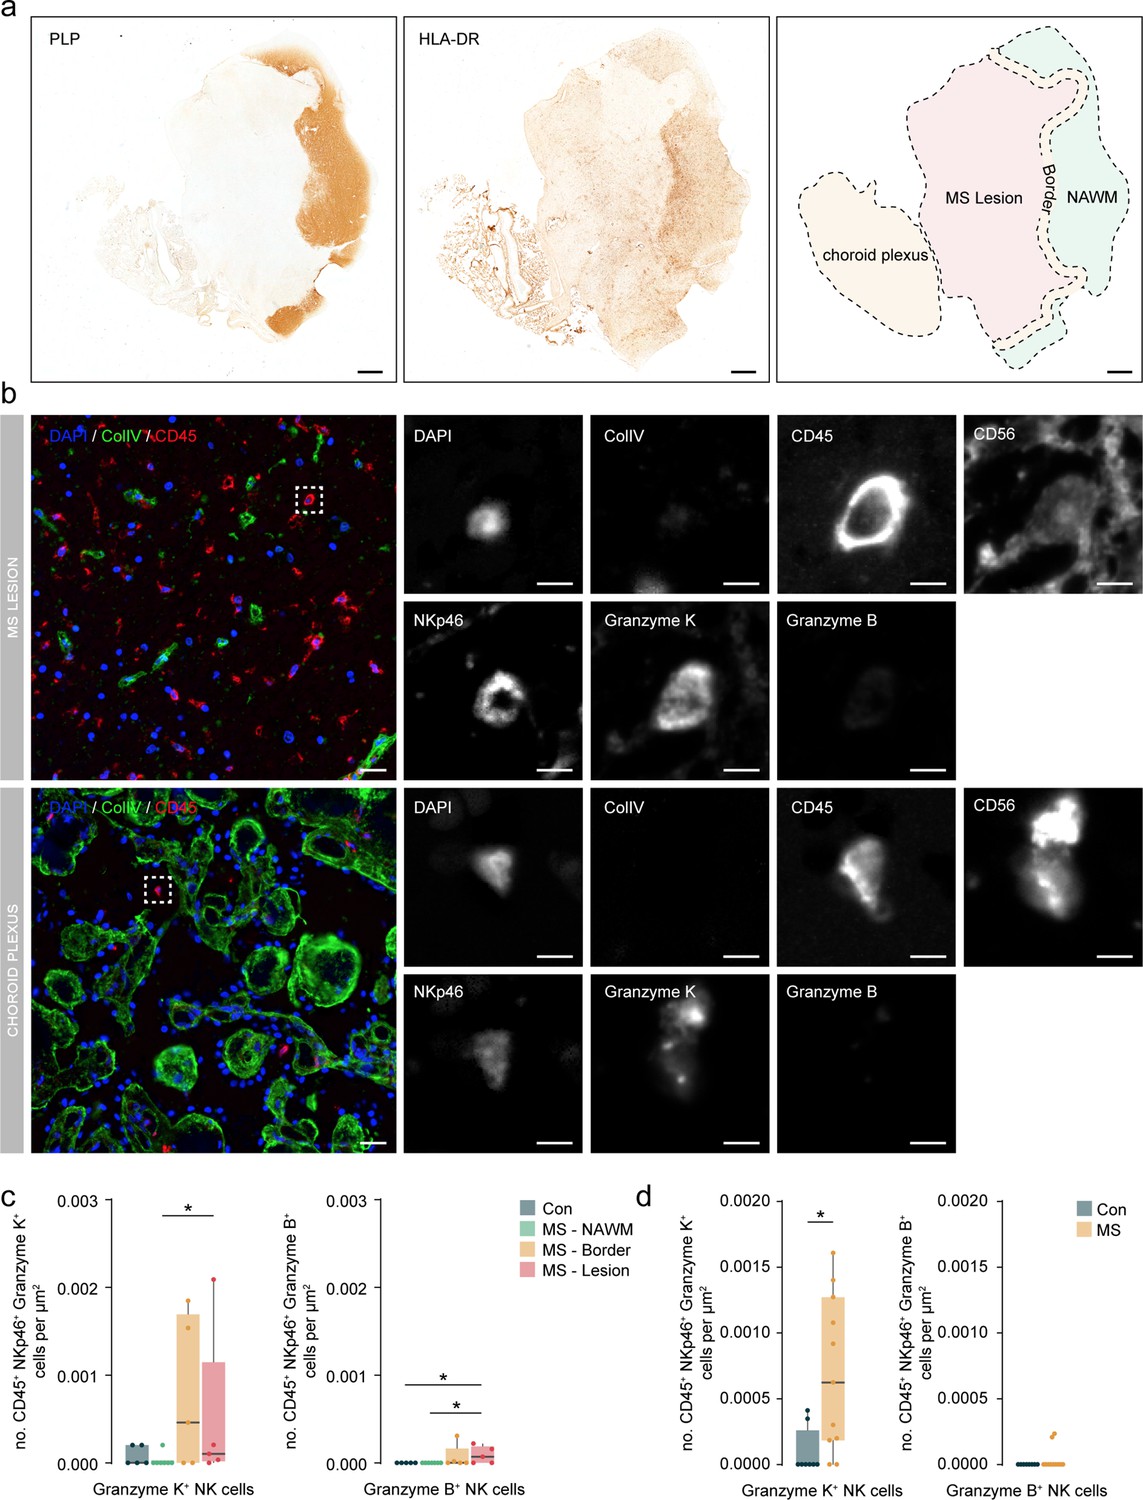
Granzyme K+ NK cells accumulate in periventricular lesions and choroid plexus.
(a) Representative immunohistochemical staining of myelin with proteolipid protein (PLP) and presence of immune cells with HLA-DR. The overview shows the location of the normal-appearing white matter (NAWM), the lesion border, the lesion, and the choroid plexus. Scale bar = 1 mm. (b) Representative multiplex immunohistochemical staining of MS lesion and the choroid plexus. The merged overview shows DAPI (blue), ColIV (green), and CD45 (red). The dotted box indicates CD45+ NKp46+ Granzyme K+ cell. A magnified image of all separate channels is shown in grayscale. Scalebar = 25 um for overview and 5 um for magnifications. (c) Boxplots display the abundance of CD45+ NKp46+ Granzyme K+ and CD45+ NKp46+ Granzyme B+ cells per µm2 in MS lesions. Con: controls; MS: multiple sclerosis; NAWM: normal-appearing white matter; * p<0.05. (d) Boxplots display the abundance of CD45+ NKp46+ Granzyme K+ and CD45+ NKp46+ Granzyme B+ cells per µm2 in choroid plexus. Con: controls; MS: multiple sclerosis. * p<0.05.
Author response image 1
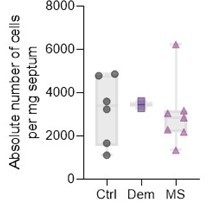
Absolute live immune cell numbers per mg of septum.
Author response image 2

CD56bright NK cells and myeloid cells subpopulations in septum.
(a) UMAPs displaying pre-gated CD56bright NK subpopulation in the septum. The cells are coloured according to PARC-guided clustering. (b) Median marker intensities of pre-selected markers across CD56bright NK subpopulation of the septum. Horizontal grey bars show the percentage out of the total cells. The colour in the heatmap represents the median of the arcsinh, 0-1 transformed marker expression calculated over cells from all the samples. (c) Stacked bargraph show the fraction of T-bet- and T-bet+ clusters measured by ANOVA. (d) UMAPs displaying pre-gated myeloid subpopulation in the septum. The cells are coloured according to PARC-guided clustering. (e) Median marker intensities of pre-selected markers across myeloid subpopulation of the septum. Horizontal grey bars show the percentage out of the total cells. The colour in the heatmap represents the median of the arcsinh, 0-1 transformed marker expression calculated over cells from all the samples. (f) Stacked bargraph show the fraction of each of the three clusters. ** P < 0.01. Con: controls; Dem: dementia; MS: multiple sclerosis.
Author response image 3

Spearman correlation matrix of the proportion of the main immune cell populations among the studied tissues in the control and MS samples, separately.
Positive correlations are displayed in red and negative correlations in blue. The size of the circle is proportional to the correlation coefficients. P-values adjusted with Benjamini-Hochberg method, excluding intra-tissue correlations. * adjusted P < 0.1.
Tables
Author response table 1
Yield of isolated live immune cells per mg of septal tissue.
| Donor | Yield (cells/mg) | Condition |
|---|---|---|
| 2018-120 | 4782.3 | Control |
| 2018-123 | 1666.2 | Control |
| 2019-054 | 3231.4 | Control |
| 2019-079 | 3596.2 | Control |
| 2020-003 | 4861.1 | Control |
| 2020-028 | 1110.4 | Control |
| 2019-030 | 3286.3 | Dementia |
| 2020-013 | 3607.5 | Dementia |
| 2019-016 | 3052.9 | MS |
| 2019-027 | 2183.0 | MS |
| 2019-031 | 6232.0 | MS |
| 2019-069 | 3175.9 | MS |
| 2019-107 | 2288.9 | MS |
| 2019-109 | 1345.3 | MS |
| 2019-110 | 2846.6 | MS |
Additional files
-
Transparent reporting form
- https://cdn.elifesciences.org/articles/73849/elife-73849-transrepform1-v2.docx
-
Supplementary file 1
Information of the donors used in this study.
- https://cdn.elifesciences.org/articles/73849/elife-73849-supp1-v2.xlsx
-
Supplementary file 2
Antibody panel used for CyTOF.
- https://cdn.elifesciences.org/articles/73849/elife-73849-supp2-v2.xlsx
-
Supplementary file 3
Details of antibodies used for multiplex immunohistochemistry.
- https://cdn.elifesciences.org/articles/73849/elife-73849-supp3-v2.xlsx
-
Source data 1
Percentage of each annotated cell population out of the total CD45+ cells from the choroid plexus of controls (Con), dementia (AD) and multiple sclerosis (MS) donors.
Median scaled intensities of the “state” (phenotype) markers for each cell population.
- https://cdn.elifesciences.org/articles/73849/elife-73849-data1-v2.xlsx
-
Source data 2
Percentage of each annotated cell population out of the total CD45+ cells from the choroid plexus of controls (Con), dementia (AD) and multiple sclerosis (MS) donors.
Median scaled intensities of the “state” (phenotype) markers for each cell population.
- https://cdn.elifesciences.org/articles/73849/elife-73849-data2-v2.xlsx
-
Source data 3
Percentage of each annotated cell population out of the total CD45+ cells from the blood of controls (Con), dementia (AD) and multiple sclerosis (MS) donors.
Median scaled intensities of the “state” (phenotype) markers for each cell population.
- https://cdn.elifesciences.org/articles/73849/elife-73849-data3-v2.xlsx
Download links
A two-part list of links to download the article, or parts of the article, in various formats.
Downloads (link to download the article as PDF)
Open citations (links to open the citations from this article in various online reference manager services)
Cite this article (links to download the citations from this article in formats compatible with various reference manager tools)
Single-cell profiling reveals periventricular CD56bright NK cell accumulation in multiple sclerosis
eLife 11:e73849.
https://doi.org/10.7554/eLife.73849


