Recurrent neural networks enable design of multifunctional synthetic human gut microbiome dynamics
- Department of Systems and Control Engineering, Indian Institute of Technology, India
- Division of Data & Decision Sciences, Tata Consultancy Services Research, India
- Department of Biochemistry, University of Wisconsin-Madison, United States
- Department of Chemical & Biological Engineering, University of Wisconsin-Madison, United States
- Department of Electrical Engineering & Computer Science, University of Michigan, United States
- Department of Biomedical Engineering, University of Michigan, United States
- Department of Statistics, University of Michigan, United States
- Department of Bacteriology, University of Wisconsin-Madison, United States
Figures
Figure 1
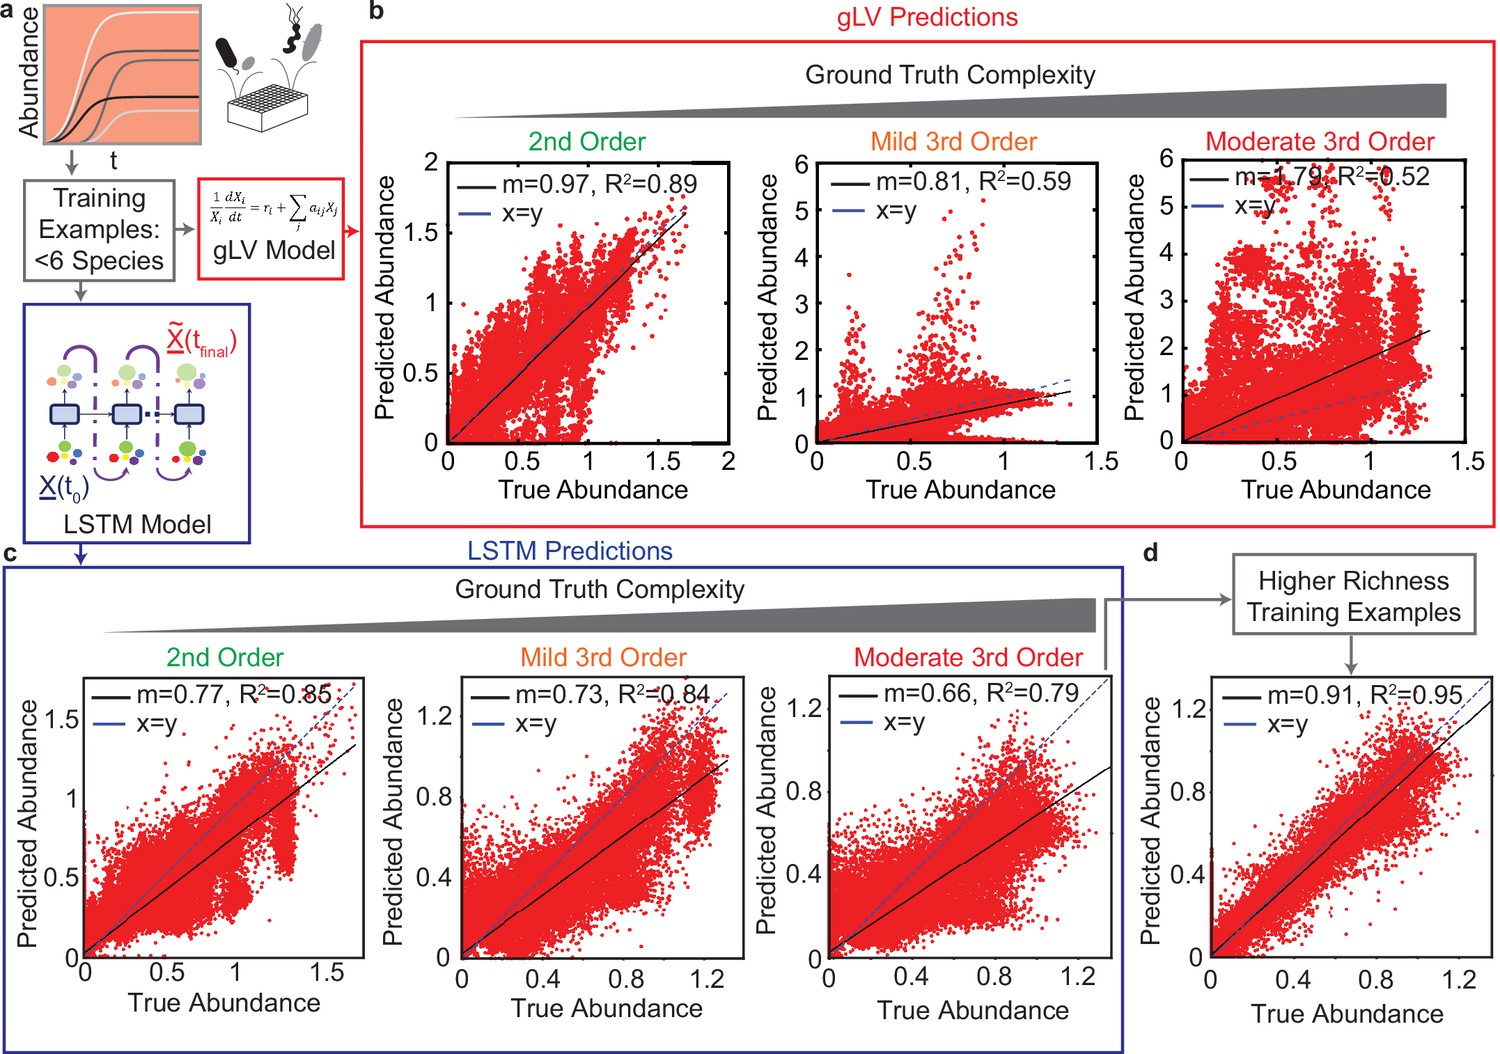
Comparison of generalized Lotka Volterra (gLV) and Long Short Term Memory (LSTM) model prediction performance of species abundance in a 25-member microbial community in response to third-order perturbations of varying magnitude.
For both models, training data consists of low species richness communities ( species, , Pearson correlation p-value lt0.0001). (a) & (d): Data was generated using a gLV model that captures monospecies growth and pairwise interactions. Scatter plots of true versus predicted species abundance at using the gLV and LSTM models, respectively. represents a vector of species abundances. (b) & (e) Scatter plot of true versus predicted species abundance of the gLV and LSTM models, respectively when the simulated data is subjected to low magnitude (mild) third-order interactions. (c) & (f) Scatter plot of true versus predicted species abundance of gLV and LSTM models, respectively when the simulated data is further subjected to moderately large third-order interactions. (g) Scatter plot of true versus predicted species abundance for the LSTM model. The training set included a set of higher richness communities (50 each of 11 and 19 member communities). All predictions are forecasted from the species abundance at time 0.
Figure 2 with 1 supplement
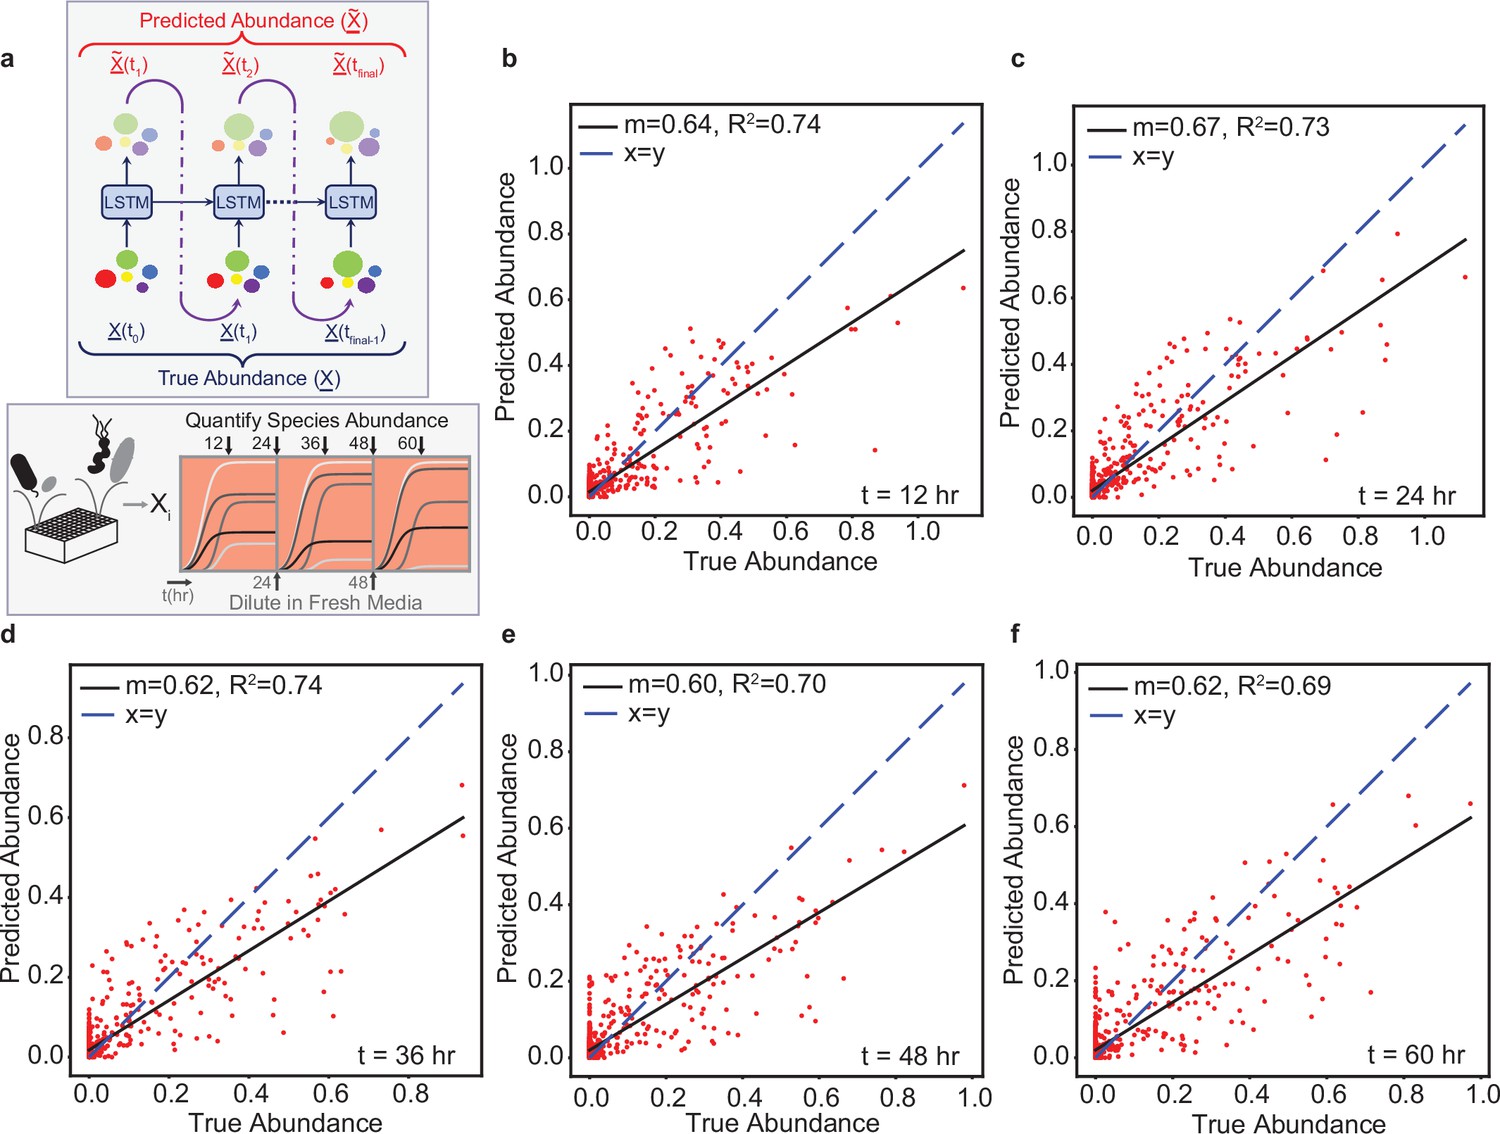
The LSTM model can predict the temporal changes in species abundance in a 12-member synthetic human gut community in response to periodic dilution (passaging).
(a) Proposed LSTM modeling methodology for the dynamic prediction of species abundance in a microbial community. The initial abundance information is an input to the first LSTM cell, the output of which is trained to predict abundance at the next time point. Consequently, the predicted abundance becomes an input to another LSTM cell with shared weights to predict the abundance at the subsequent time point. The process is repeated until measurements at all time points are available. represents a vector of species abundances. Thus, all predictions are forecasted from the abundance at time 0. (b) Scatter plot of measured (true) and predicted species abundance of a 12-member synthetic human gut community at 12 hr (, p-value ). (c) Scatter plot of measured (true) and predicted abundance at 24 hr (p-value ). (d) Scatter plot of measured (true) and predicted abundance at 36 hr (p-value ). (e) Scatter plot of measured (true) and predicted abundance at 48 hr (p-value ). (f) Scatter plot of measured (true) and predicted abundance at 60 hr (p-value ).
Figure 2—figure supplement 1
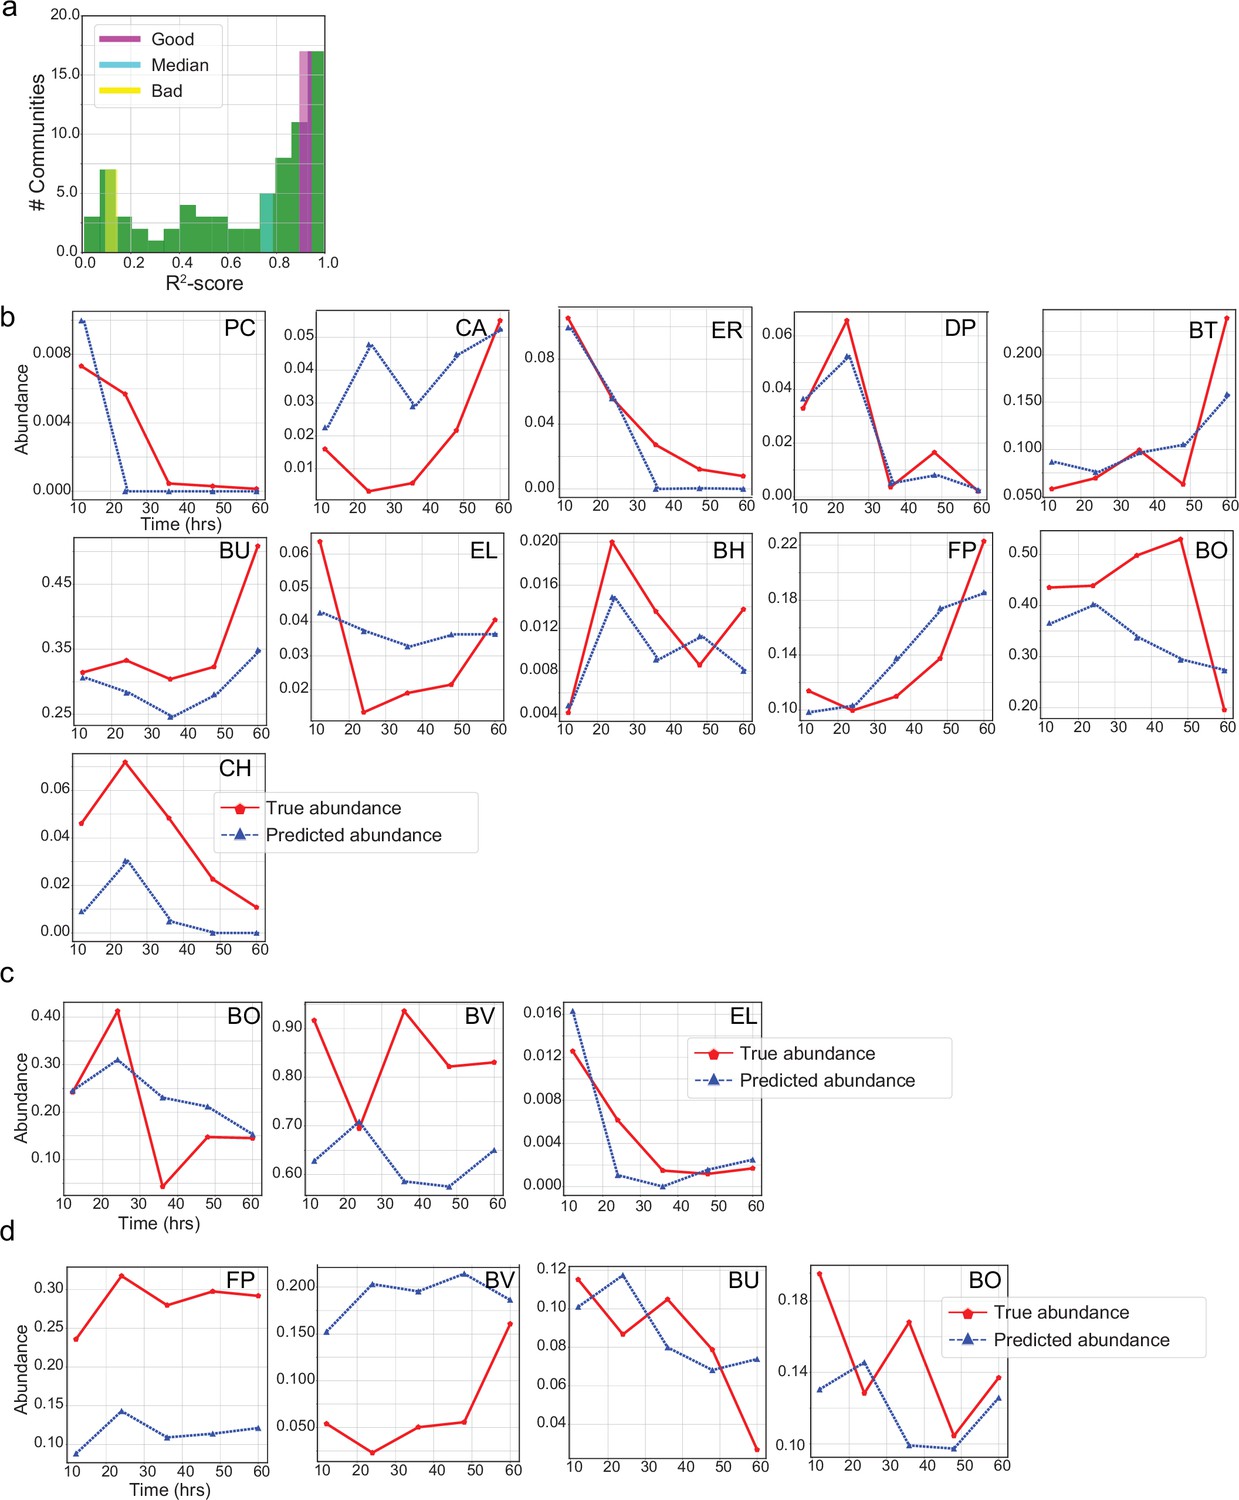
Prediction of temporal changes of species abundance for a few representative communities by the LSTM network.
(a) Histogram of prediction -scores on the test set. The prediction -score for each community is determined between the measured (true) and predicted abundances of all species in that community at all time instants. Prediction of individual species abundance in communities that display (b) accurate predictions (11-member community), (c) close to the median (3-member), and (d) poor predictions (four-member). We note the difference in abundance scales for some species such as BH and BO. Despite the order of magnitude difference in the scales, our proposed LSTM network does a great job at predicting species abundance with consistency across all species in (a). This is primarily due to feature standardization during the training and inference of LSTM networks.
Figure 3 with 7 supplements
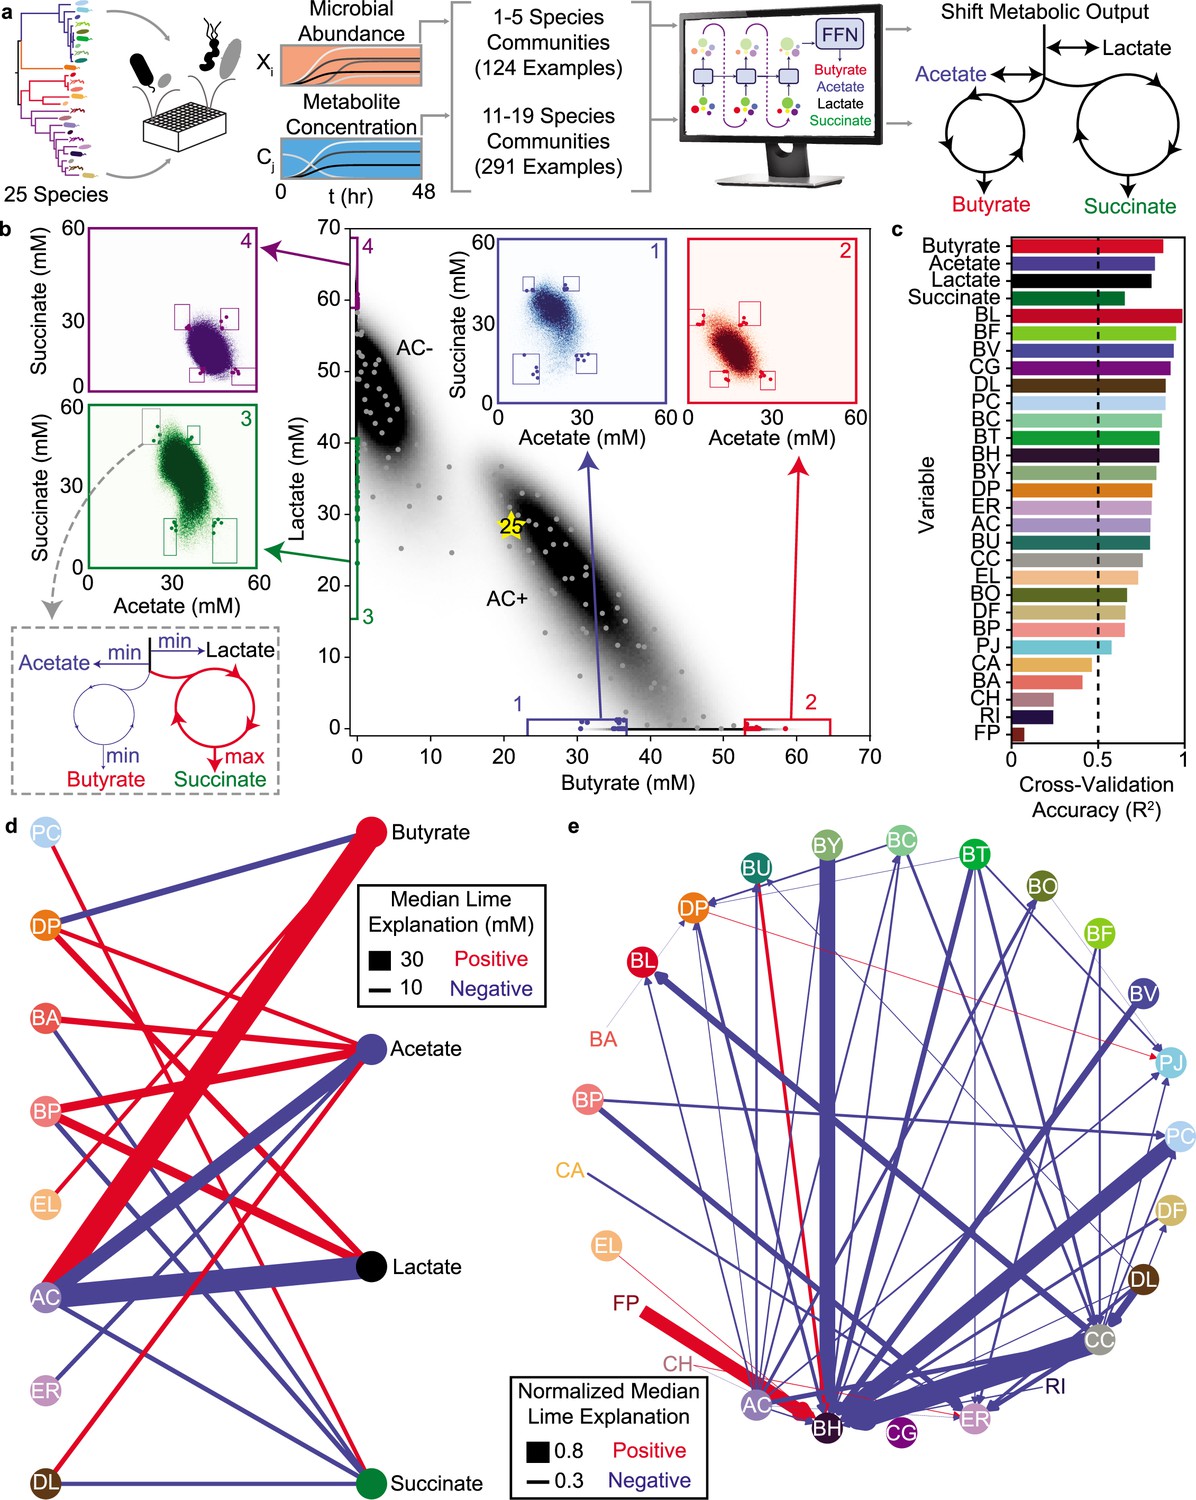
LSTM-guided design and interpretability of community-level metabolite production profiles (a) Schematic of model-training and design of communities with tailored metabolite outputs.
(b) Heatmap of butyrate and lactate concentrations of all possible communities predicted by the LSTM model M1. Grey points indicate communities chosen via -means clustering to span metabolite design space. Colored boxes indicate ‘corner’ regions defined by percentile values on each axis with points of the corresponding color indicating designed communities within that ‘corner’. Insets show heat maps of acetate and succinate concentrations for all communities within the corresponding boxes on the main figure. Boxes on the inset indicate ‘corners’ defined by percentile values on each axis with colored points corresponding to the same points indicated on the main plot. (c) Cross-validation accuracy of LSTM model trained and validated on a random 90/10 split of all community observations (model M2), evaluated as Pearson correlation for the correlation of predicted versus measured for each variable (all p-valueslt0.05, N and p-value for each test reported in Supplementary file 1). Dashed line indicates , which is used as a cutoff for including a variable in the subsequent network diagrams. (d) and (e) Network representation of median LIME explanations of the LSTM model M2 from (c) for prediction of each metabolite concentration (d) or species abundance (e) by the presence of each species. Edge widths are proportional to the median LIME explanation across all communities from (b) used to train the model in units of concentration (for (d)) or normalized to the species’ self-impact (for (e)). Only explanations for those variables where the cross-validated predictions had are shown. Networks were simplified by using lower thresholds for edge width (5 mM for (d), 0.2 for (e)). Red and blue edges indicate positive and negative contributions, respectively.
Figure 3—figure supplement 1

Cross-validation of LSTM model M1 predictions of species abundance and metabolite concentration.
Each plot indicates the comparison of predicted versus measured species abundance (a), butyrate concentration (b), acetate concentration (c), lactate concentration (d), or succinate concentration (e) for cross-validation of model M1 predictions of the validation communities from Clark et al., 2021 (model trained on 110 pairwise communities, 156 communities with 3–5 species, and 124 communities with 11-17 species; cross-validation shown is prediction of a different set of 124 communities with 11–17 species, including 82 communities with all 5 butyrate producers (AC, ER, FP, CC, RI) and 42 communities with the 4 butyrate producers other than AC). Each data point indicates the average of biological replicates of a single community. Black lines indicate linear regressions with slope () and indicated in the legends. Dashed blue line indicates..
Figure 3—figure supplement 2
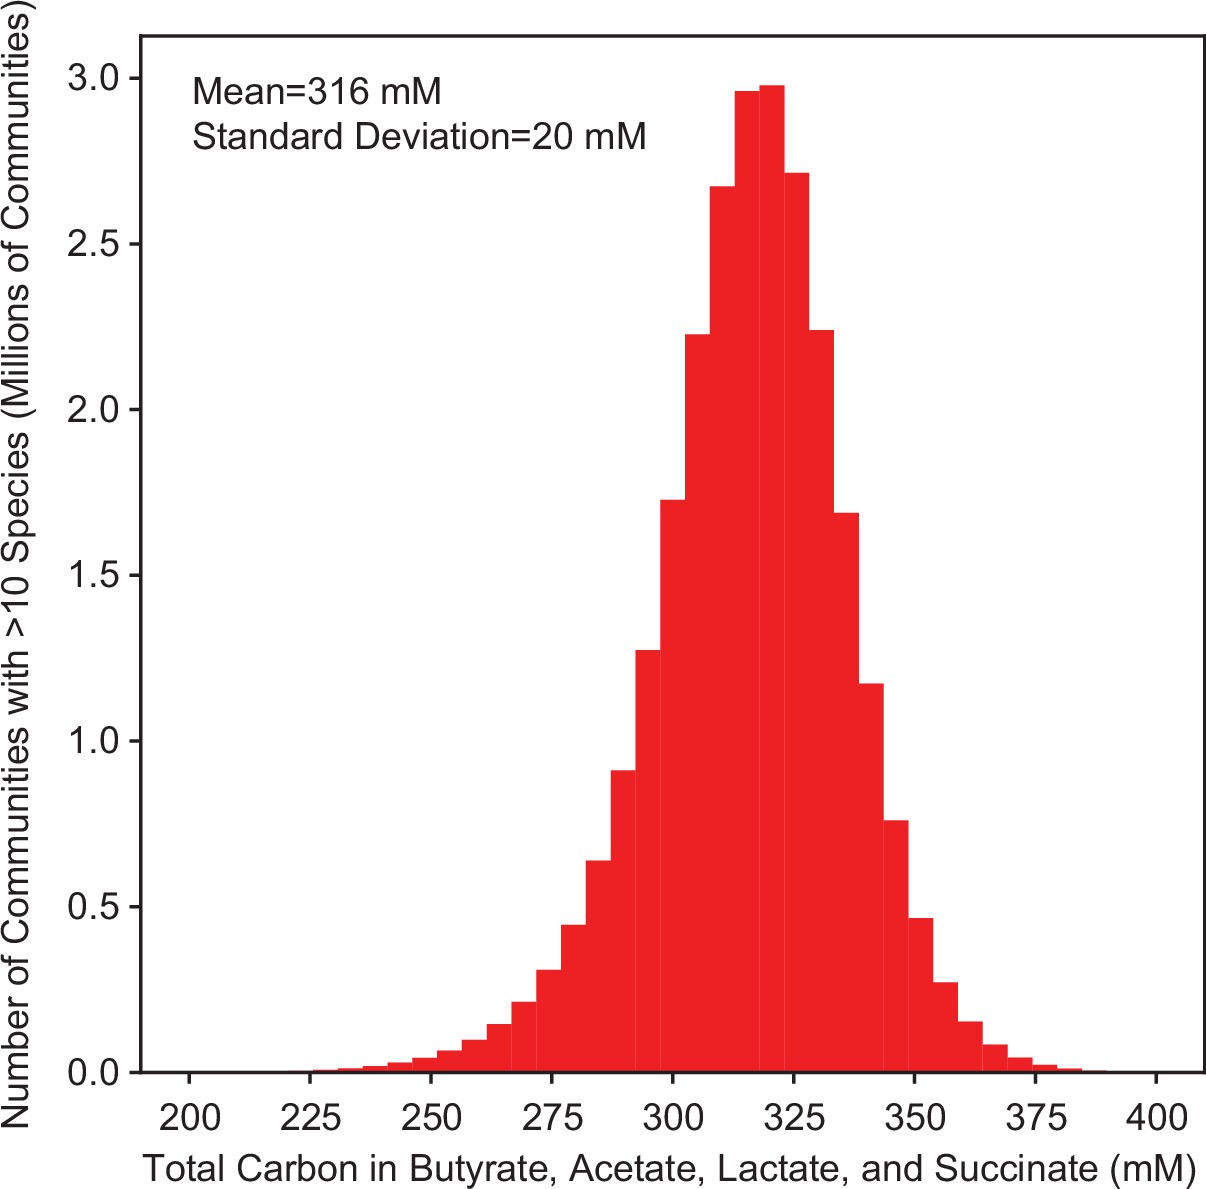
Predicted total carbon in fermentation products.
Histogram of the model M1 predicted total carbon concentration in butyrate, acetate, lactate, and succinate for all possible communities with >10 species (26,434,916 communities).
Figure 3—figure supplement 3
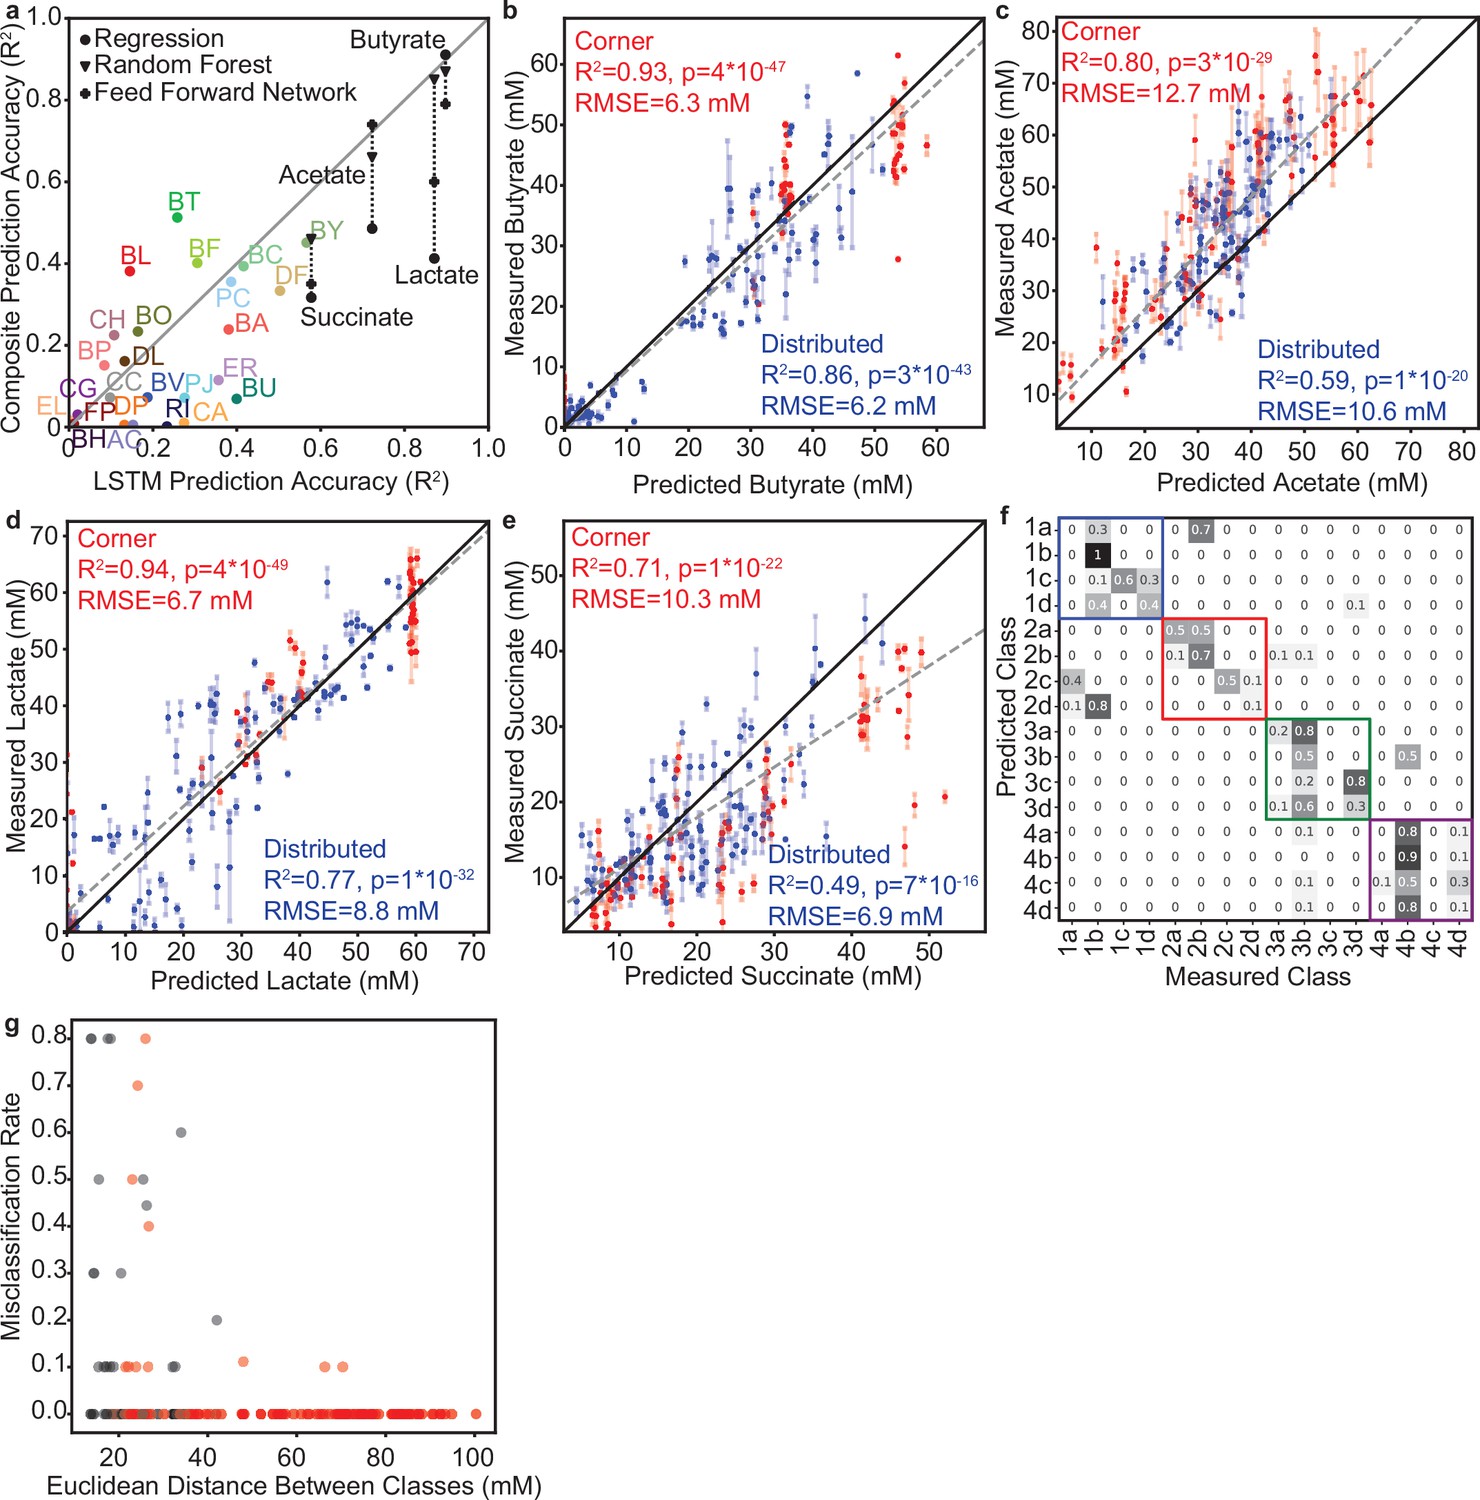
Prediction and classification statistics for model M1 predictions of designed community sets.
(a) Scatter plot of prediction accuracy (correlation of predicted versus measured) of each variable (25 species abundances, 4 metabolite concentrations) by the LSTM model M1 versus the composite model based on the method from Clark et al., 2021. For metabolites, prediction accuracy is also included where the regression model from the composite model is replaced with a Random Forest Regressor (Triangles) or a Feed Forward Network (Plus Signs). Pearson correlation, p-values and N reported in Supplementary file 1. (b–e) Prediction accuracy of model M1 for the indicated metabolites. Dashed line indicates the linear regression for all data points. Legends indicates the Pearson correlation (including p-values, N=80 for Corner, 100 for Distributed) and RMSE for communities from the ‘corner’ set (red) or ‘distributed’ set (blue) for each variable. Solid black lines indicate. (f) Confusion matrix for classification of the ‘corner’ communities into their specified classes (shown in Figure 3b). Values indicate the fraction of communities from each predicted class whose metabolite concentrations were closest (Euclidean distance) to the centroid of each class (Measured Class). Colored boxes indicate ‘sub-classes’ that fall within the four major classes determined in the lactate and butyrate concentration space as shown in Figure 3b. (g) Scatter plot of misclassification rate between each pair of classes (values from (f), fraction of communities misclassified from one class to the other) versus the Euclidean distance between the centroids of that pair of classes. Black data points indicate pairs of classes that fall within the same major classes defined by the colored boxes in (f) and red data points indicate pairs of classes that do not fall within the same major class.
Figure 3—figure supplement 4
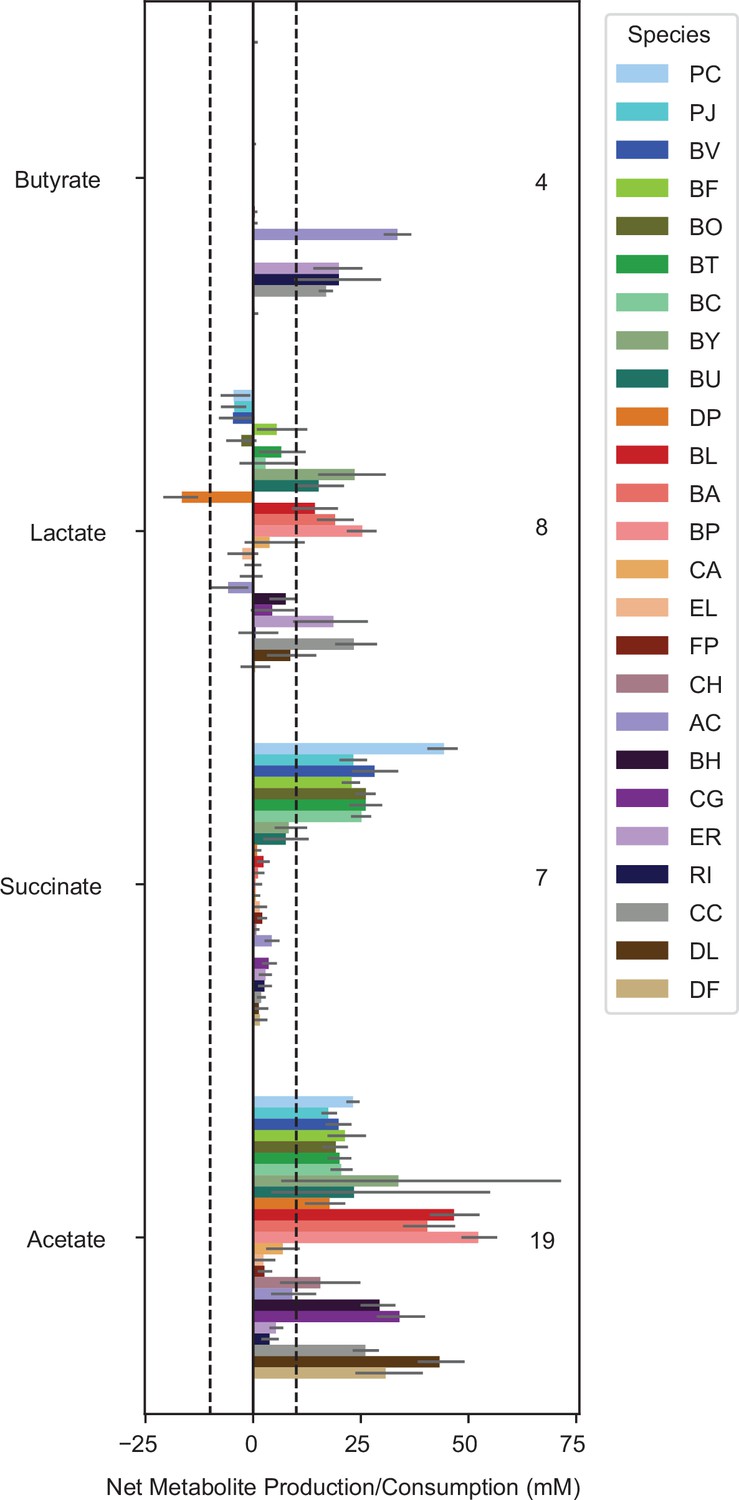
Metabolite production of each species grown in monoculture Bars show the mean net production or consumption of each metabolite for monocultures of each species (bar color indicates species as specified in the legend).
Error bars indicate bootstrapped 95% confidence interval on the mean of between 3 and 22 biological replicates. The dashed lines indicate +/- 10mM and the numbers on the plot indicate the number of species with mean net production of that metabolite outside the +/- 10 mM range.
Figure 3—figure supplement 5
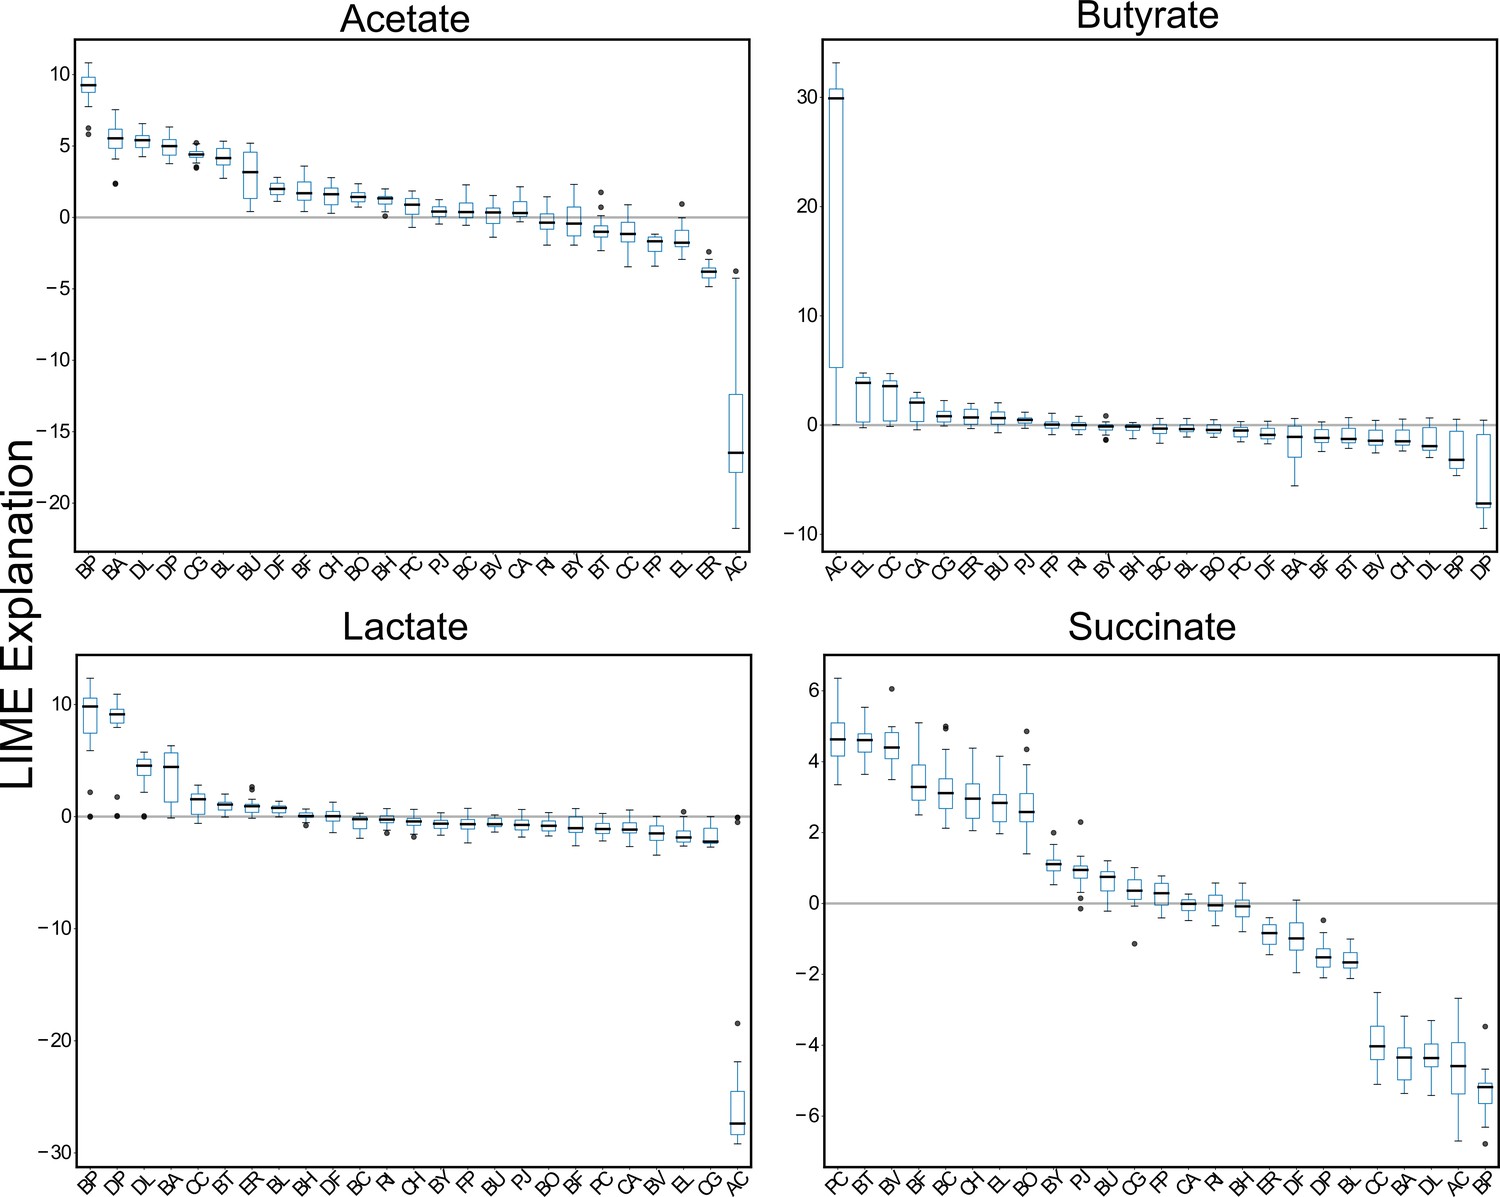
Metabolite-species LIME explanations computed over a 20-fold partitioning of the data set.
Box plots of LIME explanations for the metabolites acetate, butyrate, lactate and succinate. LIME analysis to compute the impact of initial species abundances on metabolite predictions in the 25-member (full) community was performed after training on each subset of data that resulted from a 20-fold partitioning. In each box, the black horizontal line shows the median LIME explanation over the 20 samples, each box encloses the first (Q1) and third (Q3) quartiles, whiskers extend to the farthest data points within the range 1.5*(Q3 - Q1). Data points that exceed this range are considered outliers, which are shown as black circles.
Figure 3—figure supplement 6
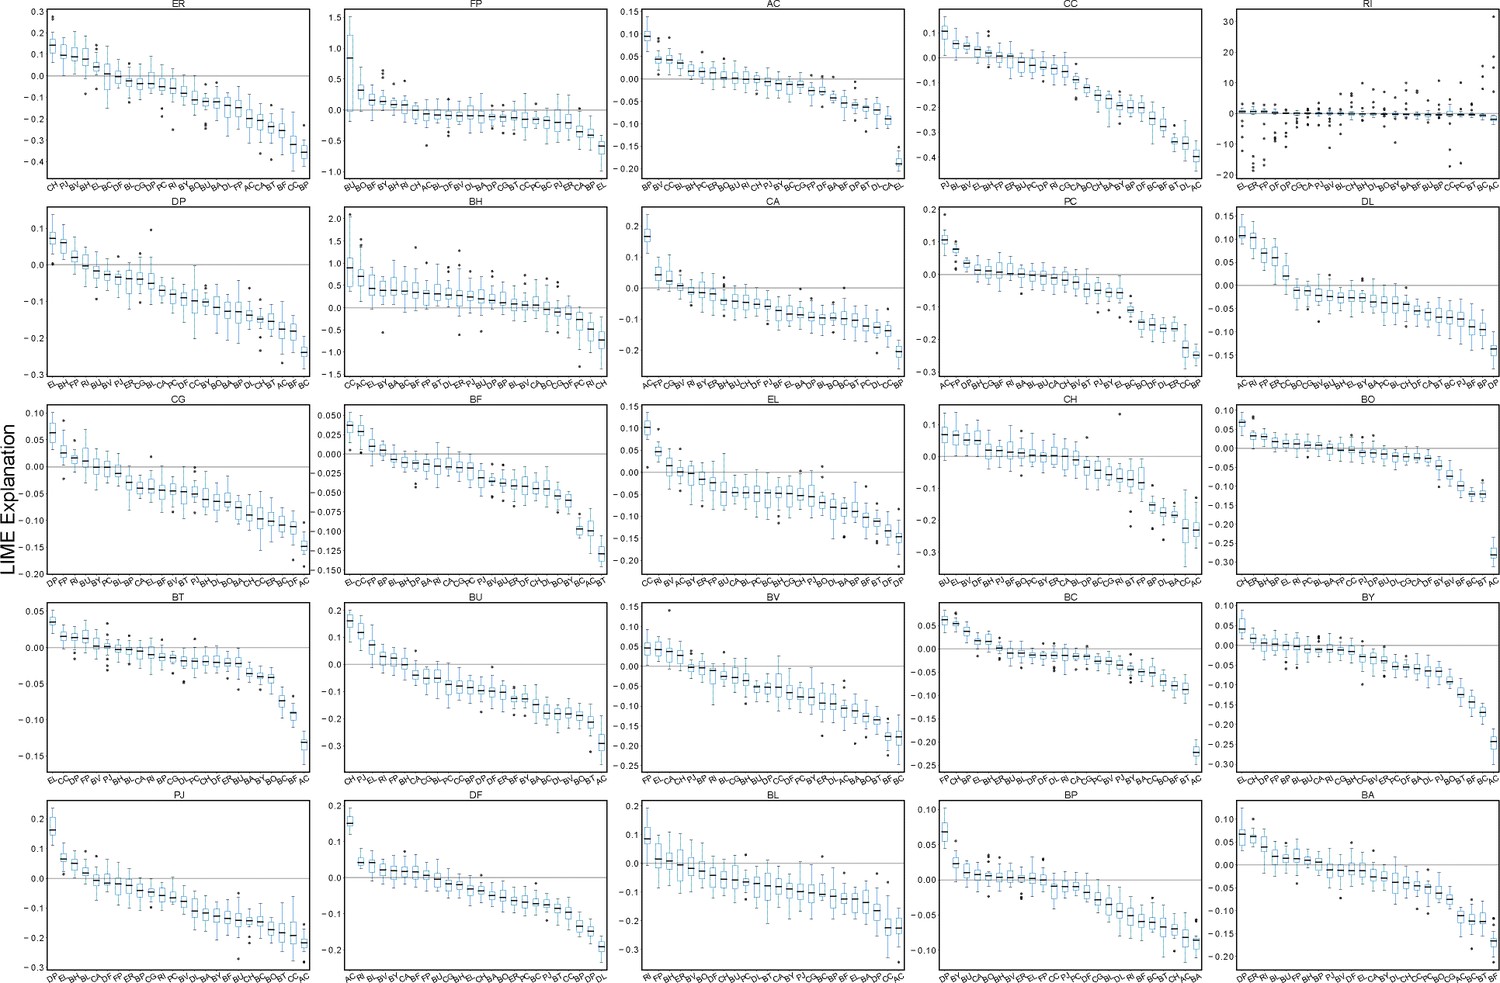
Microbe-microbe LIME explanations computed over a 20-fold partitioning of the data set.
Box plots of LIME explanations for each species in the 25-member synthetic human gut community. LIME analysis to compute the impact of initial species abundances on the end-point species abundance predictions in the 25-member (full) community was performed after training on each subset of data that resulted from a 20-fold partitioning. In each box, the black horizontal line shows the median LIME explanation over the 20 samples, each box encloses the first (Q1) and third (Q3) quartiles, and whiskers extend to the farthest data points within the range 1.5*(Q3 - Q1). Data points that exceed this range are considered outliers, which are shown as black circles. LIME explanations from each fold are normalized to the given species self-impact such that the LIME explanation of a species to predict its own abundance is equal to one.
Figure 3—figure supplement 7
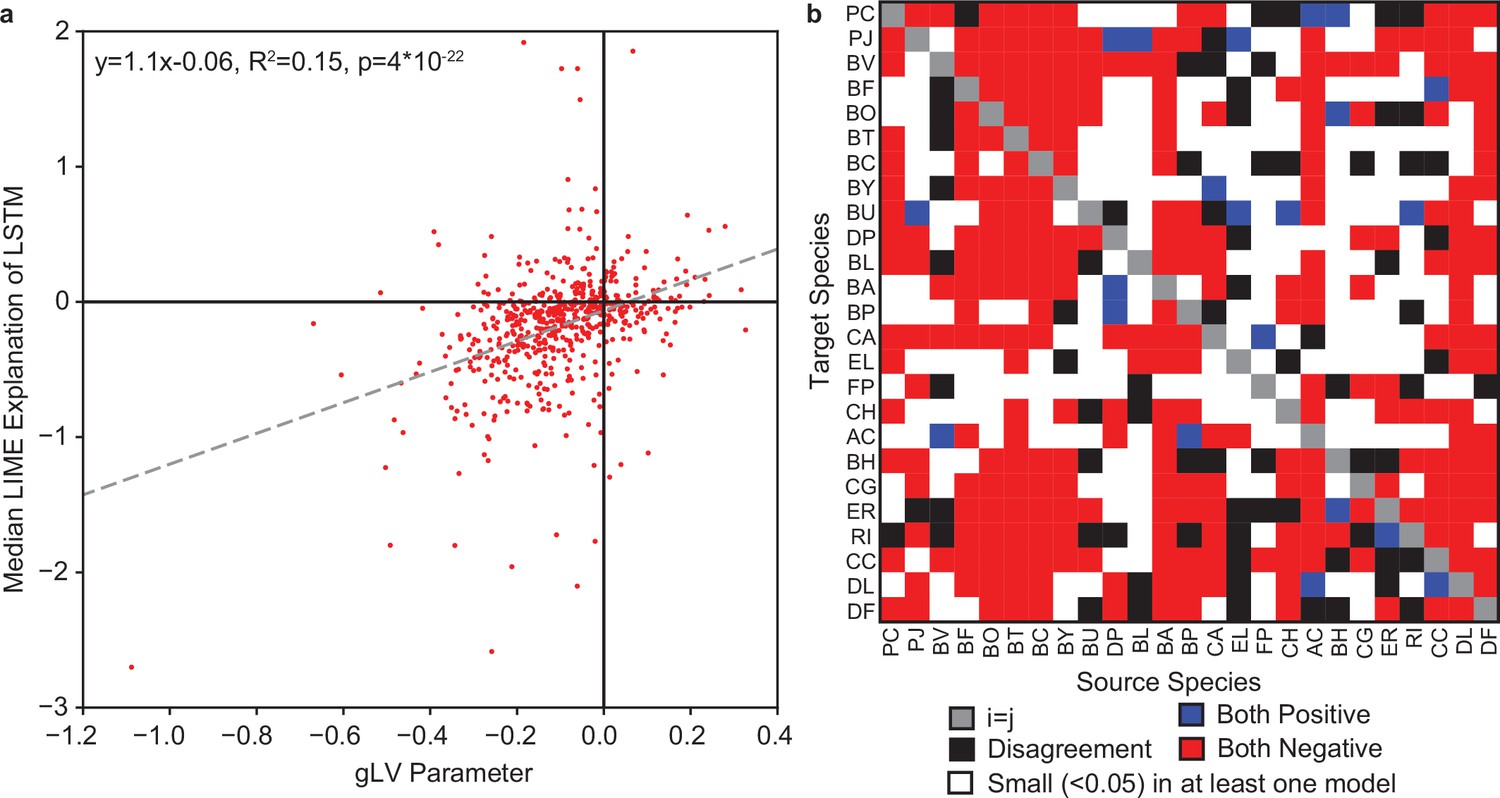
Comparison of LIME explanations of LSTM to gLV Parameters.
(a) Scatter plot of LIME explanations of each species impact on each other species in model M2 versus the corresponding interspecies interaction parameter () from the gLV model from Clark et al., 2021. Dashed line indicates the linear regression with the regression parameters shown in the legend (N=600). (b) Heatmap representation of agreement/disagreement between specific interactions for the same comparison as in (a). Legend describes what each color represents.
Figure 4 with 1 supplement
Hold-out prediction performance on sub-communities provides information about poorly understood species and interactions between species.
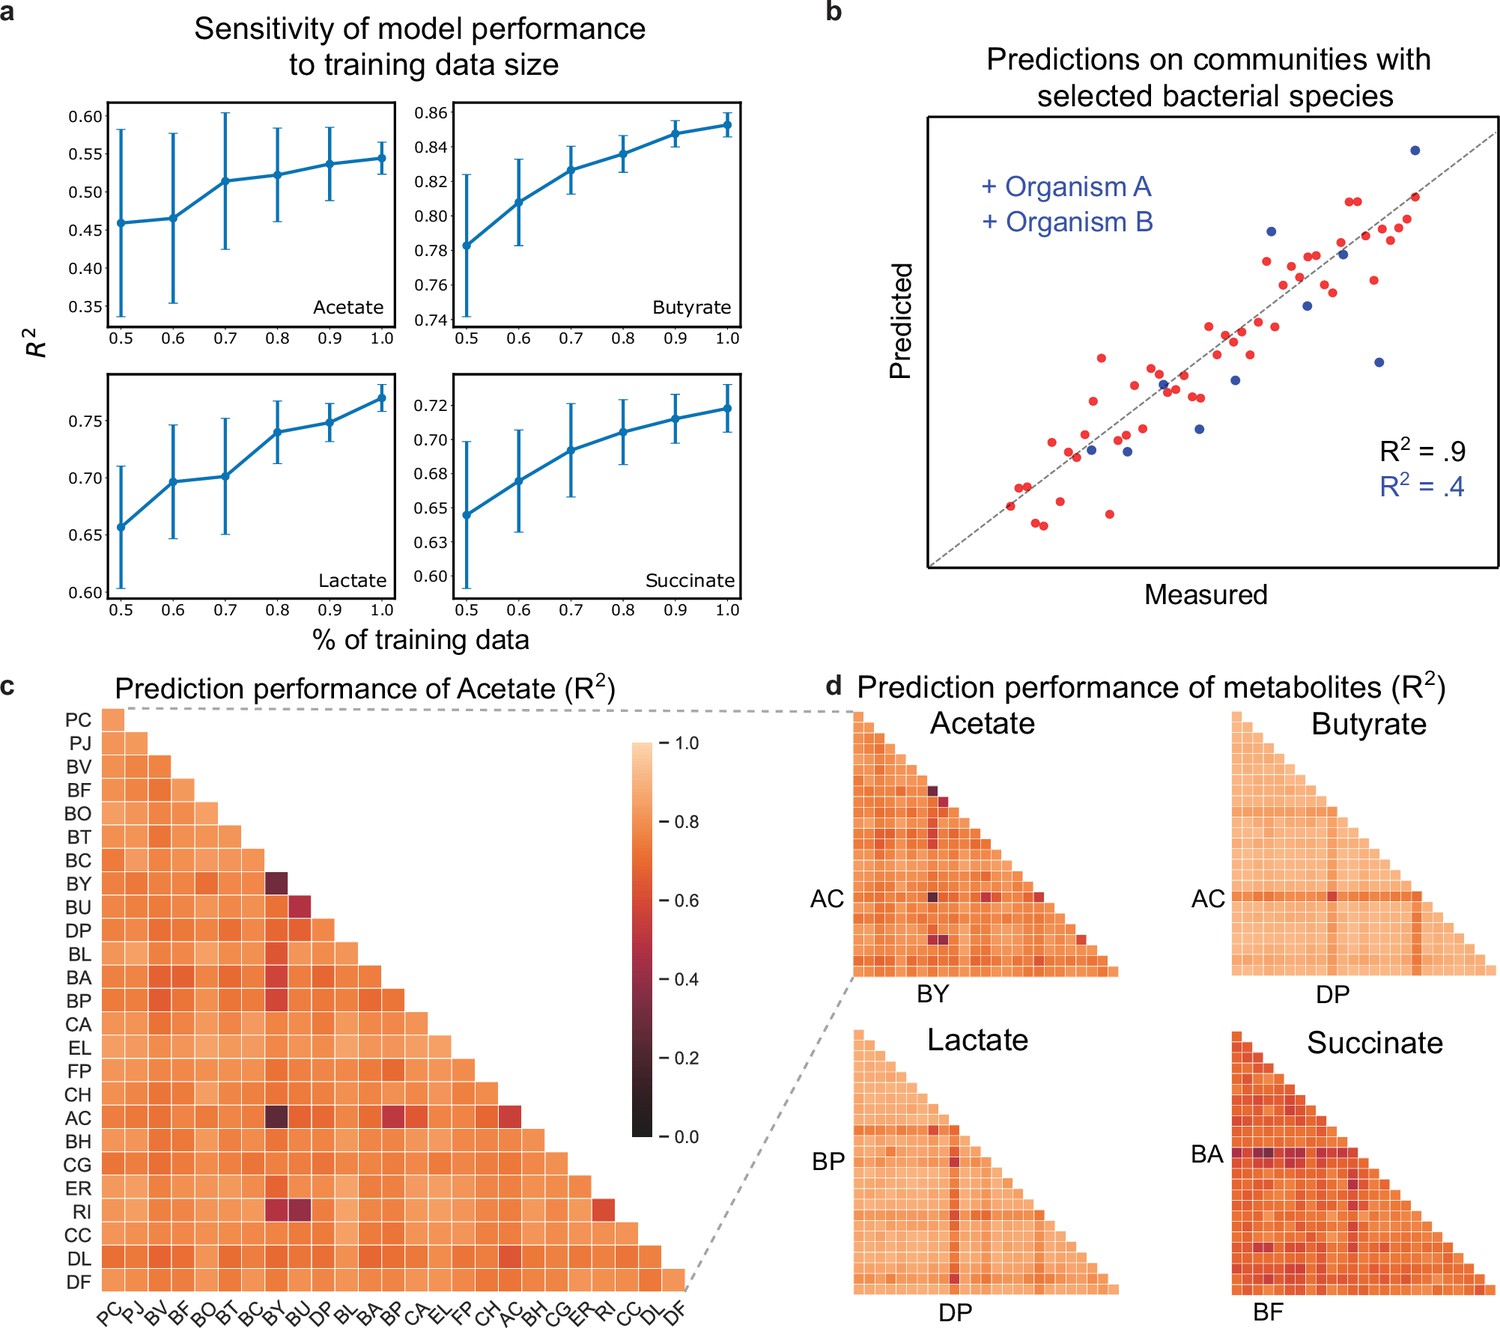
(a) Sensitivity of metabolite prediction performance () to the amount of training data. Training datasets were randomly subsampled 30 times using 50–100% of the total dataset in increments of 10%. Each subsampled training set was subject to 20-fold cross-validation to assess prediction performance. Lineplot of the mean prediction performance over the 30 trials for each percentage of the data. Error bars denote 1 s.d. from the mean. (b) Schematic scatter plot representing how communities containing species A and B define a poorly predicted subsample of the full sample set (c) Heatmap of prediction performance () of acetate for each subset of communities containing a given species (diagonal elements) or pair of species (off-diagonal elements). (d) Heatmap of prediction performance for acetate, butyrate, lactate, and succinate. A sample subset containing a given species or pair of species included all communities in which the species were initially present. Predictions for each community were determined using 20-fold cross validation so that for each model the predicted samples were excluded from the training samples. N and p-values are reported in Supplementary file 1.
Figure 4—figure supplement 1
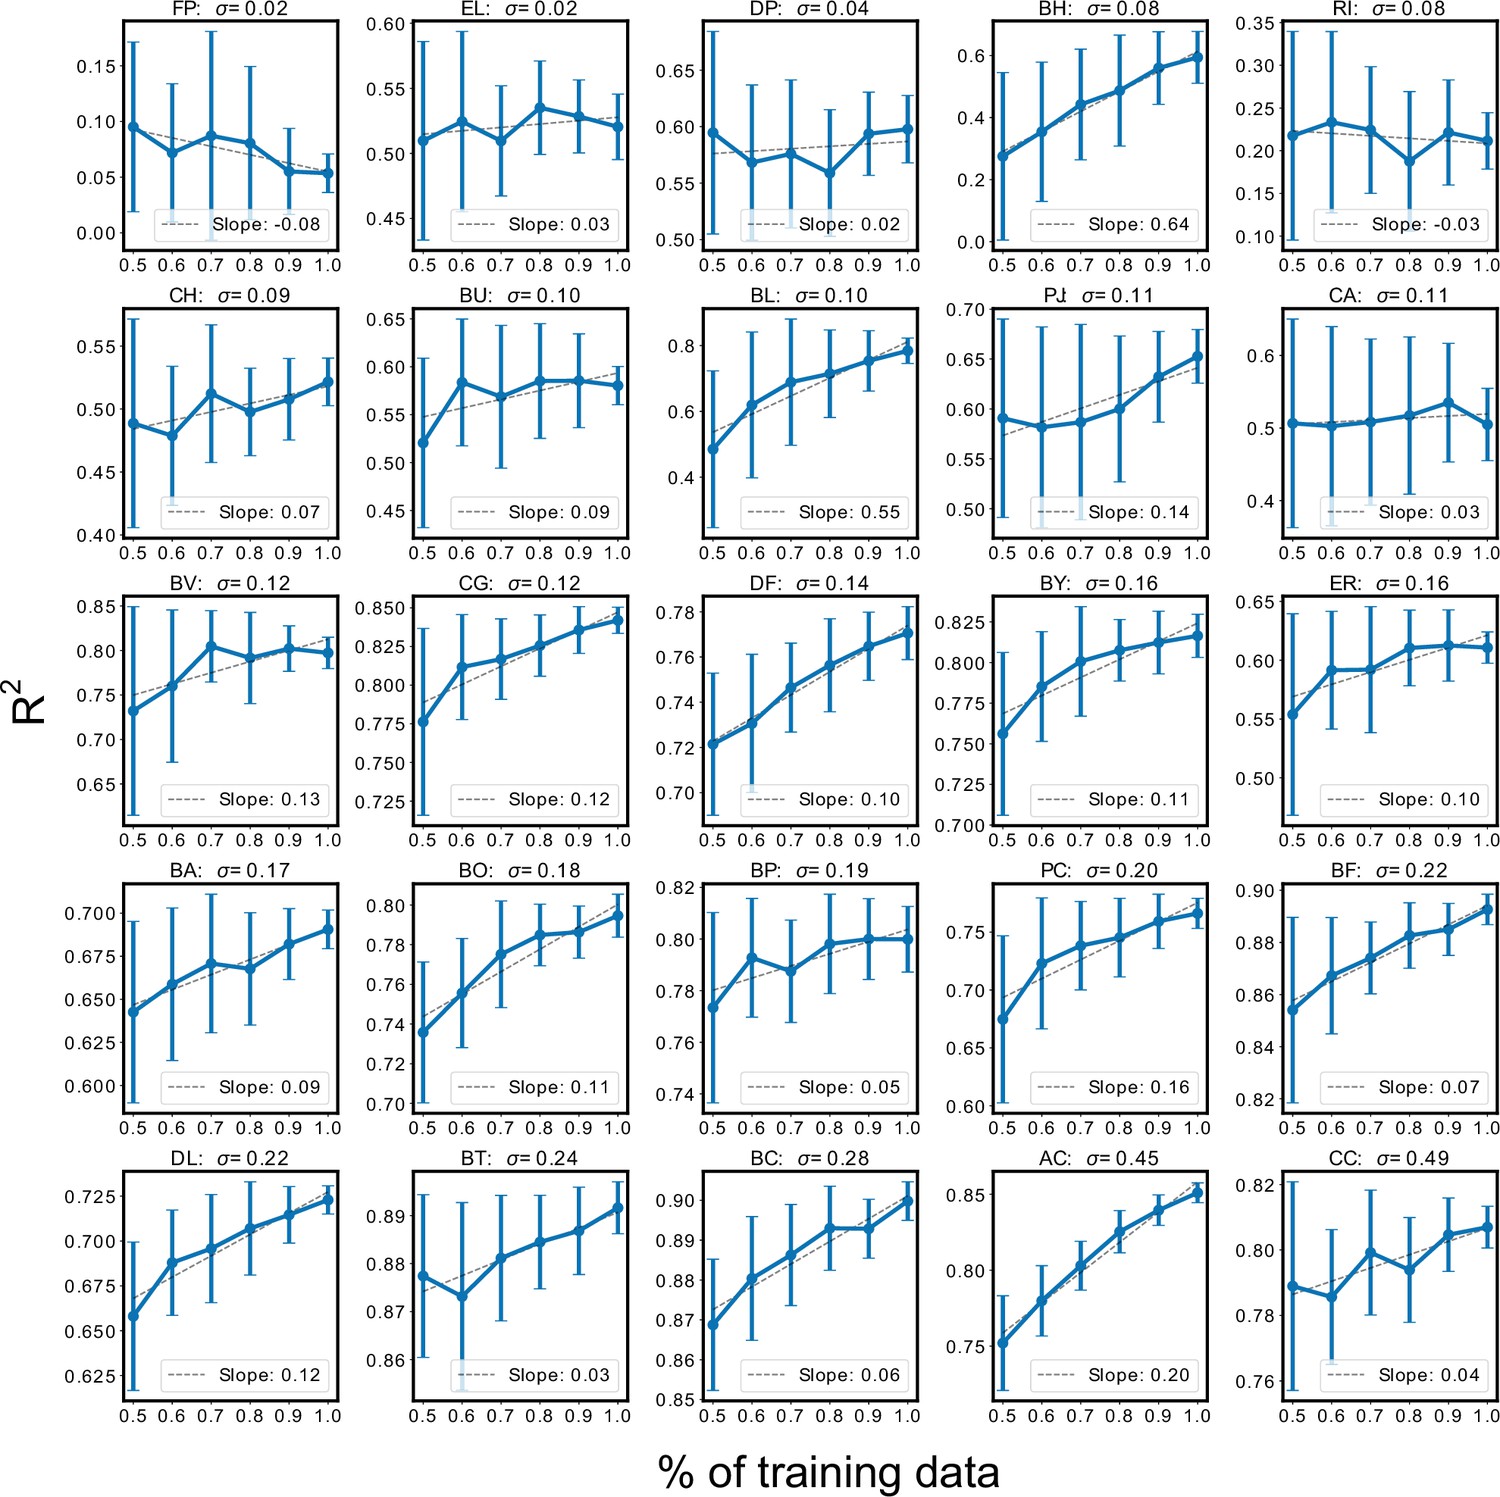
Sensitivity of species abundance prediction performance () to the size of the training dataset.
Training datasets were randomly subsampled 30 times using 50% to 100% of the total dataset in increments of 10%. Each subsampled training set was subject to 20-fold cross-validation to assess prediction performance. Sub-plots show the mean prediction performance (±one standard deviation) over the 30 trials for each percentage of the dataset. Subplots were sorted according to the variance in species abundance taken over the total dataset. In general, prediction performance of low variance species was less likely to improve in response to more training data. N and p-values are reported in Supplementary file 1.
Figure 5 with 3 supplements
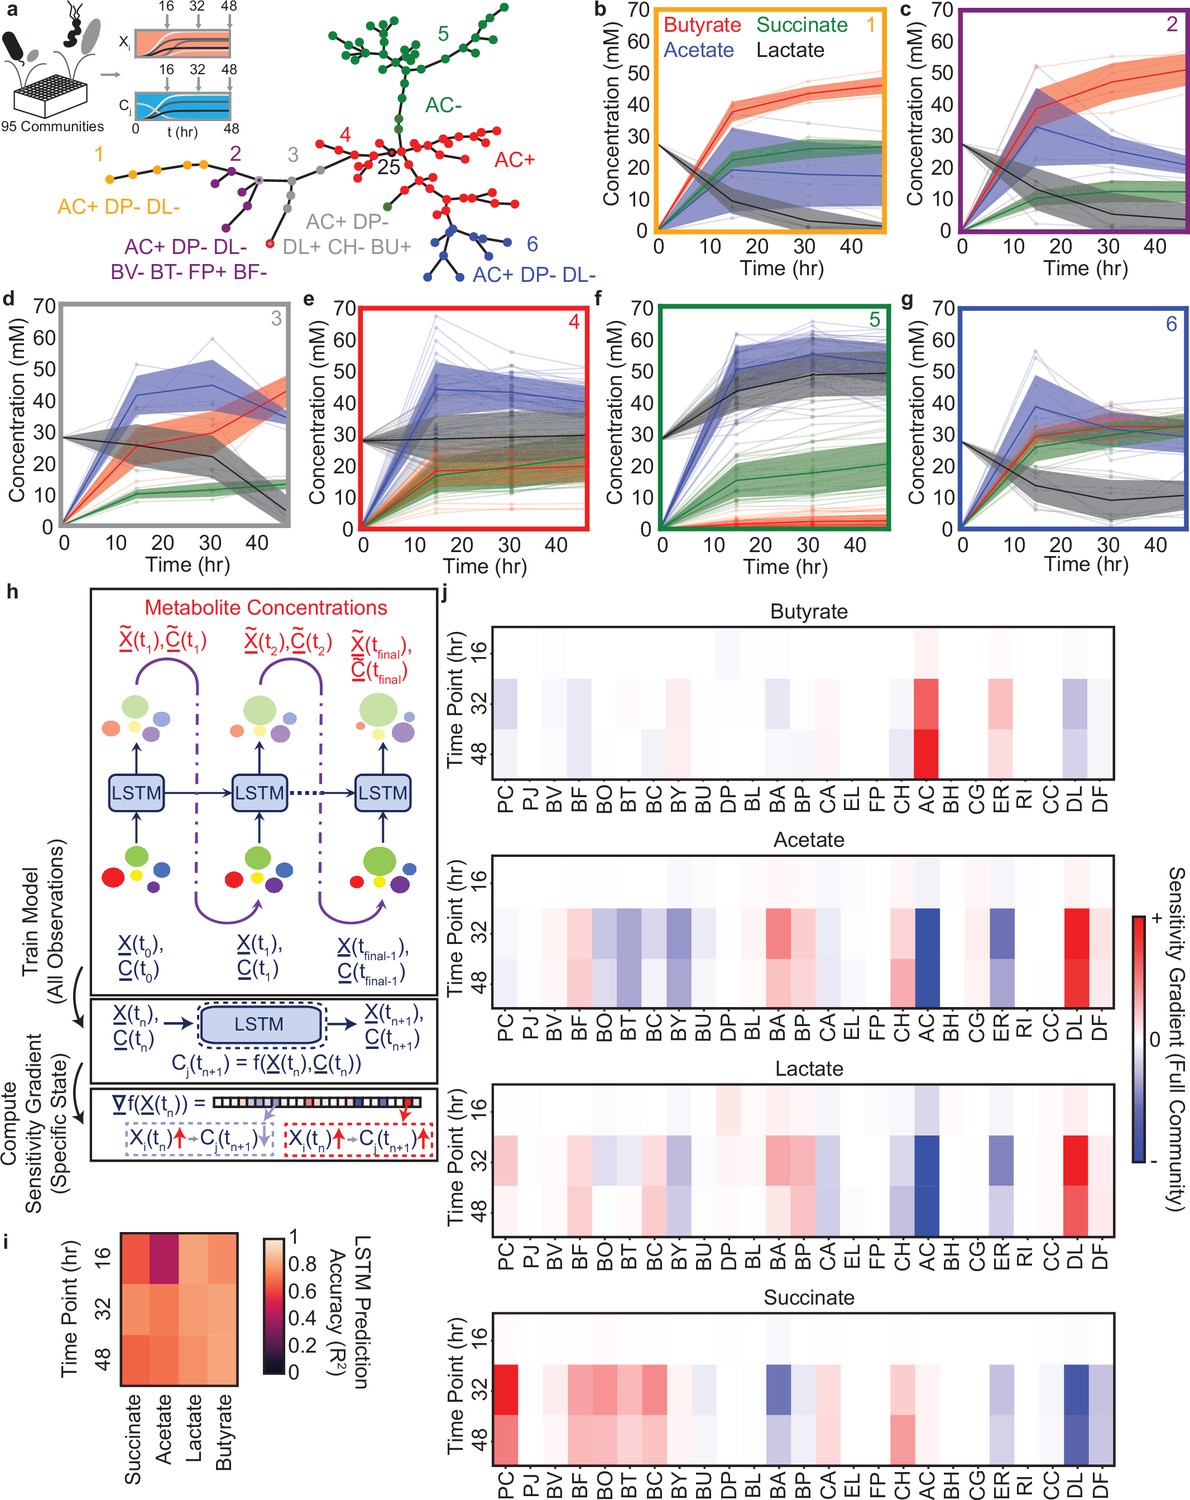
Community metabolite trajectories cluster into qualitatively distinct groups which can be classified based on presence and absence of key microbial species.
(a) Schematic of experiment and network representing a minimal spanning tree across the 95 communities where weights (indicated by edge length) are equal to the Euclidean distance between the metabolite trajectories for each community. Node colors indicate clusters determined as described in the Materials and methods. Red node with black outline annotated with ‘25’ represents the 25-member community. Annotations indicate the most specific microbial species presence/absence rules that describe most data points in the cluster of the corresponding color as determined by a decision tree classifier (Materials and methods). Communities that deviate from the rules for their cluster are indicated with a border matching the color of the closest cluster whose rules they do follow. Network visualization generated using the draw_kamada_kawai function in networkx (v2.1) for Python 3. (b–g) Temporal changes in metabolite concentrations for communities within each cluster (indicated by sub-plot border color), with individual communities denoted by transparent lines. Solid lines and shaded regions represent the mean ±1 s.d. of all communities in the cluster. (h) Schematic of LSTM model training and computation of gradients to evaluate impact of species abundance on metabolite concentrations in a specific community context. (i) Heatmap of model M3 prediction accuracy for four metabolites in the 34 validation communities at each time point (Pearson correlation , N=34 for all tests). (j) Heatmap of the gradient analysis of model M3 as described in (h) for the full 25-species community. N and p-values are reported in Supplementary file 1.
Figure 5—figure supplement 1

Characteristics of the dynamic community behaviors.
(a) Minimal spanning tree of a graph representation of the 180 communities characterized in Figure 3 where each node is a community and each weight is the Euclidean distance between a pair of communities in the 4-dimensional metabolite space to show that the subset of communities characterized in the dynamic experiment was representative of all 180 communities characterized in Figure 3. Blue and red nodes indicate the subset of communities chosen for dynamic characterization and used as training and validation examples for LSTM model M3 in Figure 5. These subsets were chosen by first performing kmeans clustering with for the 180 communities and identifying the 94 communities closest to each cluster centroid and then repeating this process to subsample 34 for the 94 communities (as the training/validation split). (b) and (c) Scatter plots showing where the clusters from Figure 5a fall in the 48 hr metabolite measurement space for comparison with Figure 3b. Each datapoint represents a community with the color corresponding to the clusters in Figure 5a. Legend indicates the percentage of communities from each cluster that come from the ‘corner’ or ‘distributed’ sets. (d) Decision tree classifier explaining which species’ presence determines the clusters of dynamic community behavior from Figure 5. Annotation indicate the percentage of communities from each cluster that can be explained by the indicated paths, which are also annotated on Figure 5a.
Figure 5—figure supplement 2
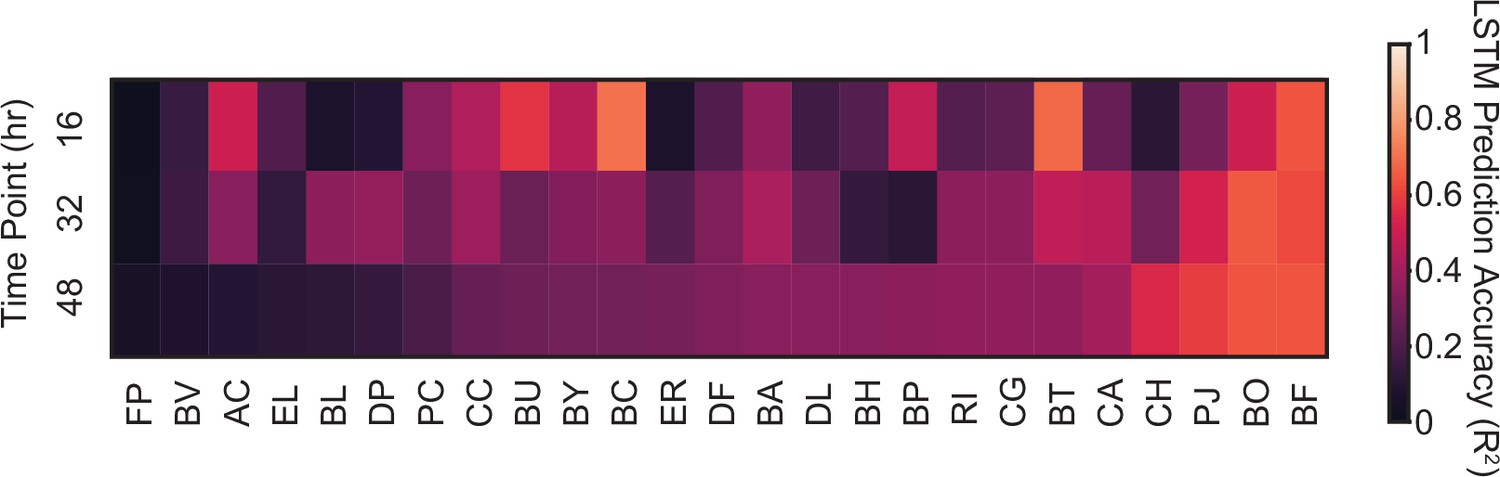
Prediction accuracy of model M3 for species abundance.
Heatmap represents for the prediction accuracy of model M3 of the abundance of each species at each time point in the 34 validation communities.
Figure 5—figure supplement 3
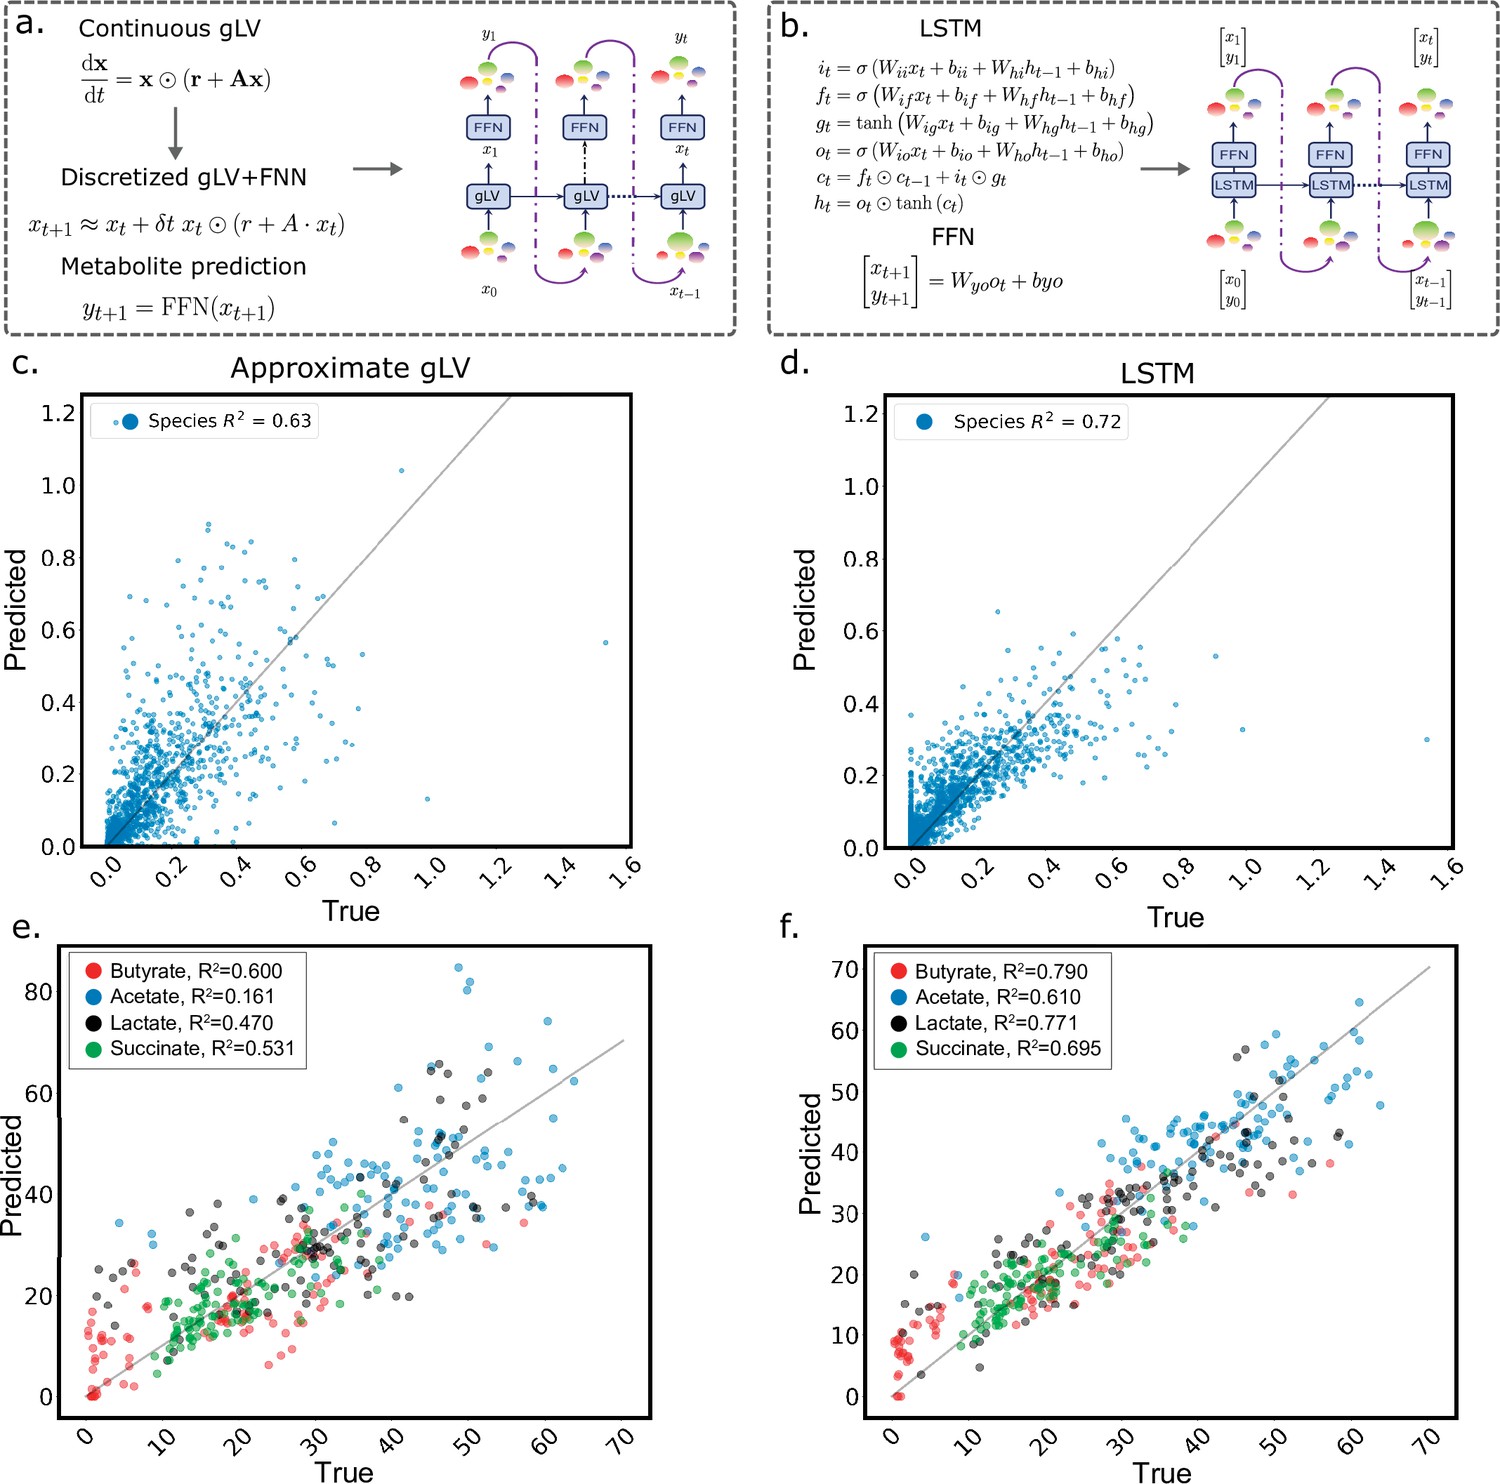
Comparison of the discrete generalized Lotka-Volterra model to the LSTM using the same training algorithm.
(a) Schematic detailing the implementation of the discretized gLV model and the addition of a feed-forward neural network to predict metabolites from species abundance, where is a matrix of species interaction coefficients, is a vector of growth rates, and ⊙ is the Hadamard product. (b) Schematic of the LSTM model, which uses an LSTM cell to compute a hidden state vector, which is the input to a feed-forward neural network that predicts a vector of species abundances and metabolite concentrations at each time step. See Computational Methods for a detailed description. (c) Scatter plot of experimentally measured (true) and predicted species absolute abundance using the approximate gLV model. gLV model prediction performance () of species abundance on held-out test data after training on the same training data used to fit LSTM model M3. (d) Scatter plot of experimentally measured (true) and predicted species absolute abundance using the LSTM + FFN model (). (e) Scatter plot of experimentally measured (true) and predicted metabolite concentrations using the gLV + FFN model ( for every metabolite). (f) Scatter plot of experimentally measured (true) and predicted metabolite concentrations using the LSTM +FFN model ( for every metabolite). Lines denote..
Tables
Key resources table
| Reagent type (species) or resource | Designation | Source or reference | Identifiers | Additional information |
|---|---|---|---|---|
| Strain, strain background (Prevotella copri CB7) | PC | DSM 18205 | ||
| Strain, strain background (Parabacteroides johnsonii M-165) | PJ | DSM 18315 | ||
| Strain, strain background (Bacteroides vulgatus NCTC 11154) | BV | ATCC 8482 | ||
| Strain, strain background (Bacteroides fragilis EN-2) | BF | DSM 2151 | ||
| Strain, strain background (Bacteroides ovatus NCTC 11153) | BO | ATCC 8483 | ||
| Strain, strain background (Bacteroides thetaiotaomicron VPI 5482) | BT | ATCC 29148 | ||
| Strain, strain background (Bacteroides caccae VPI 3452 A) | BC | ATCC 43185 | ||
| Strain, strain background (Bacteroides cellulosilyticus CRE21) | BY | DSMZ 14838 | ||
| Strain, strain background (Bacteroides uniformis VPI 0061) | BU | DSM 6597 | ||
| Strain, strain background (Desulfovibrio piger VPI C3-23) | DP | ATCC 29098 | ||
| Strain, strain background (Bifidobacterium longum subs. infantis S12) | BL | DSM 20088 | ||
| Strain, strain background (Bifidobacterium adolescentis E194a (Variant a)) | BA | ATCC 15703 | ||
| Strain, strain background (Bifidobacterium pseudocatenulatum B1279) | BP | DSM 20438 | ||
| Strain, strain background (Collinsella aerofaciens VPI 1003) | CA | DSM 3979 | ||
| Strain, strain background (Eggerthella lenta 1899 B) | EL | DSM 2243 | ||
| Strain, strain background (Faecalibacterium prausnitzii A2-165) | FP | DSM 17677 | ||
| Strain, strain background (Clostridium hiranonis T0-931) | CH | DSM 13275 | ||
| Strain, strain background (Anaerostipes caccae L1-92) | AC | DSM 14662 | ||
| Strain, strain background (Blautia hydrogenotrophica S5a33) | BH | DSM 10507 | ||
| Strain, strain background (Clostridium asparagiforme N6) | CG | DSM 15981 | ||
| Strain, strain background (Eubacterium rectale VPI 0990) | ER | ATCC 33656 | ||
| Strain, strain background (Roseburia intestinalis L1-82) | RI | DSM 14610 | ||
| Strain, strain background (Coprococcus comes VPI CI-38) | CC | ATCC 27758 | ||
| Strain, strain background (Dorea longicatena 111–35) | DL | DSMZ 13814 | ||
| Strain, strain background (Dorea formicigenerans VPI C8-13) | DF | DSM 3992 | ||
| Sequence-based reagent | Forward Primer Index: ATCACG | IDT | AATGATACGGCGACCACCGAGATCTACAC ATCACG ACACTCTTTCCCTACACGACGCTCTTCCGATCT ACTCCTACGGGAGGCAGCAGT | |
| Sequence-based reagent | Forward Primer Index: CGATGT | IDT | AATGATACGGCGACCACCGAGATCTACAC CGATGT ACACTCTTTCCCTACACGACGCTCTTCCGATCT T ACTCCTACGGGAGGCAGCAGT | |
| Sequence-based reagent | Forward Primer Index: TTAGGC | IDT | AATGATACGGCGACCACCGAGATCTACAC TTAGGC ACACTCTTTCCCTACACGACGCTCTTCCGATCT GT ACTCCTACGGGAGGCAGCAGT | |
| Sequence-based reagent | Forward Primer Index: TGACCA | IDT | AATGATACGGCGACCACCGAGATCTACAC TGACCA ACACTCTTTCCCTACACGACGCTCTTCCGATCT CGA ACTCCTACGGGAGGCAGCAGT | |
| Sequence-based reagent | Forward Primer Index: ACAGTG | IDT | AATGATACGGCGACCACCGAGATCTACAC ACAGTG ACACTCTTTCCCTACACGACGCTCTTCCGATCT ATGA ACTCCTACGGGAGGCAGCAGT | |
| Sequence-based reagent | Forward Primer Index: GCCAAT | IDT | AATGATACGGCGACCACCGAGATCTACAC GCCAAT ACACTCTTTCCCTACACGACGCTCTTCCGATCT TGCGA ACTCCTACGGGAGGCAGCAGT | |
| Sequence-based reagent | Forward Primer Index: CAGATC | IDT | AATGATACGGCGACCACCGAGATCTACAC CAGATC ACACTCTTTCCCTACACGACGCTCTTCCGATCT GAGTGG ACTCCTACGGGAGGCAGCAGT | |
| Sequence-based reagent | Forward Primer Index: ACTTGA | IDT | AATGATACGGCGACCACCGAGATCTACAC ACTTGA ACACTCTTTCCCTACACGACGCTCTTCCGATCT CCTGGAG ACTCCTACGGGAGGCAGCAGT | |
| Sequence-based reagent | Forward Primer Index: GATCAG | IDT | AATGATACGGCGACCACCGAGATCTACAC GATCAG ACACTCTTTCCCTACACGACGCTCTTCCGATCT ACTCCTACGGGAGGCAGCAGT | |
| Sequence-based reagent | Forward Primer Index: TAGCTT | IDT | AATGATACGGCGACCACCGAGATCTACAC TAGCTT ACACTCTTTCCCTACACGACGCTCTTCCGATCT T ACTCCTACGGGAGGCAGCAGT | |
| Sequence-based reagent | Forward Primer Index: GGCTAC | IDT | AATGATACGGCGACCACCGAGATCTACAC GGCTAC ACACTCTTTCCCTACACGACGCTCTTCCGATCT GT ACTCCTACGGGAGGCAGCAGT | |
| Sequence-based reagent | Forward Primer Index: CTTGTA | IDT | AATGATACGGCGACCACCGAGATCTACAC CTTGTA ACACTCTTTCCCTACACGACGCTCTTCCGATCT CGA ACTCCTACGGGAGGCAGCAGT | |
| Sequence-based reagent | Forward Primer Index: AGTCAA | IDT | AATGATACGGCGACCACCGAGATCTACAC AGTCAA ACACTCTTTCCCTACACGACGCTCTTCCGATCT ATGA ACTCCTACGGGAGGCAGCAGT | |
| Sequence-based reagent | Forward Primer Index: AGTTCC | IDT | AATGATACGGCGACCACCGAGATCTACAC AGTTCC ACACTCTTTCCCTACACGACGCTCTTCCGATCT TGCGA ACTCCTACGGGAGGCAGCAGT | |
| Sequence-based reagent | Forward Primer Index: ATGTCA | IDT | AATGATACGGCGACCACCGAGATCTACAC ATGTCA ACACTCTTTCCCTACACGACGCTCTTCCGATCT GAGTGG ACTCCTACGGGAGGCAGCAGT | |
| Sequence-based reagent | Forward Primer Index: CCGTCC | IDT | AATGATACGGCGACCACCGAGATCTACAC CCGTCC ACACTCTTTCCCTACACGACGCTCTTCCGATCT CCTGGAG ACTCCTACGGGAGGCAGCAGT | |
| Sequence-based reagent | Forward Primer Index: GTAGAG | IDT | AATGATACGGCGACCACCGAGATCTACAC GTAGAG ACACTCTTTCCCTACACGACGCTCTTCCGATCT ACTCCTACGGGAGGCAGCAGT | |
| Sequence-based reagent | Forward Primer Index: GTCCGC | IDT | AATGATACGGCGACCACCGAGATCTACAC GTCCGC ACACTCTTTCCCTACACGACGCTCTTCCGATCT T ACTCCTACGGGAGGCAGCAGT | |
| Sequence-based reagent | Forward Primer Index: GTGAAA | IDT | AATGATACGGCGACCACCGAGATCTACAC GTGAAA ACACTCTTTCCCTACACGACGCTCTTCCGATCT GT ACTCCTACGGGAGGCAGCAGT | |
| Sequence-based reagent | Forward Primer Index: GTGGCC | IDT | AATGATACGGCGACCACCGAGATCTACAC GTGGCC ACACTCTTTCCCTACACGACGCTCTTCCGATCT CGA ACTCCTACGGGAGGCAGCAGT | |
| Sequence-based reagent | Forward Primer Index: GTTTCG | IDT | AATGATACGGCGACCACCGAGATCTACAC GTTTCG ACACTCTTTCCCTACACGACGCTCTTCCGATCT ATGA ACTCCTACGGGAGGCAGCAGT | |
| Sequence-based reagent | Forward Primer Index: CGTACG | IDT | AATGATACGGCGACCACCGAGATCTACAC CGTACG ACACTCTTTCCCTACACGACGCTCTTCCGATCT TGCGA ACTCCTACGGGAGGCAGCAGT | |
| Sequence-based reagent | Forward Primer Index: GAGTGG | IDT | AATGATACGGCGACCACCGAGATCTACAC GAGTGG ACACTCTTTCCCTACACGACGCTCTTCCGATCT GAGTGG ACTCCTACGGGAGGCAGCAGT | |
| Sequence-based reagent | Forward Primer Index: GGTAGC | IDT | AATGATACGGCGACCACCGAGATCTACAC GGTAGC ACACTCTTTCCCTACACGACGCTCTTCCGATCT CCTGGAG ACTCCTACGGGAGGCAGCAGT | |
| Sequence-based reagent | Forward Primer Index: ACTGAT | IDT | AATGATACGGCGACCACCGAGATCTACAC ACTGAT ACACTCTTTCCCTACACGACGCTCTTCCGATCT ACTCCTACGGGAGGCAGCAGT | |
| Sequence-based reagent | Forward Primer Index: ATGAGC | IDT | AATGATACGGCGACCACCGAGATCTACAC ATGAGC ACACTCTTTCCCTACACGACGCTCTTCCGATCT T ACTCCTACGGGAGGCAGCAGT | |
| Sequence-based reagent | Forward Primer Index: ATTCCT | IDT | AATGATACGGCGACCACCGAGATCTACAC ATTCCT ACACTCTTTCCCTACACGACGCTCTTCCGATCT GT ACTCCTACGGGAGGCAGCAGT | |
| Sequence-based reagent | Forward Primer Index: CAAAAG | IDT | AATGATACGGCGACCACCGAGATCTACAC CAAAAG ACACTCTTTCCCTACACGACGCTCTTCCGATCT CGA ACTCCTACGGGAGGCAGCAGT | |
| Sequence-based reagent | Forward Primer Index: CAACTA | IDT | AATGATACGGCGACCACCGAGATCTACAC CAACTA ACACTCTTTCCCTACACGACGCTCTTCCGATCT ATGA ACTCCTACGGGAGGCAGCAGT | |
| Sequence-based reagent | Forward Primer Index: CACCGG | IDT | AATGATACGGCGACCACCGAGATCTACAC CACCGG ACACTCTTTCCCTACACGACGCTCTTCCGATCT TGCGA ACTCCTACGGGAGGCAGCAGT | |
| Sequence-based reagent | Forward Primer Index: CACGAT | IDT | AATGATACGGCGACCACCGAGATCTACAC CACGAT ACACTCTTTCCCTACACGACGCTCTTCCGATCT GAGTGG ACTCCTACGGGAGGCAGCAGT | |
| Sequence-based reagent | Forward Primer Index: CACTCA | IDT | AATGATACGGCGACCACCGAGATCTACAC CACTCA ACACTCTTTCCCTACACGACGCTCTTCCGATCT CCTGGAG ACTCCTACGGGAGGCAGCAGT | |
| Sequence-based reagent | Forward Primer Index: CAGGCG | IDT | AATGATACGGCGACCACCGAGATCTACAC CAGGCG ACACTCTTTCCCTACACGACGCTCTTCCGATCT ACTCCTACGGGAGGCAGCAGT | |
| Sequence-based reagent | Forward Primer Index: CATGGC | IDT | AATGATACGGCGACCACCGAGATCTACAC CATGGC ACACTCTTTCCCTACACGACGCTCTTCCGATCT T ACTCCTACGGGAGGCAGCAGT | |
| Sequence-based reagent | Forward Primer Index: CATTTT | IDT | AATGATACGGCGACCACCGAGATCTACAC CATTTT ACACTCTTTCCCTACACGACGCTCTTCCGATCT GT ACTCCTACGGGAGGCAGCAGT | |
| Sequence-based reagent | Forward Primer Index: CCAACA | IDT | AATGATACGGCGACCACCGAGATCTACAC CCAACA ACACTCTTTCCCTACACGACGCTCTTCCGATCT CGA ACTCCTACGGGAGGCAGCAGT | |
| Sequence-based reagent | Forward Primer Index: CGGAAT | IDT | AATGATACGGCGACCACCGAGATCTACAC CGGAAT ACACTCTTTCCCTACACGACGCTCTTCCGATCT ATGA ACTCCTACGGGAGGCAGCAGT | |
| Sequence-based reagent | Forward Primer Index: CTAGCT | IDT | AATGATACGGCGACCACCGAGATCTACAC CTAGCT ACACTCTTTCCCTACACGACGCTCTTCCGATCT TGCGA ACTCCTACGGGAGGCAGCAGT | |
| Sequence-based reagent | Forward Primer Index: CTATAC | IDT | AATGATACGGCGACCACCGAGATCTACAC CTATAC ACACTCTTTCCCTACACGACGCTCTTCCGATCT GAGTGG ACTCCTACGGGAGGCAGCAGT | |
| Sequence-based reagent | Forward Primer Index: CTCAGA | IDT | AATGATACGGCGACCACCGAGATCTACAC CTCAGA ACACTCTTTCCCTACACGACGCTCTTCCGATCT CCTGGAG ACTCCTACGGGAGGCAGCAGT | |
| Sequence-based reagent | Forward Primer Index: GACGAC | IDT | AATGATACGGCGACCACCGAGATCTACAC GACGAC ACACTCTTTCCCTACACGACGCTCTTCCGATCT ACTCCTACGGGAGGCAGCAGT | |
| Sequence-based reagent | Forward Primer Index: TAATCG | IDT | AATGATACGGCGACCACCGAGATCTACAC TAATCG ACACTCTTTCCCTACACGACGCTCTTCCGATCT T ACTCCTACGGGAGGCAGCAGT | |
| Sequence-based reagent | Forward Primer Index: TACAGC | IDT | AATGATACGGCGACCACCGAGATCTACAC TACAGC ACACTCTTTCCCTACACGACGCTCTTCCGATCT GT ACTCCTACGGGAGGCAGCAGT | |
| Sequence-based reagent | Forward Primer Index: TATAAT | IDT | AATGATACGGCGACCACCGAGATCTACAC TATAAT ACACTCTTTCCCTACACGACGCTCTTCCGATCT CGA ACTCCTACGGGAGGCAGCAGT | |
| Sequence-based reagent | Forward Primer Index: TCATTC | IDT | AATGATACGGCGACCACCGAGATCTACAC TCATTC ACACTCTTTCCCTACACGACGCTCTTCCGATCT ATGA ACTCCTACGGGAGGCAGCAGT | |
| Sequence-based reagent | Forward Primer Index: TCCCGA | IDT | AATGATACGGCGACCACCGAGATCTACAC TCCCGA ACACTCTTTCCCTACACGACGCTCTTCCGATCT TGCGA ACTCCTACGGGAGGCAGCAGT | |
| Sequence-based reagent | Forward Primer Index: TCGAAG | IDT | AATGATACGGCGACCACCGAGATCTACAC TCGAAG ACACTCTTTCCCTACACGACGCTCTTCCGATCT GAGTGG ACTCCTACGGGAGGCAGCAGT | |
| Sequence-based reagent | Forward Primer Index: TCGGCA | IDT | AATGATACGGCGACCACCGAGATCTACAC TCGGCA ACACTCTTTCCCTACACGACGCTCTTCCGATCT CCTGGAG ACTCCTACGGGAGGCAGCAGT | |
| Sequence-based reagent | Reverse Primer Index: ATCACGAG | IDT | CAAGCAGAAGACGGCATACGAGAT ATCACGAG GTGACTGGAGTTCAGACGTGTGCTCTTCCGATCT ggactaccagggtatctaatcctgt | |
| Sequence-based reagent | Reverse Primer Index: CGATGTTC | IDT | CAAGCAGAAGACGGCATACGAGAT CGATGTTC GTGACTGGAGTTCAGACGTGTGCTCTTCCGATCT A ggactaccagggtatctaatcctgt | |
| Sequence-based reagent | Reverse Primer Index: TTAGGCGA | IDT | CAAGCAGAAGACGGCATACGAGAT TTAGGCGA GTGACTGGAGTTCAGACGTGTGCTCTTCCGATCT TC ggactaccagggtatctaatcctgt | |
| Sequence-based reagent | Reverse Primer Index: TGACCAAT | IDT | CAAGCAGAAGACGGCATACGAGAT TGACCAAT GTGACTGGAGTTCAGACGTGTGCTCTTCCGATCT CTA ggactaccagggtatctaatcctgt | |
| Sequence-based reagent | Reverse Primer Index: ACAGTGCT | IDT | CAAGCAGAAGACGGCATACGAGAT ACAGTGCT GTGACTGGAGTTCAGACGTGTGCTCTTCCGATCT GATA ggactaccagggtatctaatcctgt | |
| Sequence-based reagent | Reverse Primer Index: GCCAATGT | IDT | CAAGCAGAAGACGGCATACGAGAT GCCAATGT GTGACTGGAGTTCAGACGTGTGCTCTTCCGATCT ACTCA ggactaccagggtatctaatcctgt | |
| Sequence-based reagent | Reverse Primer Index: CAGATCGA | IDT | CAAGCAGAAGACGGCATACGAGAT CAGATCGA GTGACTGGAGTTCAGACGTGTGCTCTTCCGATCT TTCTCT ggactaccagggtatctaatcctgt | |
| Sequence-based reagent | Reverse Primer Index: ACTTGAAA | IDT | CAAGCAGAAGACGGCATACGAGAT ACTTGAAA GTGACTGGAGTTCAGACGTGTGCTCTTCCGATCT CACTTCT ggactaccagggtatctaatcctgt | |
| Sequence-based reagent | Reverse Primer Index: GATCAGTG | IDT | CAAGCAGAAGACGGCATACGAGAT GATCAGTG GTGACTGGAGTTCAGACGTGTGCTCTTCCGATCT ggactaccagggtatctaatcctgt | |
| Sequence-based reagent | Reverse Primer Index: TCTACCTC | IDT | CAAGCAGAAGACGGCATACGAGAT TCTACCTC GTGACTGGAGTTCAGACGTGTGCTCTTCCGATCT A ggactaccagggtatctaatcctgt | |
| Sequence-based reagent | Reverse Primer Index: CTTGTATG | IDT | CAAGCAGAAGACGGCATACGAGAT CTTGTATG GTGACTGGAGTTCAGACGTGTGCTCTTCCGATCT TC ggactaccagggtatctaatcctgt | |
| Sequence-based reagent | Reverse Primer Index: TAGCTTCC | IDT | CAAGCAGAAGACGGCATACGAGAT TAGCTTCC GTGACTGGAGTTCAGACGTGTGCTCTTCCGATCT CTA ggactaccagggtatctaatcctgt | |
| Sequence-based reagent | Reverse Primer Index: GGCTACCA | IDT | CAAGCAGAAGACGGCATACGAGAT GGCTACCA GTGACTGGAGTTCAGACGTGTGCTCTTCCGATCT GATA ggactaccagggtatctaatcctgt | |
| Sequence-based reagent | Reverse Primer Index: ATGCACTT | IDT | CAAGCAGAAGACGGCATACGAGAT ATGCACTT GTGACTGGAGTTCAGACGTGTGCTCTTCCGATCT ACTCA ggactaccagggtatctaatcctgt | |
| Sequence-based reagent | Reverse Primer Index: GACGGAAC | IDT | CAAGCAGAAGACGGCATACGAGAT GACGGAAC GTGACTGGAGTTCAGACGTGTGCTCTTCCGATCT TTCTCT ggactaccagggtatctaatcctgt | |
| Sequence-based reagent | Reverse Primer Index: AGCCTTGG | IDT | CAAGCAGAAGACGGCATACGAGAT AGCCTTGG GTGACTGGAGTTCAGACGTGTGCTCTTCCGATCT CACTTCT ggactaccagggtatctaatcctgt | |
| Sequence-based reagent | Reverse Primer Index: CCGTAGAG | IDT | CAAGCAGAAGACGGCATACGAGAT CCGTAGAG GTGACTGGAGTTCAGACGTGTGCTCTTCCGATCT ggactaccagggtatctaatcctgt | |
| Sequence-based reagent | Reverse Primer Index: GTGAGACT | IDT | CAAGCAGAAGACGGCATACGAGAT GTGAGACT GTGACTGGAGTTCAGACGTGTGCTCTTCCGATCT A ggactaccagggtatctaatcctgt | |
| Sequence-based reagent | Reverse Primer Index: AATGCTCA | IDT | CAAGCAGAAGACGGCATACGAGAT AATGCTCA GTGACTGGAGTTCAGACGTGTGCTCTTCCGATCT TC ggactaccagggtatctaatcctgt | |
| Sequence-based reagent | Reverse Primer Index: GCATCGTA | IDT | CAAGCAGAAGACGGCATACGAGAT GCATCGTA GTGACTGGAGTTCAGACGTGTGCTCTTCCGATCT CTA ggactaccagggtatctaatcctgt | |
| Sequence-based reagent | Reverse Primer Index: CGAACAGC | IDT | CAAGCAGAAGACGGCATACGAGAT CGAACAGC GTGACTGGAGTTCAGACGTGTGCTCTTCCGATCT GATA ggactaccagggtatctaatcctgt | |
| Sequence-based reagent | Reverse Primer Index: TCGGAAGG | IDT | CAAGCAGAAGACGGCATACGAGAT TCGGAAGG GTGACTGGAGTTCAGACGTGTGCTCTTCCGATCT ACTCA ggactaccagggtatctaatcctgt | |
| Sequence-based reagent | Reverse Primer Index: TTCTGTCG | IDT | CAAGCAGAAGACGGCATACGAGAT TTCTGTCG GTGACTGGAGTTCAGACGTGTGCTCTTCCGATCT TTCTCT ggactaccagggtatctaatcctgt | |
| Sequence-based reagent | Reverse Primer Index: GTACTCAC | IDT | CAAGCAGAAGACGGCATACGAGAT GTACTCAC GTGACTGGAGTTCAGACGTGTGCTCTTCCGATCT CACTTCT ggactaccagggtatctaatcctgt | |
| Sequence-based reagent | Reverse Primer Index: AGTAATAC | IDT | CAAGCAGAAGACGGCATACGAGAT AGTAATAC GTGACTGGAGTTCAGACGTGTGCTCTTCCGATCT ggactaccagggtatctaatcctgt | |
| Sequence-based reagent | Reverse Primer Index: CAAGATAT | IDT | CAAGCAGAAGACGGCATACGAGAT CAAGATAT GTGACTGGAGTTCAGACGTGTGCTCTTCCGATCT A ggactaccagggtatctaatcctgt | |
| Sequence-based reagent | Reverse Primer Index: TGTTTGGT | IDT | CAAGCAGAAGACGGCATACGAGAT TGTTTGGT GTGACTGGAGTTCAGACGTGTGCTCTTCCGATCT TC ggactaccagggtatctaatcctgt | |
| Sequence-based reagent | Reverse Primer Index: CTCCAACC | IDT | CAAGCAGAAGACGGCATACGAGAT CTCCAACC GTGACTGGAGTTCAGACGTGTGCTCTTCCGATCT CTA ggactaccagggtatctaatcctgt | |
| Sequence-based reagent | Reverse Primer Index: AAATTCTG | IDT | CAAGCAGAAGACGGCATACGAGAT AAATTCTG GTGACTGGAGTTCAGACGTGTGCTCTTCCGATCT GATA ggactaccagggtatctaatcctgt | |
| Sequence-based reagent | Reverse Primer Index: CCCGCCAA | IDT | CAAGCAGAAGACGGCATACGAGAT CCCGCCAA GTGACTGGAGTTCAGACGTGTGCTCTTCCGATCT ACTCA ggactaccagggtatctaatcctgt | |
| Sequence-based reagent | Reverse Primer Index: TACAAATA | IDT | CAAGCAGAAGACGGCATACGAGAT TACAAATA GTGACTGGAGTTCAGACGTGTGCTCTTCCGATCT TTCTCT ggactaccagggtatctaatcctgt | |
| Sequence-based reagent | Reverse Primer Index: GGGCTATA | IDT | CAAGCAGAAGACGGCATACGAGAT GGGCTATA GTGACTGGAGTTCAGACGTGTGCTCTTCCGATCT CACTTCT ggactaccagggtatctaatcctgt | |
| Sequence-based reagent | Reverse Primer Index: TTTCGGAC | IDT | CAAGCAGAAGACGGCATACGAGAT TTTCGGAC GTGACTGGAGTTCAGACGTGTGCTCTTCCGATCT ggactaccagggtatctaatcctgt | |
| Sequence-based reagent | Reverse Primer Index: TGCGCGTC | IDT | CAAGCAGAAGACGGCATACGAGAT TGCGCGTC GTGACTGGAGTTCAGACGTGTGCTCTTCCGATCT A ggactaccagggtatctaatcctgt | |
| Sequence-based reagent | Reverse Primer Index: TCCCGCTG | IDT | CAAGCAGAAGACGGCATACGAGAT TCCCGCTG GTGACTGGAGTTCAGACGTGTGCTCTTCCGATCT TC ggactaccagggtatctaatcctgt | |
| Sequence-based reagent | Reverse Primer Index: GTTTCAGG | IDT | CAAGCAGAAGACGGCATACGAGAT GTTTCAGG GTGACTGGAGTTCAGACGTGTGCTCTTCCGATCT CTA ggactaccagggtatctaatcctgt | |
| Sequence-based reagent | Reverse Primer Index: GGAGGGGG | IDT | CAAGCAGAAGACGGCATACGAGAT GGAGGGGG GTGACTGGAGTTCAGACGTGTGCTCTTCCGATCT GATA ggactaccagggtatctaatcctgt | |
| Sequence-based reagent | Reverse Primer Index: GCTGTTAG | IDT | CAAGCAGAAGACGGCATACGAGAT GCTGTTAG GTGACTGGAGTTCAGACGTGTGCTCTTCCGATCT ACTCA ggactaccagggtatctaatcctgt | |
| Sequence-based reagent | Reverse Primer Index: GAGTGTGA | IDT | CAAGCAGAAGACGGCATACGAGAT GAGTGTGA GTGACTGGAGTTCAGACGTGTGCTCTTCCGATCT TTCTCT ggactaccagggtatctaatcctgt | |
| Sequence-based reagent | Reverse Primer Index: CGTCCCCG | IDT | CAAGCAGAAGACGGCATACGAGAT CGTCCCCG GTGACTGGAGTTCAGACGTGTGCTCTTCCGATCT CACTTCT ggactaccagggtatctaatcctgt | |
| Sequence-based reagent | Reverse Primer Index: CCTCATCA | IDT | CAAGCAGAAGACGGCATACGAGAT CCTCATCA GTGACTGGAGTTCAGACGTGTGCTCTTCCGATCT ggactaccagggtatctaatcctgt | |
| Sequence-based reagent | Reverse Primer Index: CCACGACA | IDT | CAAGCAGAAGACGGCATACGAGAT CCACGACA GTGACTGGAGTTCAGACGTGTGCTCTTCCGATCT A ggactaccagggtatctaatcctgt | |
| Sequence-based reagent | Reverse Primer Index: CATTGGCT | IDT | CAAGCAGAAGACGGCATACGAGAT CATTGGCT GTGACTGGAGTTCAGACGTGTGCTCTTCCGATCT TC ggactaccagggtatctaatcctgt | |
| Sequence-based reagent | Reverse Primer Index: AGGGGCCC | IDT | CAAGCAGAAGACGGCATACGAGAT AGGGGCCC GTGACTGGAGTTCAGACGTGTGCTCTTCCGATCT CTA ggactaccagggtatctaatcctgt | |
| Sequence-based reagent | Reverse Primer Index: ACGACACT | IDT | CAAGCAGAAGACGGCATACGAGAT ACGACACT GTGACTGGAGTTCAGACGTGTGCTCTTCCGATCT GATA ggactaccagggtatctaatcctgt | |
| Sequence-based reagent | Reverse Primer Index: ACCGACGC | IDT | CAAGCAGAAGACGGCATACGAGAT ACCGACGC GTGACTGGAGTTCAGACGTGTGCTCTTCCGATCT ACTCA ggactaccagggtatctaatcctgt | |
| Sequence-based reagent | Reverse Primer Index: TATAGTAT | IDT | CAAGCAGAAGACGGCATACGAGAT TATAGTAT GTGACTGGAGTTCAGACGTGTGCTCTTCCGATCT TTCTCT ggactaccagggtatctaatcctgt | |
| Sequence-based reagent | Reverse Primer Index: AACTCAGT | IDT | CAAGCAGAAGACGGCATACGAGAT AACTCAGT GTGACTGGAGTTCAGACGTGTGCTCTTCCGATCT CACTTCT ggactaccagggtatctaatcctgt |
Additional files
-
Transparent reporting form
- https://cdn.elifesciences.org/articles/73870/elife-73870-transrepform1-v1.docx
-
Supplementary file 1
Modeling information.
Contains two tables. Table S1 summarizes the training/test data and hyperparameters for training each LSTM model. Table S2 contains parameters used for all statistical tests presented in this work.
- https://cdn.elifesciences.org/articles/73870/elife-73870-supp1-v1.xlsx
Download links
A two-part list of links to download the article, or parts of the article, in various formats.
Downloads (link to download the article as PDF)
Open citations (links to open the citations from this article in various online reference manager services)
Cite this article (links to download the citations from this article in formats compatible with various reference manager tools)
Recurrent neural networks enable design of multifunctional synthetic human gut microbiome dynamics
eLife 11:e73870.
https://doi.org/10.7554/eLife.73870


